ohio stem equity pipeline project presentation perkins...
TRANSCRIPT
6/14/2010
1
Dr. Ben Williams,Columbus State Community
CollegeProject Lead
Ohio STEM Equity Pipeline Project
How to improve nontraditional
participation and completion – The Ohio STEM Equity
Pipeline Project
Spring 2010
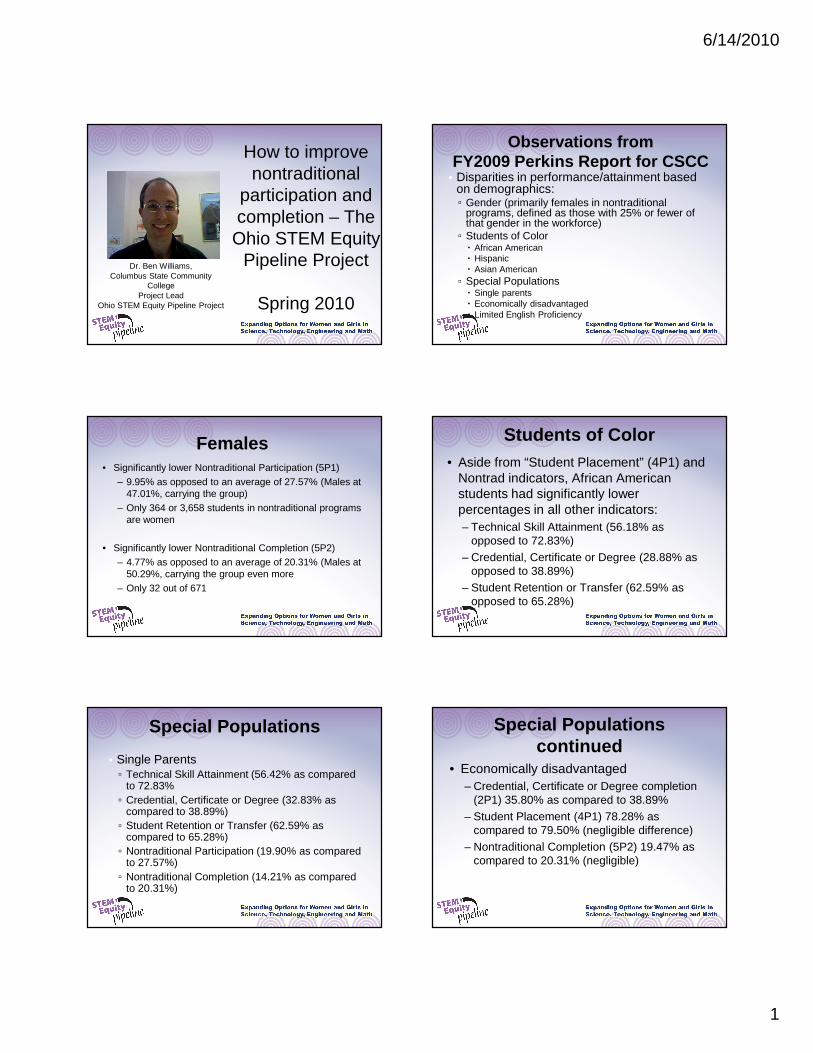
Observations from FY2009 Perkins Report for CSCC• Disparities in performance/attainment based
on demographics:▫ Gender (primarily females in nontraditional
programs, defined as those with 25% or fewer of that gender in the workforce)▫ Students of Color
� African American� Hispanic� Asian American▫ Special Populations
� Single parents� Economically disadvantaged� Limited English Proficiency
Females• Significantly lower Nontraditional Participation (5P1)
– 9.95% as opposed to an average of 27.57% (Males at 47.01%, carrying the group)
– Only 364 or 3,658 students in nontraditional programs are women
• Significantly lower Nontraditional Completion (5P2)– 4.77% as opposed to an average of 20.31% (Males at
50.29%, carrying the group even more– Only 32 out of 671
Students of Color• Aside from “Student Placement” (4P1) and
Nontrad indicators, African American students had significantly lower percentages in all other indicators:– Technical Skill Attainment (56.18% as
opposed to 72.83%)– Credential, Certificate or Degree (28.88% as
opposed to 38.89%)– Student Retention or Transfer (62.59% as
opposed to 65.28%)
Special Populations
• Single Parents▫ Technical Skill Attainment (56.42% as compared
to 72.83%▫ Credential, Certificate or Degree (32.83% as
compared to 38.89%)▫ Student Retention or Transfer (62.59% as
compared to 65.28%)▫ Nontraditional Participation (19.90% as compared
to 27.57%)▫ Nontraditional Completion (14.21% as compared
to 20.31%)
Special Populations continued
• Economically disadvantaged– Credential, Certificate or Degree completion
(2P1) 35.80% as compared to 38.89%– Student Placement (4P1) 78.28% as
compared to 79.50% (negligible difference)– Nontraditional Completion (5P2) 19.47% as
compared to 20.31% (negligible)
6/14/2010
2
Special Populations continued
• Limited English Proficiency– Credential, Certificate or Degree Completion
(2P1) 34.07% as compared to 38.89%– Student Placement (4P1) 61.29% as
compared to 79.50%– Note: Total denominator only 31 students
Concerns and Goals for Columbus State
• Better understand what is causing this disparity between women and men in nontraditional programs
• Increase access to “high wage, high demand and high tech” careers for underrepresented groups
Ohio STEM Equity Pipeline Project• National Science Foundation (NSF) grant-funded project through
The National Alliance for Partnerships in Equity (NAPE)
• Purpose:▫ Increase access, participation, degree completion, and job placement for
women in STEM fields▫ Particular emphasis on affecting Perkins Nontraditional measures for
secondary and postsecondary students (of particular interest to Columbus State and the state)
• Begun Autumn 2009
• Ohio Team participated in recent NAPE Professional Development Institute and National Conference in Washington, D.C.
STEM Equity Pipeline Goals
• Build the capacity of the formal education community
• Institutionalize the implemented strategies by connecting the outcomes to existing accountability systems
• Broaden the commitment to gender equity in STEM education
Model State Teams
• 5 states in year one–California–Missouri–Illinois–Oklahoma–Wisconsin
6/14/2010
3
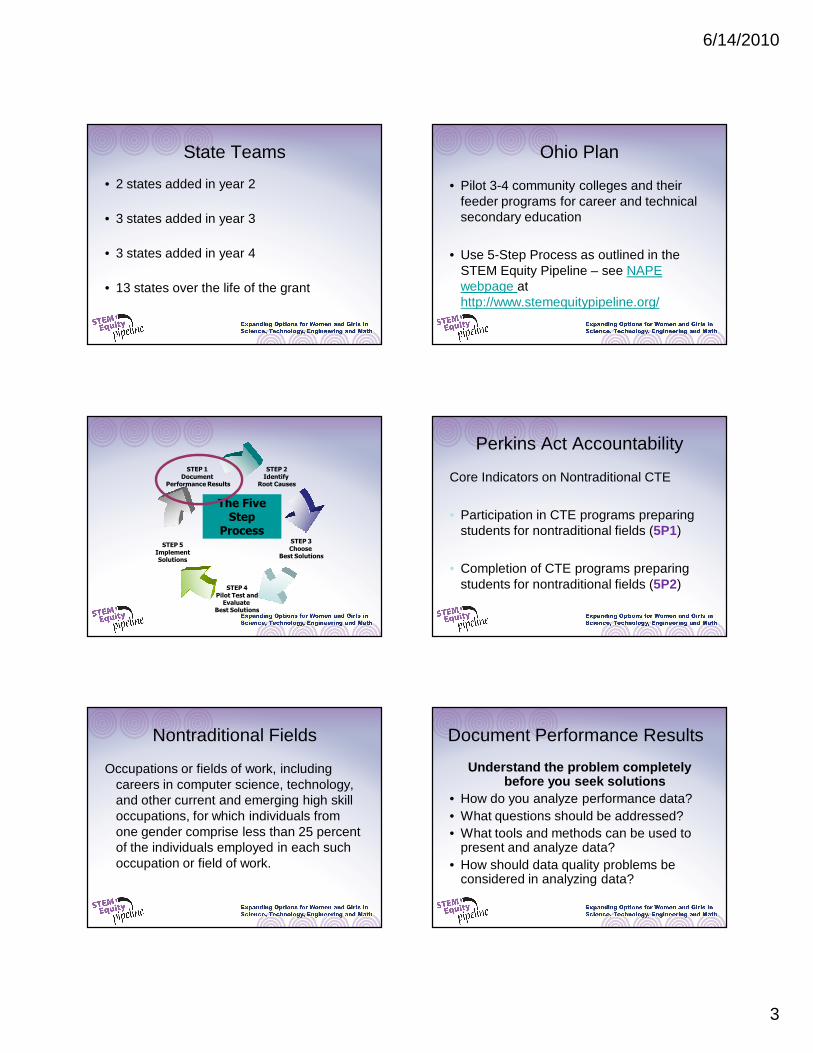
State Teams
• 2 states added in year 2
• 3 states added in year 3
• 3 states added in year 4
• 13 states over the life of the grant
Ohio Plan
• Pilot 3-4 community colleges and their feeder programs for career and technical secondary education
• Use 5-Step Process as outlined in the STEM Equity Pipeline – see NAPE webpage at http://www.stemequitypipeline.org/
STEP 1Document
Performance Results
STEP 5ImplementSolutions
STEP 4Pilot Test andEvaluate
Best Solutions
STEP 3Choose
Best Solutions
STEP 2Identify
Root Causes
The Five Step
Process
Perkins Act Accountability
Core Indicators on Nontraditional CTE
• Participation in CTE programs preparing students for nontraditional fields (5P1)
• Completion of CTE programs preparing students for nontraditional fields (5P2)
Nontraditional Fields
Occupations or fields of work, including careers in computer science, technology, and other current and emerging high skill occupations, for which individuals from one gender comprise less than 25 percent of the individuals employed in each such occupation or field of work.
Document Performance Results
Understand the problem completely before you seek solutions
• How do you analyze performance data?• What questions should be addressed?• What tools and methods can be used to
present and analyze data?• How should data quality problems be
considered in analyzing data?
6/14/2010
4
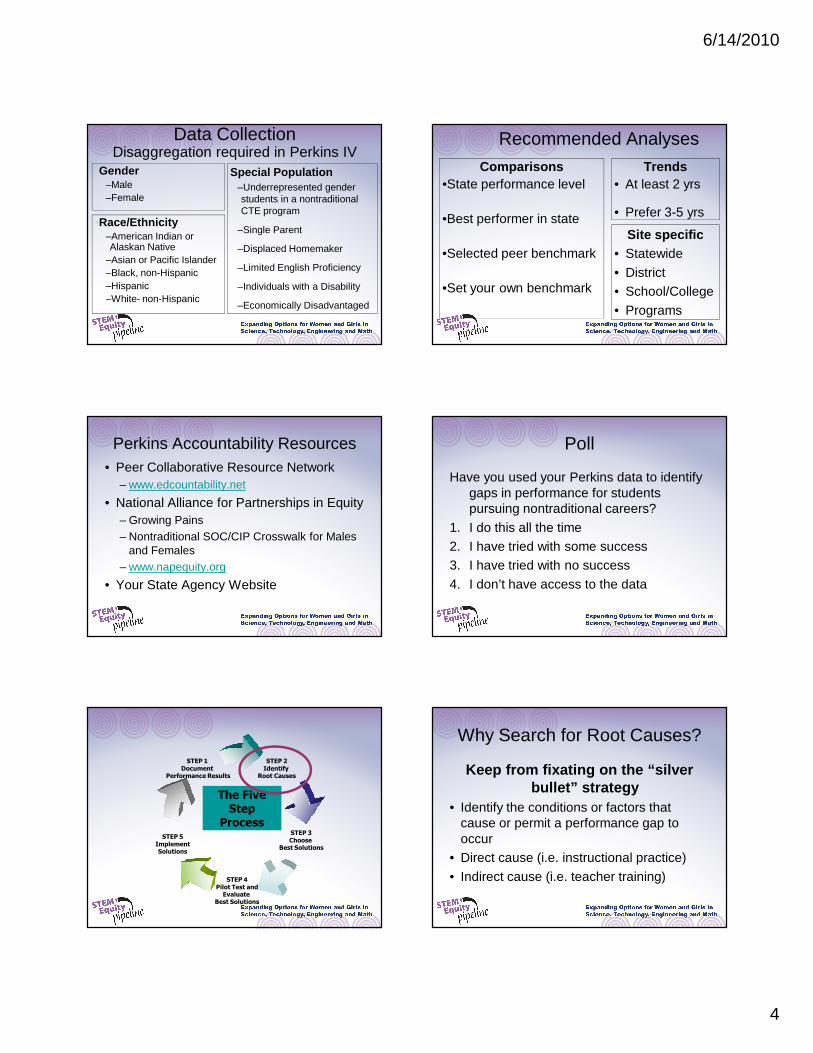
Data CollectionDisaggregation required in Perkins IV
•Gender–Male–Female
Special Population–Underrepresented gender students in a nontraditional CTE program
–Single Parent
–Displaced Homemaker
–Limited English Proficiency
–Individuals with a Disability
–Economically Disadvantaged
•Race/Ethnicity–American Indian or Alaskan Native
–Asian or Pacific Islander–Black, non-Hispanic–Hispanic–White- non-Hispanic
Recommended Analyses
Comparisons•State performance level
•Best performer in state
•Selected peer benchmark
•Set your own benchmark
Trends• At least 2 yrs
• Prefer 3-5 yrs
Site specific• Statewide
• District• School/College
• Programs
Perkins Accountability Resources• Peer Collaborative Resource Network
– www.edcountability.net
• National Alliance for Partnerships in Equity– Growing Pains– Nontraditional SOC/CIP Crosswalk for Males
and Females– www.napequity.org
• Your State Agency Website
Poll
Have you used your Perkins data to identify gaps in performance for students pursuing nontraditional careers?
1. I do this all the time2. I have tried with some success3. I have tried with no success
4. I don’t have access to the data
STEP 1Document
Performance Results
STEP 5ImplementSolutions
STEP 4Pilot Test andEvaluate
Best Solutions
STEP 3Choose
Best Solutions
STEP 2Identify
Root Causes
The Five Step
Process
Why Search for Root Causes?
Keep from fixating on the “silver bullet” strategy
• Identify the conditions or factors that cause or permit a performance gap to occur
• Direct cause (i.e. instructional practice)
• Indirect cause (i.e. teacher training)
6/14/2010
5
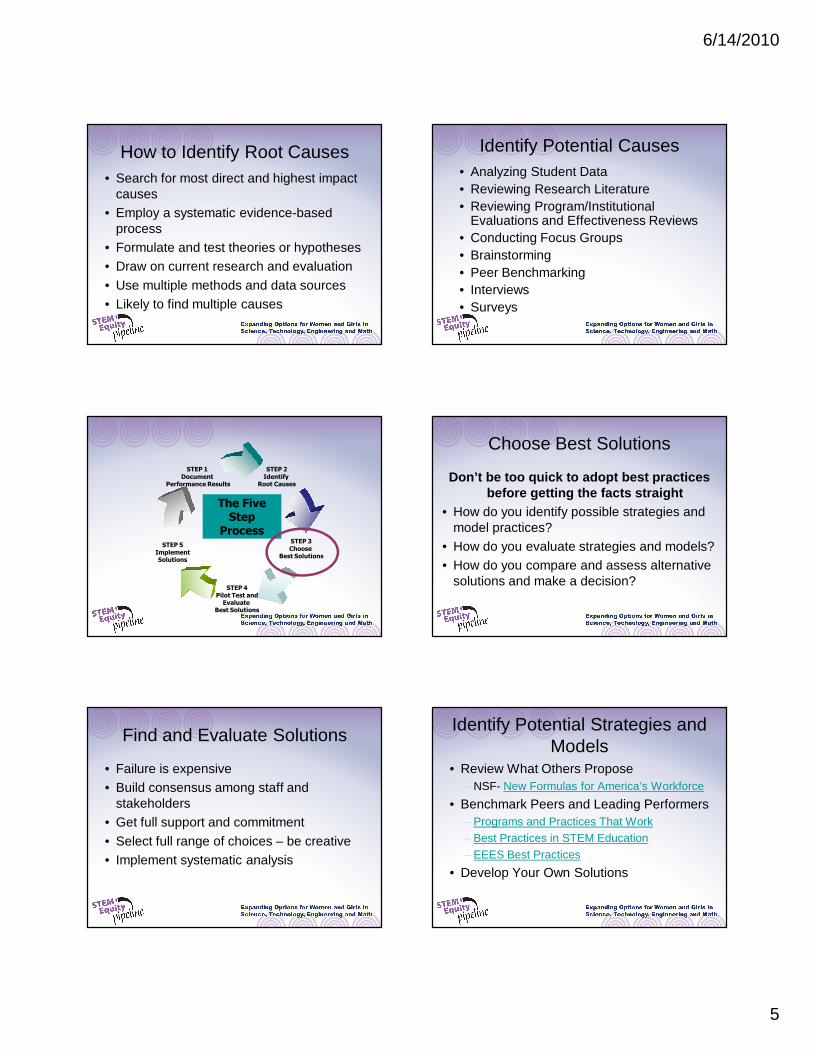
How to Identify Root Causes• Search for most direct and highest impact
causes• Employ a systematic evidence-based
process• Formulate and test theories or hypotheses• Draw on current research and evaluation
• Use multiple methods and data sources• Likely to find multiple causes
Identify Potential Causes• Analyzing Student Data • Reviewing Research Literature• Reviewing Program/Institutional
Evaluations and Effectiveness Reviews• Conducting Focus Groups• Brainstorming• Peer Benchmarking• Interviews• Surveys
STEP 1Document
Performance Results
STEP 5ImplementSolutions
STEP 4Pilot Test andEvaluate
Best Solutions
STEP 3Choose
Best Solutions
STEP 2Identify
Root Causes
The Five Step
Process
Choose Best Solutions
Don’t be too quick to adopt best practices before getting the facts straight
• How do you identify possible strategies and model practices?
• How do you evaluate strategies and models?• How do you compare and assess alternative
solutions and make a decision?
Find and Evaluate Solutions
• Failure is expensive• Build consensus among staff and
stakeholders• Get full support and commitment
• Select full range of choices – be creative• Implement systematic analysis
Identify Potential Strategies and Models
• Review What Others Propose– NSF- New Formulas for America’s Workforce
• Benchmark Peers and Leading Performers– Programs and Practices That Work– Best Practices in STEM Education– EEES Best Practices
• Develop Your Own Solutions
6/14/2010
6
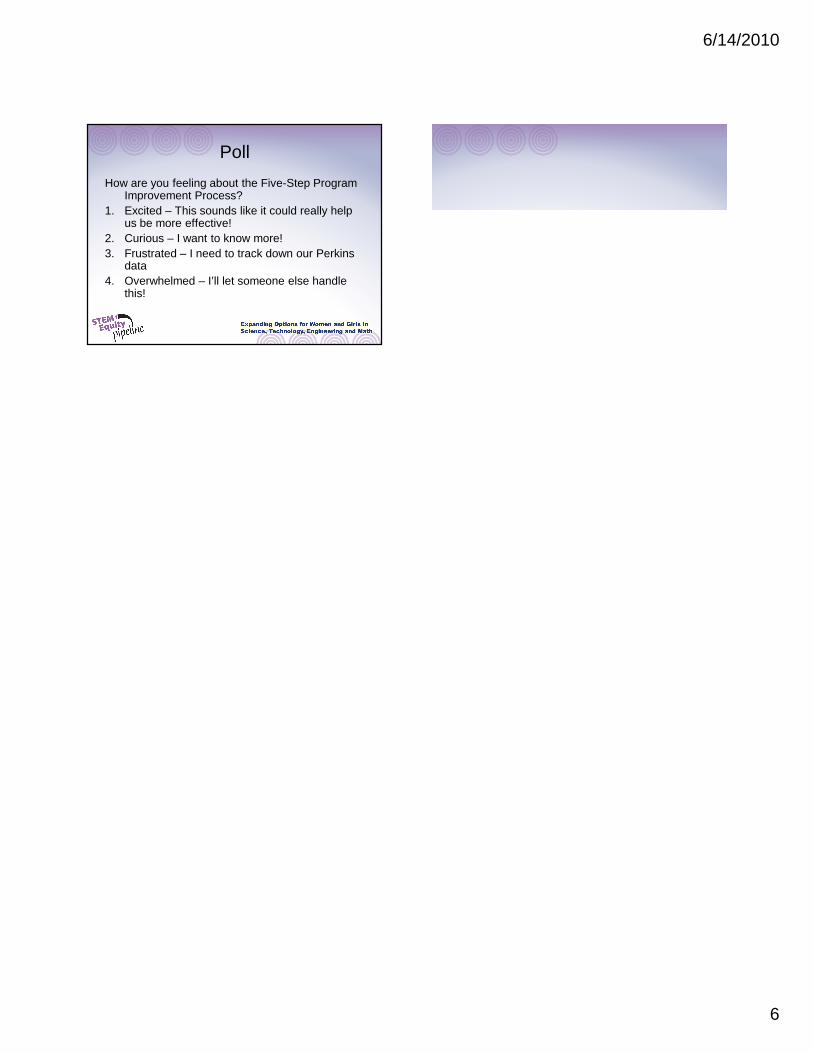
Poll
How are you feeling about the Five-Step Program Improvement Process?
1. Excited – This sounds like it could really help us be more effective!
2. Curious – I want to know more!3. Frustrated – I need to track down our Perkins
data4. Overwhelmed – I’ll let someone else handle
this!

ERROR: ioerrorOFFENDING COMMAND: image
STACK: