offering memorandum - loopnet...spending, and consumption trends appear positive in the near term....
TRANSCRIPT

142-27 BARCLAY AVENUEFlushing, New York 11355
Offering Memorandum

516-231-1030
142 -27 Barclay Ave., Flushing, NY
50 Residential Apartments
Vanderbilt Realty
Price $16.5 million Total Rental Income $ =1,003,487
2

N O N - E N D O R S E M E N T A N D D I S C L A I M E R N O T I C E
Confidentiality and DisclaimerThe information contained in the following Marketing Brochure is proprietary and strictly confidential. It is intended to be reviewed only by the party receiving it from Vanderbilt Realty and should not be made available to any other person or entity without the written consent of Vanderbilt Realty. This Marketing Brochure has been prepared to provide summary, unverified information to prospective purchasers, and to establish only a preliminary level of interest in the subject property. The information contained herein is not a substitute for a thorough due diligence investigation. Vanderbilt Realty has not made any investigation, and makes no warranty or representation, with respect to the income or expenses for the subject property, the future projected financial performance of the property, the size and square footage of the property and improvements, the presence or absence of contaminating substances, PCB's or asbestos, the compliance with State and Federal regulations, the physical condition of the improvements thereon, or the financial condition or business prospects of any tenant, or any tenant's plans or intentions to continue its occupancy of the subject property. The information contained in this Marketing Brochure has been obtained from sources we believe to be reliable; however, Vanderbilt Realty has not verified, and will not verify, any of the information contained herein, nor has Vanderbilt Realty conducted any investigation regarding these matters and makes no warranty or representation whatsoever regarding the accuracy or completeness of the information provided. All potential buyers must take appropriate measures to verify all of the information set forth herein. Vanderbilt Realty is a service mark of Vanderbilt Realty Real Estate Investment Services, Inc. © 2017 Vanderbilt Realty. All rights reserved.
Non-Endorsement NoticeVanderbilt Realty is not affiliated with, sponsored by, or endorsed by any commercial tenant or lessee identified in this marketing package. The presence of any corporation's logo or name is not intended to indicate or imply affiliation with, or sponsorship or endorsement by, said corporation of Vanderbilt Realty, its affiliates or subsidiaries, or any agent, product, service, or commercial listing of Vanderbilt Realty, and is solely included for the purpose of providing tenant lessee information about this listing to prospective customers.
ALL PROPERTY SHOWINGS ARE BY APPOINTMENT ONLY.PLEASE CONSULT YOUR Vanderbilt Realty AGENT FOR MORE DETAILS.
142-27 BARCLAY AVENUEQueens, NY

TABLE OF CONTENTS
INVESTMENT OVERVIEW Offering Summary
Regional Map
Local Map
FINANCIAL ANALYSIS Rent Roll Summary
Rent Roll Detail
Operating Statement
Notes
Pricing Detail
MARKET COMPARABLES
Sales Comparables
Rent Comparables
MARKET OVERVIEW Market Analysis
Demographic Analysis
142-27 BARCLAY AVENUE
3

142-27 BARCLAY AVENUE OFFERING SUMMARY
OFFERING SUMMARY
MAJOR EMPLOYERS
1 Miles 3 Miles
129,434 713,472
123,068 681,850
45,839 251,235
43,173 237,704
$42,016 $53,882
$21,368 $26,272 $26,85
$59,864 $74,200
UNIT MIX
UNIT TYPE APPROX.SQUARE FEET
Apartment 606
Total 30,300
VITAL DATA
$16,000,000 CURRENT YEAR 1
50% / $8,000,000 CAP Rate 3.00% 3.65%
$8,000,000 GRM 19.16 16.90
Proposed New Net Operating Income $480,598 $584,728
3.97% / 30 Years Net Cash Flow After Debt Service 0.30% / $23,938 1.60% / $128,068
$320,000 Total Return 2.07% / $165,556 3.44% / $275,412
$528.05
50
30,300
1962
0.21 Acre(s)
4

142-27 BARCLAY AVENUE
OFFERING SUMMARY
PROPERTY OVERVIEW
Vanderbilt Realty is pleased to exclusively represent the property located at 142-27 Barclay Avenue, Flushing, New York. The subject property is a six-story elevator apartment building constructed in 1962 and contains a total of 50 units of which 28 are free market, 7 RS PREFERENTIAL units and 15 are rent stabilized. There are 26 studios, 12 very large studios (convertible to one bedrooms) and 12 two-bedroom apartments. The property is situated on a 75 by 122-foot parcel of 9,150 square feet. The property lies in an R7-1 zone (3.44 FAR), and contains 40,991 gross square feet, and is overbuilt. There is a 15-car garage and a laundry room for the tenants.
The property is a half-mile from the Main Street Flushing #7 train subway station. The #7 train runs from the Main Street stop to the recently extended #7 train line which now terminates at the 34th Street Hudson Yards stop. The #7 express train during rush hour is a 25-minute ride to Grand Central station. The Long Island Railroad Main Street station also services Flushing which runs on the Port Washington branch, with service to Penn Station in approximately 20 minutes. The station is part of the L.I.R.R.'s CityTicket, and is in Zone 3. In addition, there are major bus routes (Q44, Q20A, Q20B) along Main Street, Roosevelt Avenue and Kissena Boulevard. Many other buses travel through or terminate in this area of Queens as well. The property is a seven-minute walk to both the Metropolitan Transportation Authority (MTA) and Long Island Rail Road (LIRR) Main Street stations.
Flushing is the fourth most populated community in The City of New York and is home to a diverse ethnic population. Additionally, it is home to many sports and cultural facilities including: Citifield, Queens Botanical Gardens, The Queens Museum, Flushing Meadow Corona Park (Home to the United States Tennis Open) as well as Flushing Town Hall (a stately 1862 Romanesque Revival building), and the Queens Historical Society. Downtown Flushing is also a destination point for its diverse shopping and dining experience.
5
PROPERTY OVERVIEW
§ Six-Story Elevator Apartments Building Containing 50Units
§ Parking Garage
§ Has 24-Free-Market and 26-Rent-Stabilized Units
§ Central Location to Public Transportation
§ Possibility to Convert to Condominium

REGIONAL MAP
142-27 BARCLAY AVENUE
6

LOCAL MAP
142-27 BARCLAY AVENUE
7

8
Tax Map
9
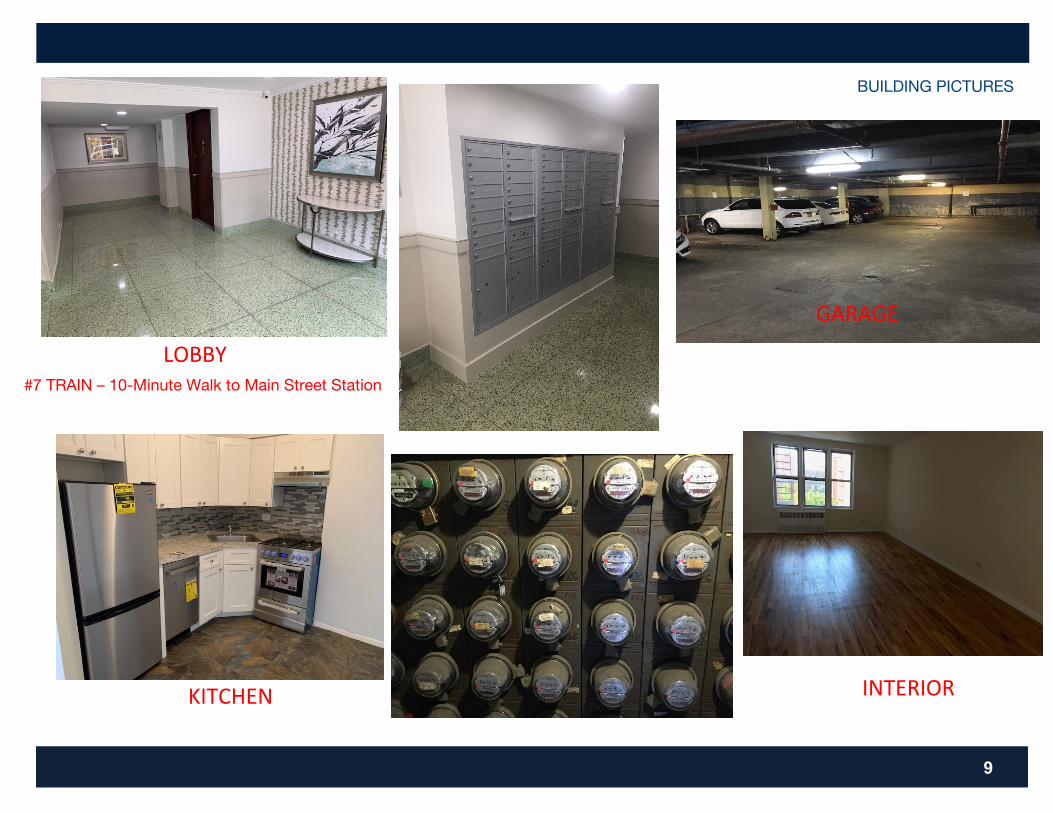
#7 TRAIN – 10-Minute Walk to Main Street Station
BUILDING PICTURES
LOBBY
GARAGE
KITCHEN INTERIOR

AERIAL PHOTO142-27 BARCLAY AVENUE
10

FINANCIAL ANALYSIS142-27 BARCLAY AVENUE
11
RENT ROLL DETAIL

FINANCIAL ANALYSIS142-27 BARCLAY AVENUE
12
RENT ROLL DETAILCon't

FINANCIAL ANALYSIS142-27 BARCLAY AVENUE
OPERATING STATEMENT
13

MARKET OVERVIEW
The borough has a well-developed transportation infrastructure and access to many East River crossings.
DIVERSE LOCAL ECONOMYMore than 68,000 businesses operate in Queens, representing a variety of industries and securing a stable economy.
STRONG HEALTHCARE INDUSTRY PRESENCEHealthcare and social assistance occupations account for a significant percentage of employment in Queens.
QUEENS
Queens is one of New York City’s five boroughs. The Bronx is located to the Northwest, Manhattan is to the west, Brooklyn is to the southwest and Nassau County is to the east. Queens is divided into 68 diverse neighborhoods in 14 community districts. More than 15,400 residents are projected to move to the market through 2021, resulting in the addition of 9,000 households.
ECONOMY
METRO HIGHLIGHTS
TRANSPORTATION NETWORK
* Forecast Sources: BLS; Bureau of Economic Analysis; Experian; Fortune; Moody’s Analytics; U.S. Census Bureau
142-27 BARCLAY AVENUE
14
§ Retail sales in Queens routinely outperform the U.S. on average, making a major contribution to New York City’s economy.
§ Once a haven for manufacturers, the economy is now more service oriented. The education and health services and the trade, transportation and utilities sectors are the largest employment sectors, supported by extensive transportation infrastructure.
§ The La Guardia and JFK airports are important economic drivers, contributing billions of dollars to the economy each year.
MARKET OVERVIEW
15
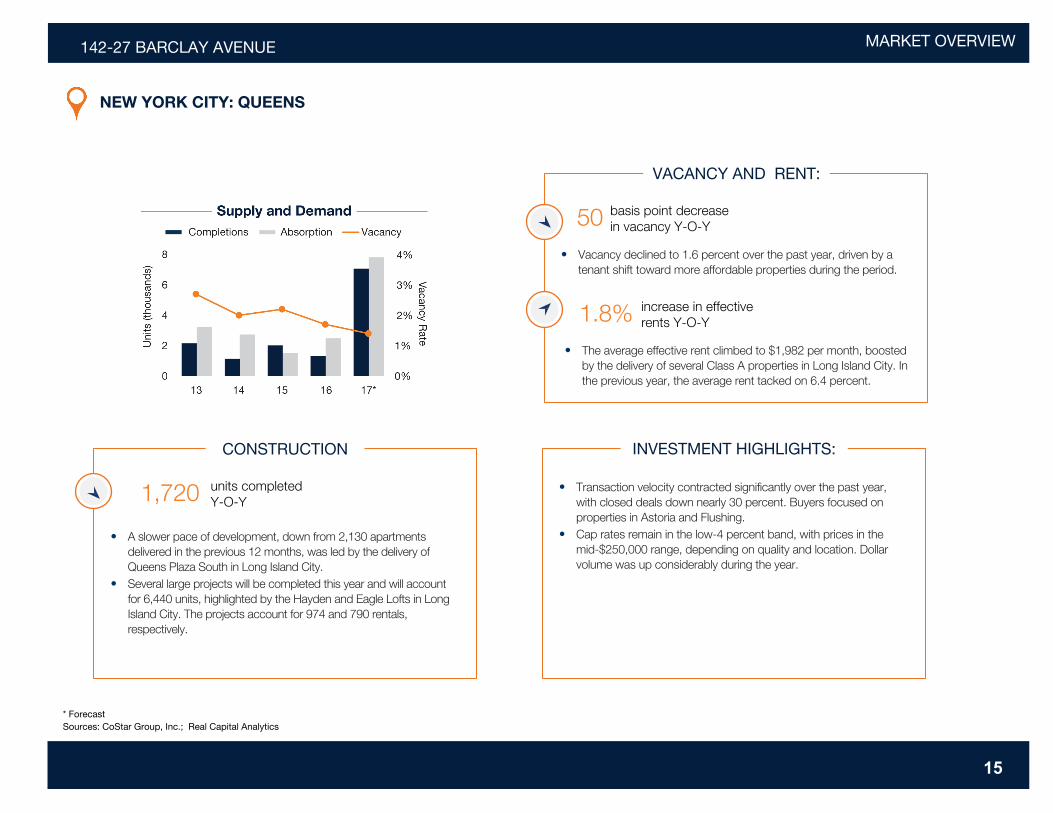
• A slower pace of development, down from 2,130 apartmentsdelivered in the previous 12 months, was led by the delivery ofQueens Plaza South in Long Island City.
• Several large projects will be completed this year and will accountfor 6,440 units, highlighted by the Hayden and Eagle Lofts in LongIsland City. The projects account for 974 and 790 rentals,respectively.
CONSTRUCTION
• Transaction velocity contracted significantly over the past year,with closed deals down nearly 30 percent. Buyers focused onproperties in Astoria and Flushing.
• Cap rates remain in the low-4 percent band, with prices in themid-$250,000 range, depending on quality and location. Dollarvolume was up considerably during the year.
INVESTMENT HIGHLIGHTS:
NEW YORK CITY: QUEENS
units completed Y-O-Y1,720
• Vacancy declined to 1.6 percent over the past year, driven by atenant shift toward more affordable properties during the period.
VACANCY AND RENT:
basis point decrease in vacancy Y-O-Y50
• The average effective rent climbed to $1,982 per month, boostedby the delivery of several Class A properties in Long Island City. Inthe previous year, the average rent tacked on 6.4 percent.
increase in effective rents Y-O-Y1.8%
* ForecastSources: CoStar Group, Inc.; Real Capital Analytics
142-27 BARCLAY AVENUE

MARKET OVERVIEW142-27 BARCLAY AVENUE
16
NATIONAL ECONOMY
Prospects for Economic Growth Positive, But Election Implications Still Evolving
U.S. economy carries momentum into 2019. After modest GDP growth in the first half of 2018, the pace of
expansion picked up strength as the labor market and growing consumer confidence helped close the year
on a strong note. Economic performance in 2019 could benefit from the carryover of last year’s momentum.
However, the uncertainty regarding fiscal, trade and other policy goals not yet clearly stated by the incoming
administration could generate a drag on growth in the first months of the Trump term. Against this backdrop,
the economy should still create sufficient jobs to absorb new labor force entrants, but growth in U.S.
payrolls during 2017 will moderate due to the tightness of the labor market and retirements of older workers.
Amid rising wages and low household debt levels, consumers traditionally feel confident to increase their
spending, and consumption trends appear positive in the near term. While existing single-family home sales
grew modestly due to tight inventory, new-home construction and sales are rising to relieve some pent-up
demand for housing. Household formation and housing completions are on course to align this year,
indicating an imminent end to the housing shortage that has persisted throughout this economic cycle.
Faster pace of growth and less gridlock anticipated, but details of administration’s plans still forming.
As currently understood, the Trump administration’s economic policies will focus on fiscal stimulus, lower
taxes and reduced regulation as a means to jump-start the pace of domestic economic growth. With
Republican control of Congress and the White House, a range of issues including the passage of the budget
and raising of the debt limit could occur more quickly and efficiently. The new administration’s expressed
intent to improve infrastructure and increase spending on defense could lift economic growth in 2019,
especially if legislation is enacted quickly. The ability of the new administration and Congress to work
together to put forth an agenda aimed at escalating economic growth was a matter of speculation at the end
of 2016. The relationship could take some time to sort out, potentially delaying the execution of the agenda.
Promises of infrastructure spending could find some bipartisan agreement in the coming year, but financing
an initiative also comes with longer-term risks. A rise in federal spending that requires new borrowing could
increase the budget deficit, pushing long-term interest rates higher and raise inflationary pressure. In
anticipation of higher long-term rates and a more robust pace of economic growth.* Forecast** Through October

MARKET OVERVIEW142-27 BARCLAY AVENUE
17
NATIONAL ECONOMY
2019 National Economic Outlook
• Job growth remains steady in tight labor market. The economy added approximately 2.2 million jobs
in 2018, but with unemployment below 5 percent, the tight labor market will moderate to 2.0 million new
hires this year. Expanding payrolls will be broad-based, but rising home construction plus the possibility
of increased defense spending could result in meaningful construction and manufacturing sector gains.
• Wealth effect provides new fuel for consumption. As a tight labor market drives up wages, consumer
spending should accelerate further, pushing economic growth. Increased consumer spending combined
with the possible implementation of fiscal policies should generate GDP growth in the 2.5 percent range
in 2019.
• Rise in federal spending could crimp growth. Rising interest rates and a strong U.S. dollar can signal
positive economic growth. Yet, they can also negatively impact the expansion by cutting exports due to
the higher cost of American products and deferring investment due to higher financing costs. Overall
economic health in 2019 looks solid, but potential downside effects exist.
* Forecast
Through October

MARKET OVERVIEW142-27 BARCLAY AVENUE
18
NATIONAL APARTMENT OVERVIEW
Maturing Economic Cycle Still Favors Apartment Sector Performance
Tenant demand remains strong. The expansion of the U.S. economy for a seventh consecutive year
sustained a high level of asset performance that reinforced the confidence of property owners and investors.
Among key demographic and economic drivers, job creation and household formation during the year
translated again into noteworthy net absorption. In 2018, projected job creation and rental household
formation will support demand, while demographic trends also provide a meaningful tailwind for maintaining
low vacancy and a steady pace of rent increases. The entrance of millennials into the workforce, in
particular, remains a potent force in the multifamily sector as these individuals have a high propensity to rent.
Nationally, the homeownership rate descended to a 51-year low of 62.9 percent last year and is projected to
remain in the low-60 percent band in 2018. The low rate is not altogether surprising given the social
narrative of mobility, flexibility and burdensome student debt following the financial crisis. Millennials’
tendency toward later marriage and family formation should translate into sustained new demand for rentals
and extended tenures in apartments.
Peak in construction expected in 2019. Rentals slated for completion this year were authorized some time
ago, but a recent leveling off in permit issuance signals that the wave of development will likely crest this
year. Construction lenders are also exercising discretion, critically assessing the experience of development
teams, closely scrutinizing return projections and factoring in expectations of more subdued NOI growth. In
addition to conservative lending, proposals of increased government infrastructure spending could elevate
competition for construction materials and labor needed for multifamily development. The likely crest of
apartment construction this year coincides with easing rent growth trends. Most of the softening will occur
in the recently delivered upper-tier assets. Completions of luxury rentals will exert more pressure on the
Class A vacancy rate in 2018, while the outperformance of Class B and Class C assets will encourage a
further reconsideration of investment strategies. Some newer assets will benefit from strategic locations in
niche neighborhoods while others will face stiff competition from a wave of development. That said, most
markets facing significant apartment additions also have a somewhat captive renter pool as home prices are
elevated as well. * Forecast** Through 3Q

MARKET OVERVIEW142-27 BARCLAY AVENUE
19
CAPITAL MARKETS
Options for Multifamily Borrowers Remain Broad,But Rising Interest Rate Trend a Key Question
Borrowers seeking certainty as Fed, new administration weigh actions. Lending capacity for multifamily
acquisitions and refinancing remains healthy, but several trends that will affect capital markets this year are
gaining traction. The rise in the yield on the 10-year U.S. Treasury following the election prompted many
borrowers to pause in order to determine where long-term rates would stabilize. Though cap rates could
begin to rise in 2019 if the climb in the 10-year accelerates, the sound economy and global capital flows into
U.S. government debt might also mitigate some of the increase and provide greater certainty. A contained
rise in cap rates could also provide an opening for investors shut out by the significant yield compression of
the past several years and provide new lending opportunities. Prior to the rise in the 10-year, construction
lenders were taking a more cautious stance in financing projects. A more conservative approach by lenders
is likely to be a positive force this year, restraining the development pipeline at a point in the cycle where
overbuilding risks often intensify.
The role of CMBS in 2018 to be defined. Volume was down in 2016, partly as a result of greater risk
aversion early in the year. The first CMBS offerings written under the new Dodd-Frank risk-retention rules
were issued last summer and comprised a relatively low risk pool of loans issued at low LTVs. The offerings
were well received and provide a potential blueprint for future deals. CMBS rates rose after the election, and
issuance may lag in the first quarter of 2018 until lenders and bond investors gain greater clarity on rates
and risk-retention requirements. These requirements will likely survive some regulatory reform within
Dodd-Frank, but other capital sources will take precedence over CMBS.
* Trailing 12 months through 3Q** Through 3Q

MARKET OVERVIEW142-27 BARCLAY AVENUE
20
CAPITAL MARKETS
2019 Capital Markets Outlook
• Monetary policy actions set to accelerate. The 10-year U.S. Treasury rate held below 2 percent until
a surge following the election raised the rate above that threshold and potentially established a new and
higher range for the benchmark. Moderate economic growth and muted inflation throughout the growth
cycle allowed the Federal Reserve to hold off on rate hikes, which has supported additional cap rate
compression. However, the Trump administration’s fiscal plans built on higher spending and reduced
taxes could accelerate economic growth. Intensifying inflationary pressure under that scenario could
encourage the Federal Reserve to quicken the pace of its efforts to raise its short-term benchmark.
• Inflation on the upswing, but for the right reasons. Though inflationary pressures are beginning to
grow, increases are occurring from a historically low base. Further, inflationary pressure has arisen from
wage growth and stabilization of oil prices, both positives for the overall economy. Higher wages will
encourage spending while inflationary pressure on prices will raise overall consumption, the primary
driver of economic growth.
• Underwriting discipline persists; ample debt capital remains. Multifamily originations increased in
2018, with agency lending dominating the overall marketplace. The government agencies underwrote
about $105 billion in loans last year and remain a primary source of multifamily originations in 2018 due
to their efficient execution. Acquisition debt remained plentiful throughout 2018, but borrowers’ rates
rose late in the year in conjunction with higher Treasury yields, and loan-to-value ratios compressed. The
combination of higher rates and tighter lender underwriting created some investor caution that could
carry over into 2019. A potential easing of Dodd-Frank regulations on financial institutions could create
additional lending capacity for other capital sources.
MARKET OVERVIEW142-27 BARCLAY AVENUE
21
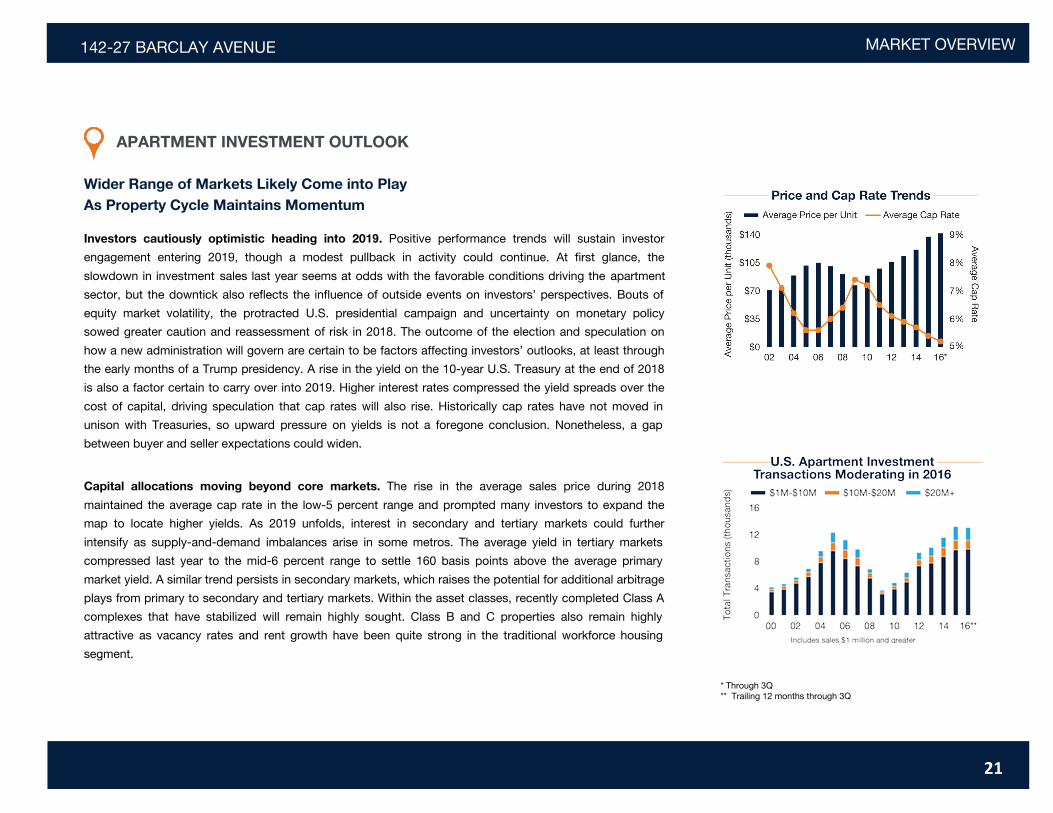
APARTMENT INVESTMENT OUTLOOK
Wider Range of Markets Likely Come into PlayAs Property Cycle Maintains Momentum
Investors cautiously optimistic heading into 2019. Positive performance trends will sustain investor
engagement entering 2019, though a modest pullback in activity could continue. At first glance, the
slowdown in investment sales last year seems at odds with the favorable conditions driving the apartment
sector, but the downtick also reflects the influence of outside events on investors’ perspectives. Bouts of
equity market volatility, the protracted U.S. presidential campaign and uncertainty on monetary policy
sowed greater caution and reassessment of risk in 2018. The outcome of the election and speculation on
how a new administration will govern are certain to be factors affecting investors’ outlooks, at least through
the early months of a Trump presidency. A rise in the yield on the 10-year U.S. Treasury at the end of 2018
is also a factor certain to carry over into 2019. Higher interest rates compressed the yield spreads over the
cost of capital, driving speculation that cap rates will also rise. Historically cap rates have not moved in
unison with Treasuries, so upward pressure on yields is not a foregone conclusion. Nonetheless, a gap
between buyer and seller expectations could widen.
Capital allocations moving beyond core markets. The rise in the average sales price during 2018
maintained the average cap rate in the low-5 percent range and prompted many investors to expand the
map to locate higher yields. As 2019 unfolds, interest in secondary and tertiary markets could further
intensify as supply-and-demand imbalances arise in some metros. The average yield in tertiary markets
compressed last year to the mid-6 percent range to settle 160 basis points above the average primary
market yield. A similar trend persists in secondary markets, which raises the potential for additional arbitrage
plays from primary to secondary and tertiary markets. Within the asset classes, recently completed Class A
complexes that have stabilized will remain highly sought. Class B and C properties also remain highly
attractive as vacancy rates and rent growth have been quite strong in the traditional workforce housing
segment.
* Through 3Q** Trailing 12 months through 3Q

MARKET OVERVIEW142-27 BARCLAY AVENUE
22
APARTMENT INVESTMENT OUTLOOK
2019 Investment Outlook
• The pursuit of yield will intensify. With assets in major metros commanding high valuations and selling
at compressed yields, the opportunity to capture potentially higher yields in secondary and tertiary
markets will likely warrant greater consideration. The cap rate spread between preferred and tertiary
markets stands at roughly 200 basis points, about half the 2012 peak but close to its long-term average
of 240 basis points.
• Investors become more selective. Supply-and-demand imbalances will persist in some metros,
encouraging investors to closely evaluate the project pipeline and assess the effects of new supply on
asset performance. Transaction volume in 2019 should remain healthy but could ease from recent peak
levels as marketing times and due diligence periods extend.
• Foreign capital remains factor in the buyer pool. U.S. commercial real estate remains desirable for
overseas investors despite the strengthening dollar. For many, the stability and potential growth offered
by U.S. assets compared with other countries underpins long-term capital preservation strategies.
* Forecast

PROPERTY NAME MARKETING TEAM142-27 BARCLAY AVENUE DEMOGRAPHICS
Source: © 2016 Experian
POPULATION 1 Miles 3 Miles 5 Miles§ 2021 Projection
Total Population 132,532 723,024 1,631,005
§ 2016 Estimate
Total Population 129,434 713,472 1,618,632
§ 2010 Census
Total Population 123,068 681,850 1,541,569
§ 2000 Census
Total Population 121,632 664,344 1,526,671
§ Daytime Population
2016 Estimate 97,303 524,010 1,238,249
HOUSEHOLDS 1 Miles 3 Miles 5 Miles§ 2021 Projection
Total Households 46,999 254,862 577,516
§ 2016 Estimate
Total Households 45,839 251,235 571,363
Average (Mean) Household Size 2.79 2.81 2.78
§ 2010 Census
Total Households 43,173 237,704 538,320
§ 2000 Census
Total Households 42,816 237,106 539,723
Growth 2015-2020 2.53% 1.44% 1.08%
HOUSING UNITS 1 Miles 3 Miles 5 Miles§ Occupied Units
2021 Projection 46,999 254,862 577,516
2016 Estimate 47,963 257,615 585,866
Owner Occupied 13,857 104,342 235,696
Renter Occupied 31,982 146,893 335,667
Vacant 2,123 6,381 14,503
§ Persons In Units
2016 Estimate Total Occupied Units 45,839 251,235 571,363
1 Person Units 23.67% 26.00% 26.35%
2 Person Units 27.68% 27.00% 27.17%
3 Person Units 20.20% 17.56% 17.53%
4 Person Units 15.11% 14.53% 14.47%
5 Person Units 7.09% 7.36% 7.41%
6+ Person Units 6.25% 7.55% 7.06%
HOUSEHOLDS BY INCOME 1 Miles 3 Miles 5 Miles§ 2016 Estimate
$200,000 or More 2.49% 3.70% 3.91%
$150,000 - $199,000 3.15% 5.37% 5.42%
$100,000 - $149,000 9.93% 13.52% 13.59%
$75,000 - $99,999 9.87% 12.28% 12.45%
$50,000 - $74,999 17.15% 18.24% 18.60%
$35,000 - $49,999 13.87% 13.12% 13.19%
$25,000 - $34,999 11.40% 9.78% 9.73%
$15,000 - $24,999 13.68% 11.34% 10.80%
Under $15,000 18.47% 12.66% 12.30%
Average Household Income $59,864 $74,200 $75,404
Median Household Income $42,016 $53,882 $54,975
Per Capita Income $21,368 $26,272 $26,850
POPULATION PROFILE 1 Miles 3 Miles 5 Miles§ Population By Age
2016 Estimate Total Population 129,434 713,472 1,618,632
Under 20 17.29% 21.83% 21.97%
20 to 34 Years 21.80% 22.84% 23.27%
35 to 39 Years 6.91% 7.33% 7.38%
40 to 49 Years 15.47% 13.80% 14.08%
50 to 64 Years 22.62% 19.69% 19.49%
Age 65+ 15.91% 14.50% 13.82%
Median Age 42.74 38.61 38.20
§ Population 25+ by Education Level
2016 Estimate Population Age 25+ 98,667 509,761 1,150,201
Elementary (0-8) 9.44% 9.48% 8.46%
Some High School (9-11) 11.15% 8.79% 9.08%
High School Graduate (12) 29.33% 26.62% 26.66%
Some College (13-15) 11.06% 13.63% 14.32%
Associate Degree Only 7.69% 7.44% 7.54%
Bachelors Degree Only 18.40% 19.31% 19.83%
Graduate Degree 8.36% 11.17% 11.09%
§ Population by Gender
2016 Estimate Total Population 129,434 713,472 1,618,632
Male Population 47.80% 49.06% 49.20%
Female Population 52.20% 50.94% 50.80%
23

IncomeIn 2016, the median household income for your selected geography is $42,016, compare this to the US average which is currently $54,505. The median household income for your area has changed by 17.20% since 2000. It is estimated that the median household income in your area will be $45,686 five years from now, which represents a change of 8.73% from the current year.
The current year per capita income in your area is $21,368, compare this to the US average, which is $29,962. The current year average household income in your area is $59,864, compare this to the US average which is $78,425.
PopulationIn 2016, the population in your selected geography is 129,434. The population has changed by 6.41% since 2000. It is estimated that the population in your area will be 132,532.00 five years from now, which represents a change of 2.39% from the current year. The current population is 47.80% male and 52.20% female. The median age of the population in your area is 42.74, compare this to the US average which is 37.68. The population density in your area is 41,131.73 people per square mile.
HouseholdsThere are currently 45,839 households in your selected geography. The number of households has changed by 7.06% since 2000. It is estimated that the number of households in your area will be 46,999 five years from now, which represents a change of 2.53% from the current year. The average household size in your area is 2.79 persons.
EmploymentIn 2016, there are 32,256 employees in your selected area, this is also known as the daytime population. The 2000 Census revealed that 57.41% of employees are employed in white-collar occupations in this geography, and 42.82% are employed in blue-collar occupations. In 2016, unemployment in this area is 7.45%. In 2000, the average time traveled to work was 48.00 minutes.
Race and EthnicityThe current year racial makeup of your selected area is as follows: 16.07% White, 3.59% Black, 0.08% Native American and 70.48% Asian/Pacific Islander. Compare these to US averages which are: 70.77% White, 12.80% Black, 0.19% Native American and 5.36% Asian/Pacific Islander. People of Hispanic origin are counted independently of race.
People of Hispanic origin make up 16.31% of the current year population in your selected area. Compare this to the US average of 17.65%.
PROPERTY NAME MARKETING TEAM142-27 BARCLAY AVENUE
HousingThe median housing value in your area was $301,091 in 2016, compare this to the US average of $187,181. In 2000, there were 12,152 owner occupied housing units in your area and there were 30,664 renter occupied housing units in your area. The median rent at the time was $747.
Source: © 2016 Experian
DEMOGRAPHICS
24

142-27 BARCLAY AVENUE DEMOGRAPHICS
25