of tools - the dpsa 17.pdf · 17-2 chapter 17 tools for phase 2: determine requirements 17.1.1 tool...
TRANSCRIPT

SECT
ION
3: T
OOL
KIT
OF TOOLS
ORGANISATION
TRANSITION

CHAPTER
17DESCRIBES TOOLS FOR USE
IN PHASE 2: DETERMINE
REQUIREMENTS
17

17-1
CHAPTER 17
17. TOOLS FOR PHASE 2: DETERMINE REQUIREMENTS
17.1 TOOLS FOR STEP 6: DETERMINING REQUIREMENTS AND CAPABILITIES
Tools Highly recommended Recommended Nice to have
Backward process analysis and engineering (SIPOC) X
Service recipient requirements analysis X
Process-structure alignment requirements X
Business process maps X
Quick structured map X
Process analysis and optimisation X
Dependencies map X
Process-supplier matrix X
External requirements analysis X
Risk analysis X
Service capacity planning X
Organisational capability analysis X
Behaviour enabler identification X
Behaviour/structure analysis framework X
Structure constraints review X
Maturity analysis X
Structure assessment questionnaire X
Chapter 17Tools for phase 2: Determine requirements

17-2
Chapter 17Tools for phase 2: Determine requirements
17.1.1 TOOL 25: BACKWARD PROCESS ANALYSIS
What is it? How to use it
The backward process
analysis tool is based
on the SIPOC acronym
indicating Supplier,
Input, Process, Output,
and Customer.
The analysis process,
however, starts by
identifying the customer
(citizen in your case)
and working backward
towards input
requirements. It is there-
fore more
appropriate to refer to
it as the “Copis” model
rather than “Sipoc”.
Although developed for
the private sector, the
tool is applicable to the
public sector –
customers are citizens
and users of public
services.
The following value-added chain provides an overview of the sequential thinking and
analysis pattern associated with the backward analysis process.
Determinebusinesscustomers
Determinecitizenrequirements
Identify key businessprocesses
Map the keybusinessprocesses
Identifystandards,recources
Determineinputrequirements
Identify the customers (citizens) or reconfirm the customers (this might have been
completed as part of the diagnostic phase).
Determine the key requirements, value propositions or expectations of each customer
or customer grouping/segment in detail (this might also be completed during the
diagnostic phase).
Determine the business processes required to provide the customers/stakeholders with
what they need or expect. Each customer requirement invariably requires the
organisation to be good at executing certain business processes. Refer back to the
value and business drivers, identify the key activities which will enable delivery, and list
them against each requirement. (This may result in the same process being identified
more than once.)
In order to be fully aware of what is required to execute the process, the requirements
for each process have to be identified. Process requirements include skills, knowledge,
standards, norms, equipment and facilities and standard procedures which will enable
the replication of the same process at the same level of performance by anybody
involved in the execution of the process.
Identify the input requirements in detail for each process (raw material, application
form, information, model, etc. which will be transformed into something more valuable,
i.e. the customer requirement).
Identify the suppliers for each input required to execute the process and list them.
When to use it
The review of business processes with the end in mind should be used almost without exception if service and service
orientation are at all important in the structural design.

17-3
Chapter 17Tools for phase 2: Determine requirements
MEASURES
SUPPLIERS INPUTS PROCESS
REQUIREMENTS REQUIREMENTS
OUTPUTS CUSTOMERS
MEASURES
S I P O C
Manage Infrastructure:(General management, accounting, strategic planning)
Manage Human Resources:(Recruiting, Training & Development, Reviewing, Rewarding, Managing Talent)
Manage Technology:(R&D, product and process improvement, implementations, maintenance)
Inbound Logistics
(Receiving, handling &
warehousing, distribution)
Operations
(Developing, assembling, processing,
testing)
Outbound Logistics
(Warehousing & distribution
of product, services)
Marketing & Sales
(Advertising, promotion,
pricing, chanelling)
Service
(Install, Repair, Return)
Manage Procurement:(Purchase material, equipment, supplier, manage vendors)
Manage Facilities:(Cleaning, security, maintenance)
Adapted from Michael E. Porter, Competitive Advantage: Creating and Sustain Superior Performance, 1985
Profit Margin
Example of SIPOC:
Supplier Inputs Process Output/product Customer outcome
Patient.
Investors.
Medical schools.
Money.
Information.
Doctor.
Nursing staff.
Resources.
Surgery.
Meal supply.
Ward service.
Pre-/post-op.
Admission.
Finance.
Three meals a day.
Operation not longer
than planned.
Cost no more than
quoted.
Minimum discomfort.
Healthy and pro-
ductive again.

17-4
Process analysis:
What is it? How to use it
Process analysis describes the activities that take place
in a business and relates them to an analysis of the
competitive strength of the business. Influential work by
Michael Porter suggested that the activities of a busi-
ness could be grouped under two headings:
Primary activities – those that are directly con- o
cerned with creating and delivering a product (e.g.
component assembly).
Support activities, whilst not directly involved in o
production, may increase effectiveness or efficiency
(e.g. human resource management). It is rare for
a business to undertake all primary and support
activities.
The aim is to determine segmented citizen require-
ments which are realities and need to be addressed by
the organisation.
It distinguishes between three generic types of groups,
but can be expanded to include investors/donors.
List all the citizen requirements and our value proposi-
tions (make sure the requirements are detailed and
quantifiable).
Identify the key business processes required to provide
the citizens with what they need or what we are promis-
ing (value proposition).
Identify in turn all the support processes the organisa-
tion needs to fulfil in order to enable the execution of
the key business processes.
Example
Support activities to ensure that
primary processes and activities
are executed fully
Primary processes and activities to
ensure citizen satisfaction
Citizen requirements
1
2
3
4
Chapter 17Tools for phase 2: Determine requirements

17-5
17.1.2 TOOL 26: DETERMINE CUSTOMER REQUIREMENTS
In any structuring exercise, it is important to take note of the following:
For… The organisation needs to…
Investors (government) and citizens (service recipients) Build its value proposition.
Citizens and employees Grow the business.
Employees and investors Invest in human resources.
What is it? How to use it When to use it
The aim is to determine segmented
citizen requirements which are
realities and need to be addressed
by the organisation.
It distinguishes between three
generic types of groups, but can
be expanded to include investors/
donors.
Select the citizen groups and identify
the different segments of a stakeholder
group.
Review and confirm the performance
categories (the generic categories are
speed, quality, cost, volume, safety and
morale).
Formulate the requirements of each
stakeholder group in quantitative form,
for example requires new
passport within two days after
application.
Review the collective requirements
under each category and identify the
structural implications to achieve each.
If the service user
requirements have not yet
been identified, this tool is an
important mechanism to do it.
This tool forms the basis for
value drivers and process
analysis.
Stakeholders Segments
Groups
Requirement categories
Speed and
convenience
Quality Cost Volume Safety Morale
Government Executive
Other
departments
Other
Citizens High income
Low income
Rural
Urban
Chapter 17Tools for phase 2: Determine requirements

17-6
17.1.3 TOOL 27: PROCESS STRUCTURE ALIGNMENT REQUIREMENTS
What is it? How to use it When to use it
A tool to identify process
inefficiencies and subsequent
structural flaws.
Review each of the questions in the
questionnaire and determine which of the
situations are applicable to your organi-
sation.
Identify either a process design or
structural design intervention to address
the identified process or structural
inefficiency or ineffectiveness.
Use as a support tool for the
process analysis.
Use if the team needs to confirm
their findings on any other other
requirement analysis tools.
Process identification considerations New processes/procedure
to address the need
Structural impact
What is the downstream effect (the effect on other
processes, effect of receiving late delivery or poor quality
from suppliers inside or outside the organisation and silo
approaches), if people are unable to perform according to
certain expectations?
Does the organisation compensate for poor quality or poor
service, e.g. poor quality of work, not delivering on time,
spelling errors, incorrect figures, etc. What is the effect
when people deliver outstanding work versus when people
deliver poor quality work? There should be a “carrot and
stick” scenario embedded in the organisation.
Does the organisation employ people to check other
people’s work? As soon as work is checked for
correctness, the structure is allowing for and building
inefficiencies into processes.
Are things done right the first time around? If not, why not?
What can be done to rectify the situation?
How can the business improve on a specific process
and how can the organisation understand what it is that
citizens want?
Is the organisation structured according to its own internal
requirements or according to what the citizen wants?
What are the risks causing inefficiencies in our processes?
Do we really know what the citizens’ requirements are; are
they clarified and tied back to the specific process?
Chapter 17Tools for phase 2: Determine requirements

17-7
17.1.4 TOOL 28: BUSINESS PROCESS MAPS
Option 1: Value-added chain (VAC) map
What is it? How to use it
A value chain or value-added chain map is a high-level
sequential representation of how key groups of tasks
(processes) add value to the final product or service.
This type of map is used to create a picture of the
business’ or organisation’s main activities which can
be divided into two groups:
Primary o or key business activities/processes are
those which directly influence the final product or
service.
Support activities/processes o are those that
enable and support the execution of the key
business processes, e.g. finance, HR, IT, security,
and audit.
Identify the primary reason for the organisation’s/team’s
existence: To ensure safe access to and from our
communities for commercial and private purposes.
Determine the last major process which is to be
executed to achieve the reason for existence: Last
process.
Group the value drivers and capabilities into two
categories.
There are two ways of depicting the value chain or VAC:
VAC map
1 2 3 4
Support process 1
Support process 2
Porter value chain
1
Support process 1
Support process 2
2 3 4
When to use it
This map forms the basis for the service model and for capacity analysis. It is a very important tool in the whole
structuring process.
Not required if the restructuring does not impact a whole department or unit.
Example: VAC map for Provincial Department of Transport
1. Infrastructure
development
2. Infrastructure
maintenance
3. Driver
support
Enforce 4.
Law 5.
5. Manage people
6. Manage finance and procurement
Chapter 17Tools for phase 2: Determine requirements

17-8
Examples of primary activities:
Primary activity Description
Inbound logistics All those activities concerned with receiving and storing externally sourced materials.
Operations The manufacture of products and services – the way in which resource inputs (e.g. materials)
are converted into outputs (e.g. products).
Outbound logistics All those activities associated with getting finished goods and services to buyers.
Marketing and
sales
Essentially an information activity – informing buyers and consumers about products and
services (benefits, use, price etc.).
Service All those activities associated with maintaining product performance after the product has been
sold.
Examples of support activities:
Support activities Description
Procurement This concerns how resources are acquired for a business (e.g. sourcing and negotiating with
materials suppliers).
HR management Those activities concerned with recruiting, developing, motivating and rewarding the workforce
of a business.
Technology
development
Activities concerned with managing information processing and the development and protection
of knowledge in a business.
Infrastructure Concerned with a wide range of support systems and functions, such as finance, planning,
quality control and general senior management.
Option 2: Flow chart map
What is it? How to use it When to use it
The purpose of process mapping is to use diagramming to understand the process we currently use and ask what is expected of us; what should we be doing to provide better citizen focus and satisfaction?
1. Step 1: Determine the boundaries.
Where does a process begin? a.
Where does a process end? b.
Step 2: List the steps.1.
Use a verb to start the task description. a.
The flow chart can either show sufficient b.
information to understand the general process flow or detail every finite action and decision point.
Step 3: Sequence the steps.2.
Use post-it notes so that you can move tasks. a.
Do not insert arrows until later. b.
Chapter 17Tools for phase 2: Determine requirements

17-9
What is it? How to use it When to use it
Process mapping identifies the best practices the organisa-tion needs to incorporate and find appropriate benchmarks to measure how we can arrive at better ways of communicating our services.
Step 4: Draw appropriate symbols.3.
Start with the basic symbols:
Ovals show input to start the process or output at a.
the end of the process.
Boxes or rectangles show tasks or activities b.
performed in the process.
Arrows show process direction flow. If there are c.
feedback arrows, make sure feedback loop is closed, i.e. it should take you back to the input box.
Diamonds show points in the process where yes/d.
no questions are asked or a decision is required. Usually there is only one arrow out of an activity box. If there is more than one arrow, you may need a decision diamond.
Deliverables should be clearly indicated if it is a e.
detailed procedure map.
Step 5: Draft system model.4.
Draw charts using system model approach. a.
Input – use information based on people, b.
machines, material, method, and environment.
Process – use subsets of processes in series or c.
parallel.
Output – use outcomes/desired results or d.
deliverables.
Control – use best in class business rules. e.
Feedback – use information from surveys or f.
feedback.
Step 6: Check for completeness.5.
Include pertinent chart information, using title and a.
date for easy reference.
Step 7: Finalise the flow chart.6.
Ask if this process is being run the way it should a.
be.
Are people following the process as charted? b.
Do we have consensus? c.
What is redundant; add what is missing.d.
This tool is useful in identifying opera-tional requirements for information flow, work flow, decision making, handover, etc.If the restructuring requires operational structure design, the tool should be considered for all key or critical processes of the value chain.
Chapter 17Tools for phase 2: Determine requirements

17-10
Exam
ple
of a
s-is
pro
cess
map
(com
bina
tion-
type
map
)
Appl
y fo
r a g
rant
Cond
uct i
nter
view
w
ith a
pplic
ant
Verif
y su
ppor
ting
docu
men
tatio
n
Take
com
plet
e se
t of
fing
erpr
ints
Prod
uce
supp
ortin
g do
cum
enta
tion
Atte
st a
pplic
atio
n fo
rmFu
rnis
h ap
plic
ant
with
rece
ipt
Calc
ulat
e m
eans
te
stCo
mpl
ete
reco
rd
of a
pplic
atio
n
Chec
k ap
plic
atio
n fo
rm a
nd
supp
ortin
g do
cum
enta
tion
Fix
offic
ial d
ate
stam
p to
ap
plic
atio
n
Mak
e co
pies
of
appl
icat
ion
form
an
d su
ppor
ting
docu
men
tatio
n
Send
orig
inal
ap
plic
atio
n fo
rm
plus
doc
umen
ts to
ca
ptur
ing
cent
re
Capt
ure
app
licat
ion
form
el
ectro
nica
lly
Payment Service Provider
CaptureChecking of-
ficer2nd
Attesting Of-ficer
1st Attesting OfficerApplicant
Gran
t Adm
inis
tratio
n
Proc
ess
appl
icat
ion
Prin
t let
ter o
f re
ject
ion
Prin
t let
ter o
f ap-
prov
alEn
ter i
nto
paym
ent
reco
rd
File
cop
ies
Open
file
for
appl
icat
ion
Appr
oved
?
End
NO YES
NO
YES
Rece
ive
dow
nloa
d of
pay
men
t in
form
atio
nPe
rform
pay
men
tPe
rform
re
conc
iliat
ion
Corr
ect
docu
men
ts?
Com
plet
e ap
plic
atio
n fo
rm
man
ually
Chapter 17Tools for phase 2: Determine requirements
17-11
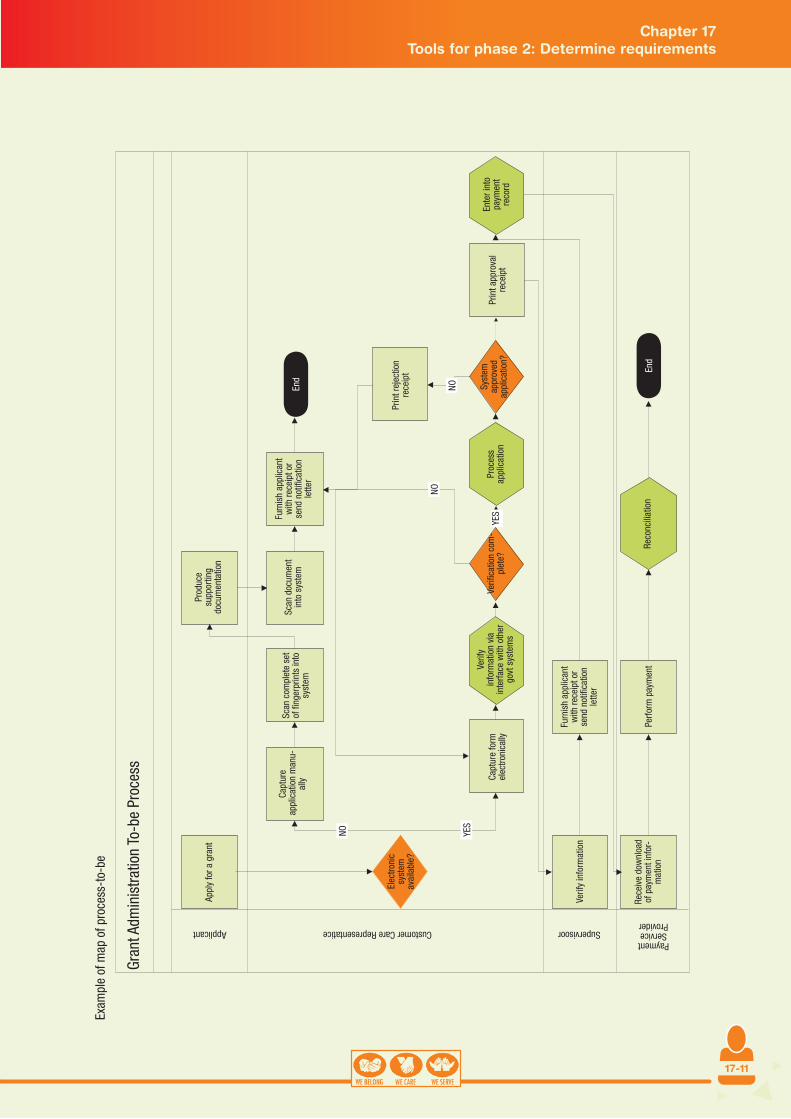
Exam
ple
of m
ap o
f pro
cess
-to-
be
Gran
t Adm
inis
tratio
n To
-be
Proc
ess
Capt
ure
form
el
ectro
nica
lly
Furn
ish
appl
ican
t w
ith re
ceip
t or
send
not
ifica
tion
lette
r
Perfo
rm p
aym
ent
Rece
ive
dow
nloa
d of
pay
men
t inf
or-
mat
ion
Verif
y in
form
atio
n
Reco
ncili
atio
n
Capt
ure
app
licat
ion
man
u-al
ly
Elec
troni
c sy
stem
av
aila
ble?
Verif
y in
form
atio
n vi
a in
terfa
ce w
ith o
ther
go
vt s
yste
ms
Verifi
catio
n co
m-
plet
e?Pr
oces
s ap
plic
atio
n
Syst
em
appr
oved
appl
icat
ion?
Prin
t app
rova
l re
ceip
t
Ente
r int
o pa
ymen
t re
cord
Appl
y fo
r a g
rant
Applicant Customer Care Representatice SupervisoorPayment Service Provider
Scan
com
plet
e se
t of
fing
erpr
ints
into
sy
stem
Scan
doc
umen
tin
to s
yste
m
Prod
uce
supp
ortin
g do
cum
enta
tion
Furn
ish
appl
ican
t w
ith re
ceip
t or
send
not
ifica
tion
lette
r
Prin
t rej
ectio
n re
ceip
t
End
End
NO
NO
NO
YES
YES
Chapter 17Tools for phase 2: Determine requirements

17-12
17.1.5 TOOL 29: QUICK STRUCTURED MAPS
What is it? How to use it When to use it
A quick tool to map high-level
processes and identify support
processes without skills and
knowledge about specialised
mapping tools or methodologies.
The quick structured map is used in
support of the value-added chain map
(VAC) to provide additional information
and overview of process complexities
and dependencies.
It provides an opportunity to analyse
processes and identify opportunities
for improvement.
The link to organisational structures is
made via the value-added chain.
Identify the value-added chain
component, e.g. manage human
resources.
Define the process.
Clarify the organisational context
(owner, executer).
Use SIPOC to analyse the process
(remember, it starts with the
customer (citizen) – first ask what
the citizen wants, then how to give
it to the citizen, then what inputs are
required and then who the supplier
will be).
Identify key performance indica-
tors based on citizen requirements
(speed, quality, volume, cost).
Identify the sequential subprocesses.
Although processes will not always
follow in sequence and there will be
feedback loops and decision points,
the idea is to identify the
subprocesses in order to determine
what activities need to be performed.
An alternative to process flow
charts.
This tool is useful to analyse
a process for the sake of
information and
confirmation of time and
sequence of activities.
Example of a quick structured map for human resource management:
1. Process description
Level-one value chain process
common name
Manage Human Resources
Objective(s) of the process explained
in this document
To perform all actions related to the management of the human resources
of the company. This includes all aspects of planning, developing,
compensating, and relationship management of the company’s workforce.
2. Organisational context
Business unit owner Manages Human Resources
Department/unit owner Human Resources
Responsible process owner(s) Human Resources Manager
Chapter 17Tools for phase 2: Determine requirements

17-13
3. Process analysis
Suppliers
Who provides me
with the inputs?
Trigger (input)
What is required to
start the process?
Customer requirements (outputs)
What are the citizen requirements of the
end results?
Customer
Who uses the
end results of
the process?
Executive Committee
HR Manager
Start or change in
organisation
To determine human resources strategy and
organisational structure
Executive
Committee
Line managers Planning Business continuity and employee growth Line manager,
employees
Line managers
Employees
Request from line
manager or employee
Employees should have adequate skills to
perform duties.
Employees would like to grow in their careers.
Employees
Line managers Vacancies identified Vacancies to be filled by suitable candidates. Line managers
Line managers Employee appointed Employee should be adequately remunerated
and have access to benefits as well as pension
options.
Employees
4. Key performance indicators
Type Dimension Measure (KPI) Target Information source
Key output
measures
(lagging)
Quality Appointed employees match required skills 80% HR database
Average number of training days per
employee
10 days HR database
Speed Time from vacancy to employee
appointment
14 days HR database
Cost Employee setup cost <R30k HR database,
financial system
Key process
measures
(leading)
Quality Employee turnover rate 10% HR database
Accurate salary payments 99% Valid complaints
received
Speed Time to negotiate collective bargaining
agreement
14 days Tracking of
negotiation
procedures
Cost Resource cost percentage of overall
expenses
10% HR database,
financial system
Input measures
(leading)
Quality Accurate information on employee
Speed
Cost Funds for salary payments and other HR
activities
100% Treasury
Chapter 17Tools for phase 2: Determine requirements

17-14
Process analysis (subprocesses)
Step
number
Role player Action Average
processing
time
Potential results
# 1
HR-010
HR Manager Define Human
Resources strategy
Human Resources strategy and vision defined.
Programmes to support strategy and vision
defined and implemented.
# 2
HR-020
HR Manager Plans and manages
HR programmes and
plans
Policies and procedures developed.
Training programmes developed.
Performance appraisal process and recognition
plans developed.
Headcount and salary plans developed.
# 3
HR-030
Executive Board
and HR Manager
Design and maintain
organisational
structure
Organisational structure designed.
Organisational positions defined.
Reporting lines established.
Personnel budget created.
Job vacancies posted.
# 4
HR-040
HR Manager and
line managers
Career and
succession planning
Business continuity ensured.
Career plans ensured.
Training and development needs established.
Succession plans developed.
# 5
HR-050
Recruitment
agent, line
managers, HR
Manager
Manage recruitment,
hiring and
integration
Suitable candidates employed to fill positions.
# 6
HR-060
Training
coordinator
Develops and trains
workforce
Employees have adequate skills to perform
duties and to grow their careers.
# 7
HR-070
Payroll
administrator,
line managers
Manage
remuneration and
classification
Adequate compensation for employees.
Employees suitably promoted or transferred.
0 Minutes/hours/days
Chapter 17Tools for phase 2: Determine requirements
17-15
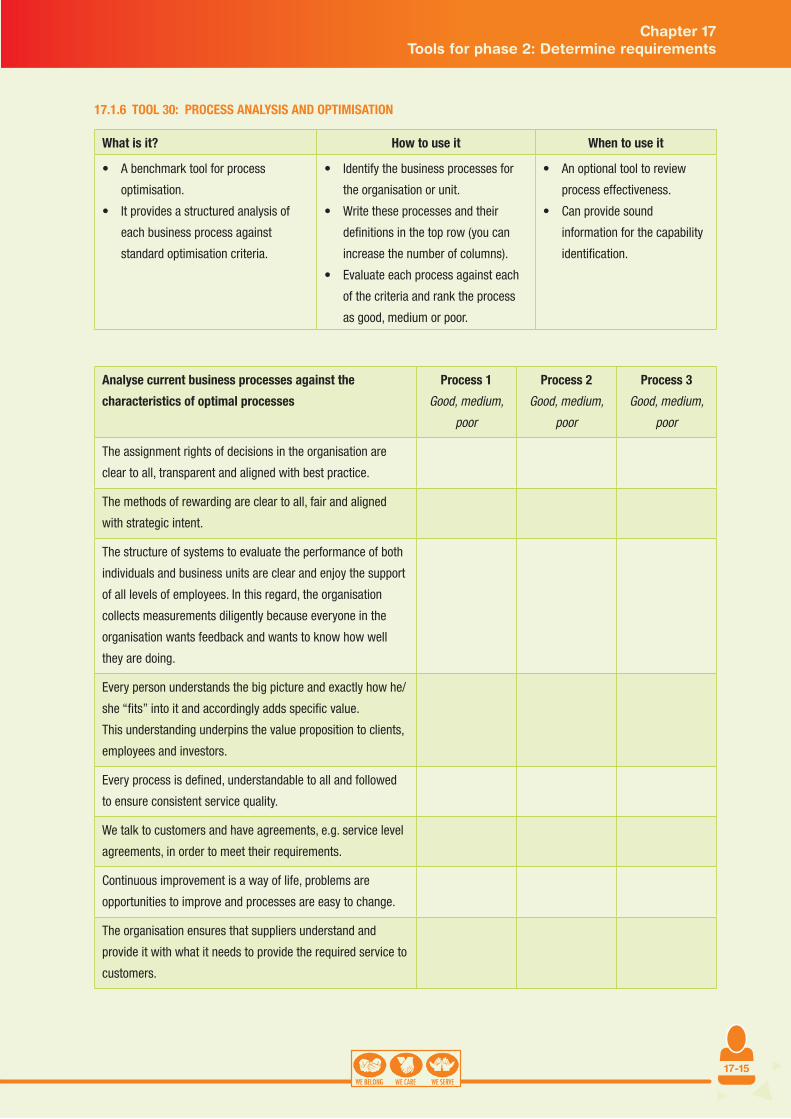
17.1.6 TOOL 30: PROCESS ANALYSIS AND OPTIMISATION
What is it? How to use it When to use it
A benchmark tool for process
optimisation.
It provides a structured analysis of
each business process against
standard optimisation criteria.
Identify the business processes for
the organisation or unit.
Write these processes and their
definitions in the top row (you can
increase the number of columns).
Evaluate each process against each
of the criteria and rank the process
as good, medium or poor.
An optional tool to review
process effectiveness.
Can provide sound
information for the capability
identification.
Analyse current business processes against the
characteristics of optimal processes
Process 1
Good, medium,
poor
Process 2
Good, medium,
poor
Process 3
Good, medium,
poor
The assignment rights of decisions in the organisation are
clear to all, transparent and aligned with best practice.
The methods of rewarding are clear to all, fair and aligned
with strategic intent.
The structure of systems to evaluate the performance of both
individuals and business units are clear and enjoy the support
of all levels of employees. In this regard, the organisation
collects measurements diligently because everyone in the
organisation wants feedback and wants to know how well
they are doing.
Every person understands the big picture and exactly how he/
she “fits” into it and accordingly adds specific value.
This understanding underpins the value proposition to clients,
employees and investors.
Every process is defined, understandable to all and followed
to ensure consistent service quality.
We talk to customers and have agreements, e.g. service level
agreements, in order to meet their requirements.
Continuous improvement is a way of life, problems are
opportunities to improve and processes are easy to change.
The organisation ensures that suppliers understand and
provide it with what it needs to provide the required service to
customers.
Chapter 17Tools for phase 2: Determine requirements

17-16
17.1.7 TOOL 31: DEPENDENCIES MAP (PROCESS DEPENDENCIES)
What is it? How to use it When to use it
A tool to determine and map the
interdependencies for positions,
processes, functions, etc.
It provides a clear overview of
requirements and critical tasks which
need to be executed for the
organisation to function effectively.
Determine the components to be
reviewed: Processes, positions,
functions, etc.
Review the interdependencies per
row. Example: The IT manager
position is the first position in the
left-hand column, row 1. Review the
requirements of the IT manager from
the perspective of all the other
positions in the header row.
Complete the analysis and identify
critical dependencies which have
to be incorporated into the design
principles for each column and each
row.
Important tool to identify
dependencies between
business processes, which
might be important for the
service model design.
IT manager Facilities manager HR manager Important
implications for job
description
IT manager N/A Information
about office
hours
HR policies.
HR processes.
Recruitment.
Facilities manager New technologies.
Security system
support.
N/A Recruitment of
staff.
Office space
requirements.
HR manager HR software.
System performance.
Information
about office
hours.
Adequate space.
N/A
Important
implications for the
job descriptions
Chapter 17Tools for phase 2: Determine requirements

17-17
17.1.8 TOOL 32: PROCESS-SUPPLIER MATRIX
Suppliers
(According to what standards should we
execute the process, what are the norms
for this type of work?)
Input requirements
(Collective skills and knowledge required
to execute the process)
Process
1. Applicant (who needs to be trained or
informed by the service provider)
2. Printer
3. IT service provider
1 Accurate completion of application form
2. Adequate application forms
3. Electronic application forms
Example:
Application process
Process/activity 1
Process/activity 2
Process/activity 3
Process/activity 4
Supplier type 1 Supplier type 2 Supplier type 3 Important
implications for new
structure
Process/activity 1 N/A
Process/activity 2 N/A
Process/activity 3 N/A
Important implications
for the new structure
17.1.9 TOOL 33: RISK ANALYSIS
What is it? How to use it When to use it
The risk management matrix is situ-
ated along two axes:
The probability of an adverse o
outcome.
The scale of the impact if things o
do not go according to plan.
The degree of risk will therefore
fall into one of four quadrants. The
relevant strategies for responding to
the degree of risk are set out in each
of the quadrants.
Identify possible problems and
decide which quadrant they fall into
and then plan accordingly for their
management.
Risk is not static, and regular risk
assessments should be carried out to
ensure that circumstances have not
led to the need for a revised assess-
ment and handling strategy.
A useful tool to determine the
risk for the implementation of
the structure.
This links back to the givens
identified during the diagnos-
tic phase.
Chapter 17Tools for phase 2: Determine requirements

17-18
Example of risk analysis
Risk category Specific risk event Probability
(1-10 scale)
Impact
(1-10 scale)
Risk factor /100
People
Client
Process
Technology
Environment
Funding
High impact Low impact
High probability Address in detail in structure.
(Be careful not to create another risk in
the way you manage the known risk.)
Address in governance structures at
least.
Low probability Include in governance structure
process for review.
Address if required.
17.1.10 TOOL 34: SERVICE CAPABILITY PLANNING
What is it? How to use it When to use it
A planning process which starts with
the end in mind.
Each of the capability criteria builds
on the previous criteria to ensure
an integrated aggregate plan with
adequate attention to detail and
contingency requirements.
Work from the top to the bottom of the
planning tool.
Start by first defining (in detail) the
output associated capacity
requirements. Define the structural
implications this might have.
(For example, the output requirements
are visiting 10 sites a day, but one per-
son can only perform three visits and
you only have two people. Structurally,
you need to increase capacity.)
Continue with the same process till the
last row of the table.
Very useful tool for the design
of new structures or sig-
nificantly adjusted mandates
and output targets.
Chapter 17Tools for phase 2: Determine requirements

17-19
Service capability criteria Detailed description Structural requirements to
ensure service capabilities
Output capacity
How many services do we need to provide? (Who is
the customer, how often, how much, how long, what
kind, etc.) How many goods do we need to produce?
Location
Where will we have to render the service or produce
the product?
Aggregate plan
What is the overall demand for the products or
services? How many will be produced or provided on
an annual basis?
Master schedule
How much demand do we forecast? How will we
meet the demand on a month-to-month basis?
Processes
Which core processes do we need to provide the
services to meet the anticipated demand? (Process,
subprocesses, standards, knowledge and skills,
resources, policies and procedures.
Process requirements
What standards, knowledge and skills, resources,
policies and procedures)
Facilities layout
Layout or distribution of facilities and infrastructure
Input
What information, raw material, funding, backup and
support do we need?
Chapter 17Tools for phase 2: Determine requirements

17-20
17.1.11 TOOL 35: ORGANISATIONAL CAPABILITY PLANNING
What is it? How to use it When to use it
A tool to determine the capability
requirement for a process.
Identify each task or procedure and
ask the following four questions for
each:
What skills are required to o
execute it?
What resources are required? o
What standards should be in o
place?
What standard procedures should o
be followed?
Useful to prepare for work
design.
Option 1: Process execution based capability identification
Standards
(At what standards
should we execute the
process, what are the
norms for this type of
work?)
Resources
(What permanent
resources do we
require: facilities,
technology, and
people?)
Procedures
(What governance
procedures are
required, e.g. decision
making, sharing of
information, quality
assurance, and risk
management?)
Skills and knowledge
(Collective skills and
knowledge required to
execute the process)
Example:
Application
process
10 minutes to pro-
cess an application.
One person should
complete at least 20
applications per day.
Based on forecast
100 applications
requiring five FTEs.
Computer skills.
Systems knowledge.
End-to-end process
knowledge.
Process 1
Process 2
Process 3
Option 2: Identification of capability based on process results
Customer facing
capabilities
Internal facing
capabilities
Partnerships Management
capabilities
Process 1
Process 2
Process 3
Chapter 17Tools for phase 2: Determine requirements
17-21
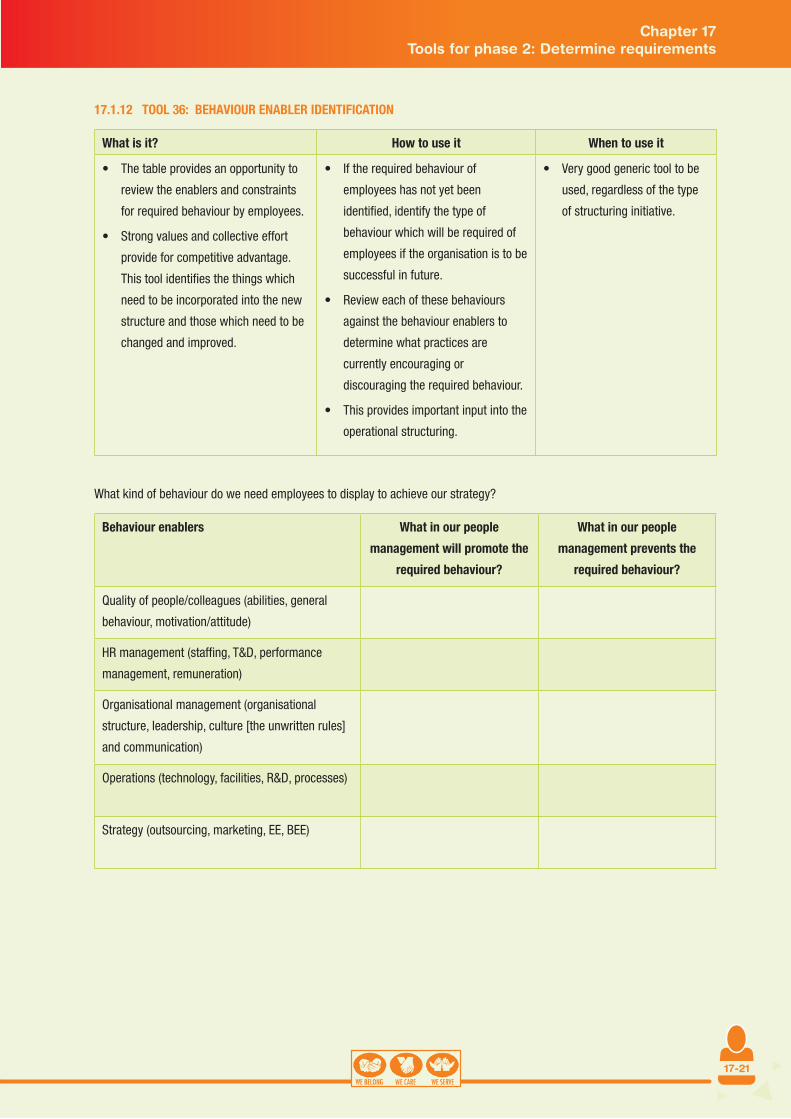
17.1.12 TOOL 36: BEHAVIOUR ENABLER IDENTIFICATION
What is it? How to use it When to use it
The table provides an opportunity to
review the enablers and constraints
for required behaviour by employees.
Strong values and collective effort
provide for competitive advantage.
This tool identifies the things which
need to be incorporated into the new
structure and those which need to be
changed and improved.
If the required behaviour of
employees has not yet been
identified, identify the type of
behaviour which will be required of
employees if the organisation is to be
successful in future.
Review each of these behaviours
against the behaviour enablers to
determine what practices are
currently encouraging or
discouraging the required behaviour.
This provides important input into the
operational structuring.
Very good generic tool to be
used, regardless of the type
of structuring initiative.
What kind of behaviour do we need employees to display to achieve our strategy?
Behaviour enablers What in our people
management will promote the
required behaviour?
What in our people
management prevents the
required behaviour?
Quality of people/colleagues (abilities, general
behaviour, motivation/attitude)
HR management (staffing, T&D, performance
management, remuneration)
Organisational management (organisational
structure, leadership, culture [the unwritten rules]
and communication)
Operations (technology, facilities, R&D, processes)
Strategy (outsourcing, marketing, EE, BEE)
Chapter 17Tools for phase 2: Determine requirements

17-22
17.1.13 TOOL 37: BEHAVIOUR-STRUCTURE ANALYSIS FRAMEWORK
What is it? How to use it When to use it
The process of identifying and
aligning organisational infrastructure
processes with “new” processes
and ensuring that organisational
characteristics can support new
behaviours. The following graphic
illustration depicts the gap that
needs to be addressed to reach the
future end state.
As with the behaviour enablers tool,
you first need to identify the ideal
behaviour.
Review the way in which the different
organisational layers should and can
be used to encourage the required
behaviour.
Identify the structural components
(formal and governance structures
which will be required in the new
structure).
Alternative to the behaviour
enabler identification.
Behaviour
requirements
Strategy
layer
Operational
layer
HR process
layer
Structure Leader-ship Communication
Behaviour 1
Behaviour 2
Behaviour 3
Behaviour 4
17.1.14 TOOL 38: STRUCTURE CONSTRAINTS REVIEW
What is it? How to use it When to use it
A tool to identify constraints or certain
givens which are not likely to change
in the short- to medium-term future.
It provides an opportunity to review
the organisation’s external environ-
ment and constraints that need to be
taken into account in designing the
structure.
Review each of the constraints to
identify specific considerations for
the new structure or for the project
team.
Rank the considerations to determine
which will have the biggest impact
on the new structure or the process
of restructuring.
Alternative to identifying the
constraints in the diagnostic
phase.
Very important to complete
for any large-scale restruc-
turing.
Chapter 17Tools for phase 2: Determine requirements

17-23
Constraints Considerations to be taken into account
when structuring the organisation
Ranking
Organisation and country maturity
(Process, technology, developmental state, access, socio-
economic reality, view of public service, willingness for self-
service)
Dependencies between the main operating divisions
(Sequential nature of work flow, decision making process,
duplication)
Service and legal risks
(Health, safety, corruption, recipient behaviour)
Financial constraints
(Current and future, prioritisation)
Regulatory requirements
Resource and physical constraints
(Technology, equipment, geography, infrastructure, people)
Skills constraints
(Availability, quality, time to develop)
17.1.15 TOOL 39: MATURITY ANALYSIS
What is it? How to use it When to use it
Maturity models provide an indication of how
mature the organisation is, based on key
processes and practices that are employed.
The maturity level is indicative of the ef-
fectiveness and efficiency of the organisation
and the probable quality of its outcomes.
Typically they identify five maturity levels
against a number of key organisational
features.
Each maturity level is a plateau in which one
or more processes have been transformed
from a lower level to achieve a new level of
capability.
It implies a progression through informal,
repeatable, well-defined, managed and
continuously improving levels against
organisational features such as
administration, planning, integration and
involvement.
Assess your organisation
against the criteria.
Determine your overall level of
maturity.
Review the business prac-
tices of the organisation further
against the maturity levels.
Identify the implications of the
level of maturity for the new
structure and the way in which
it needs to be implemented and
governed.
Useful tool for a reality
check, especially in large-
scale restructuring
interventions.
Chapter 17Tools for phase 2: Determine requirements

17-24
Example of a maturity analysis table:
Levels Description Own
organisational
maturity
Implications
for the new
structure
1. Localised use Where individual staff members innovate in their render-
ing of services, but those innovations are
limited by existing organisational practices and are not
transferred or sustainable in the longer term.
2. Internal
coordination
Where a degree of sharing of assets and resources devel-
oped and individuals’ uses of organisational practices are
managed in line with overall strategic plans.
3. Process
redesign
Where the organisation moves beyond automating exist-
ing approaches and begins to apply
organisational practices more systematically to
redesigned processes.
4. Network
redesign and
embedding
Where the redesigned processes become part of the es-
sential day-to-day work of the organisation and manage-
ment processes have been established to ensure their
reliability.
5. Redefinition
and innovative
use
Where the technology is used to offer new
‘customer services’ in new ways to ‘new’
stakeholders.
Template for reviewing maturity levels of business practices:
Business practices Level 1 Level 2 Level 3 Level 4 Level 5 Implication for
structures
Clinical governance
Corporate governance
Performance management and improvement
Risk management
Shared vision
Business planning
Robust personal development plans for ALL staff
Medium-term strategic planning
Accountability agreements
Clear policies and procedures
Shared service agreements
High-performance teams
Performance management systems
Understanding functions
Communication plans
Chapter 17Tools for phase 2: Determine requirements
17-25
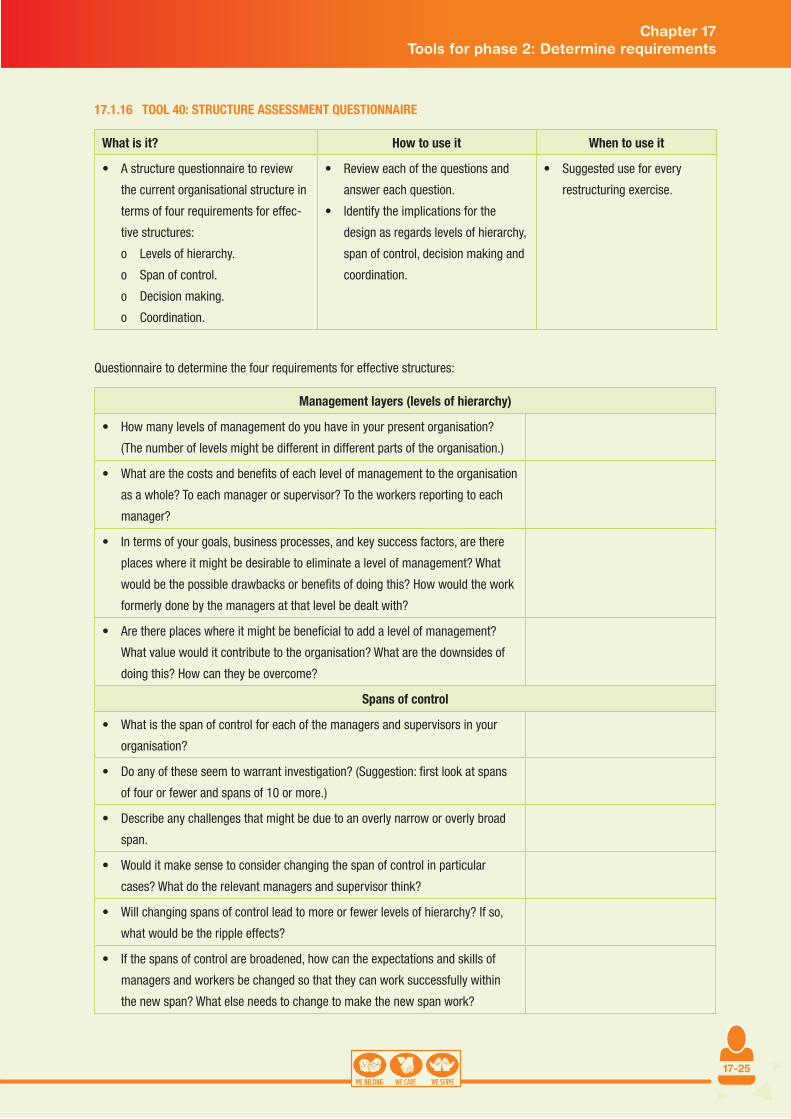
17.1.16 TOOL 40: STRUCTURE ASSESSMENT QUESTIONNAIRE
What is it? How to use it When to use it
A structure questionnaire to review
the current organisational structure in
terms of four requirements for effec-
tive structures:
Levels of hierarchy. o
Span of control. o
Decision making. o
Coordination. o
Review each of the questions and
answer each question.
Identify the implications for the
design as regards levels of hierarchy,
span of control, decision making and
coordination.
Suggested use for every
restructuring exercise.
Questionnaire to determine the four requirements for effective structures:
Management layers (levels of hierarchy)
How many levels of management do you have in your present organisation?
(The number of levels might be different in different parts of the organisation.)
What are the costs and benefits of each level of management to the organisation
as a whole? To each manager or supervisor? To the workers reporting to each
manager?
In terms of your goals, business processes, and key success factors, are there
places where it might be desirable to eliminate a level of management? What
would be the possible drawbacks or benefits of doing this? How would the work
formerly done by the managers at that level be dealt with?
Are there places where it might be beneficial to add a level of management?
What value would it contribute to the organisation? What are the downsides of
doing this? How can they be overcome?
Spans of control
What is the span of control for each of the managers and supervisors in your
organisation?
Do any of these seem to warrant investigation? (Suggestion: first look at spans
of four or fewer and spans of 10 or more.)
Describe any challenges that might be due to an overly narrow or overly broad
span.
Would it make sense to consider changing the span of control in particular
cases? What do the relevant managers and supervisor think?
Will changing spans of control lead to more or fewer levels of hierarchy? If so,
what would be the ripple effects?
If the spans of control are broadened, how can the expectations and skills of
managers and workers be changed so that they can work successfully within
the new span? What else needs to change to make the new span work?
Chapter 17Tools for phase 2: Determine requirements

17-26
Decision making
What kinds of decisions can be made and action taken at each level in the
organisation?
Could some decisions be delegated to lower levels?
How would such a delegation in specific cases affect your goals, business
process, and success factors?
What additional knowledge and skills do employees need at lower levels to
make these decisions? How would people’s roles and jobs change?
What decisions must be centralised at the top level of the organisation, and
why?
Coordination and control
When does the organisation use the following methods to coordinate and/or
control work?
Supervision. o
Standardising processes. o
Standardising outcomes. o
Standardising inputs. o
Employee commitment. o
Employee teams. o
Describe any problems that have occurred in your work situation due to the
technique used.
Are any informal coordination and control methods used that sometimes replace
the formal methods? If so, would you consider enforcing the formal methods?
How about changing the formal methods?
If a different organisational structure were in place, what would be the most
appropriate techniques for coordinating and controlling work in different parts of
the organisation?
Chapter 17Tools for phase 2: Determine requirements

17-27
17.2 TOOLS FOR STEP 7: DESIGN OPERATING/SERVICE MODEL
17.2.1 TOOL 41: SERVICE MODEL DESIGN
What is it? How to use it
The operating/service model consists of organisa-
tional processes to which functions are allocated.
There are three approaches for building an operating
model: Top-down, bottom-up or concurrent streams.
Every operating model has many advantages and
drawbacks. Understanding these and making the right
implementation choice require a very broad under-
standing of the organisation.
Complete the future work flows.
Group processes or parts of processes under functions
and allocate responsibility for the execution of processes
or parts of processes.
Key questions to be answered by the model:
Who are the customers (citizens)? o
How do we interface with these customers? o
How do internal customers interface with one an- o
other?
Which teams need to interact with other parts of the o
organisation/third-party partnerships?
How do we integrate our suppliers? o
Which operating blocks need to work closely together/ o
share information?
How do we group capabilities so that we can deliver o
within the operating blocks?
Are there different options interaction of the operating
blocks or delivery of the strategic objectives?
Example of a business/service model
Policy department
CorpServices
ReceiveCentrally
Develop Publish
Communicate
ReceiveLocally
ProcessCentrally
ProcessLocally
ReviewCompliance
ReviewCompliance
LicensingCentrally
LicensingLocal
Central Petroleum
Service users
Electronic Applications
Regional Mining
Service users
RegisterCentrally
HRFin
IT
Surveying
Shared servicesCorporateServices
TechnicalServices
Functions/Sub Divisions
Business Divisions:
Business Processes
Service user segment
Support Processes & technology
Applications
3. Compliance
4. Licensing
Miningcompliance
Petroleumcompliance
Licensing ®istering
Region 1 Region 2 Region 3
5 6
1. Generate policy
2. Receive application
Chapter 17Tools for phase 2: Determine requirements

17-28
Chapter 17Tools for phase 2: Determine requirements