of the end-notched flexure specimen - nasa · of the end-notched flexure specimen using the...
TRANSCRIPT
NASA TECHNICAL MEMORANDUM 100494
USAAVSCOM TECHNICAL MEMORANDUM 87-B-12
,
STRAIN-ENERGY-RELEASE RATE ANALYSIS p. 33 OF THE END-NOTCHED FLEXURE SPECIMEN
USING THE FINITE-ELEMENT METHOD
S. A. Salpekar, 1. S. Raju, and T. K. O'Brien
( N A S A - T R - 1 0 0 4 9 4 ) STRAIN- ENERGY-RELEASE BATE ANALYSIS OF THE END-NOTCHED FLEXURE SPdCIIVE8 U S I N G THE FINITE-ELEMENT NETHOD ( % A S A ) 3 3 p A v a i l : N T l S HC a03/RF A01 CSLL 2OK U n c l a s
N 88-1 37 35
G j / 3 9 e111863
NOVEMBER 1987
7
National Aeronautics and Space Administration
Langley Rejearch Center Hampton. Virginia 23665
https://ntrs.nasa.gov/search.jsp?R=19880004353 2019-02-02T04:34:27+00:00Z

STLWN-ENEBGY-RELEASE RATE ANALYSIS OF THE END-NOTCHED
?ZEXURE SPEC- USING THE FINITE-EIB4ENT METHOD
S. A. Salpekar*, I. S. Raju*, and T. K. O'Brien* NASA Langley Research Center
Hanrpton, Virginia 23665-5225
SUMMARY
Two-dimensional finite-element analysis of the end-notched flexure
specimen was performed using 8-node isoparametric, parabolic elements to
evaluate compliance and mode I1 strain-energy-release rates, GII. The GII
values were computed using two different techniques: the virtual crack-
closure technique (VCCT) and the rate of change of compliance with crack
length (compliance derivative method). The analysis was performed for
various crack-length-to-semi-span (a/L) ratios ranging from 0.2 to 0.9.
Three material systems representing a wide range of material properties were
analyzed.
calculated with the present finite-element analysis agree very well with
The compliance and strain-energy-release rates of the specimen
beam theory equations including transverse shear. The GII values
calculated using the compliance derivative method compared extremely well
with those calculated using the virtual crack-closure technique. The GII
values obtained by the compliance derivative method using the top or bottom
beam deflections agreed closely with each other. The strain-energy-release
* Research Scientist and Senior Scientist, respectively, Analytical Services and Materials, Inc., Hampton, Va 23666. Work performed under NASA Contract NAS1-18256.
** Senior Scientist, Aerostructures Directorate, U. S. Army Aviation Research and Technology Activity (AVSCOM), NASA Langley Research Center, Hampton, Va 23665-5225.
1

rates from a plane-stress analysis were higher than the plane-strain values
by only a small percentage, indicating that either assumption may be used in
the analysis. The GII values for one material system calculated from the
finite-element analysis agreed with one solution in the literature and
disagreed with the other solution in the literature.
\ INTRODUCTION
With the growing use of laminated composites in aircraft structures,
more attention is being paid to the failure modes of such composites. A
major source of failure in such materials is delamination (also referred to
as a crack in this paper) along ply interfaces. In order to better
understand the behavior of laminated composites and to be able to
characterize and predict failure, the interlaminar fracture toughness must
be evaluated.
ASTM has undertaken a round robin test program to evaluate various test
methods for determining the mode I1 interlaminar fracture toughness of
laminated composite materials. The end-notched flexure (ENF) test 111 is
being considered for the determination of mode I1 interlaminar fracture
toughness.
The ENF test is a three-point bend test of a unidirectional laminate
and is used to obtain the compliance and mode I1 strain-energy-release rate
(GII) of the test specimen.
compliance and GII
A theoretical estimation of the specimen
is useful in correlating and predicting the results of
experiments involving different material properties and specimen
configurations. For this reason, beam theory equations were proposed in the
literature for the ENF specimen [1,2]. The accuracy of these equations
2

needs to be established by methods which do not use simplifying assumptions
of beam theory. Attempts were made to analyze the ENF specimen by two-
dimensional finite-element analysis [ 3 - 6 1 . However, the strain-energy-
release rates in reference 3 disagreed with those in reference 4 for several
values of (a/L) . The purpose of this paper is, therefore, to analyze the ENF specimen by
finite-element analysis using higher order elements, to determine the
specimen compliance and the strain-energy-release rates, and to compare
these results with the beam theory solutions.
closure technique (VCCT) and compliance derivative technique, were used to
calculate the GII values. The GII values calculated from these two
methods are compared to each other and to those in references 3 and 4. The
analyses were performed for three commonly used material systems for values
of delamination length to semi-span (a/L) ratios ranging from 0.2 to 0.9.
Two methods, virtual crack
a
b
CBT
CSH
CFE
SH GII
G13
crack length
be am width
beam compliance considering bending deformation
beam compliance considering bending and shear
deformation
beam compliance from finite-element analysis Ell,E33
Young's modulii in x- and y-directions, respectively
mode I1 strain-energy-release rate from beam
theory considering bending and shear deformation
transverse shear modulus
3
FE GI I
h
L
P
FE V
VSH
13
A
mode I1 strain-energy-release rate from finite-
element analysis
beam half-thickness
beam half-span
line load
deflection under a unit load calculated using
finite-element analysis
deflection under a unit load calculated using
beam theory with shear deformation
Poisson's ratio
length of the side of a square element around the
crack t i p
ANALYSIS
Specimen Configuration, Loading, and Haterials
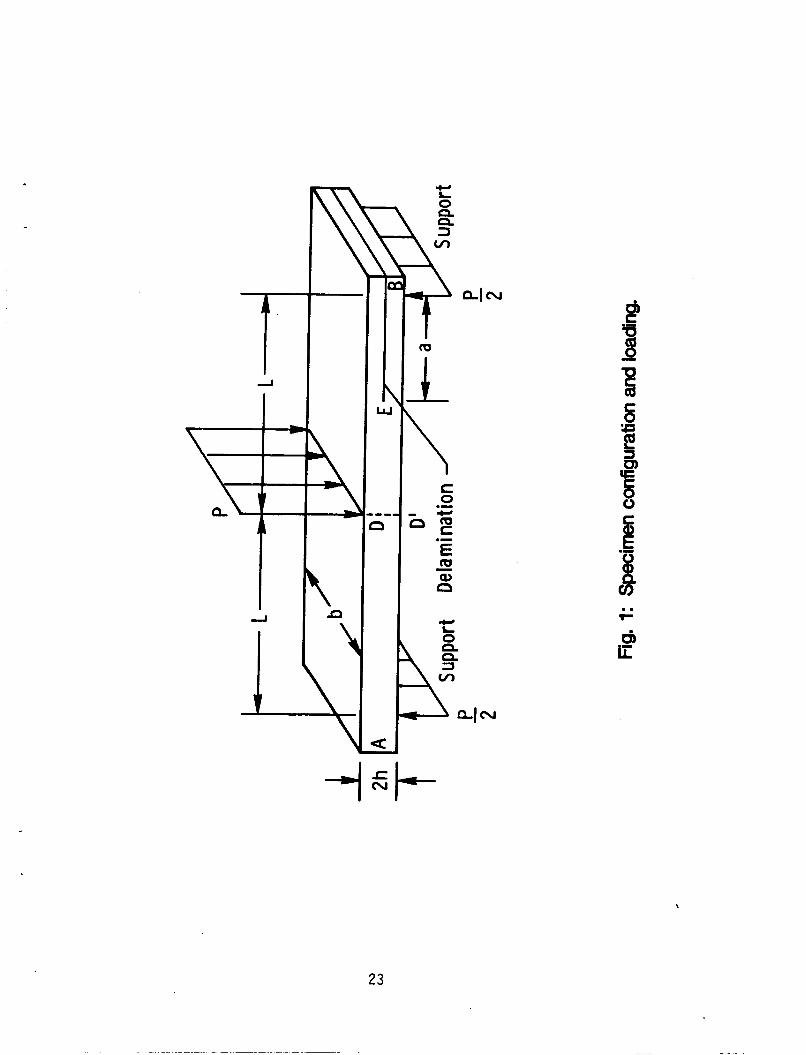
Figure 1 shows the configuration of the specimen. The specimen is a
24-ply unidirectional laminate with a through-width delamination at mid-
depth at one end of the specimen. As shown in the figure, a is the
delamination length, L is the specimen half-span, b is the width, and
2h is the thickness. The half-depth, h, was assumed to be 0 . 0 6 6 9 2 5 in.,
and the beam half-span was taken equal to 1.5 in. A line load, P, is
applied at the mid-span as shown in Figure 1.
Three sets of material properties which are shown in Table 1 were
considered in this study.
present results with the results of reference 3 .
Material 1 properties were used to compare the
Material 2 represents
4

typical properties for S2/SP250 glass/epoxy, and material 3 represents those
of AS4/PEEK.
Beam Theory Solutions
Simple expressions for compliance and GII in the ENF test are given
in the literature [1,2].
theory with and without shear deformation.
The equation for beam compliance, considering only bending deformation,
These expressions were obtained by using beam
was given by Russell [l].
composite beam, this equation reduces to [5]
For a mid-plane delamination in a unidirectional
CBT - (1 + l.5(a/L)3)/fEllb(h/L)3)
This equation for CBT was modified by Carlsson et al. [2] to include the
effect of transverse shear deformation
(1.2 + 0.9(;)) SH = CBT C [' + (1 + 1.5(;)3)
The strain-energy-release rates are calculated by taking the derivative
of the compliance expression
P2 dC GII * 2L ai (3)
The GII values corresponding to compliance Equations (1) and (2),
5

respectively, are
G:: = (9a2P2)/(Z6Ellb2h3 ) ( 4 )
The compliance and strain-energy-release rate values from these simple
expressions will be compared with the finite-element results.
Finite-Element Analysis
Model.- A two-dimensional plane-strain analysis of the specimen in
Figure 1 was performed because the width is large in comparison to the
thickness.
will be discussed later in this paper.
The difference between plane-strain and plane-stress assumptions
Figure 2 shows a finite-element model with 1699 nodes and 516 8-node
isoparametric, parabolic elements.
vicinity of the delamination tip, with square elements around the
delamination tip.
ratio on GII.
central load point to achieve the desired (a/L) ratio. The (L/h) ratio was
the same in all the analyses. A wide range of (a/L) ratios (0.2 to 0 . 9 ) and
material properties (presented in Table 1) were considered.
A very fine mesh was used in the
The same model was used to study the effect of (a/L)
This was accomplished by moving the support points and the
Due to transverse loading and an (L/h) ratio of 22.4, the ENF specimen
behaves like a plate. Therefore, to examine if reduced integration [7] is
needed, all the elements in the model were integrated with three-point-
Gaussian quadrature in the two coordinate directions. Then, the analysis
was repeated with two-point-Gaussian quadrature. The deflection under the
6

load and the values calculated by the two quadrature schemes differed
by less than 0.1 percent. Therefore, in the rest of the analysis, the two-
point-Gaussian quadrature was employed.
GII
Crack-Face Constraints.- Initially, the finite-element model was
analyzed allowing nodes on either side of the delamination to deform without
any restraint. The resulting deflections indicated that delamination faces
had crossed into each other.
inadmissible, the nodes along the crack face must be restrained so that such
crossover is prevented [ 3 , 4 ] . When such a constraint is prescribed, the
delamination faces press against each other and frictional forces w i l l
develop along the delamination faces. Thus, in a rigorous analysis,
friction needs to be considered.
needs to be assumed because data on p
Finite-element analyses were performed in references 4 and 5 for various
values of friction, p , and showed that the effect of friction is to lower
the GII values, in general, by a small amount. Therefore, in the present
analysis, friction is neglected, i.e., smooth delamination faces are
assumed.
Because this deformation is physically
However, the coefficient of friction ( p )
are not experimentally available.
In the present analysis, two methods that prevent crossover of the
delamination face nodes were used. Figure 3 illustrates these two methods.
In the first method, the nodes on either side along the entire delamination
face were constrained to move the same vertical distance (i.e., to have the
same v-displacement), but were allowed to slide past each other freely
(i.e., to have different u-displacements). The nodes on the top and bottom
crack face (e.g., g,g') are shown separated in the vertical direction in
Figure 3 for clarity only. In the second method, the same constraints as in
7

the first method were used, but only on a small region of the crack face.
Consider the node
(see Fig. 3 ) . The nodes p, q, r, s , t belong to two elements, one on
either side of node r.
constraints; the remaining nodes on the crack face were unconstrained. The
reason for this prescription is that the load transfer from the upper half
r on the crack face vertically above the right support
Only these nodes were subjected to multipoint
of the beam to the lower half takes place in a very small region around
node r [ 5 ] . Thus, only a few nodes around node r need to be
constrained.
methods will be discussed later.
The differences in the solutions obtained using the two
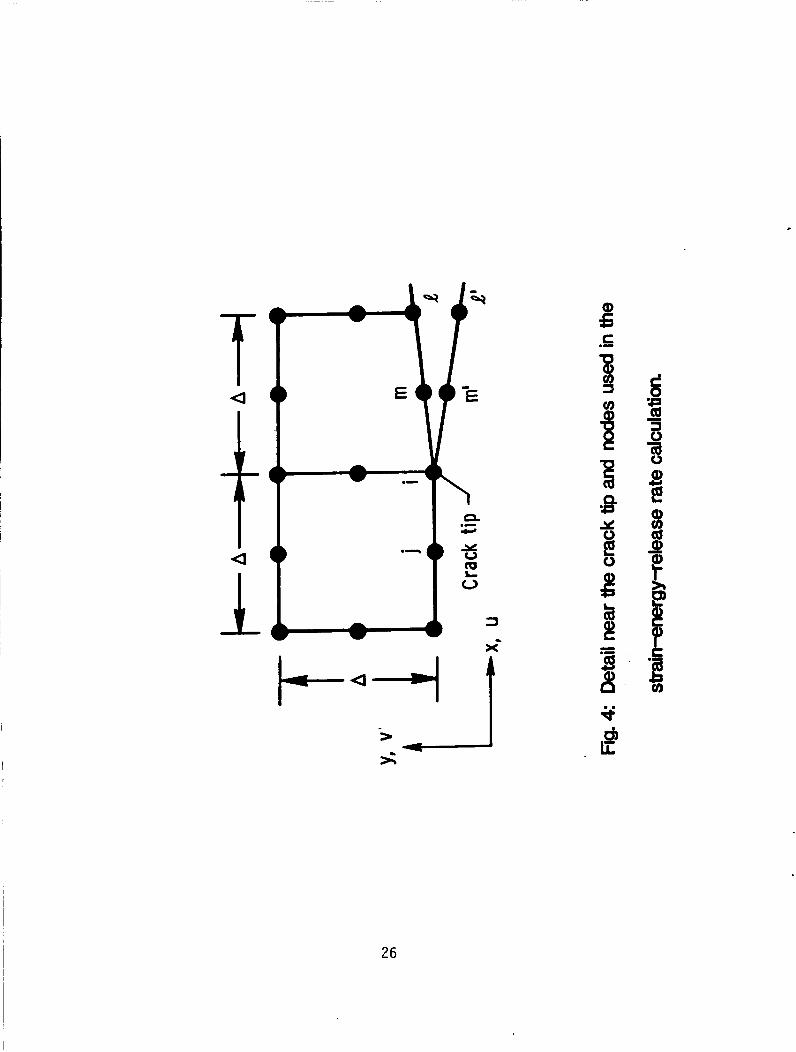
Strain-Enerw-Release Rates.- The strain-energy-release rates were
calculated using Irwin's virtual crack-closure technique.
utilized were similar to those given in references 8 and 9 .
The equations
where A is the element size, Fxi and Fyi are the forces at node i in
the x- and y-directions, and (ue - us') and (vt - vet) are the relative
sliding and opening displacements at node 1 , respectively (see Fig. 4).
Forces at node j and relative displacements between m and m' are
defined similarly.
A compliance derivative method was also used to obtain the strain-
energy-release rates. For each (a/L) ratio, the finite-element solution
yields the deflection under the unit load (and, hence, the compliance) of
8

the specimen. Using these numerical compliance values for various (a/L)
ratios, a curve fit was made to obtain the compliance of the specimen as a
function of (a/L) as
C = A1 + A2(a/L) + A3(a/L) 2 + . . . (7)
where AI, A 2 , A3, etc., are numerical constants determined by a least-
square curve fit. The strain-energy-release rate, GII, was obtained by
differentiating Equation (7) and then substituting in Equation (3)
P2 dC GII - 2bL a m
The GII values by this procedure were obtained using three-, four-, and
five-term approximations in Equation (7). Comparison of GII values
indicated a maximum difference of 1.34 percent between the three sets of
results.
compliance.
Thus, the cubic polynomial was used in the curve fitting for
BESULTS AND DISCUSSION
In this section, various factors that affect the finite-element
solution for the ENF specimen are presented first.
the strain-energy-release rates obtained by the various methods presented
earlier are discussed. Next, the present results are compared to the beam
theory solutions and other finite-element solutions.
Then, the compliance and
Multipoint Constraints
9

The normalized displacements and GII values (computed by VCCT)
obtained for material 1 from the two methods of prescribing multipoint
constraints were found to be identical for configurations ranging from very
small to very large crack lengths.
occurred behind the crack tip when the second method was used, indicating
the absence of mode I type deformation. Comparison of the two methods
confirms that the load transfer from the upper half section of the beam to
the lower half occurs in the immediate vicinity of node r in
Figure 3 .
locations p through t in the first method and comparing the sum to the
support reaction. Similar conclusions were reached in reference 5. The
multipoint constraints for the entire crack face (method 1) were used in the
rest of this study.
No overlapping of the crack faces
This was also confirmed by summing the vertical forces at
Convergence Study
In order to examine the convergence of the finite-element solution, the
analysis was first performed using square elements of size 0.0075 in. ( A h - 0.112) around the delamination tip. The elements around the delamination
tip were then subdivided to obtain element sizes with (Ah) values of 0.056
and 0.028 in the two subsequent analyses. Note that this subdivision
extends through the specimen thickness and length along narrow bands.
Figure 5 shows the convergence of
(a/L) ratio of 0.4.
GII values with mesh refinement for an
The GII values changed by 1.4 percent as (A/h) changed from 0.112 to
0.056. For the next refinement, the GII values changed by 0.5 percent as
(A/h) changed from 0.056 to 0.028. These results indicate that GII values
with A/h - 0.028 can be considered as accurate. Therefore, the model with
10
A / h - 0.028 was used in all subsequent analyses. Converged GII values at
other a/L ratios are also presented in Table 2 for completeness.
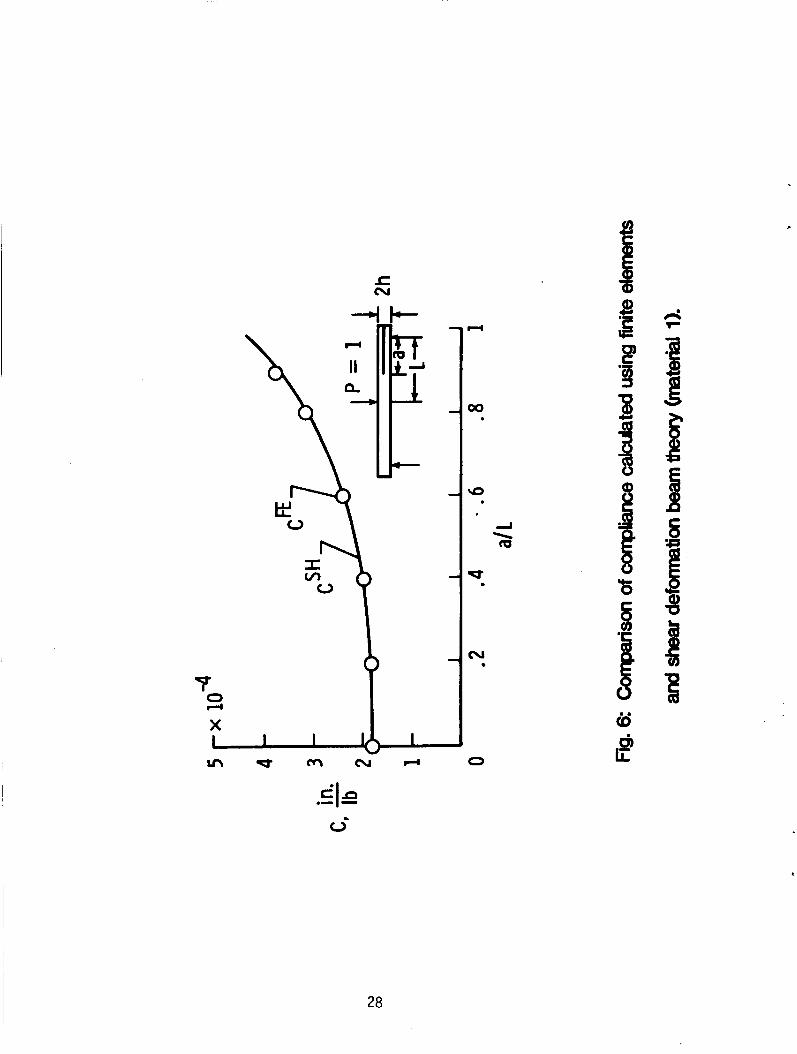
Specimen Compliance
The deflection under a unit central concentrated load (point D in Fig.
1) equals the compliance of the specimen. The compliance values predicted
with the finite-element analyses and those from the shear deformation theory
(Eq. (2)) are presented in Table 3 . Figure 6 shows typical results for
material 1.
results.
Excellent agreement is observed between the two sets of
Strain-Energy-Release Rate
In this section, a comparison of strain-energy-release rates, GII,
from two different techniques (VCCT and compliance derivative technique) is
presented. The finite-element solutions are also compared with the beam
theory solutions and the results in the literature.
plane-stress and plane-strain assumptions on GII is examined.
Finally, the effect of
The GII values calculated by the virtual crack-closure technique (Eq.
( 6 ) ) and the compliance derivative technique (Eq. (8)) for various materials
are given in Table 4, and typical results are shown in Figure 7 for material
1. The GII values calculated by the two methods are in excellent
agreement, showing the consistency of the finite-element results.
Often in experimental investigations, instead of measuring the
deflection at the point of load application, some investigators prefer to
measure the deflection at a point on the load line but on the bottom surface
of the specimen (point D' in Fig. 1). The deflections at point D' will be
referred to herein as the bottom deflections. These deflections are also
11
included in Table 3 . The compliance derivative method was also applied to
the bottom deflections and the
Excellent agreement between GII values from the compliance derivative
technique using either the top or bottom deflections was obtained,
indicating that either deflection can be used.
GII results are included in Table 4.
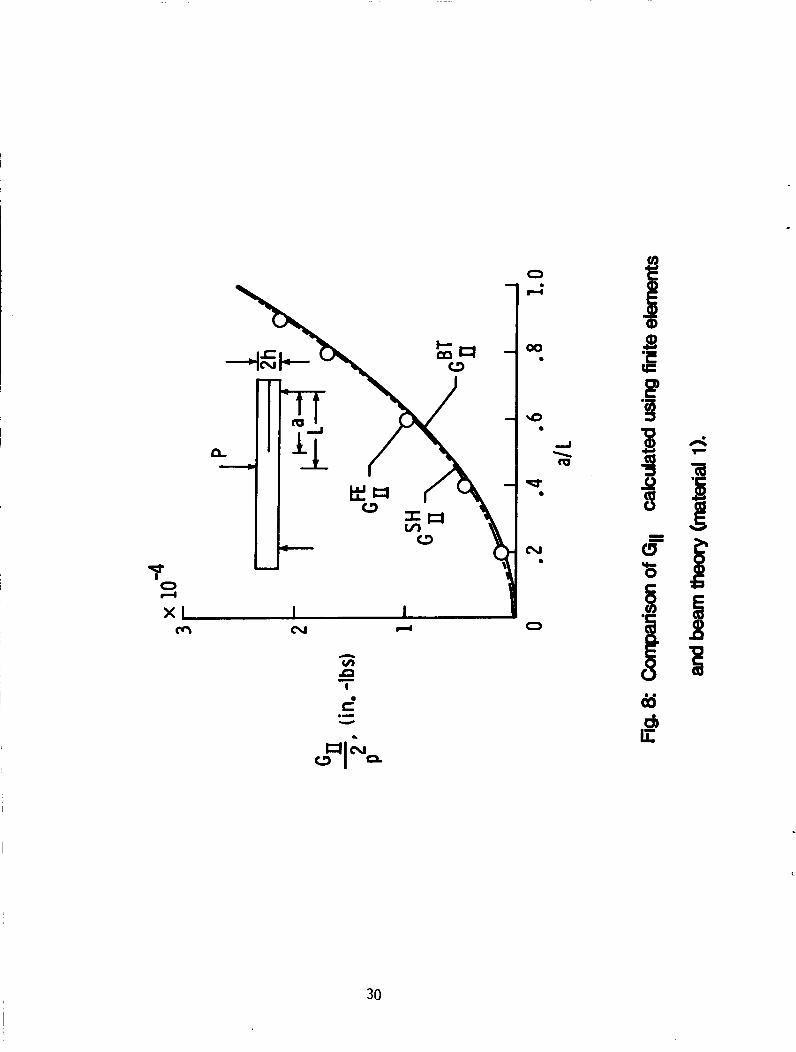
Comuarison with Beam Theorv Solutions.- In order to assess the
usefulness of the beam theory equations in predicting strain-energy release
rate, finite-element results for GII were compared with the beam theory
solutions , Equations (4) and (5). These values are included in Table 4.
This table and Figure 8 show that the finite-element analysis agrees better
with the beam theory with transverse shear than with the theory without
shear deformation. The finite-element GII values, are higher than the
shear deformation theory, but the maximum difference is about 7 percent for
the range of (a/L) ratios and materials considered. Note that this maximum
difference did not occur at the same (a/L) ratio for the various materials
considered herein. Also, the beam theory neglecting shear deformation gave
lower GII values compared to the finite-element values with larger
percentage differences occurring at low values of (a/L).
ComDarison with Other Solutions from the Literature.- Several finite-
element solutions [3-51 of the ENF specimen exist in the literature.
The specimen configurations in references 3 and 4 were modeled using 4-node
quadrilateral elements. In reference 4, the multipoint constraints were
prescribed all along the crack line similar to those in the first method in
this study. In reference 3 , "nonlinear truss elements" were used to
prescribe
basis for
the constraints along the crack line.
comparison, the results shown in Figure 3 of reference 4 and
In order to have a common
12

Figure 7 of reference 3 were normalized with the GSH values from Equation I1
(5) and are shown with the results of the present analysis in Figure 9.
Note that in references 3 and 4 specimens with different parameters,
(Ell/G13) and L, were analyzed. To be able to compare with the results of
these references, the present analyses were repeated with the appropriate
values of (Ell/G13) and semi-span L. A new finite-element model for L - 2
in. was developed. This model is very similar to that shown in Figure 2
for L - 1.5 in. The results of the present analysis are in very good agreement with the
results of Mall and Kochhar [ 4 ] and are in considerable disagreement with
the results of reference 3. The disagreement between the present results
and reference 3 results is larger for (a/L) values greater than 0.4.
the present results for the two sets of parameters showed very small
differences.
Also,
Gillespie, et al. 151, presented finite-element results for various
values of (Ell/G13) and a semi-span, L - 1.5 in. The GII values
presented in reference 5 differed from the shear deformation beam theory by
about 2 to 4 8 percent for (Ell/G13) ratios ranging from 1 2 . 8 to 26.9. In
contrast, in the present analysis, the maximum difference between the
finite-element and the shear deformation beam theory is only about 7
percent for (Ell/G13) ratios ranging from 10.5 to 31.7.
these discrepancies are not known.
The reasons for
Plane Stress Versus Plane Strain.- The finite-element analysis in
reference 3 was performed assuming plane-stress condition, whereas plane-
strain condition was assumed in reference 4 . To examine the differences due
to these two assumptions, consider the expression for strain-energy-release
13

rate in Table 6 of reference 10
2 GII- CKII (9)
where
for an orthotropic material.The Aij‘S
coefficients of the material. The stress-intensity factor KII is a
function of specimen configuration and loading and is identical in plane-
stress and plane-strain conditions.
in Equation (10) are the compliance
The ratio of GII for the plane-stress to the plane-strain case is
c. therefore given by the corresponding ratio of
to be 1.023 for S2/SP250 glass/epoxy (material 2) and 1.016 for AS4/PEEK
(material 3 ) .
obtained as 1.025 and 1.01, respectively.
This ratio was calculated
The corresponding ratios from finite-element analysis were
Since the difference in the plane stress and plane strain results are
so small, either assumption may be used in an analysis.
C O N O I N G RIMARKS
Two-dimensional finite-element analysis of the end-notched flexure
specimen was performed using 8-node isoparametric, parabolic elements to
evaluate compliance and mode I1 strain-energy-release rates, GII. The GII
values were computed using two different techniques:
closure technique (VCCT) and the compliance derivative technique. The
analysis was performed for various crack-length-to-semi-span (a/L) ratios
ranging from 0.2 to 0.9. Three material systems covering a wide range of
the virtual crack-
14

material properties were considered. The compliance and GII values
calculated from the finite-element analysis were compared with those based
on beam theory equations and with other finite-element solutions from the
literature. Based on this analysis, the following conclusions were reached:
The compliance of the specimen calculated with the present finite-
element analysis agrees very well (within 2.7 percent) with beam
theory equations which consider shear deformation.
theory with shear deformation underestimates the GII values in
comparison to finite-element results. The maximum difference was
about 7 percent. Thus, beam theory equations which include the
effect of shear deformation may be used to estimate the
compliance and strain-energy-release rates of the end-notched
flexure specimen.
not include the effect of shear deformation differ considerably
from the finite-element results, especially at low (a/L) ratios.
1.
The beam
The results of beam theory equations which do
2. The GII values were also obtained from the compliance derivative
method. The GII values agreed extremely well (within 1 percent)
with those calculated using the virtual crack-closure technique.
3 . A close agreement (within 0.3 percent) was obtained between GII
results from the top or the bottom deflections by the compliance
derivative method, indicating that either deflection may be used
to measure compliance.
4. The strain-energy-release rates from plane-stress analysis are
higher than the plane-strain values by about 2.5 percent for
S2/SP250 glass/epoxy and 1 percent for AS4/PEEK
graphite/thermoplastic.
15

[I] Russell, A. J.; and Street, K. N.: Factors Affecting the Interlaminar Fracture Energy of Graphite/Epoxy Laminates. Progress in Science and Engineering of ComDosites, T. Hayashi, K. Kawata, and S. Umekawa, Eds., ICCM-IV, Tokyo, 1982, p. 279.
[2] Carlsson, L. A.; Gillespie, J. W., Jr.; and Pipes, R. B.: On the Analysis and Design of the End-Notched Flexure (ENF) Specimen for Mode I1 Testing. Journal of ComDosite Materials, Vol. 20, Nov. 1986, pp. 594-605.
[3] Trethewey, B. R., Jr.; Carlsson, L. A.; Gillespie, J. W., Jr.; and Pipes, R. B.: Mode I1 Interlaminar Fracture During Static and Fatigue Loading. CCM 86-26, Center for Composite Materials, College of Engineering, University of Delaware, Newark, DE.
[4] Mall, S.; and Kochhar, N. K.: Finite Element Analysis of End-Notched Flexure Specimens. Journal of ComDosite Technology and Research, Vol. 8 , No. 2, Summer 1986, pp. 54-57.
[5] Gillespie, J. W., Jr.; Carlsson, L. A.; and Pipes, R. B.: Finite Element Analysis of the End-Notched Flexure Specimen for Measuring Mode I1 Fracture Toughness. <, Vol. 27; 1986, pp. 177-197.
[6] Barrett, J. D.; and Foschi, R. 0.: Mode I1 Stress Intensity Factors for Cracked Wood Beams. Eneineerina Fracture Mechanics, Vol. 9, 1977, pp. 371-378.
[7] Zienkiewicz, 0. C.: The Finite Element Method. McGraw-Hill, London, 1977.
[8] Rybicki, E. F.; and Kanninen, M. F.: A Finite Element Calculation of Stress-Intensity Factors by a Modified Crack-Closure Integral. Engineering - - Fracture Mechanics, Vol. 9, 1977, pp. 931-938.
[9] Raju, I. S.: Simple Formulas for Strain-Energy Release Rates with Higher Order and Singular Elements. NASA CR-178186, Dec. 1986.
[lo] Fracture Toughness Testing. ASTM STP 381, American Society for Testing and Materials, Philadelphia, PA, 1965.
16

Table 1 - Material Properties Used in the Present Analysis
E E G v
MS I MS I MS I 11 33 13 13
Material 1 16.7 1.4 0.65 0.3
Material 2 6.31 2.5 0.6 0.25
Material 3 21.23 1.5 0.67 0.37
17

Table 2 - Convergence of GII Values with Mesh Refinement: (Material 1)
6 2 GII x 10 in-lb/in
A/h - 0.1121 0.0560 0.0280
0.2 12.9415 13.1274 13.1970
0.4 45.4101 45.9955 46.2033 0.6 97.6077 98.8145 99.2334
0.8 169.368 171.416 172.118 0.9 211.564 214.094 214.959
18

Table 3 - Comparison of Compliance Values from Finite-Element
Analyses and Beam Theory Solutions
FE Beam Theory Percent Analysis Solution Difference"
a/L x lo5 in-lb x lo5 in-lb cFE - cSH XlOO
Top of Bottom of ** *** CFE BT SH
Beam Beam ~ ~~
Material 1
0.0 17.8895 17.7610 16.8551 17.8895 0.0
0.2 18.2047 18.0734 17.0574 18.2470 -0.23
0.4 19.8769 19.7484 18.4732 19.8180 0.30
0.6 24.1446 24.0173 22.3162 23.8162 1.36
0.8 32.2045 32.0777 29.7999 31.4550 2.33
0.9 38.0182 37.8909 35.2862 37.0189 2.63
Material 2
0.0 44.7062 44.5981 44.6087 45.7293 -2.29
0.2 45.3901 45.2820 45.1440 46.4327 -2.30
0.4 49.4907 49,3866 48.8911 50.3480 -1.73
0.6 60.1585 60.0563 59.0619 60.6868 -0.88
0.8 80.5224 80.4211 78.8681 80.6612 -0.17
0.9 95.3141 95.2129 93.3883 95.2654 0.05
19

Table 3 - ( Continued ) .
FE Beam Theory Analysis Solution
Percent Difference*
a/L x lo5 in-lb x lo5 in-lb CFE - CSH XlOO
Top of Bottom of ** *** CFE BT SH
Beam Beam
Material 3
0.0 14.2584 14.1369 13.2586 14.2622 -0.03
0.2 14.5045 14.3830 13.4177 14.5718 -0.46
0.4 15.8404 15.7217 14.5315 15.8361 0.03
0.6 19.2291 19.1116 17.5544 19.0096 1.14
0.8 25.6082 25.4913 23.4413 25.0470 2.19
0.9 30.1973 30.080 27.7569 29.4379 2.52
* **
***
CFE is compliance determined from displacement at the top of the beam.
BT
SH is beam theory considering bending deformation.
is beam theory considering bending and shear deformation.
20

Table 4 - Comparison of GII Values Calculated by Various Methods
FE Analysis Beam Theory Solution Percent
x lo6 in-lb/in2 x lo6 in-lb/in2 Difference"
FE SH G - G
Compliance Compliance ** *** i1 i1 a/L VCCT Derivative Derivative BT SH x 100
FE
i1 TOP Bottom G
Material 1
0.2 13.1970 13.2381 13.2399 10.113 12.699 3.77
0.4 46.2033 46.2042 46.2407 40.452 43.038 6.85
0.6 99.2334 99.2827 99.3130 91.017 93.6038 5.67
0.8 172.118 172.474 172.457 161.809 164.395 4.49
0.9 214.959 216.611 216.556 204.789 207.376 3.53
Material 2
0.2 31.2631 31.1766 31.2102 26.7652 29.5668 5.43
0.4 114.422 114.386 114.435 107.061 109.862 3.99
0.6 249.717 249.846 249.884 240.887 243.688 2.41
0.8 437.108 437.559 437.555 428.243 431.045 1.39
0.9 549.781 551.010 550.975 541.995 544.797 0.91
21

Table 4 - ( Continued ) .
FE Analysis Beam Theory Solution Percent
x lo6 in-lb/in2 x lo6 in-lb/in2 Difference*
FE SH G - G
Compliance Compliance ** *** I1 I1 a/L VCCT Derivative Derivative BT SH x 100
FE
I1 TOP Bottom G
Material 3
0.2 10.6385 10.5896 10.6133 7.9552 10.4641 1.64
0.4 36.7811 36.8115 36.8468 31.8207 34.3296 6.67
0.6 78.6305 78.7069 78.7311 71.5966 74.1055 5.76
0.8 135.966 136.276 136.266 127.283 129.792 4.54
0.9 169.350 170.938 170.904 161.092 163.601 3.40
* FE used here is obtained using VCCT. GII ** *** BT
SH
is beam theory considering bending deformation.
is beam theory considering bending and shear deformation.
22
co
Y
.. r
23
,

t”
24

cv
0
O II
e - cii c - .- E + v) c 0 0
e 1 I X
rc 0
c5 l i
25
f Q
t Q
L t--4
C .-
26

.
w 0. II
3 6
27
.c N
28

i
rr I
I
r' .- I
00
\o .
.
N .
0
29
M cv
30

.
L (D e
* CI - 3 m Q) L.
e ----I
q
d
* a rr
cy 4
0 A
0 0 r;
31

USAAVSCOM I 2. Government Accession NO. I 3. Recipient's Catalog NO. 1 R c t n r t No. 1
S. A. Salpekar, I . S . Raju, and T. K . O'Brien
NASA Langley Research Center, Hampton, VA 23665-5225 U.S. Army Avia t ion Research and Technology Activity (AVSC(IMf.
9. Performing Organization Name and Address
_ . _ . _ - _ _ ~
NASA TM-100494 TM 87-B-12 1 5. Report.Date 4. Title and Subtitle
10. Work Unit No.
505-63-01-05 contractor Grant NO.
Strain-Energy-Release Rate Analysis of the End-Notched Flexure Specimen Using the Finite-Element Method
Aerostructures Directorate Hampton, VA 23665-5225
I
7. Authodt) 8. Performing Organization Report No. 1
13. Type of Repon and Period Covered
Unclassified 1 Unc 1 ass i f i ed I 32 I A03 J
12. Sponsoring Agency Name and Address National Aeronautics and Space Administration Washington, DC 20546 U.S. Army Avia t ion Systems Command S t . Louis, MO 63166
7. Key Words (SugQested by Authoris)) End-notched flexure Delaminaation Strain-energy release ra te Finite-element analysis Fracture mechanics Composites
14. Army Project No.
18. Distribution Statement
Unclassified - Unlimited Subject Category 39
15. Supplementary Notes
S. A . Salpekar and I . S. Raju, Analytical Services and Materials, Inc., Hampton, VA 23666; T. K. O'Br ien, Aeros t ruc tures D i rec to ra te , USAARTA (AVSCOM), Lanqley Research Center, HamRton. VA 73665.
'6. Abstract
Two-dimensional f i n i te-element analysis of the end-notched flexure specimen was per- formed u s i n g &node isoparametric, parabolic elements t o evaluate compliance and inode I 1 strain-energy-release rates , GII. The GII values were computed u s i n g two different techniques: the virtual crack-closure technique ( V C C T ) and the rate of change of compl iance w i t h crack 1 ength (compl i ance derivative method 1. The analysis was performed for various crack-length-to-semi-span (a/L) ratios ranging from 0.2 to 0.9. Three material systems representing a wide range of material prop- e r t i e s were analyzed. men cal cul ated w i t h the present f i n i te-element analysis agree very we1 1 w i t h beam theory equations including transverse shear. The GII values calculated u s i n g the compl i ance deri vati ve method compared extremely we1 1 w i t h those cal cul ated us ing the v i r t u a l crack-cl osure technique. The GI I values obtained by the compl iance derivative method using the top or bottom beam deflections agreed closely w i t h each other. than the plane-strain values by only a small percentage, indicating that e i ther assumption rnay be used i n the analysis. The GII values for one material system calculated from the finite-element analysis agreed w i t h one solution i n the l i t e r a - ture and disagreed w i t h the other solution in the l i t e r a tu re .
The compl i ance and s t r a i n-energy-re1 ease rates of the speci -
The strain-energy-release rates from a plane-stress analysis were higher
9. Security aauif. (of this report) 20. Security Classif. (of this page) 21. No. of P~Q?s 22. Rice'
.
.For sale by the National Technical Informtion Service, Springfield, Virginia 22161