of the auxiliary equipment and the welding setup was
TRANSCRIPT

-36�
CHAPTER 4-
CONSTRUCTION OF A PRESSURE TANK TASK 2!
In order to conduct a systematic experimental study of underwater
welding in deep water it is essential to have a facility capable of making
welds in a controlled environment. To do this a pressure vessel along
with necessary auxiliary equipment for pressurizing and depressurizing
is needed. Also needed are means for producing welds in the tank using
different techniques along with various devices recording welding con-
ditions and observing welding phenomena in process.
The objective of Task 2 was to construct a pressure tank for welding
experiments. First a survey was made of previous published information
on experiments at simulated depths, and an assessment was made of the
requirements and budgetary limits. Efforts were then made to design a
pressure tank, construct it, and then test the tank after it was con-
structed. The efforts were made through a cooperative work by a group
of people including Ozaki., Prasad, Tsai, and Zona. Details of the efforts
are presented in the thesis by Prasad [Tlk].
The cost required for the construction of the tank and the purchase
of the auxiliary equipment and the welding setup was covered by matching
funds from a group of companies including:
Hitachi Shipbuilding and Engineering Co.
lshikawajima � Harima Heavy Industries
Kawasaki Heavy Industries
Hitsui Engineering and Shipbuilding Co.
Nippon Kokan Kaisha
Sumitomo Heavy Hachinery Co.

4.1 Im ortant Desi n Decisions
In early stages of the design of the facility a series of important
decisions were made which determined basic features of the N.I.T. Pacility.
Some of the important features are described below.
l. De th Ca abilit . The first important design consideration that
was decided was the depth capability of the facility. As the
depth capability increases the cost of the facility increases.
Since most of the offshore activities are taken at depths up to
1,000 feet, this figure was used as an initial target depth. We
also wanted to bui1d the pressure tank at a cost less than $10,000.
The final decision was to have the depth capability of 700 feet
at a pressure of 300 psig.
2. Underwater Weldin . The second important design consideration
was how to create the environment for underwater wet welding.
There were basically two methods as follows:
a! To build a pressure tank which could be completely filled
with water
b! To build a pressure tank with a dry environment and conduct
underwater welding experiments by placing specimens in a
pan containing water and put the pan in the tank under
pressure
The first method would certainly simulate underwater wet ~elding
more closely than the second method. However, this creates a
difficult problem of how to place welding equipment in pressurized
water. We decided to select the second method primarily because
it was much easier and more economical to build the facility than
selecting the first one. Another important factor for selecting
the second method was that most of high � quality underwater welding
jobs are presently done by dry chamber techniques and uses of wet
welding techniques are generally limited to repair jobs, as dis-

-38-
cussed in Chapter 3. The second method simulates hyperbaric
dry chamber process.
3. Weldin Ex eriments. The facility should be able to handle
various welding processes. It was decided that all welding ex-
periments should be made completely automatically by use of a
remote control device placed outside the pressure tank. The
welding system should be designed in such a way that welding
experiments can be performed by personnel having no welding
skill..
4.2 Construction and Testin of the Facilit
Prasad's thesis [T14] described details ofdesign, construction, and
testing of the M.I.T. facility. Presented here are some of the important
aspects.
Pressure Tank. Figure 4-1 shows some details of the pressure tank.
M.I.T. researchers made initial designs, while the M.S. Charlestown Welding
and Engineering Co., Charlestown, Massachusetts prepared the final detailed
design and did actual construction of the tank.
The tank is 6 feet long and 30 inches in diameter and it is made of
low-carbon steel. The tank has two convex ends, one of which can be fully
open to give easy access to the interior. It is placed horizontally on
a set of stands and the center of the cylinder is 35 inches above the
ground. Figure 4-2 shows an overall view of the pressure tank while
one end is open.
The tank has three viewing points so that the inside of the tank can
be illuminated through one and two people can observe the welding experi-
ment at the same time. In order to fit different types of welding
equipment required for cable feed throughs inside the tank without making
new holes or blanking an existing one, the tank has one porthole with a
cover. The cover is used for fitting all cable and pipe glands. Thus,
a different cover can be used for each type of welding equipment.


� 40-
Pressurization S stem. To get the pressure equivalent to differentwater depth in the pressure tank a pressurization system is required.The pressure in the tank can be built by hydraulic pressure, compressedinert gas or compressed air. It was decided not to employ the hydraulicpressurization as discussed earlier. The tank can be pressurized byeither inert gas or compressed air. The compressed air system has beenused for most experiments because of the cost advantage over the inert.gas system. An electrically driven compressor is used to produce compressed
' JLexperiments using various welding processes can be made provided that theequipment is small enough to be placed in the pressure tank. The basicwelding process employed, however, is the gas metal arc process. Conse-quently the GNA welding system is described here.
The GMA welding system consists of three parts: the power supply,the travel system and the welding gun. The oower supply is placed outsidethe tank, while the travel system and the welding gun are placed insidethe tank as shown in Figure 4-3. The power supply used is an AIRCONATICModel CV-450 welding machine made by AIRCO. It is a multipurpose machineof the constant potential type with a maximum current of 450 amperes. Thecable from the power source enters the pressure tank via pressure fittings.
The welding gun used is an AIRCO's NIGet welding gun model AH20-Ewith AIRCONATIC Control Model AHC-M/S. It uses consumable wire electrodes0.030 to 0.045 inch diameter. The ordinary welding gun has all itsoperational controls on its handle. In order to operate the welding gunfrom outside the pressure tank, some modifications of the gun had to bemade. This consisted of providing external switch for gas flow welding motor and power supply! and wire speed control. Electrical pressurefitting was used for connecting control cables from the gun to the controlsoutside the gun.
The gas most frequently used is Argon-25% CO . The gas from. the

� 41-
COMPRESS
FIGURE 4-3 F1oor p1an showing the experimenta1 apparatus layout

-42-
storage cylinder passes through a pressure regulator, then via pressure
fitting into the tank.
The travel system used for the movement of the welding gun is
Welding Tooling Corporation Bug � 0 Experimental Model! system wi.th remote
control for:
a. Travel speed
b. Start, stop and direction of travel
The track for the travel system has magnetic mounts, with hinged
joint, for mounting on a curved surface. The standard mounts with a single
hinged assembly were found unsatisfactory due to the high curvature of the
pressure tank walls, hence the same was modified and two hinged joints pro-
vided. The power and control cables to the carriage unit have pressure
fittings on them where they enter t' he tank.
Figure 4-4 shows the welding system inside the pressure tank. It
sho~s the welding gun mounted on the travel system.
Measurin Devices. The present setuo is capable of making the
following measurements during welding:
a. Arc voltage
b. Welding current
c. Travel speed of the carriage
d. Temperature changes of a specimen being welded
Arrangements can be made to make other measurements.
4.3 0 ezatin E erience and Summary of Ca abilities
The N.I.T. facility has been operating very satisfactorily. Many welded
specimens have been prepared under various levels of pressure. It is
worth mentioning that no qualified welder was used in preparing these
welded specimens. All specimens were prepared by students mostly graduate

-43-
FIGURE 4-4 The welding system inside the pressure tankshowing the welding gun mounted on the travel system

students! with no training as welders.
As a summary operational capabilities of the M.I.T. facility are
described below:
Tank size: 6 feet long, 30 inches in diameter
Maximum simulated working depth: 700 feet �00 psig!
Position: downhand can be modified for all positions!
Maximum weld length: 2 feet
Joint types'. Head-on-plate, butt joint, lap joint, and tee joint
can be modified for other types of joint!
Welding processes: GTA, GMA, shielded metal arc, flux-shielded, stud
welding Can be modified for other processes!
Figure 4-2 shows the overall view of the tank, while Figure 4-3 shows
the welding system inside the tank. In making a welded sample, the sample
is placed in the tank and the door is closed. Pressure is applied by
activating a compressor located outside the tank. Welding is performed
completely automatically by merely pressing an appropriate button. The
operator standing outside the tank can observe the welding arc through the
window on the side wall of the tank.
When underwater welding is necessary, specimens to be welded are
immersed in water contained in a pan. Then the entire setup, including
the welding machine, specimens and pan, is placed in the tank and sub-
jected to a certain pressure. In this way underwater welding in deep-sea
conditions can be simulated without building extremely expensive equipment.

-45�
CHAPTER 5
EXPERIMENTS ON ARC WELDING AND CUTTING UNDER
SIMULATED DEEP-SEA CONDITIONS TASK 3!
5.1 Introduction
The objective of Task 3 was to study effects of ~ster pressure on
arc welding characteristics and properties of welds. Although some
studies were made on this subject, most of the experiments conducted were
not systematic and conclusions drawn by different investigators were often
conflicting. For example, researchers at Battelle Memorial Institute
reported [C30]:
"Welds made underwater with AWS F6013 electrodes at 295, 680, and
1,200 feet simulated depths had excessive porosity, while welds made
at sea level pressure but underwater! were sound. Melding with
reverse polarity appeared to reduce the size and amount of porosity
although sufficient welds were not made to verify this performance.
The cause of this porosity is not known although it probably is re-
lated to more rapid freezing of the weld metal at the greater depth."
On the other hand, an investigator of the Technische Hogenschool Delft
stated in a letter to M.I.T. researchers as follows [C31]:
"It was observed that in all gases mentioned the amount of porosity
in the weld metal sharply increased with an increasing pressure up
to 3.5 atmosphere and decreased again at still higher pressures.
But the experiments were not performed underwater.! Other observa-
tions were a decreasing weld bead penetration with increasing
pressure, while the optimum arc current range became very small at
the high pressures."
The work referred to above was conducted by the working group on underwater
formed by the Netherlands Welding Society.

Only limited information was available on the effects of pressure on
are welding, characteristics and properties of welds made underwater. When
Task 3 was conceived there was a strong possibility that a company would
provide a large amount of matching funds to conduct an extensive research:
�! To determine effects of water pressure on arc welding character-
istics
�! To determine effects of water pressure on metallurgi.cal and
mechanical properties of welds
Unfortunately the plan did not materialize and the scale of Task 3
had to be reduced considerably. In addition, M.I.T. researchers experienced
considerable delays in construction and testing af the deep � sea underwater
welding simulation facility. Although most of the construction and test-
ing of the pressure Lank was completed by the fall of 1977, they spent
considerable time in installing welding systems which required a number of
modifications. M.I.T. researchers were very anxious to go on to later
phases of the research program of which objectives were to develop new
underwater welding systems rather than obtaining fundamental data on
processes which are currently in use.
In the fall of 1977 Prasad tT14] conducted an experimental study on
the effect of pressure on gas metal arc GNA! and flux-shielded are FSA!
welding processes in dry environment. This is the first experimental
study using the new deep-sea underwater welding simulation facility. In
the spring of 1978 Erickson IT15] studied the effect af pressure on FSA
welding in water.
5.2 Prasad's Stud on Effects of Pressure on Gas Metal-Arc Flux-ShieldedArc Weldin in Dr Environment
Prasad [T14] conducted an experimental study on the effect of pressure
on gas metal arc GMA! and flux-shielded arc FSA! processes in dry en-
vironment. Experiments were carried out by making bead-an-plate welds.
The plates were of low-carbon steel to specification AISI-1020, and the

sizes of the plates were 10" x 6" x 1/4" and 10" x 6" x 1/8". Experiments
were carried out to find the welding parameters that gave satisfactory
welds at pressures of 50, 100, 150, 200, and 280 psig, corresponding to
114, 227, 340, 455, and 635 feet, respectively of ~ster depth. The
effect of pressure on welding arc stability, weld shape factor, and the
hardness of the weld metal and the heat affected zone was examined.
5.2.1 Ex eriments to Find 0 timum Weldin Parameters at Different Pressures
Bead-on-plate welding experiments were carried out to find the welding
parameters that gave satisfactory welds at pressures of 50, 100, 150, 200,
and 280 psig. The welding parameters that gave the most effect on weld
bead shape and quality are:
a. Welding voltage
b. Welding gun-to-plate distance
c. Travel speed
The optimum values of these parameters were known for welding at atmo-
spheric pressure. The same values were used initially when w'elding at a
higher pressure. Of these three parameters, two were kept fixed, the
third was varied, and its effect on the weld-bead shape was examined.
1. Variation of Weldin Volta e. GMA welds were made at pressures
of 50 psig with the welding voltage set at 23.5, 25, 30, 34
volts. Welding voltage for satisfactory welds at atmospheric
pressure was 25 volts. The weld bead was both narrow and wavy
for welding voltages of 23.5 and 25 volts. At voltages of 30
and 34 volts the weld bead became less wavy and flat. The
amount of spatter increased with welding voltage. FSA welding
required an increase in the welding voltage with increase in
pressure to give satisfactory welds.
2. Variation of Weldin Gun-to-Plate Distance. The distance between
the gun and the work plate for laying a satisfactory bead was

-48-
5/8 inch. The reduction of this gap caused the electrode to
stab in the weld puddle. An increase in the gap caused the
weld bead to become narrow, wavy, and discontinuous. Tests
were carried out at 50 and 100 psig, to see the effect of chang-
ing the distance. It was seen that 5/8" gave satifactory welds
at both pressures.
3. Variation of Travel S eed. Travel speed had to be reduced as
the pressure in the tank was increased to maintain satisfactory
weld bead shape. The travel speed required for the six pressure
conditions tested are given in Table 5-1, for both GNA and SMA
welding processes.

-49-
5.2.2 Effects of an Increase in Pressure on the Weldin Arc
The output of the high speed chart recorder giving the welding voltage
and current was used to study the welding arc in terms of metal transfer,
arc voltage, welding current and arc stability for the GMA and FSA pro-
cesses at 0 ambient!, 50, 100, 200, and 280 psig.
Gas Metal Arc Weldin . The results of experimental observation on
the effect of an increase in pressure on the welding arc in the GNA processwere as follows:
a! The metal transfer mode was by short-circuiting in the arc atall pressures.
b! The number of short-circuits per second decreased as pressureincreased.
c! The welding arc voltage remained almost unchanged as pressureincreased.
d! The welding current remained almost unchanged as pressure in-creased.
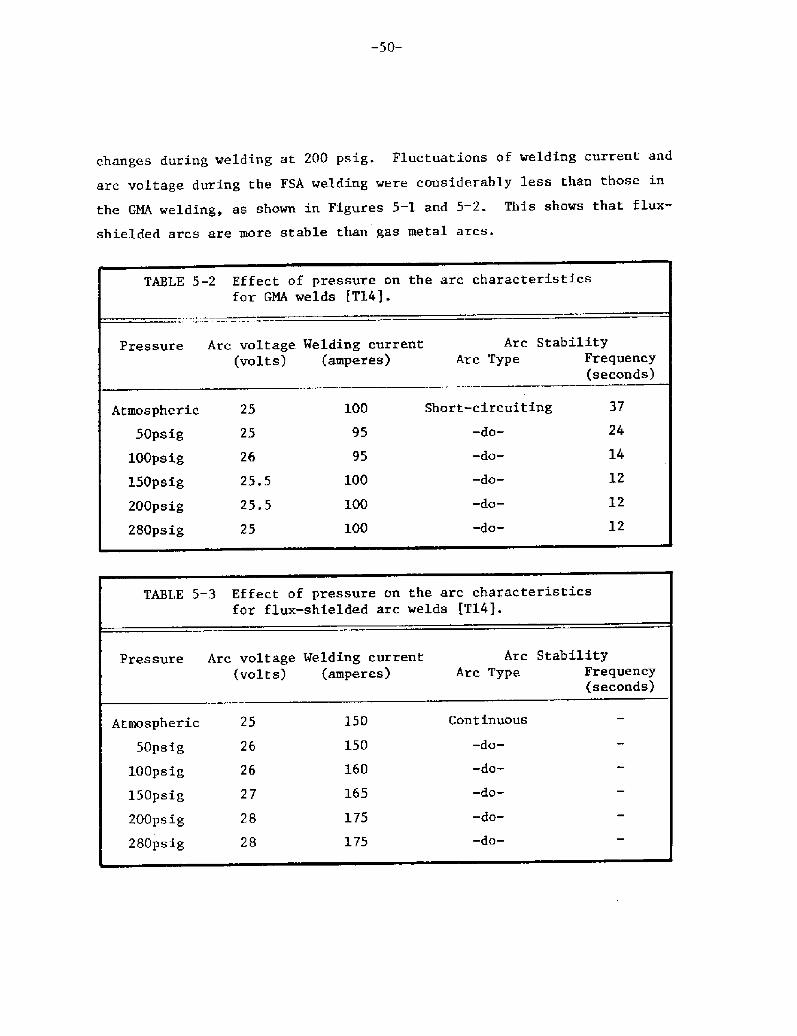
The actual experimental observations are given in Table 5-2. Figure 5-1.
is a sample of the output from the chart recorder at 200 psig, givingwelding current and arc voltage.
Flux � Shielded Arc Weldin . The result of experimental observations
on the effect of pressure on the FSA welding process may be stated as
follows:
a! As the arc voltage and welding current remained steady, the
metal transfer was not by the short-circuiting mode
b! The welding voltage increased with increasing pressure
c! The welding current increased with increasing pressure.
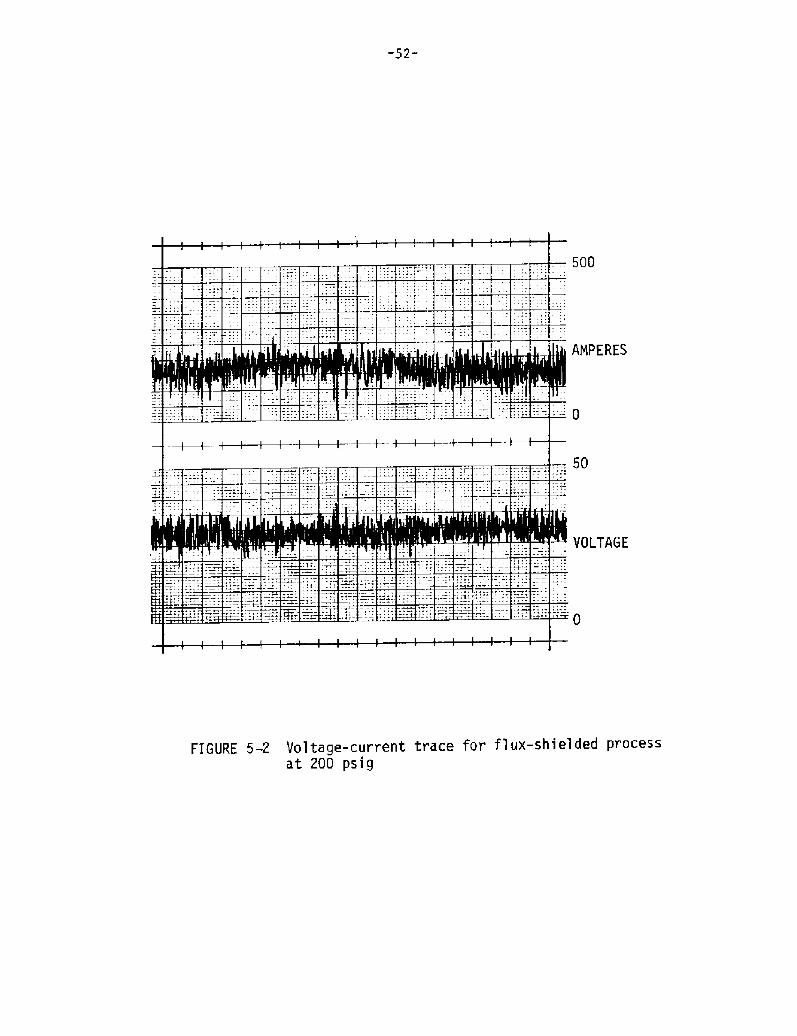
The results of experimental observations are given in Table 5-3. Figure
5-2 is s typical representation of the welding current and arc voltage
� 50�
changes during welding at 200 psig. Fluctuations of welding current andarc voltage during the FSA welding were considerably less than those in
the GNA welding, as shown in Figures 5-1 and 5-2. This shows that fluz-
shielded arcs are more stable than gas metal arcs.

-51- 500AMPERES
50
VOt TAGE
FIGURE 5-1 Voltage-current trace for GMA processat 200 psig [TI4]
500
AMPERES
VOLTAGE
FIGURE 5-2 Voltage-current trace for flux-shielded processat 200 psig

5 ' 2.3 Metallur ical Test Results
The welds made at different. pressures using the GMA and the FSA
processes were sectioned and examined for the following properties:
a! Weld bead appearance and defects
b! Penetration
c! Hardness
l. Weld Bead A earance and Defects. The macrostructures of the
weld were examined for the shape of the weld bead and defects,
such as cracks, lack of fusion, undercut, etc. Figure 5-3
defines the different terms used to describe the bead shape and
Table 5-4 gives the results of the measurements.
2. Penetration. The welds made by the GMA process had a larger
penetration compared to those by the FSA process at a given
pressure. The penetration did not change with an increase in
pressure for GMA welds. In the case of FSA welds no such con-
clusion could be made.
3. Hardness. Microhardness values of the weld metal, HAZ and base
metal were measured for welds made by the GMA and FSA processes
at different pressures. The results are given in Table 5-5.
From the limited number of experiments carried out, we see that
the hardness of the weld metal and the heat affected zone in-
creased with an increase in pressure. The hardness values of
the weld metal and HAZ were lower for the FSA welds compared to
the GMA welds made at a certain pressure level.
5 ' 3 Erickson's Stud on Effects of Pressure on Flux-Shielded ArcWeldin Underwater
Erickson [T15! studied the effect of pressure on flux-shielded arc
welding'

TABLE 5-5 Effect of pressure on the weld and the heat affectedzone hardness
Knoop hardnessPressure
Flux-shielded weldsGas metal arc welds
Weld Base
Metal H A Z MetalWeld Base
Metal H A Z Metal
181.5 179. 7
191.6
179.7
249.0
237. 8
237. 8
227.0I
181. 5258. 2
246.2 179. 7
232. 2 179. 7
179. 7!
179. 7
179. 7
252.0
258.2
258. 2
227. 0
229.6187. 1300.0
Atmospheric
50psig
100psig
150psig
200psig
280psig
264. 6
312.0
277.8
281.4
300.0
224.4
281.4
316.2
300. 0
267.8
288. 6

-55-
W C P RS
BEAD W I DTH
CON VEXITY
PENETRATION DEPTH
BEAD WIDTH/ PENETRATION DEPTH
PENETRATION DEPTH / BEAD WIDTH
FIGURE 5-3 Definition of bead shape
5. 3. l Hx erimental Procedure
Figure 5-4 shows the experimental setup. Underwater welding was
performed by placing a plexiglass tank containing water inside the chamber
and pressurizing the chamber by means of air compressor to the desired
pressure. Specimens to be welded were immersed in water but the welding
equipment was not in water. The plexiglass tank was filled with water
to a depth of 5 to 6 inches.
To simulate a flux cartridge for the experimental investigation a
container was constructed which could be attached to a plate by the use
of small studs, as shown in Figure 5-4. The container served to hold
the flux in position and to isolate the flux from the surrounding water

-56-
K
O CL
Ci0
O
UJ
CO ~
Co G.CC
Xf-QZaO
ClZ
z ctZO
CO OCA
g CD
X UJLaJ
Q

-57-
during welding. The top of the container was open to the pressurized air
atmosphere to enable the welding electrode to traverse along the plate.
Bead-on-plate welds were made on cold rolled low-carbon steeI
plates 1/4 inch thick. The plates were 6 inches wide by 10 inches Iong
with the weld being made longitudinaIly along the centerline. Mild steel
welding wire of 0.030 inch diameter was used for all welds made. The
wire feed set was at 12.5 feet/minute for all welds. Travel speed was
set at 9 inches/minute. The weld beads varied in length from 6 to 7
inches. The weld area was protected by a 3/4 inch layer of Lincoln
Flux No. 710 held by the flux container.
Welds were performed underwater in tap water at 0, 50, 100, 150, 200,
250, and 300psig pressure corresponding to 0, 114, 227, 340, 455, 570, and
680 feet, respectively, of w'ster depth. The welds were performed using
reverse polarity. The potential setting of the power supply was increased
slightly with increasing pressure to obtain weIds which are similar in
appearance and quality for the various pressures. Arc voltage and welding
current were continuously recorded during welding. Five Chromel-Alumel
thermocouples were attached to the surface of each steel plate as shown
in Figure 5-5. The distance from the weId beads varied slightly from
weld to weld due to slight differences in alignment of electrodes from
weld to weld.
An additional weld was made at 0 psig with flux which was damp. This
weld was made in order to demonstrate one of the limitations of the method
discussed later.
5.3.2 Com uter Heat Flow Anal sis
Tsai IT13,P17,P18] developed a semi-empirical computer analysis
of heat flow in underwater welding. Since his study was not directly
connected with this research program a paper, based on his Ph.D. thesis,
entitled "Mechanisms of Rapid Cooling and Their Design Considerations in
Underwater Welding" is included as APPENDIX C. The analysis shows the

-58-
IO
FIGURE 5-5 Thernocouple location on welding plate
effectiveness of the flux-shielded process in reducing cooling rate during
underwater welding. Figure ll of APPENDIX C shows that:
"The cooling rate during underwater FSA welding is much slower
that that of wet SMA welding and i t is almost as slow as that of
air welding. While HAZ structures in wet SMA welding are completely
martensitic, no martensitic structures would be produced in FSA welds
in 0.17X carbon steel."
The most effective way in reducing cooling rate during underwater welding
is to separate the molten weld metal from surrounding water, as it was
dicussed in an earlier Sea Grant report [P13]. And flux shielding is
a very effective method of accomplishing this.
The computer programs developed by Tsai were used to analyze the
experimental. results obtained by Erickson.
5.3.3 Ex erimental Results and Discussion
A summary of the welding parameters and experimental results of
the underwater flux-shielded welds performed is presented in Table 5-6.

-59-
GO
QO
O 00'LO
DCQ D
0
I0 ! ~ 0
I 0: QO
CI
CO ! cO . QO!CI ' 0 C!
I
IO ! 0 . 0 0 0 0QI
QIQI
0 cQ
0
V QI O ! 0 O C!
IB
0
0! vQ! w4
0
0 Vl CLD
4 >
0 C!0 0Vl 00 0
0V
cdQIgal
QI
Q!
CLI
V
0
0 I 0 I
II
0 I 0vlna
0 I 0
0 ' 0O: 00
0 0
I 00
0 I 0I
CICOQO
0
0 00
0

� 60�

-61-
Shown here are welding conditions and bead width, bead penetration, and
the ratio of bead width to bead penetration. The penetration tended to
increase and the ratio of bead width to penetration tended to decrease
as the arc power increased.
Figure 5-6 shows the voltage and current traces for the underwater
welding arc at 300psig. Very similar traces were produced for the other
welds performed. A steady arc could be produced and maintained during
welding regardless of the pressure. The arc power for the weld per-
formed at 150psig was higher than expected for no apparent reason.
Figures 5 � 7 and 5-8 show microhardness distributions of welds made
at 0 and 300psig, respectively. Rxamination of microstructures revealed
no martensitic structures in all af the welds made. Welds were free from
defects such as inclusions, porosity, and cracks.
Figures 5 � 9 and 5 � 10 show temperature profiles predicted by the
computer analysis and experimental data for welds made at 0 and 300psig,
respectively. In the computer analysis it was assumed that the flux
shielding provides a perfectly insulated layer of flux 2.5 inches wide.
Heat transfer to the water was assumed to be natural convection from a
horizontal plate. Although there were some differences between the ex-
perimental data and analytical predictions, the temperatures and times
were of the same order indicating that the computer analysis is reasonably
valid in predicting heat flow in weldments.
All the welds discussed above were for the FSA method with dry flux.
One weld was made at 0 psig with damp flux to illustrate the limitation
of the method. The weld metal contained large slag inclusions and a
good deal of porosity. No cracks were found however. Figure 5-11 shows
microhardness readings of the weld. Higher hardness readings were ob-
served in the weld metal for the damp flux weld than for any of the dry
flux welds indicating that the presence of the moisture may have affected
the metallurgical structures of the weld metal. This weld made with
damp flux demonstrates that the weld metal must remain dry if good quality

-62-
500
400
O O300
Z
X hC 200 O.I 0.2 0.3 0,4 0,5 0.6 0,7 0.8 0.8 I.OXCcmj
FIGURE 5-7 Nicrohardness readings in underwaterflux-shielded weld � psig!
500
o 400
O K300
Y 200 O.I 0.2 0.3 0.4 0.5 0.6 0.7 0.8 0.9 I,OX Kcrnl
FIGURE 5-8 Microhardness readings in underwaterflux-shielded weld �00 psig!

-6 3-
I 200
I I 00
IOOO
300
200
IOO
20IO I5
TIME sec,!
FIGURE 5-9 Calculated temperature amd measured temperaturein underwater flux-shielded weld � psig!
I 2000.79 cm
1.11 cm
1.73 cm
I I 00
IOOO
300
200
IOO
IQ l5
TIME sec.!20
FIGURE 5-10 Calculated temperature and measured temperaturein underwater flux-shielded weld �00 psigj
900
800
700
800
500
400
9000
800
700
600
500
400
0.79 cm
1.11 cm
1.75 cm

5QO
o 400
0 X~ zoo
200 O.I 0.2 0.5 0.4 0.5 0.6 0.7 0.8 0.9 I.OXtcm!
FlGUPE 5-]1 Microhardness readings in underwaterflux-shie1ded weld with damp flux � psigj
welds are to be obtained.
5. 4 Summar and Conclusion of Task 3
�! It was demonstrated that the deep-sea underwater velding simula-
tion facility installed at N.E.T. works satisfactorily. Weids
were made automatically by merely pressing an appropriate button
on the control device outside the presence tank. Welds were
made using gas metal-arc and flux-shielded arc processes in
dry and wet conditions at pressures up to 300psig which corre-
sponds to 700 feet deep water.
�! Prasad studied effects of pressure on GMA and FSA welds in dry
environment. He examined the pressure effects on various sub-
jects including welding parameters, weld bead appearance and
defects, penetration, and hardness. The test conditions vere
rather limited, however. Additional tests are needed to make
conclusive statements on the pressure effects.
� 65-
�! Erickson studied effects of pressure on FSA welds underwater.
The most important conclusion of his work was that it demon-
strated that the flux-shielded process is a very promising
technique to be used for deep-sea applications. Melding arcs
were metallurgically sound. Hardnesses of the weld metal and
HAZ were not very high and no martensitic structures were ob-
served. In order to produce sound welds it is important to
keep the flux dry. Erickson examined the pressure effects on
various subjects including welding parameter, weld bead appear-
ance and defects, penetration, hardness, and heat flow charac-
teristics. The best conditions were limited however. Additional
tests are needed to make conclusive statements on the pressure
effects.