of rrdiofrequency radiation i/i and replicrtion(u) … · (huberman and horwitz, 1973). free ends...
TRANSCRIPT

ID-A133 526 EFFECT OF RRDIOFREQUENCY RADIATION ON DNA DUPLEX i/iSTABILITY AND REPLICRTION(U) MISSOURI UNIV-ROLLRR F BROWN ET AL. RUG 83 USRFSRM-TR-83-20
UNCLASSIFIED F336i5-8 -C-8613 F/G 6/18 NL
mmEEEmmlmlmnEmEEmmmmmmmmmEEEnEEEEEnlEEEEI..'.-l

&.3 1 22
11111L 5 1.11.
MICROCOPY RESOLUTION TEST CHARTNATIONAL BUREAU OF STANDARDS-1963-A

Report USAFSAM-TR. 83-20
*--EFFECT OF RADIOFREQUENCY RADIATION ON DNAK'*DUPLEX STABILITY AND REPLICATION
" Rogr F. Brown, Ph.D.Sta.e V. Marshall, Ph.D.
Life Sciences and Electical Engineering DepartmentsUniversity of Missouri-RollbRob, Missouri 65401
DTICS ELECTE
OCT 13 83
- AAust 1983 B
inal Report for Peo 30 Apil 1981 - 30 November 1982
Approved for public release; distribution unlimitedi.I
0. Prerfor
USAF SCHOOL OF AEROSPACE MEDICINEAerospace Medical Division (AFSC)Brooks Air Force Base, Texas 78235
.- 8-.- * .03-
- *,~~. *. . 7 r r
NOTICES
This final report was submitted by the University of Missouri-Rolla,Departments of Life Sciences and Electrical Engineering, Rolla, Missouri 65401,under contract F33615-80-C-0613, job order 7757-01-84, with the USAF School ofAerospace Medicine, Aerospace Medical Division, AFSC, Brooks Air Force Base,Texas. Dr. David N. Erwin (USAFSAM/RZP) was the Laboratory Project Scientist-in-Charge.
When Government drawings, specifications, or other data are used for anypurpose other than in connection with a definitely Government-related procure-ment, the United States Government incurs no responsibility or any obligationwhatsoever. The fact that the Government may have formulated or in any way
* supplied the said drawings, specifications, or other data, is not to beregarded by implication, or otherwise in any manner construed, as licensingthe holder, or any other person or corporation; or as conveying any rights orpeimission to manufacture, use, or sell any patented invention that may inany way be related thereto.
The animals involved in this study were procured, maintained, and used inaccordqnce with the Animal Welfare Act and the "Guide for the Care and Use dfLaboratory Animals" prepared by the Institute of Laboratory Animal Resources -National Research Council.
The Office of Public Affairs has reviewed this report, and it is releas-able to the National Technical Information Service, where it will be availableto the general public, including foreign nationals.
This report has been reviewed and is approved for publication.
DAVID N. ERWIN, Ph.D. JONC.Project Scientist oSupervisor
ROYCE MOSER, Jr.Colonel, USAF, MCCommander
• ". , ".-.- . "..- .. .. . . " ... -. . -. ". ,. , -'-- .. *-- - , • , . ._ - i .i. I-: .-

1INr1 ArTFTFnSECURITY CLASSIFICATION OF THIS PAGE (When Date Entered)
REPORT DOCUMENTATION PAGE READ INSTRUCTIONSBEFORE COMPLETING FORM
. REPORT HUMMER 2. GOVT ACCESSION NO, 3. RECIPIENT'S CATALOG NUMBER
USAFSAM-TR-83-20
4. TITLE (and Zubllo) S. TYPE OF REPORT & PERIOD COVERED
Final ReportEFFECT OF RADIOFREQUENCY RADIATION ON DNA 30 Apr 1981-30 Nov 1982DUPLEX STABILITY AND REPLICATION G. PERFORMING OG. REPORT NUMBER
7. AUTHOR(&) 4. CONTRACT OR GRANT NUMIER(s)
Roger F. Brown, Ph.D. F33615-80-C-0613Stanley V. Marshall, Ph.D.
S. PERFORMING ORGANIZATION NAME AND ADDRESS tO. PROGRAM ELEMENT. PROJECT. TASKAREA & WORK UNIT NUMIERS
Life Scielces and Electrical Engineering Depts. 62202-F
University of Missouri-Rolla 62202-FRolla, Missouri 65401 7757-01-84
11. CONTROLLING OFFICE NAME AND ADDRESS 12. REPORT DATE
USAF School of Aerospace Medicine (RZP) August 1983Aerospace Medical Division (AFSC) IS. NUMBEROF PAGES
Brooks Air Force Base. Texas 78235 4214. MONITORING AGENCY NAME & ADORESSif dilterent from Controllig Office) IS. SECURITY CLASS. (of thle report)
Unclassified150. DECLASSIFICATION/DOWNGRADING
SCHEDULE
I. DISTRIBUTION STATEMENT (of this Report)
Approved for public release;-distribution unlimited.
17. DISTRIBUTION STATEMENT (*I the abstract entered in Block 20, If different from Report)
IS. SUPPLEMENTARY NOTES
It. KEY WORDS (Continue on reverse ide if necesary and identify by block number)
Radiofrequency radi ationDNA replication in vivoSister chromatid exchangeDNA degradationMice
20. ABSTRACT (Continue on reverse side If neceseary nd Identify by block nmmber)Three experimental approaches were used to determine if absorption of
continuous wave radiofrequency (RF) photons affect the stability and/orreplication of mammalian DNA. Two of the approaches involved experimentswith female CD-l mice, including analyses of RF effects on sister chromatidexchanges (SCE) in bone marrow as one index of DNA stability and RF effectson replication of the animals' marrow and spleen DNA. The third (over)
DD IOAR 1473 EDITION OF I NOV SS IS O0SOLETE UNCLASSIFIEDSECURITY CLASSIFICATION OF THIS PAGE (When Data Entered)
I

-. -~~VW . ... . .. . .. . ..7
UNCLASSIFIEDSECURITY CLASSIFICATION OF THIS PAGE(IWhn Date Entered)
20. ABSTRACT (Continued)
experimental approach consisted of tests to determine if*RF exposure causes* " partial denaturation of double-stranded DNA, monitored in this study by sus-
ceptibility of the polymer to hydrolysis by single-strand-specific S] nucleaseThe substrate DNA used for thib cell-free assay was isolated from Chinese ham-ster ovary cell cultures labeled with radioactive deoxynucleosides. Irradi-ated subjects were exposed to incident RF field densities adjusted to beequivalent to absorbed doses in mice of 4 W/kg at each of three test fre-quencies: 400, 800, and 1200 MHz,! A transverse-electromagnetic-mode chamberwas used for 400-MHz exposures, and two small anechoic chambers were used at800 and 1200 MHz. Predetermined adjustments of the temperature of ventilatingair forced through the chambers permitted maintenance of the core temperatureof the RF-irradiated animals at the same level as that of the sham-exposedcontrols. Ahe results revealed no reduction in the level of DNA synthesis ineither the spleen or the bone marrow of animals exposed to any of the threetest frequencies, also no increase in the number of SCE. However, a slight,but consistent, increase in the nuclease susceptibility of isolated DNAappeared to be a result of RFR exposure. This effect was observed at allthree of the irradiation frequencies.'1
/
Accession For
NTIS CGA&IDTIC TAB
UnnnnouincedJu3t if Cnti n-o.
Distribution/
Availability CodesAvail and/or'
loat Special
UNCLASSIFIED5ECURITY CLASSIFICATION OF THIS PAGE (eh Data E t e
t :, .. **..,. . .. .°.. .T ./ .. ..... . -.-.... .,.---.-.. ... -

TABLE OF CONTENTSPage
INTRODUCTION. .. ... ..... .... ..... ..... ..... .. 3
EXPOSURE DEVICES AND INSTRUMENTATION. .. ... ..... ..... .... 4
Radiofrequency Exposure and Ventilation Systems. .. ... ....... 4Instrumentation .. .. .... ..... ..... ..... ..... 8
*TECHNICAL APPROACH .. .. .... ..... ..... ..... ....... 9
Animals. .. ... ..... ..... ..... ..... .... .. 9Chemicals. .. ... ..... ..... ..... ..... ...... 9SAR and Power Density Measurements. .. ..... ..... ..... 9Core Temperature Measurements .. .. .... ..... ..... ... 11Intravenous Infusion .. ... ..... ..... ..... ..... 11DNA Synthesis Measurement .. .. .... ..... ..... ..... 12Sister Chromatid Exchange Analysis in Vivo .. ... ..... .... 13SNuclease Assay .. .. .... ..... ..... ..... .... 14
*RESULTS AND DISCUSSION .. .. .... ..... ..... ..... .... 15
Power Density and Field Uniformity .. ... ..... ..... ... 15SAR Measurements. .. ..................... 15Airflow through TEM and Anechoic Chambers............21Core Temperature: RFR Subjects. .. ... ..... ..... .... 21Sister Chromatid Exchange: RFR Effects .. .. .... .... .... 27DNA Synthesis: RFR Subjects. .. ..... ..... ..... ... 34S, Hydrolysis of DNA: RFR Effects .. .... .... ..... ... 36
CONCLUSIONS. .. ..... ..... .... ..... ..... ..... 40
ACKNOWLEDGMENTS. .. ..... ..... ..... .... ..... ... 40
REFERENCES. .. ... ..... ..... ..... .... ..... ... 41
List of Figures and TablesFigure
1 TEM chamber system for RF exposures at 400 MHz .. ... ....... 5
2 Anechoic chamber system for RF exposures at 800 and 1200 MHz . . .6
3 Interior of anechoic chambers .. .. ..... .... ..... .. 7
44 Protocol for injecting radioactive precursors to label DNA inthe spleen and marrow tissue of mice. .. ..... ..... ... 12
5 Protocol for administering BrdUrd and colcemid to mice forSCE analysis in marrow tissue. .. ... ..... .... ..... 13

.... -, . , . .. . _ o . . * : ... . . -. . 2' .- _ .. .-. - . . . . - .- -. -- "-. -_ .-.- '---
Figure Page
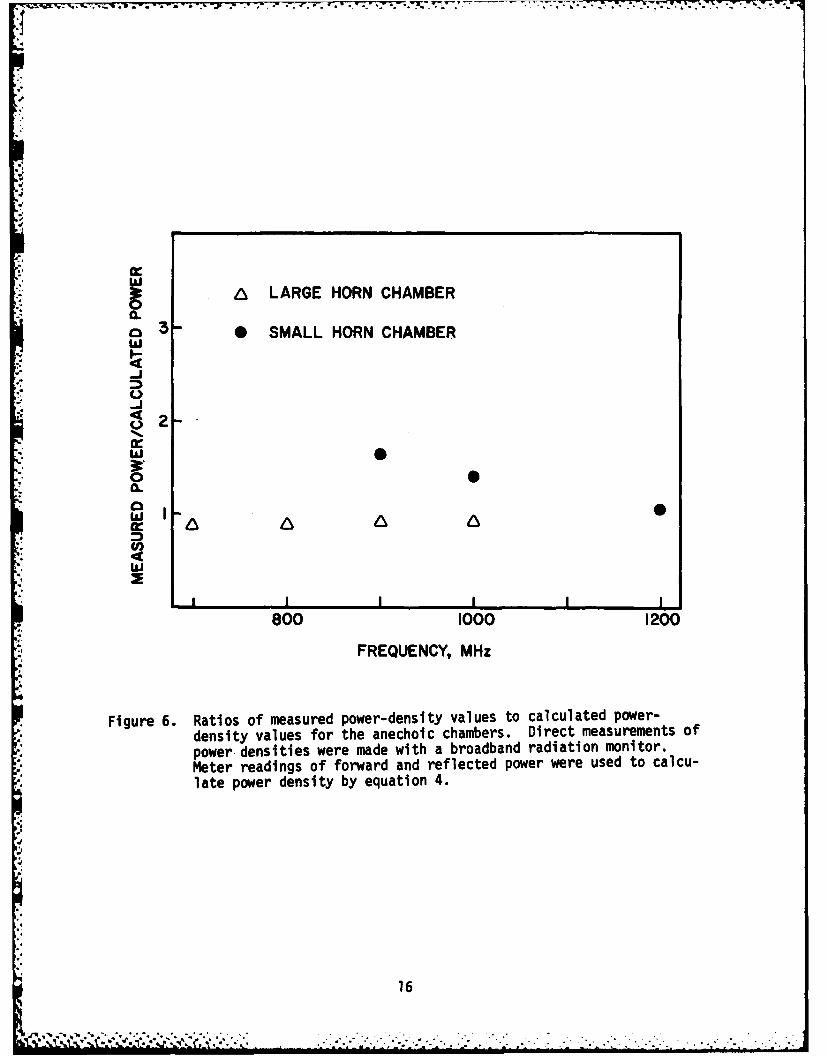
6 Ratios of measured power-density values to calculated power-density values for the anechoic chambers .... ............. 16
7 Power densities along the work surface of the large-hornanechoic chamber ...... .. ......................... 17
8 Power densities along the work surface of the small-horn
anechoic chamber ...... ......................... .18
9 SAR values measured for mouse cadavers exposed to 600-1200 MHz . 19
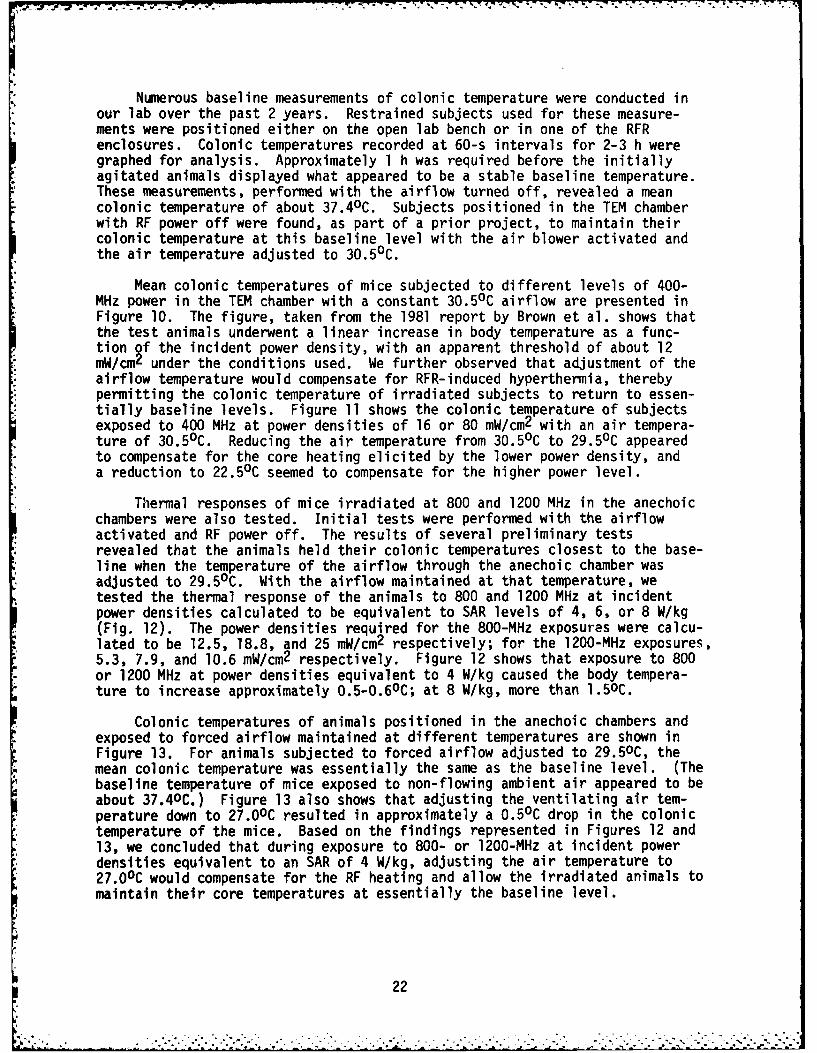
10 Change in colonic temperature of mice exposed to 400 MHz ...... 23
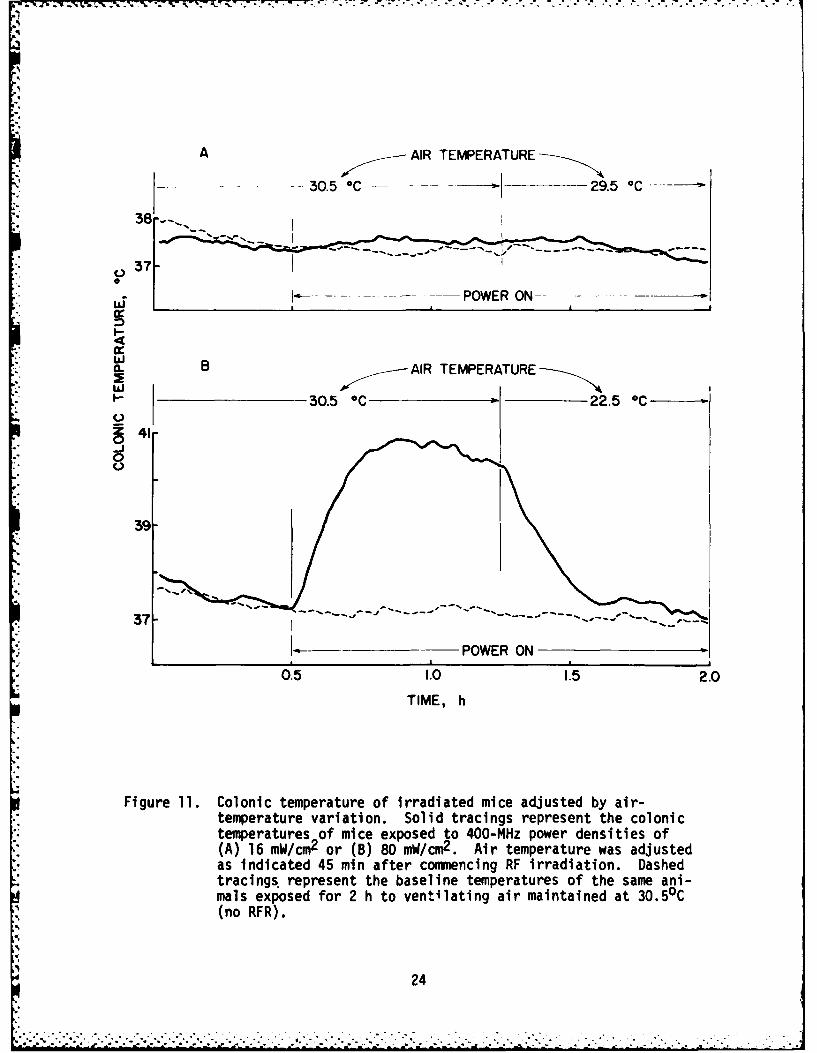
11 Colonic temperature of irradiated mice adjusted by air-temperature variation ..... ... ...................... 24
12 Change in colonic temperature of mice exposed to 800 and1200 MHz ...... .. ............................. .25
13 Colonic temperatures of mice exposed to different temperaturesof forced airflow ventilating the anechoic chambers .. ....... 26
14 Appearance of fluorescent-plus-Giemsa-stained metaphasechromosomes from the bone marrow of mice ... ............. .28
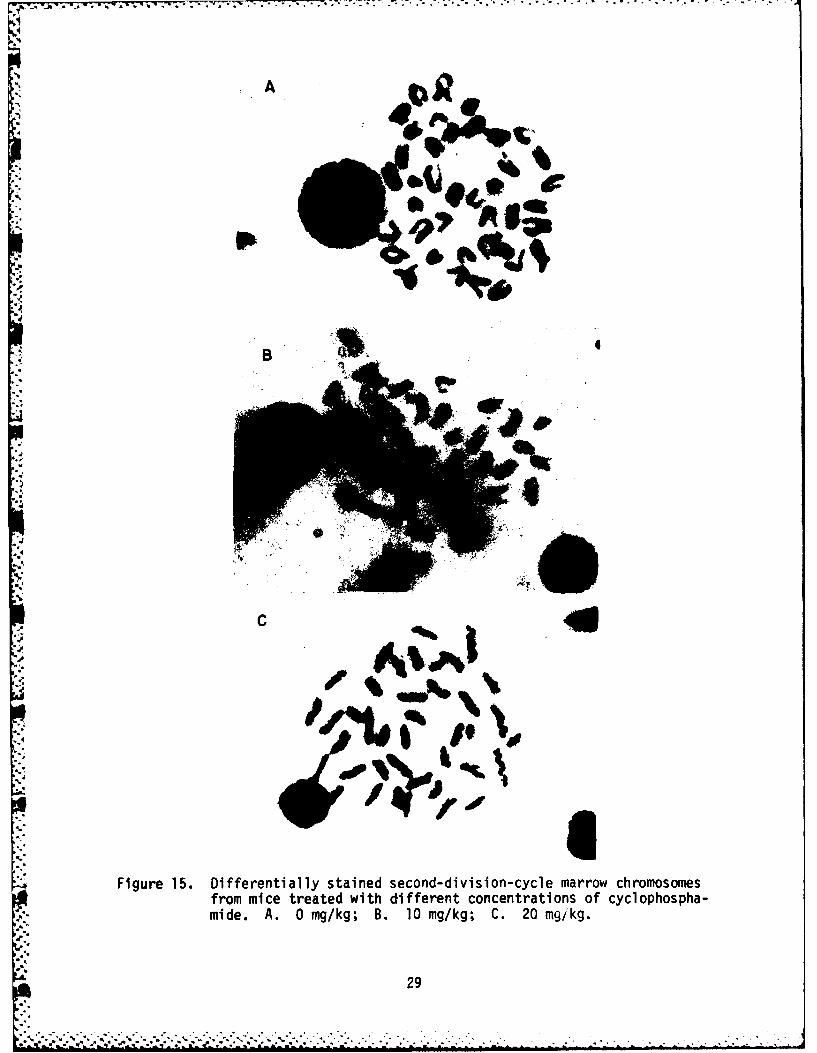
15 Differentially stained second-division-cycle marrow chromosomesfrom mice treated with different concentrations ofcyclophosphamide ...... ....................... .. 29
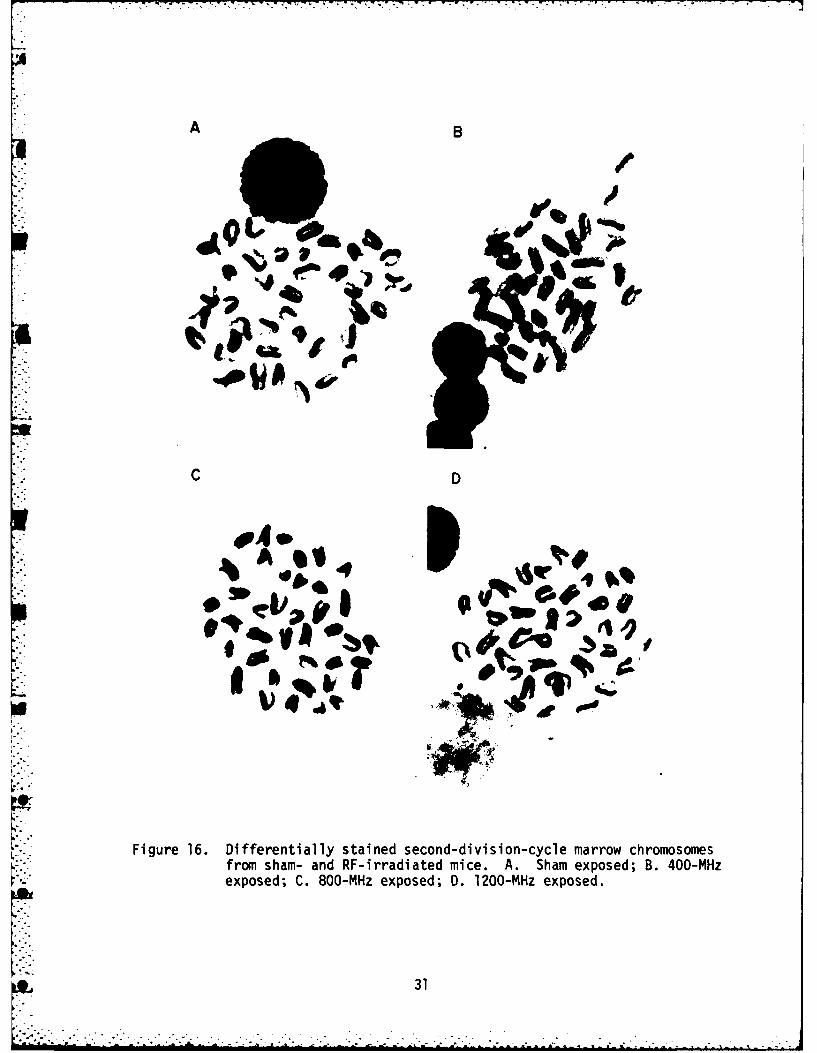
16 Differentially stained second-division-cycle marrow chromosomesfrom sham- and RF-irradiated mice .... ............... .31
Table
1 Cyclophosphamide induction of SCE in bone marrow of mice .... .. 30
2 Number of SCE observed in marrow chromosomes of RFR- andsham-exposed mice ..... ... ........................ 32
3 Mean comparisons of SCE frequencies in marrow cells of RFR-and sham-exposed mice ..... ... ...................... 33
4 Effect of hydroxyurea on formation of spleen DNA in vivo:3H/14C ratios used to assess relative levels of DNA synthesis . . 34
5 Relative levels of DNA synthesis in sham- and RFR-exposed mice . . 35
6 Test of DNA type used as substrate for Sl hydrolysis ........ 37
7 Effect of RFR exposure on hydrolysis of 3H-DNA by S1 nuclease . . 39
° ' °" i i" "" ' " % • ° *= ' ,i °. - ' " '.D '. % °.e",% o" " o' ,".° . ' ," '- . -"' , -"'""% . - -""2"

EFFECT OF RADIOFREQUENCY RADIATION ON DNA DUPLEX STABILITY AND REPLICATION
INTRODUCTION
Results of recent theoretical analyses by Prohofsky and colleagues (Kohliet al., 1981; Mei et al., 1981) indicate that RFR absorption by double-strandedDNA excites various vibrational responses in the macromolecule, including bend-ing, torsion, and compression. These investigators have particularly focusedon vibration and hydrogen-bond stretching near free ends in the strands. Thelevel of RFR theoretically absorbed by a synthetic polydeoxynucleotide, double-helical poly dG-poly dC, appears sufficient to induce melting of hydrogenbonds between the complementary bases of five nucleotide pairs bordering thetermini (Putnam et al., 1981). This partial separation of strands at freeends is also thought to be frequency specific, possibly occurring in the 750-to 900-MHz range (E. Prohofsky, personal communication, 1981).
To assess the likelihood of RFR-induced strand separation at free endsby a mechanism such as that proposed by Prohofsky and colleagues, we must, inpart, consider the nature of eukaryotic chromosomes. There is evidence of nogaps or free ends in Go cells. Electron micrographs reveal chromosome-to-chromosome connections in human metaphase cells, suggesting that nuclear DNAmay be a continuum (Lampert et al., 1969). Also, the DNA of Go cells isresistant to hydrolysis by Sl nuclease, an enzyme that acts at gap regions(Collins, 1977). However, replicating chromosomes have numerous free ends asevidenced both by susceptibility to Sl nuclease (Collins, 1977) and by theformation of Okazaki fragments that are subsequently joined by a ligase(Huberman and Horwitz, 1973). Free ends are also present during excision andrepair of damaged segments (Hanawalt et al., 1979). DNA undergoing repli-cation, repair, or recombination would seem, therefore, the most likely targetfor the hypothetical RFR-induced denaturation of termini.
From a biologic point of view, destabilization of DNA termini by RFR-enhanced vibration would be potentially hazardous. The purpose of thisinvestigation was to search for evidence of frequency-specific RFR effects onthe replication and stability of mammalian DNA. Three different approacheswere used to experimentally test for DNA perturbations at frequencies of 400,800, and 1200 MHz continuous wave (CW). Two of the approaches involved invivo tests with mice, and the third was a direct test for RFR-induced denatur-ation of isolated duplex DNA.
The first approach in this investigation focused on RFR induction of sis-ter chromatid exchange (SCE) as an indirect test for strand separation. Therationale behind this approach was that an increased number of recombinationevents, including SCE, would be predicted if RFR exposure causes DNA strandsto partially denature at free ends. This would be manifested as an increasedfrequency of SCE in the marrow cells of the irradiated animals.
The second approach involved analysis of RFR effects on DNA replication individing cells; specifically, the bone marrow tissue and spleen of intact mice.
3

The reasoning behind this portion of the investigation was that any RFR-induced denaturation at growing points in replicating DNA would impede elon-gation of the segments of nascent DNA, resulting in a decrease in total DNAsynthesis. Indeed, exposure to 1000-MHz waves has been reported to partiallyinhibit DNA replication in murine leukemia cells (Chang et al., 1980).
.* The third approach was to look for direct interaction of RFR with DNA,resulting in enhanced hydrolysis of the macromolecule by Sl nuclease. RFR-induced denaturation of duplex DNA at exposed ends should render these single-stranded regions susceptible to the action of Sl nuclease, an enzyme thathydrolyzes single-stranded DNA to 5'-mononucleotides but does not degradedouble-stranded DNA (Ando, 1966; Vogt, 1973). This enzymatic degradation wasmonitored as release of acid-soluble radioactivity from 3H-labeled duplex DNAexposed to RFR during incubation with Sl nuclease.
An existing transverse-electromagnetic-mode (TEM) exposure chamber wasused for RF irradiation of mice at 400 MHz. Two specially constructed ane-choic chambers were used for the RF exposures at 800 and 1200 MHz. IncidentRF power densities were adjusted at each of the three test frequencies to beequivalent to absorbed doses of 4 W/kg for mice. Air maintained at pre-determined temperatures was forced through the sham and RF enclosures toalign the core temperatures of the irradiated animals to essentially the samelevel as that recorded for the sham-exposed control subjects. RF-irradiatedcapillary tubes containing the DNA-S1 nuclease reaction mixtures were sub-jected to the same incident power densities used for the animal exposures,with air temperatures adjusted to the same level as that for controlreactions--37.40 C.
An underlying requirement of this investigation was uniform power densityof the RF field for animal exposures. This requirement limited the practicalnumber of mice that could be positioned simultaneously in our anechoic cham-bers to four. Hence, each replication was designed to include four RFR-exposed and four sham-exposed mice. RFR exposures were with the subjectsoriented parallel to the E-field.
EXPOSURE DEVICES AND INSTRUMENTATION
Radiofrequency Exposure and Ventilation Systems
Two different irradiation systems were used for RFR exposures in thisinvestigation. One was built around a TEM chamber (model 8801, Narda) andwas used for exposures in the 200- to 475-MHz range. The second included twospecially constructed anechoic chambers used for exposures in the 600- to1200-MHz range. The 200- to 475-MHz system (Fig. 1) has been described indetail previously (Brown et al., 1981).
The 600- to 1200-MHz exposure system (Fig. 2) included small anechoicchambers constructed as two identical 1.22- x 1.22- x 1.22-m plywood boxeslined with microwave absorbant material (type AAP-12, Advanced Absorber Pro-ducts) as shown in Figure 3. The corners of the enclosures were filled with20-cm-thick absorbant material (not shown in Fig. 3) to reduce RF leakage.
4
S - * . o • . . - , . * .

FREG. COUNTER HP POWER METERS LOGGING MULTIMETERS
CW SOURCE P t
CHAUSEREXHAUST1
COETEMP.
/DUALR+~ CORE TEM
TEHERMINITOR
Figue 1 TENchaber ystm fo RFexpsrsaM0 ~. Cmoet ocontrolled-temperaturERniainaealoilsrtd
COETEP
* ~ ~ _ EF.... R ***** *----- .Y
*.OO d-. . . .. . ..... j** .*AIR~ FA
J X

L ~LOGGING MULTIMET]ERS
L.--
XTEMPERATUREEMP
TUNE
TEMP.CONTR900-LE0 MONTOR
(OR SHAM)
600-1200 MHz(OR SHAM)
L T
.4E
THRISO
THERMIST6

* TUNER
I -
FEEDHORN
WORK-~ DECK
Figure 3. Interior of anechoic chambers. Power meters PMl and PM2 monitorforward and reflected power respectively. Distance d is 43 cm.
7

A feedhorn, a coax-waveguide adapter, was at the top of each chamber. In bothchambers the aperture of the feedhorn was positioned 84 cm above the plywoodfloor and 45 cm above a Styrofoam work deck (Fig. 3), the subject-exposuresurface. One of the anechoic chambers was equipped with a 33.65- x 17.15-cm-aperture horn for 600- to 900-MHz irradiation, and the other with a 22.45- x11.43-cm-aperture horn for 900- to 1200-MHz operation. ,The aperture of eachhorn, oriented downward, was covered with a 61- x 61-cm masonite panel suchthat, from the Styrofoam deck, both horns appeared identical. When the cham-ber with the larger horn was used for irradiation in the 600- to 900-MHzrange, the second chamber served as a sham enclosure; for 900- to 1200-MHzoperation, the roles were reversed. Lighting in each chamber was provided bytwo 15-W bulbs mounted on the masonite panel on either side of the irradi-ating horn (Fig. 3).
Removable access ports, lined with absorbant material, permitted entryfrom the side of each chamber. The integrity of the absorbant surface wasmaintained when the plugs were in place.
The anechoic chambers were ventilated by forced airflow (see Fig. 2).A single blower forced room air through both an RFR exposure chamber and itscorresponding sham enclosure. The ventilation system was designed to beeasily connected to either the TEM exposure system or the anechoic chambers.A small (25 x 7.6 cm) rectangular opening for inflow air was in one wall ofthe anechoic chambers; an opening of similar size for exhaust air was in theopposite wall. Inflow air, directed to the work surface via a rectangularcardboard channel (25 x 7.6 cm, cross section), was tuned such that the vol-ume of air flowing across the area of the work deck occupied by the test sub-ject was nearly uniform (within about ± 10%).
The ventilating air was forced through a preheater that warmed it toabout 260 C. The preheated air was split by a T-connector, passed through twoseparately controlled heaters, and directed via flexible hose to the inflowport of each chamber (Figs. 1 and 2). A thermistor mounted on the exhaustport for each chamber monitored the exhaust air temperature. A feedbackthermistor, the sensing element for the temperature-controlling electronics,was located in the funnel attached to the inflow port (Figs. 1 and 2). Thetemperature controller, driving the heating elements located in the air hosesleading to each chamber, held the temperature to ± 0.20C for any temperaturebetween about 260C and 330C.
Instrumentation
RF power was supplied by a CW generator (model 250C, Epsco) used witheither a model M8045H (200-700 MHz) or a model M8060H (700-1200 MHz) plug-inoscillator, each capable of a maximum nominal power output of 250 W. For the600- to 1200-MHz system, the RF generator was connected via RF 213/U coaxialcable through a dual directional coupler (either a model 3020A or model 3022,Narda) to a double-stub tuner (model 1778A, Maurey), which was in turn con-nected to the feedhorn of the anechoic chamber used for RFR exposure. Theforward and reflected powers were measured by power meters (model HP 435A,Hewlett-Packard) with power sensors (model HP 8482H, Hewlett-Packard)
8

connected to the directional coupler ports. Direct measurements of RF fieldstrength were made with a broadband isotropic radiation monitor (model 8606,Narda) fitted with a 0.3- to 26-GHz probe (model 8623, Narda).
Animal core temperatures were measured with two noninterfering tempera-ture monitors (model 101, Vitek). Exhaust air temperature from each ane-choic chamber was measured directly by a thermistor probe connected at theexhaust port of each enclosure. Two logging multimeters (model HP 3467A,Hewlett-Packard) were used to record power levels, exhaust air temperature,and, in some experiments, animal core temperatures. An airflow meter (model1650, Thermo Systems) monitored the amount of air flowing through both theTEM chamber and the two anechoic chambers.
TECHNICAL APPROACH
Animals
Female strain CD-I mice were purchased from Charles River Laboratories(Portage, MI) and housed in groups of 6 to 8 in polycarbonate cages coveredwith polyester filter bonnets. Their environment was controlled to maintaina 12/12-h light/dark cycle, an air temperature of 220-240 C, and a humidityof about 40%. Purina Lab-Chow and water were provided ad libitum. The ani-mals were 7-10 weeks of age when experiments were performed. Those includedin each experiment were matched in weight, within ± 10%, and date of birth.
Chemicals
[14C]Thymidine ([14C]TdR; 53 mCi/mM) and [3H]deoxycytidine ([3H]CdR;27 Ci/mM) were purchased from New England Nuclear. [3H]Thymidine ([IH]TdR;15 Ci/mM) was from Schwarz/Mann. 5'-Bromodeoxyuridine (BrdUrd) and Hoeschtdye 33258 were obtained from Calbiochem-Behring. Colcemid, cyclophosphamide,and hydroxyurea were products of Sigma. Sl nuclease was purchased from MilesLaboratories, and Hae III restriction endonuclease was a product of BethesdaResearch Laboratories. Sorensen's buffer tablets and R66 Giemsa stain wereobtained from Bio-Medical Specialties. All other chemicals were reagent grade.
SAR and Power Density Measurements
SAR measurements were made at several frequencies between 600 and 1200MHz, using mouse cadavers as test subjects. Both Dewar calorimetry and thenoninterfering temperature probe technique (Durney et al., 1980) were used forthe SAR measurements.
The vessels used for the calorimetric measurements were half-pintcapacity Dewar flasks (model 21', Thermos) with a 3/4-in. layer of poly-urethane foam molded around the vessels for added insulation. The thermalcapacity of each Dewar was found to be 61 J/°C when equilibrated with 35 mlof water. Test animals were killed by cervical dislocation, weighed, and
9

cooled to near room temperature by exposure to forced airflow. The cadaverswere placed in insulated lossless containers (Styrofoam) and positioned inone of the RF chambers. After irradiation for 10 min with a known inputpower, the cadavers were immediately removed to the Dewars and allowed 1.5 hto reach thermal equilibrium with 35 ml of water. Frequent gentle agitationwas used to augment the equilibration. The temperature of the cadaver at themoment of insertion in the Dewar was calculated using the formula describedby Durney et al. (1980).
Te = Up + Ceme)TF - TI) + TF (1)
where: Zp = thermal capacity of Dewar = 61 J/°C
ce = specific heat of water = 4185 J/°C per kg
me = mass of water in Dewar = 0.035 kg
TF = final temperature of water, Dewar, and mouse
TI = initial temperature of water and Dewar
ms = mass of the mouse (0.025 to 0.030 kg)
cs = specific heat of mouse = 3448 J/°C per kg
The SAR for the mouse is given by:
SAR "cs(Te(exposed) " Te(sham)) W/kg (2)exposed time in seconds
Temperature changes in RF-irradiated test subjects were measured byN a noninterfering technique using the Vitek 101 probe. SAR was calculated by
multiplying the per second increase in temperature of each irradiated subjectby its specific heat (for mice, 3448 J/°C per kg). Thus,
SAR = 3448 (J) W/kg (3)
where AT is the temperature rise in °C and At is the duration of irradiationin seconds. The rate of temperature increase was measured by two methods andcompared. In one case the initial core temperature was subtracted from themaximum core temperature (reached a short time after the RF power was turnedoff), and then divided by the duration of irradiation. A slightly differentapproach was to measure the slope of the temperature rise after steady-statetemperature rise appeared to be reached. These two methods gave essentiallythe same result.
10
.°. ..-

-. ~~~~. 7.*- -
For normalized SAR, the calculated SAR values were divided by the powerdensity incident on the subject. The power density is given by:
Pd = 0.65 A Pt W/m2 (4). A2d2
where A is the horn aperature in m2, Pt is the power in watts radiated fromthe horn, X is the wavelength in meters, and d is the distance from thecenter of the subject to the horn aperture. The radiated power, Pt, is foundfrom measurements of forward and reflected power as recorded by power metersPMl and PM2 respectively. Referring to Figure 3,
pt = (pMI) l O(Kf- )/lO - (PM2)lO(Kr+L)/lO (5)
where Kf and Kr are the coupling factors of the directional coupler portsexpressed in dB, and L is the cable loss between the directional coupler andfeedhorn, also expressed in dB. Power meter PM1 monitors forward power; andPM2, reflected power.
Core Temperature Measurements
Colonic-temperature measurements were made in unanesthetized mice (25-29 g). Each animal was secured in a Plexiglas restraining cage, and the tipof a Vitek probe was inserted 1 cm into the rectum. The probe was held inplace by taping it to the support bar of the Plexiglas cage. Colonic temper-atures were recorded at 1-min intervals for 2-3 h with the animals maintainedunder various conditions. These included baseline recordings (no RF power)during exposure to nonflowing ambient air and recordings during exposure toforced airflow both in the absence and presence of RFR. Colonic temperatureresponses to variation of air temperature were also monitored.
Intravenous Infusion
Solutions of BrdUrd and radioactive thymidine were given intravenously(v) to the test animals. The specially constructed Plexiglas cages used torestrain the animals are described elsewhere (Brown et al., 1981). Someexperiments in this study involved iv infusion concomitant with RFR exposure,requiring substitution of nonmetallic materials for conventional needles toavoid perturbations of the E-field. This requirement was satisfied by usingTeflon cannulae. A sharpened 28-gauge stainless-steel wire was inserted ina lateral tail vein and used to guide a 3-cm cannula, prepared from 0.038-cm(l.d.) Teflon tubing, into the vessel as described by Brown et al. Aftercompleting the cannula insertion, the steel guide was removed and theexposed end of the cannula was connected to a 150-cm length of Teflon tubingattached to a saline-filled 1-cc syringe. A syringe pump (model A-D, Razel)was used to introduce infusion solutions into the animals at a flow rate of0.2 ml/h. The Teflon cannula permitted routine, continuous iv infusions forabout.26 h.
11
°-,. ,. o . ................... .*. .

Other in vivo experiments involved iv infusions for 2-3 h immediatelyprior to RFR exposure. For these short-term infusions, a 26-gauge stainless-steel needle attached to a 150-cm length of tubing was inserted in a lateraltail vein of a restrained animal. Saline was infused at 0.2 ml/h.
DNA Synthesis Measurement
The protocol used to monitor DNA synthesis in intact mice, adapted froma procedure described by Brown et al. (1970), involved dual isotope labeling.Basically, the effect of irradiation was assessed by comparing incorporationof an 31H-labeled DNA precursor during RF (or sham) irradiation with the levelof 14C labeling of DNA before commencing irradiation.
Y" Mice were placed in the restrainers, cannulated as described for short-term infusion, and iv administration of 0.15 M NaCi was initiated. Eachanimal received a single bolus injection of [14C]TdR (0.2 ml; 2.5 VCi/ml)delivered via the cannulation tubing. After 90 min, [3H]TdR (0.2 ml; 50
MCI iCi/ml) was given, the cannula quickly removed, and the animal immediatelytransferred to either an RFR-exposure chamber or a sham-exposure chamber.The time from [3H]TdR injection to placement in the exposure chamber wasabout 40 s. Positive control animals received hydroxyurea (0.1 ml) 5 minbefore the [3H]TdR. Each animal was removed from the chamber and killed bycervical dislocation 20 min after the injection of [3H]TdR. The spleen and
- both femurs were quickly removed to liquid N2. Time from sacrifice tofreezing was about 30 s for the spleen and 90 s for the femurs. The protocolfor injecting radioactive precursors to pulse label DNA in vivo is presentedin Figure 4.
27.0 OC(29.5 C)
(14 C)TdR ( 3 H]TdR
SALINE _ RF STOPINFUSION *j" POWER ON'I" S
0 90 110
TIME, min
Figure 4. Protocol for injecting radioactive precursors to label DNA in thespleen and marrow tissue of mice. The temperature indicated isfor air ventilating the anechoic chambers during 800- or 1200-MHzexposures; the value in parentheses, air temperature in the TEMchamber during 400-MHz exposures. Sham anechoic chambers weremaintained at 29.50 C; the sham TEM chamber, at 30.50 C.
12
*~~.*** ~ ~ ~ r e ... . . . .. . . .

Spleen specimens were thawed and homogenized in 9 volumes of 0.1 Mcitric acid with a Dounce homogenizer. The homogenate was passed througha 110-mesh nylon screen, and the filtrate was centrifuged for 10 min at900 g. The pellet was resuspended in citric acid and carefully layered overan equal volume of 0.34 M sucrose-0.18 nt CaC12. The pellet collected bycentrifugation at 900 g was dissolved in 1 ml of 0.1 M NaOH and incubatedfor 30 min at 600C. After cooling, 10 ml of ice-cold 10% trichloroaceticacid was added and the acid insoluble radioactivity collected on WhatmanGF/B glass-fiber filters. The filters were washed with ethyl alcohol, dried,and immersed in 5 ml of a toluene-PPO solution. Radioactivities were assayedin a liquid scintillation counter (model LS 7500 Beckman) and converted todisintegrations per min (DPM) by correcting for 14c overlap into the H chan-nel (about 9%) and sample efficievcies (about 30% for 3H and 62% for 14C).Results were expressed as 3H DPM/ 4C DPM ratios.
Femurs were thawed and flushed with isotonic saline to remove marrowtissue. The pellet of marrow cells collected by centrifugation for 10 minat 900 g was dissolved in NaOH and heated at 600C as described for the spleensamples. Acid insoluble radioactivity was measured, and results wereexpressed as 3H DPM/14C DPM ratios.
Sister Chromatid Exchange Analysis in Vivo
The procedure used to visualize SCE involved BrdUrd labeling of repli-cating DNA followed by differential staining of metaphase chromosomes.Fresh solutions of BrdUrd, 6.5 mg/ml 0.15 M NaCl, were infused in restrainedanimals at a dosage of 50 ug/(g.h) for 24 h, a period sufficient to permitcompletion of two division cycles (Schneider et al., 1978). RFR- and sham-exposures, 8-h total duration, were initiated 1 h after beginning the BrdUrdinfusion. Colcemid, 0.4 ug/g, was given iv 2 h before conclusion of theBrdUrd infusion to arrest dividing cells in metaphase. The protocol forBrdUrd labeling and air temperature adjustments is shown in Figure 5.
- 29.5 OC -- w 27.0 oC(30.5 C) (29.5 C) COLCEMID
8rd rd-*--RF POWER ON---* IO
,-BrdUrd STOP
0 I 9 22 24
TIME, h
Figure 5. Protocol for administering BrdUrd and colcemid to mice for SCEanalysis in marrow tissue. Temperatures indicated are for airventilating the anechoic chambers used for the 800- and 1200-MHzexperiments; values in parentheses, air temperatures in the TEMchamber for the 400-MHz experiments. Sham-irradiation enclosureswere maintained at temperature levels used during the first hourof 'the BrdUrd infusion. Forced airflow was terminated at theconclusion of the RFR exposure.
13
' ' ' '', ,',*"'." . ., ." " " *. .. , ' '*- ~ '' - -i . , . , .. I I. . . .
fromAnimals were killed by iv injection of air. Femurs were quickly removed
from each animal, and marrow cells were collected by forcing hypotonic KCI(0.06 M) through the marrow channels. After a 30-min incubation at 370C, theswollen cells were pelleted by a 400-g centrifugation and resuspended infixative, 3:1 methanol-acetic acid. Resuspension in fixative was repeatedtwice. Metaphase spreads were prepared by placing drops of the cell sus-pension on cold wet slides as described by Lubs et al. (1973).
Differential staining of sister chromatids was by the fluorescence-plus-Giemsa method of Perry and Wolff (1974) as modified by Minkler et al. (1978).After aging for at least 4 days, slides were stained for 30 min in 10 ug/ml
". Hoescht 33258 in Sorensen's buffer, pH 6.8. The slides were rinsed in DH20,*: mounted in Sorensen's buffer, and placed under a UV-light source (model M-218,
Colight) equipped with a 400-W mercury lamp. Ultraviolet exposure was for 45min at a distance of 46 cm. Coverslips were then removed and the slides wereincubated 1 h at 520C in 0.3 M NaCl-0.0l M Tris, pH 10. Slides were rinsed
4 in DH20 and stained for 5-10 min in 5% Giemsa in Sorensen's buffer. Air-dried slides were cleared with xylene and coverslips were mounted.
Slides were viewed under a Zeiss standard microscope fitted with a 35-mmphotomicrography system (model PM-IO, Olympus). Differentially stainedchromosomes of second-division-cycle cells (at least 15 for each animal) werephotographed on Kodak Tech-Pan film. Prints of each metaphase spread wereprepared, coded, and examined blind for SCE scoring.
.l Nuclease Assay
As substrates for the nuclease assay we chose 3H-DNA isolated from CHO-K1 cells labeled with [
3H]TdR or [3H]CdR. DNA was isolated by proteinase Kdigestion of cellular lysates, using a modification of the procedure of Gross-Bellard et al. (1973). Briefly, cells were lysed and digested by a 16-hincubation in buffer A containing 0.15 M NaCl with 200 pg/ml proteinase K(Beckman). Crude DNA was removed from the lysate by adding two volumes ofcold ethyl alcohol followed by gentle spooling on a glass rod. The DNA wasredissolved in buffer A. Proteinase K was added and the 16-h digestionrepeated. After cold ethyl alcohol was added, DNA was again collected ona glass rod and then redissolved in 0.15 M NaCl. The S nuclease reactions,essentially as described by Ando (1966) and Vogt (19731, consisted of 0.3 MNaCl, 0.1 M ZnSO4 , 5% glycerol, and 25 mM sodium acetate, pH 4.5, plusenzyme and substrate as indicated. Preliminary tests of enzyme and substratewere performed with 0.5-ml volumes. For tests of RFR effects, 0.14-mlvolumes of the reaction mixture were loaded into glass capillary tubes, 4 cmx 1.3 mm (i.d.). The ends of the tubes were sealed with small glass beadsheld in place with silicone tubing, and the tubes were then placed either inan RFR enclosure parallel to the E-field with air temperature maintained at37.40C or in a 37.4 0C water bath. Incubations were for 30 or 60 min.Reactions were halted by placing the tubes in an ice slurry, then adding 1.0ml of 7% TCA to the reaction mixture. The acidified reaction mixture waspassed through either a Millipore filter or a Whatman GF/B glass-fiber filterto separate the acid-soluble and acid-insoluble radioactivities. Aliquotsof the filtrate were counted in Aquasol (New England Nuclear) liquid scin-tillation solution to assess the release of radioactive 5'-mononucleotidesby the nuclease.
14
. . . . . . . .

RESULTS AND DISCUSSION
Power Density and Field Uniformity
Measurements were made of absolute power levels along the work deckwithin each of the two anechoic chambers. The center of the RF probe was5.1 cm above the deck, or about 2.5 cm higher than the center of a cage-restrained mouse. Power density values obtained by direct measurement werecompared with power density values calculated by equation 4. Ratio compari-sons of these values are presented in Figure 6. The measured and calculatedvalues for the large-horn chamber were essentially in agreement. For thesmall-horn chamber these values obtained at 1200 MHz were also in agreement;but at 900 MHz, the power-density value measured for the small-horn chamberwas 65% higher than the corresponding calculated value. Furthermore, theSAR values obtained for subjects exposed to RFR in the small-horn chamberwere higher than the SAR values reported by Durney et al. (1978) for large-mouse models exposed at 900, 1000, and 1100 MHz. The feedhorns are scaledsuch that the wave pattern emitted from the large horn at 800 MHz should bethe same as that from the small horn at 1200 MHz, the 700-MHz pattern forthe large horn the same as that for the small horn at 1050 MHz, etc. We areunable to offer an explanation for the discrepancies with the small horn.Because the anechoic material functions as a more effective absorber athigher frequencies, we might have expected better agreement between themeasured and calculated power density values at higher rather than lowerfrequencies.
The uniformity of the power-density pattern was measured at 800 MHz inthe large-horn chamber and at 1200 MHz in the small-horn chamber. The
results obtained are plotted in Figures 7 and 8. Uniformity was essentiallyas expected from an open-ended waveguide in the TE10 mode. The absence ofany significant cyclic variation of power density as a function of positionon the deck indicates that no significant standing waves were present.
SAR Measurements
SAR measurements obtained by Dewar calorimetry and the noninterferingtemperature-probe technique for subjects exposed to RFR in the anechoicchambers are summarized in Figure 9. The values shown represent normalizedSAR, that is, SAR expressed in relation to the calculated power density.Power density was calculated, using equations 4 and 5, from power-meter read-ings of forward and reflected power. The solid curve in Figure 9 representsaverage SAR values for prolate spheroid models of large mice and was redrawnfrom a similar curve in Figure 38 of the Dosimetry Handbook, 2d ed. (Durneyet al., 1978). Also included, for comparison, is a dashed line representingSAR measurements obtained previously for subjects exposed to 200- to 400-MHzfields in the TEM chamber (Brown et al., 1981). The dashed line has a slopeof 0.7 on the log-log graph and intersects the Dosimetry Handbook curve atabout 900 MHz.
Two points on the graph of SAR data are particularly noteworthy--the800- and the 1200-MHz values. The SAR values we obtained at 1200 MHz by
15
_ .... ....-. ... ...... . --. ... • . . . -•. . .... . . . . . . .
I
" LARGE HORN CHAMBER
3 0- SMALL HORN CHAMBER
-- J--
WI
L
-'I IIII
800 1000 1200
FREQUENCY, MHz
. Figure 6. Ratios of measured power-density values to calculated power-density values for the anechoic chambers. Direct measurements ofpower densities were made with a broadband radiation monitor.Meter readings of forward and reflected power were used to calcu-late power density by equation 4.
16

x3.O x3.4 x3.5 x3.5 x3.5 x3.5 x3.0
x3.0 x5.0 x5.2 x5.5 x5.5 x4.3 x3.0
x3.6 x5.5 x7.5 x8.I x7.5 - x5.2 -x3.0
I I CENTER
x5.4 x6.0 x8.0 E xg.5Sx8.0 x6.0 x3.2
x3.6 x5.5 x7.5 X 8.I x7.5 x5.2 x3.0t4"
x3.0 x5.0 xS.8 x5.5 x5.5 -x4.3 x3.0i 4x3.0 x3.4 x3.5 x3.5 x3.5 x3.5 13.0
'*' ACCESS PORT
Figure 7. Power densities along the work surface of the large-horn anechoicchamber. Measuremnts were made at 800 MHz, and values areexpressed in mW/cm
17
• ... .... .... ..... .. . .. . ..,.. .... .... .. .. . .-.. . , . -, .. .

Lii
x3.5 x4.4 x6.0 x6.8 x6.0 x4.0 -x2.5
x3.6 x6.6 x8.0 x9.8 - x8.2 x5.0 - x2.8
x5.0 x8.4 - xIO.O x12.0 - xIO.O xx7.0 X4.0
CENTER
x5.2 x8.5 xlO.I E x12.0 x9.8 XI X4.2
x5.0 x8.4 x1O.0 x12.0 xI10.0 x7.0 x4.0~t
4"
x3.6 x6.6 - x8.0 x9.8 x8.2 x5.0 x2.84°°
-.-
x3.5 x4.4 x6.0 x6.8 x6.0 x4.0 x2.5
ACCESS PORT
Figure 8. Power densities along the work surface of the small-horn anechoicchamber. Measurements were made at 1200 MHz, and values areexpressed in mW/cm'.
18
'-v..-w..>-.>,: < .. .-

.J I I I I I p1 ' ' 1 '"
2.0
I 1.0-
E
C.CP 0.5-A
T0
IMF oL
0.2 /W,
.1
0.1 .4- -200 500 1000 2000
FREQUENCY, MHz
Figure 9. SAR values measured for mouse cadavers exposed to 600-1200 MHz.Measurements were performed by Dewar calorimetry (0) or the non-interfering temperature-probe technique (A). Each point repre-sents the mean of six determinations, one cadaver per trial; andvertical brackets are standard error of the mean. The solidcurve was redrawn from the Dosimetry Handbook, 2d ed. (Durney etal., 1978) and represents SAR values for prolate spheroid modelsof the large mouse. Also included for comparison is a dashed linerepresenting a best fit to SAR values obtained for mouse cadaversexposed to 200-400 MHz (Brown et al., 1981).
19
-4o*l

both measuring methods are essentially identical and agree with the 1200-MHzpoint on the solid curve redrawn from the Dosimetry Handbook. And at 800-MHz, SAR values by both our methods are similar and again match the SAR valuefor the spheroid models. The disparity between our SAR means at 900 MHz maybe attributed to the use of different anechoic chambers. The calorimetricmeasurements of SAR at 900 MHz were performed with subjects irradiated in thelarge-horn chamberand the small-horn chamber was used for SAR measurement bythe noninterfering temperature-probe method. As noted in the preceding 'sec-tion of this report, for the small-horn chamber the power density measured at900 MHz differed appreciably from the corresponding calculated value. If theactual power density at 900 MHz in the small-horn chamber was higher than thecalculated power density, as suggested by the measurements discussed in thepreceding section, then the mean for the SAR values obtained by the noninter-fering temperature-probe method should lie closer to the spheroid-model SARvalue represented.by the 900-MHz point on the solid curve (Fig. 9). Dis-parity between calorimetric and noninterfering-temperature-probe SAR data wasparticularly striking at 700 MHz. The disparity at that frequency was notthe result of using different chambers--both sets of measurements were per-formed using the large-horn chamber. The reason for this dissimilarity isnot clear.
A major objective of this investigation was exposure of animal subjectsto RE power densities equivalent to an absorbed dose of 4 W/kg at each of thethree test frequencies: 400, 800, and 1200 MHz. Early in the investigationnumerous measurements of incident power densities and SAR were performed andthe values were correlated in an effort to determine the adjustments neededfor the desired absorption level. As shown in Figure 9, the experimental SARdata for mouse cadavers irradiated in the 600- to 900-MHz frequency rangefalls on a straight line extrapolated from our earlier 200- to 400-MHz SARdata for subjects irradiated in the TEM chamber. And, a log-log plot of ourSAR data for cadavers irradiated in the 900- to 1200-MHz range appears tonearly fit a straight line connecting the 900- and 1200-MHz points on thecurve redrawn from the Dosimetry Handbook. Thus, the curve fitting ourexperimental SAR data appears to be biphasic, with a slope of 0.7 over the200- to 900-MHz range and a slope of 2.6 over the 900- to 1200-MHz range.Using the experimental curve described, we estimated that exposurgs ofE-oriented mice to incident power densities of 12.5 and 5.3 mW/cm4 wouldresult in an absorption level of 4 W/kg at 800 and 1200 MHz respectively.Accordingly, these incident-power densities were used in subsequent experi-ments conducted at these two frequencies.
SAR measurements can be used to indirectly determine power density. Foran SAR level of 4 W/kg, for example, the power density required may be deter-mined by the expression
Pdreq'd = 4-lTnorm
The power meter settings needed to reach the above power density may bedetermined from equation 5. Two adjustments are required before the powersetting can be finalized. First, a position correction is required when twomice are in the chamber. Neither mouse is positioned directly beneath thecenter of the horn. A 5% decrease in power density may be estimated for
20

this off-center position, based on consideration of the theoretical patternof waves radiated from an open-ended waveguide plus consideration of the mapsof the measured power densities (Figs. 7 and 8). The second adjustment isconcerned with our observation that the Plexiglas restraining cages enhanceSAR by a factor of 1.34, as revealed by our earlier measurements performed inthe TEM chamber (Brown et al., 1981). The SAR data represented in Figure 9were obtained with mouse cadavers not placed in Plexiglas restrainers duringRF irradiation.
The following example will illustrate how the required power-meter set-ting may be obtained for 4-W/kg SAR at 800 MHz. The normalized SAR for miceexposed to that frequency may be estimated from Figure 9 to be 0.32 W/kg permW/cmz. The power density needed for an SAR of 4 W/kg should be, therefore,
* 4/0.32 mW/cm2 , or 12.5 mW/cm2 . Equations 4 and 5 are then used to determinethe power meter settings required for the desired power density. With PMlreading 1 W and the double-stub tuner adjusted such that PM2 reads approxi-mately zero, the 800-MHz power density along the chamber work surface is cal-culated to be 9.92 mWlcm2 . Since the power density desired in this exampleis 12.5 mW/cm2, the PMl power meter reading should be 12.5/9.92 W, or 1.26 W.When further corrected for both the position effect and the cage effect, thefinal setting needed for the desired power becomes
PMI = (12.5/9.92)(I.05)(TL-R) = 0.99 W
Similar calculations are required for each frequency tested.
Airflow through TEM and Anechoic Chambers
Air flowing through the TEM chamber, and its corresponding shamenclosure, was measured at the center test position on either side of thecenter conductor. The velocity of airflow through these two chambers flucu-ated over a range of 80-90 ft per min. Inflow air was directed to the worksurfaces of the anechoic chambers via cardboard channels. Two longitudinalvanes in the cardboard channel were used to partition the airflow. Othervanes, placed in the Plexiglas funnel leading to the channel, were used to
*tune the airflow so that the air discharged along the 25-cm orifice of thechannel was as uniform as possible. Flow across the work surface of eachanechoic chamber fluctuated between 100 and 120 ft per min.
Core Temperature: RFR SubjectsThis investigation was designed to test the inference of Prohofsky and
colleagues that RFR interaction with duplex DNA may result in frequency-
specific denaturation at exposed ends of the polymer. An important cri-terion for the in vivo phases of the investigation was avoidance of RFR-induced hyperthermia, to try to preclude heating artifacts. Indeed, hyper-thermia has been observed to increase the frequency of SCE in cultured cells(Livingston and Dethlefsen, 1979).
21
,. . . . . . . . . . . .
Numerous baseline measurements of colonic temperature were conducted inour lab over the past 2 years. Restrained subjects used for these measure-ments were positioned either on the open lab bench or in one of the RFRenclosures. Colonic temperatures recorded at 60-s intervals for 2-3 h weregraphed for analysis. Approximately 1 h was required before the initiallyagitated animals displayed what appeared to be a stable baseline temperature.These measurements, performed with the airflow turned off, revealed a meancolonic temperature of about 37.40C. Subjects positioned in the TEM chamberwith RF power off were found, as part of a prior project, to maintain theircolonic temperature at this baseline level with the air blower activated andthe air temperature adjusted to 30.50C.
Mean colonic temperatures of mice subjected to different levels of 400-MHz power in the TEM chamber with a constant 30.5 0C airflow are presented inFigure 10. The figure, taken from the 1981 report by Brown et al. shows thatthe test animals underwent a linear increase in body temperature as a func-tion of the incident power density, with an apparent threshold of about 12mW/cm2 under the conditions used. We further observed that adjustment of theairflow temperature would compensate for RFR-induced hyperthermia, therebypermitting the colonic temperature of irradiated subjects to return to essen-tially baseline levels. Figure 11 shows the colonic temperature of subjectsexposed to 400 MHz at power densities of 16 or 80 mW/cm2 with an air tempera-ture of 30.50C. Reducing the air temperature from 30.50C to 29.5 0C appearedto compensate for the core heating elicited by the lower power density, anda reduction to 22.50C seemed to compensate for the higher power level.
Thermal responses of mice irradiated at 800 and 1200 MHz in the anechoicchambers were also tested. Initial tests were performed with the airflowactivated and RF power off. The results of several preliminary testsrevealed that the animals held their colonic temperatures closest to the base-line when the temperature of the airflow through the anechoic chamber wasadjusted to 29.50C. With the airflow maintained at that temperature, wetested the thermal response of the animals to 800 and 1200 MHz at incidentpower densities calculated to be equivalent to SAR levels of 4, 6, or 8 W/kg(Fig. 12). The power densities required for the 800-MHz exposures were calcu-lated to be 12.5, 18.8, and 25 mW/cm2 respectively; for the 1200-MHz exposures,5.3, 7.9, and 10.6 mW/cm2 respectively. Figure 12 shows that exposure to 800or 1200 MHz at power densities equivalent to 4 W/kg caused the body tempera-ture to increase approximately 0.5-0.6oC; at 8 W/kg, more than 1.50C.
Colonic temperatures of animals positioned in the anechoic chambers andexposed to forced airflow maintained at different temperatures are shown inFigure 13. For animals subjected to forced airflow adjusted to 29.50C, themean colonic temperature was essentially the same as the baseline level. (Thebaseline temperature of mice exposed to non-flowing ambient air appeared to beabout 37.40C.) Figure 13 also shows that adjusting the ventilating air tem-perature down to 27.OOC resulted in approximately a 0.50C drop in the colonictemperature of the mice. Based on the findings represented in Figures 12 and13, we concluded that during exposure to 800- or 1200-MHz at incident powerdensities equivalent to an SAR of 4 W/kg, adjusting the air temperature to27.0oC would compensate for the RF heating and allow the irradiated animals tomaintain their core temperatures at essentially the baseline level.
22

4
.4 0 3
z
SWT
*- o
(1- 2a
00_J0
011
20 40 60 80
400 MHz POWER DENSITY, mW/cm2
Figure 10. Change in colonic temperature of mice exposed to 400 MHz. Sub-jects were positioned in a TEM chamber ventilated with 30.5 0 Cairflow. Each point is mean of eight determinations, and verti-cal bars are standard error of the mean. (Figure from Brown etal., 1981).
23
A AIR TEMPERATURE
-- -30.5 0C - - -A 29.5 °C
38 --
:" t"- . ... ..... .... . . POW ER ON -- ..Li iC=
CL B AIR TEMPERATURE
30.5 °C 22.5 "C-
39-'"- -..
POWER ON -
0.5 ,.0 .5 2.0TIME, h
Figure 11. Colonic temperature of irradiated mice adjusted by air-temperature variation. Solid tracings represent the colonictemperatures of mice exposed to 400-MHz power densities of(A) 16 mW/cm2 or (B) 80 mW/cm2 . Air temperature was adjustedas indicated 45 min after commencing RF irradiation. Dashedtracings, represent the baseline temperatures of the same ani-mals exposed for 2 h to ventilating air maintained at 30.5 0C(no RFR).
24
4 '.-.'.'.."..-.-"-..'.'.- -.--.. .--....-.. * . '. . .... .. ..-.. . -... ..... .. . .-. . ;

2.0- I0 800 MHz (8)O /
ui 0 1200 MHz
6 00(6)
oU (6)
o /
///
//
/ I I I I2 4 6 8
4 SAR, W/kg
Figure 12. Change in colonic temperature of mice exposed to 800 and 1200MHz. Animals were positioned in an anechoic chamber maintained
. at 29.50C and subjected to incident RF power densities equivalentC- to the absorbed doses indicated. Each point is a mean of the
number of observations in parentheses. Vertical brackets arestandard error of the mean. The dashed line represents a least-squares fit to the data points. (The baseline temperature ofnonirradlated control subjects was about 37.4oC.)
25. . .
,. ' .--' t ----" .' .' -: .-.' '. ' . .

38.0
(13) //
~ 37.0(7)0
0 /1 0
-J //
//"' 1
0.
/
13)
3&0I25 27 29 31
AIR TEMPERATURE, OC
Figure 13. Colonic temperatures of mice exposed to different temperatures offorced airflow ventilating the anechoic chambers. Each point isa mean of the number of observations in parentheses. Verticalbrackets are standard error of the mean. The dashed line repre-sents a least-squares fit to the data points.
26
%" "" " ° e ".° %' .' " ", ". •
Oo •
" °
- - "- '' • . " . " , . " .. " " . -

Sister Chromatid Exchange: RFR Effects
Analysis of SCE has proven to be a sensitive cytogenic method ofdetecting mutagenic/carcinogenic agents both in vitro (Carrano et al., 1978;Perry and Evans, 1975) and in vivo (Schreck et al., 1979). Although thenature of SCE is unclear, it may be linked with DNA postreplication repair(Schneider et al., 1978), a mechanism thought to involve recombination(Lehmann, 1974). Our rationale for including SCE analysis in this projectwas that an increase in recombination events, manifested as an elevated SCEfrequency, could occur if absorption of RF photons by DNA induces partialdenaturation of the macromolecule as suggested by Prohofsky and colleagues(Putnam et al., 1981).
The method of SCE analysis-used in this investigation, adapted fromPerry and Wolff (1974), involved BrdUrd labeling of replicating cells fora duration roughly twice that of the cell cycle, followed by fluorescent-plus-Giemsa differential staining of the chromosomes. After two replicationcycles in the presence of BrdUrd, the chromatids containing BrdUrd in bothstrands of DNA stain weakly with Giemsa while the chromatids containing DNA
% "in only one strand stain darkly with Giemsa.
Bone marrow cells were chosen for analysis in this investigation. Fig-ure 14 shows fluorescent-plus-Giemsa-stained metaphase chromosomes of marrowcells after one, two, or three replications in the presence of BrdUrd. Asshown, first-division-cycle cells yield chromosomes that stain darkly. Insecond-division-cycle cells, each metaphase chromosome consists of one lightand one dark chromatid. In each third-division-cycle cell, half of thechromosomes consist of two light chromatids while the remaining chromosomeseach consist of one light and one dark chromatid. Only second-division-cycle cells were used to score SCE frequencies in this study.
Mice treated with cyclophosphamide, a known SCE-inducing agent (Schrecket al., 1979), were included in some experiments as positive controls to testthe effectiveness of the assay in our hands. All animals subjected to thecyclophosphamide treatment exhibited increased SCE frequencies. Examples ofmetaphase chromosomes from animals treated with cyclophosphamide at concen-trations of 0, 10, or 20 mg/kg are shown in Figure 15. Individual SCE valuesobserved in two cyclophosphamide titration experiments are listed in Table 1.Both the figure and the table show that the SCE frequency increased as afunction of cyclophosphamide concentration. Treatment of mice with cyclo-phosphamide at a dosage of 10 mg/kg has been reported both by Schneider et
* ial. (1981) and Schreck et al. (1979) to induce about 24 SCE per marrow cell.The SCE frequencies we observed at this dosage were, as shown in Table 1,about 19 per cell in the first experiment and about 26 per cell in thesecond. The similarity of our results to reported values attests to theoverall reliability of the assay in our hands.
Examples of differentially stained metaphase chromosomes from mice thatwere sham-irradiated or exposed to either 400-, 800-, or 1200-MHz radiationare presented in Figure 16. Mean numbers of SCE observed in the bone marrowcells for each animal in the eight experiments completed for this portion ofthe investigation are presented in Table 2. An overview of these data doesnot reveal any overt differences between the SCE values of control and
27
- . . . . . . b

,l.
Figure 14. Appearance of fluorescent-plus-Giemsa-stained metaphasechromosomes from the bone marrow of mice.A. First-division cycle cell; B. Second-division-cycle
cell; C. Third-division-cycle cell.
k~h 28
' / . ..
~A
.2
"J
-- !4
Figure 15. Differentially stained second-division-cycle marrow chromosomesfrom mice treated with different concentrations of cyclophospha-mide. A. 0 mg/kg; B. 10 mg/kg; C. 20 mqikg.
29

TABLE 1. CYCLOPHOSPHAMIDE INDUCTION OF SCE IN BONE MARROW OF MICE
Cyclophosphamide No. cells SCE/cellExperiment (mg/kg) scored/animal (Mean ± S.E.M.)
1 0 11 3..6 ± 0.913 5.8 ± 0.510 5.0 ± 0.811 4.8 ± 0.3
10 10 14.9 ± 1.912 23.2 ± 1.810 22.6 ± 1.58 13.5 ± 1.6
20 10 31.4 ± 3.68 25.8 ± 3.3
11 43.4 ± 4.69 43.2 ± 4.2
2 0 15 2.7 ± 0.515 3.4 ± 0.4
5 15 7.3 ± 0.915 6.3 ± 0.7
10 15 25.2 ± 1.615 25.9 ± 2.6
20 15 32.0 ± 2.215 29.1 ± 2.8
..
o.
4.* %** .. *.. ... . . . . . .. . .. -. - .. ... . . . .- --. .. .... - .. . .
A B
,1-'" I.' V. 4U
C D
r~ l
L. Figure 16. Differentially stained second-division-cycle marrow chromosomesfrom sham- and RF-irradiated mice. A. Sham exposed; B. 400-MHzexposed; C. 800-MHz exposed; D. 1200-MHz exposed.
i!31

TABLE 2. NUMBER OF SCE OBSERVED IN MARROW CHROMOSOMESOF RFR- AND SHAM-EXPOSED MICE
Each replicate experiment included four RFR- and four sham-exposed animals.Values in parentheses are number of metaphase cells scored for each animal.
Exposure Mean SCE/cell ±S.E.M.*freq. Replicate RFR Sham
400 MHz 1 4.3 ± 0.7 (16) 5.2 ± 0.5 ( 8)4.3 ± 0.5 (9) 4.5 ± 0.7 (11)6.0 ± 1.2 (9) 5.5 ± 0.6 ( 8)5.2 ± 0.6 (10) 3.9 ± 0.5 (16)
2 5.7 ± 0.7 (10) 5.8 ± 0.5 (13)6.5 ± 0.9 (12) 3.6 ± 0.9 (11)5.1 ± 0.9 (12) 5.0 ± 0.8 (10)5.2 ± 0.7 (12) 4.8 ± 0.3 (11)
3 3.4 ± 0.4 (15) 2.9 ± 0.5 (15)2.8 ± 0.6 (15) 3.0 ± 0.3 (15)3.0 ± 0.3 (15) 3.4 ± 0.4 (15)2.8 ± 0.5 (15) 3.0 ± 0.3 (15)
800 MHz 1 4.3 ± 0.7 (10) 5.1 ± 0.7 (13)4.2 ± 0.5 (11) 3.5 ± 0.6 (11)3.8 ± 0.5 ( 9) 5.0 ± 0.6 (11)5.6 ± 0.8 (13) 3.7 ± 0.7 (11)
2 3.8 ± 0.5 (13) 3.3 ± 0.6 (17)*4.0 ± 0.5 (19) 2.3 ± 0.4 (18)42.2 ± 0.3 (17) 3.0 ± 0.5 (16)
2.2 ± 0.3 (14)-a
3 2.0 ± 0.3 (15) 2.1 ± 0.3 (15)1.9 ± 0.3 (15) 1.8 ± 0.4 (15)2.2 ± 0.4 (15) 2.5 ± 0.3 (15)3.0 ± 0.7 (15) 2.8 ± 0.6 (15)
1200 MHz 1 3.6 ± 0.4 (14) 4.7 ± 0.6 (24)3.4 ± 0.4 (14) 3.6 ± 1.0 (11)3.9 ± 0.7 (19) 5.9 ± 0.6 (17)
--a 3.4 ± 0.4 (15)
2 4.0 ± 0.5 (18) 4.3 ± 0.5 (19)3.4 ± 0.4 (19) 5.1 ± 0.5 (19)4.3 ± 0.5 (22) 2.8 ± 0.4 (15)4.5 ± 0.4 (20) 3.4 ± 0.6 (16)
aCells not 4cored; no differentiation between the chromatids.
32
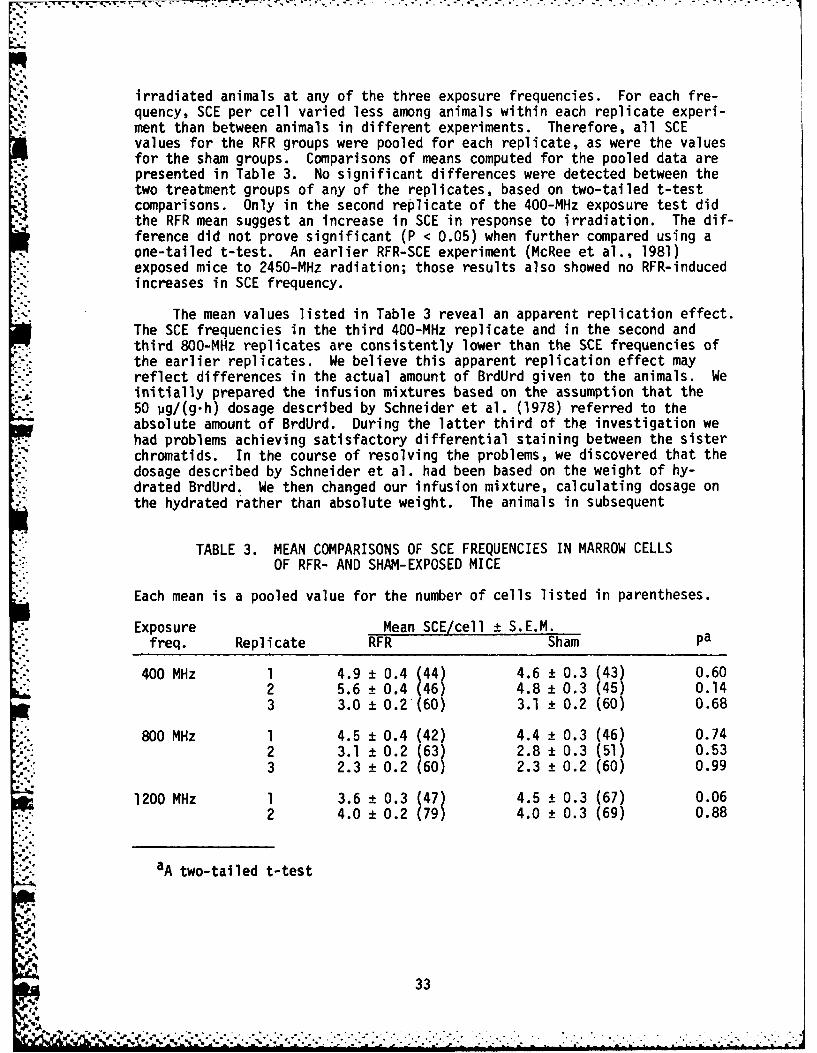
irradiated animals at any of the three exposure frequencies. For each fre-quency, SCE per cell varied less among animals within each replicate experi-
-ment than between animals in different experiments. Therefore, all SCEvalues for the RFR groups were pooled for each replicate, as were the valuesfor the sham groups. Comparisons of means computed for the pooled data are
. presented in Table 3. No significant differences were detected between thetwo treatment groups of any of the replicates, based on two-tailed t-testcomparisons. Only in the second replicate of the 400-MHz exposure test didthe RFR mean suggest an increase in SCE in response to irradiation. The dif-ference did not prove significant (P < 0.05) when further compared using aone-tailed t-test. An earlier RFR-SCE experiment (McRee et al., 1981)exposed mice to 2450-MHz radiation; those results also showed no RFR-inducedincreases in SCE frequency.
The mean values listed in Table 3 reveal an apparent replication effect.The SCE frequencies in the third 400-MHz replicate and in the second andthird 800-Mlz replicates are consistently lower than the SCE frequencies ofthe earlier replicates. We believe this apparent replication effect mayreflect differences in the actual amount of BrdUrd given to the animals. We
" initially prepared the infusion mixtures based on the assumption that the50 pg/(g.h) dosage described by Schneider et al. (1978) referred to theabsolute amount of BrdUrd. During the latter third of the investigation wehad problems achieving satisfactory differential staining between the sisterchromatids. In the course of resolving the problems, we discovered that thedosage described by Schneider et al. had been based on the weight of hy-drated BrdUrd. We then changed our infusion mixture, calculating dosage onthe hydrated rather than absolute weight. The animals in subsequent
TABLE 3. MEAN COMPARISONS OF SCE FREQUENCIES IN MARROW CELLS
OF RFR- AND SHAM-EXPOSED MICE
Each mean is a pooled value for the number of cells listed in parentheses.
Exposure Mean SCE/cell + S.E.M.freq. Replicate RFR Sham pa
400 MHz 1 4.9 ± 0.4 (44) 4.6 ± 0.3 (43) 0.602 5.6 ± 0.4 (46) 4.8 ± 0.3 (45) 0.143 3.0 ± 0.2 (60) 3.1 ± 0.2 (60) 0.68
800 MHz 1 4.5 ± 0.4 (42) 4.4 ± 0.3 (46) 0.742 3.1 ± 0.2 (63) 2.8 ± 0.3 (51) 0.533 2.3 ± 0.2 (60) 2.3 ± 0.2 (60) 0.99
1200 MHz 1 3.6 ± 0.3 (47) 4.5 ± 0.3 (67) 0.062 4.0 ± 0.2 (79) 4.0 ± 0.3 (69) 0.88
aA two-tailed t-test
33
r4

experiments therefore received about 2/3 of the absolute level of BrdUrdused in the earlier replicates, a change that seems to be correlated witha drop in the SCE frequency. Schneider et al. showed that SCE frequencydid increase as a function of the amount of BrdUrd given to the test animals.
DNA Synthesis: RFR Subjects
The method used to monitor DNA synthesis involved dual labeling with[34C]TdR and [3H]TdR. Each animal was prelabeled with []4C]TdR, then giventhe H label, and then sham- or RFR-exposed. This protocol allowed DNA syn-thesis during RFR treatment to be compared with the preexposure level withinthe same animal. The percentage of S-phase cells in a given tissue differsbetween animals, so this protocol eliminated some variances that are due tobetween-animal differences rather than treatment differences. The protocolis presented in Figure 4.
Table 4 presents results of an experiment designed to test the effec-tiveness of the dual-labeling procedure for comparing levels of DNA syn-thesis. Twelve [14C]TdR/[3H]TdR-labeled mice were treated with differentamounts of hydroxyurea, a known inhibitor of semiconservative replication.
TABLE 4. EFFECT OF HYDROXYUREA ON FORMATION OF SPLEEN DNA IN VIVO:3H/14C RATIOS USED TO ASSESS RELATIVE LEVELS OF DNA SYNTHESIS
Each value represents one animal. Labeling with [14C]TdR and [3H]TdR was asdescribed in Technical Approach. Hydroxyurea 1O. ml of a saline solution)was injected iv 5 min before giving [3H]TdR. 4C and 3H radioactivities inthe acid-insoluble fraction of the samples were measured and converted toDPM.
Hydroxyurea Sample radioactivities 3H/I4C DNA synthesis(mg/kg) 3H DPM 14C DPM ratio (% of control)
0 22,000 1,470 15.036,200 2,190 16.526,700 1,790 14.9
- 15.5 100
3 19,400 2,570 7.6 4921,600 3,020 7.2 464,600 480 9.6 62
15 4,710 1,860 2.5 164,480 1,620 2.8 181,210 360 3.4 22
150 760 2,050 0.4 3530 1,350 0.4 3
1,610 2,480 0.6 4
34.9
,4 , , ,- , , - - -.- t-. . '°' .. . -, . ,. • " ' . . " . , - - , "-L '. . '- .. - - ... , ". .. , ' . . . ..

Spleens were removed from the animals and analyzed for incorporation of theradioactive precursors into the acid-insoluble fraction. The table showsthat administration of hydroxyurea reduced incorporation of [3H]TdR into DNArelative to the level of [14C]TdR incorporation that preceded the hydroxyureatreatment. More importantly, the 3H/14C ratios of all animals receiving thesame hydroxyurea dosage were very similar, decreasing as a function of con-centration of the inhibitor. These results demonstratethe reliability ofthe dual-labeling procedure for monitoring DNA synthesis in vivo.
5 Results of an investigation of DNA synthesis in rodents (Lynch et al.,1970) revealed that [3H]TdR incorporation into DNA continues linearly forabout 30 min and then ceases. Our dual-labeling protocol (Fig. 4) was basedon this observation. We chose a 90-min prelabeling to insure completion of[14C]TdR incorporation before giving the second label. The 20 min for the[3H]TdR pulse represented a compromise between remaining within the period oflinear uptake of precursor and maximizing the duration of RFR exposure.
Ratios of 3H DPM and 14C DPM in the spleen and marrow DNA of animalsexposed to the three RFR test frequencies are listed for comparison withtheir corresponding sham exposed controls in Table 5.
TABLE 5. RELATIVE LEVELS OF DNA SYNTHESIS IN SHAM- AND RFR-EXPOSED MICE
Labeling with [14C]TdR and [3H]TdR was as described in Technical Approach.Each value is a pooled mean (± S.E.M.) of four animals per treatment groupand represents the 3H DPM/14C DPM ratio of radioactivities incorporated inspleen or marrow DNA.
Exposure Spleen Marrowfreq. Replicate RFR Sham RFR Sham
400 MHz 1 13.7 ± 0.8 15.4 ± 1.8 16.0 ± 1.3 14.9 ± 232 16.4 ± 2.0 14.0 ± 1.2 14.7 ± 0.9 14.1 ± 1.13 12.2 ± 0.9 10.9 ± 0.9 14.5 ± 0.5 14.6 ± 1.8
800 MHz 1 13.4 ± 1.1 13.2 ± 1.1 13.1 ± 0 . 5a 13.5 ± 0.52 16.5 ± 1.8 15.7 ± 1.0 19.2 ± 1.0 16.3 ± 0.93 9.5 ± 0.6 8.9 ± 0.8 11.7 ± 0.4 11.6 ± 0.3
1200 MHz 1 11.6 ± 1.7 12.6 ± 2.1 14.4 ± 0.7 14.2 ± 0.92 14.0 ± 1.0 13.5 ± 1.0 14.1 ± 0.7 14.8 ± 0.53 14.9 ± 1.9 14.8 t 2.1 16.4 ± 1.3 14.4 ± 0.5
aMean of three animals only; one sample lost.
35
., . . . . -.. .; .: : : . . - . . . . .

The 3H/14C ratios summarized in the table reveal no pattern of RFR-inducedinhibition of DNA replicatior. Indeed, quite the opposite may have occurred.The RFR-treatment means of some of the replicates suggest a slightly enhancedlevel of DNA synthesis in the irradiated animais. This trend is particularlyevident for the spleen samples of animals irradiated at 800 MHz. Means com-puted for the RFR and sham groups were compared within each individual repli-cate by a one-tailed t-test. Treatment differences were not significant(P < 0.05) in any of the replicates including the 800-MHz-irradiated spleensamples. We also used a one-way analysis of variance to test the data of allthree replicates at each frequency for a treatment effect. The analysis ofvariance also revealed no significant differences (P < 0.05).
Our results obtained with mice are not in agreement with the RFR effecton DNA synthesis in cultured cells reported by Chang et al. (1980). Thoseinvestigators observed a 25% inhibition of DNA synthesis in L1210 cellsexposed to a 1000-MHz field at an incident strength of 20 mW/cm2 . (Not shownhere are results we obtained with cultured CHO cells exposed for 60 min at37.40 C to 1000 MHz at the same field strength used by Chang et al. Resultsof our tests with the CHO cells revealed no RFR inhibition of DNA synthesis.)
..l Hydrolysis of DNA: RFR Effects
The direct tests for RFR-induced denaturation at end regions of DNArequired an appropriate substrate, that is, DNA with radioactive moieties ator near exposed ends of the polymer. We envisioned two types of substratesthat would fulfill this criterion. One was duplex 3H-DNA with blunt ends;the other was DNA with single-strand nicks and gaps. The blunt-ended sub-strate was prepared by HAE III endonuclease treatment which cleaves DNA asshown below:
5' - G G C C - 3'
3' - C C G G - 5't
With this type substrate, having the end G or C bases radioactively labeledwas desirable. Thus, the DNA subjected to the HAE III endonuclease treat-ment was isolated from cultures labeled with [3H]CdR. The nicked DNA wasprepared by a brief treatment of 3H-DNA with DNase I. This second type, thenicked DNA, would be seen, for example, at fork regions in replicating DNAwhere short lengths of nascent DNA, Okazaki fragments, are being formed alongan intact template strand. Although the modeling work of Prohofsky and col-leagues was based on DNA of the first type (Kohli et al., 1981), the secondtype is perhaps more likely to be encountered in the cell.
An initial experiment was performed to test the activity of the nucleasewith different types of substrates. The JH-DNA used in that experiment wasisolated from subconfluent cultures of CHO-K cells (-3 x 10⁶ cells/l00-mmdish at harvest) labeled overnight with [3H]dR at a concentration of 1 pCi/ml culture medium. Approximately two-thirds of the DNA recovered from thesecells was treated with HAE III restriction endonuclease in the reaction mix-ture described by Blakeley et al. (1977). The remaining third, referred to
36
'I
-- ..: -. --- ---, ,- ..", ' ." -. .- . - .-
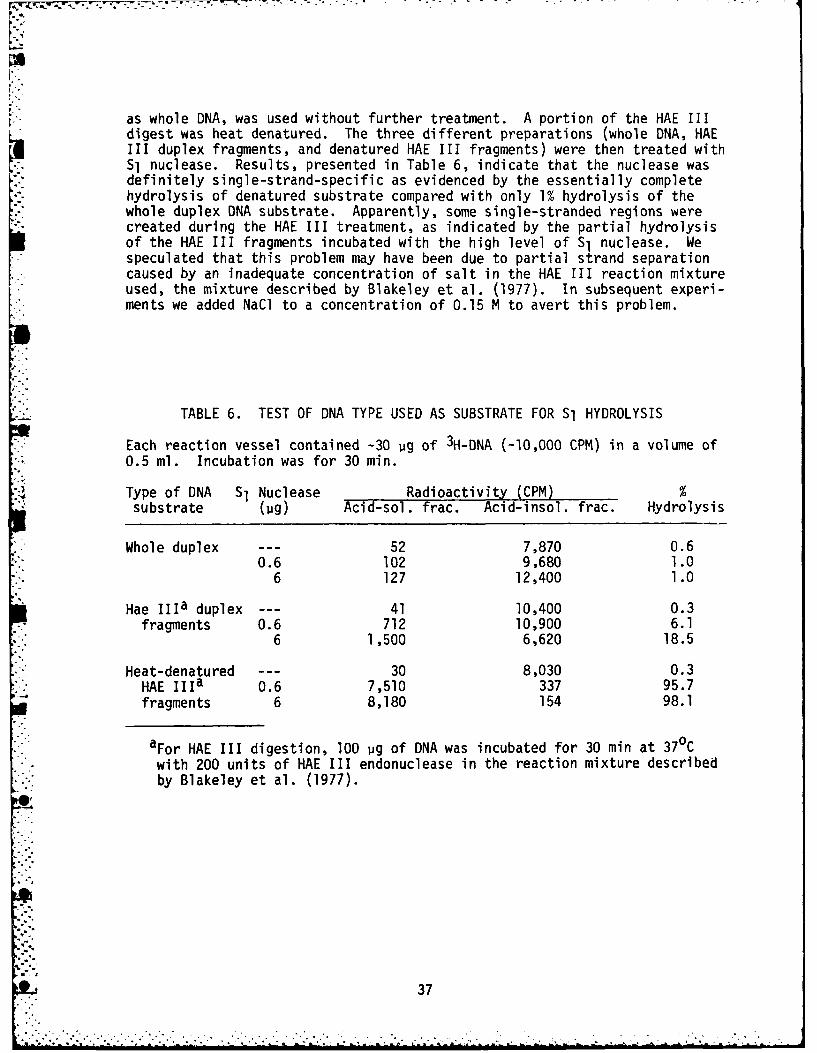
K .as whole DNA, was used without further treatment. A portion of the HAE IIIdigest was heat denatured. The three different preparations (whole DNA, HAEIII duplex fragments, and denatured HAE III fragments) were then treated withSl nuclease. Results, presented in Table 6, indicate that the nuclease wasdefinitely single-strand-specific as evidenced by the essentially completehydrolysis of denatured substrate compared with only 1% hydrolysis of thewhole duplex DNA substrate. Apparently, some single-stranded regions werecreated during the HAE III treatment, as indicated by the partial hydrolysisof the HAE III fragments incubated with the high level of Sl nuclease. Wespeculated that this problem may have been due to partial strand separationcaused by an inadequate concentration of salt in the HAE III reaction mixtureused, the mixture described by Blakeley et al. (1977). In subsequent experi-ments we added NaCl to a concentration of 0.15 M to avert this problem.
TABLE 6. TEST OF DNA TYPE USED AS SUBSTRATE FOR Sl HYDROLYSIS
Each reaction vessel contained -30 ug of 3H-DNA (-10,000 CPM) in a volume of0.5 ml. Incubation was for 30 min.
Type of DNA Sl Nuclease Radioactivity (CPM) %substrate (Ng) Acid-sol. frac. Acid-insol. frac. Hydrolysis
Whole duplex --- 52 7,870 0.60.6 102 9,680 1.06 127 12,400 1.0
Hae IIIa duplex --- 41 10,400 0.3fragments 0.6 712 10,900 6.1
6 1,500 6,620 18.5
Heat-denatured --- 30 8,030 0.3HAE IIa 0.6 7,510 337 95.7fragments 6 8,180 154 98.1
aFor HAE III digestion, 100 Vg of DNA was incubated for 30 min at 370 C
with 200 units of HAE III endonuclease in the reaction mixture describedby Blakeley et al. (1977).
37

The effect of RFR on S nuclease catalyzed hydrolysis of DNA was thentested using five types of 04A substrates. The substrates, type I to V(listed in Table 7), were prepared from CHO-KI cultures (-2 x 10⁶ cells/100-mm dish at harvest) labeled overnight either with [3H]TdR at a concen-
tration of 25 iCi/ml or with [3H]CdR at a concentration of 6.25 uCi/ml. DNAisolated from the [3H]TdR-labeled cultures was used without further treat-ment (substrate type I) or was subjected to treatment with DNase I (substratetype II) or heat denaturation (substrate type IV). DNA isolated from the[JH]CdR-labeled cells was either treated with HAE III endonuclease (substratetype III) or heat denatured (substrate type V). Preparation of the type IIsubstrate involved preincubation of 33 pg of the [3H]TdR-labeled DNA at 37.4 0Cin a reaction mixture (0.3 ml) containing 0.15 M NaCl, 10 mM MgSO4 , and 0.1 Msodium acetate, pH 5.0. DNase I (0.4 unit) was then added and the incubationcontinued for 30 s, whereupon 5 pg of actin, a known inhibitor of DNase I(Lazarides and Lindberg, 1974), was added. The brief DNase I treatmentresulted in a noticeable decrease in viscosity of the DNA. The amount ofDNase I needed for this treatment was determined by preliminary experimen-tation (results not shown). The blunt-ended type III substrate was preparedby a 30-min incubation of 30.5 pg of [3H]CdR-labeled DNA with 75 units ofHAE III endonuclease in the mixture of Blakeley et al. (1977), with NaCladded to 0.15 M.
The different levels of Sl hydrolysis of these substrates as a result of
* RFR exposure and control incubation are summarized in Table 7. As expected,
the DNase I treated DNA (substrate II) was the most susceptible to the actionof the nuclease. Whole DNA was included in the test as a control substrate,that is, a substrate expected to be relatively resistant to the nuclease.Interestingly, our whole DNA preparation was more susceptible to the nucleasethan was the blunt-ended type III substrate. This may reflect a somewhatgreater degree of mechanical degradation of the [3H]TdR-labeled DNA than the[3H]CdR-labeled DNA occurring during isolation from the cell cultures. Bothof the single-stranded heat-denatured substrates (types IV and V) were almostcompletely hydrolyzed by the Sl nuclease. This indicates that the substrateconcentration was not saturating. An overview of the data in Table 7 revealsthat the extent of hydrolysis occurring is slightly, but consistently, higherin the RF-irradiated samples than the corresponding control samples. Thiswas true not only with all three of the duplex substrates used, but also atall three of the test exposure frequencies. Such differences could occur asartifacts due to slight differences in the reaction-mixture temperatures thatinfluenced the reaction kinetics. Temperatures of the RFR and sham tubesmonitored during the course of the 60-min Sl nuclease reaction were found,however, to be essentially the same. These measurements were performed withtwo Vitek 101 monitors, with the probes inserted in capillary tubes filledwith Sl reaction mixture (minus DNA). One tube with probe was placed in thewater bath and the other was placed in the RFR enclosure, parallel to the E-field and approximately 2 cm from the experimental tubes. Temperaturesrecorded by the monitors were 37.4 ± O.lOC for the water bath and 37.40.30C for the irradiated tube. To the extent that our temperature monitorsare accurate (as they have proven to be in numerous other tests), we believethat the differences between the RFR and sham samples shown in Table 7 arenot due to temperature differences.
38

,w ., ,, - .. - - -
-. - - ,, .. - . - . ' L ' , i - • - " ' -. . - - . .• .-- . . ..-
Several questions may be addressed if the apparent RFR-enhancement of Slnuclease hydrolysis of 3H-DNA evidenced by the results listed in Table 7 isreal. First, why was there no manifestation of the phenomenon in vivo? Onereason may be that intact chromatin does not undergo the same vibrationalresponses that isolated DNA does. Second, why did the enhancement of hydroly-sis occur at all three exposure frequencies rather thanlat one specific fre-quency? For this, we cannot suggest an explanation. The experiment is by nomeans definitive, but it does suggest problem areas for further explorationof RFR effects on biologic systems.
TABLE 7. EFFECT OF RFR EXPOSURE ON HYDROLYSIS OF 3H-DNA BY Sl NUCLEASE
Each capillary-tube reaction vessel contained 6 Vg of Sl nuclease plus either6.2 ug (1.23 x 10⁶ CPM) of [3H]TdR-labeled DNA (substrate I, II, or IV) or5.7 ug (2.94 x 10 CPM) of [3H]CdR-labeled DNA (substrate III or V). Irradi-ated samples were exposed to incident field strengths of 16 mW/cm2 (400 MHz),12.5 mW/cm2 (800 MHz), or 5.3 mW/cm2 (1200 MHz), and an air temperature of37.40 C. Sham (control) tubes were incubated in a 37.40C water bath. Incu-bation was for 60 min. Each value is the mean + S.D. of two tubes.
Exposure Substrate RFR Shamfreq. type Acid-sol % Acid-so %
CPM (10-3) hydrolysis CPM (1O-1) hydrolysis
400 MHz I 36.7 ± 0.9 3.0 35.0 ± 2.5 2.8IIb 161.7 ± 0.7 13.1 140.7 ± 0.3 11.4
In c 6.8 ± 0.1 2.3 5.6 ± 0.1 1.9
800 MHz I 33.9 _ 0.2 2.7 26.6 ± 0.5 2.2II 133.0 _ 2.3 10.8 127.7 ± 0.9 10.4
I11 4.1 ± 0.1 1.4 4.1 ± 0.6 1.4
1200 MHz I 45.8 ± 4.3 3.7 34.5 ± 3.0 2.8II 296.5 ± 7.8 24.1 254.2 ± 6.1 20.7
III 2.9 _ 0.2 1.0 2.7 ± 0.1 1.0-- IVd 1,155.0 ±-6.2 94
vd 304.7 -± 0.8 103
bSubstrate I was whole (untreated) duplex DNA.bSubstrate II was DNase I-treated duplex DNA.cSubstrate III was duplex DNA treated with HAE III restriction endonuclease.dDNA substrates IV and V were both heat denatured.
39
. . . . .. .. -. .

CONCLUSIONS
Two of the three experimental approaches of this investigation yieldedresults indicating no decrease in either the stability or the rate of repli-cation of DNA in mice exposed to RFR at incident field strengths equivalentto an SAR of 4 W/kg in the large mouse. The level of DNA synthesis was notreduced in either the spleen or the bone marrow of mice irradiated at any ofthe three test frequencies. RFR exposure was also without effect on the fre-quency of SCE in bone marrrow cells, used here as one index of chromosomestability. The third approach, also a test of DNA stability, yielded resultssuggestive of a possible RFR-induced melting of hydrogen bonds at nickedregions of duplex DNA. This was evidenced by slightly increased suscepti-bility of DNase I treated, RF-irradiated DNA to a single-strand-specificnuclease. The absence of any observable in vivo counterpart suggests that themagnitude of the latter effect was insufficient for physiologic significance.
ACKNOWLEDGMENTS
Skilled technical assistance was provided by Ms. Cornelia Myers andMs. Sharon Powell.
.-,.
.°
I
" 40
Il

REFERENCES
Ando, T. A nuclease specific for heat-denatured DNA isolated from a productof Aspergillus oryzae. Biochim Biophys Acta 114:158-168 (1966).
Blakeley, R.W., J.B. Dodgson, I.F. Nes, and R.D. Wells. Duplex regions insingle-stranded OX174 DNA are cleaved by a restriction endonuclease fromHaemophilus aegyptius. J Biol Chem 252:7300-7306 (1977).
*i Brown, R.F., S.V. Marshall, and C.W. Hughes. Effect of radiofrequency radi-ation (RFR) on excision-type DNA repair in vivo. University of Missouri-
* Rolla, Final project report, Contract No. F33615-80-C-0613 with USAFSchool of Aerospace Medicine, Brooks AFB, Texas, 1981.
Brown, R.F., T. Umeda, S. Takai, and I. Lieberman. Effect of inhibitors ofprotein synthesis on DNA formation in liver. Biochim Biophys Acta 209:49-53 (1970).
Carrano, A.V., L.H. Thompson, P.A. Lindl, and J.L. Minkler. Sister chromatidexchange as an indicator of mutagenesis. Nature 271:551-553 (1978).
Chang, B.K., A.T. Huang, and W.T. Joines. Inhibition of DNA synthesis and en-hancement of the uptake and action of methotrexate by low-power-densitymicrowave radiation in L1210 leukemia cells. Cancer Res 40:1002-1005 (1980).
Collins, J.M. Deoxyribonucleic acid structure in human diploid fibroblastsstimulated to proliferate. J Biol Chem 252:141-147 (1977).
Durney, C.H., M.F. Iskander, H. Massoudi, S.J. Allen, and J.C. Mitchell.Radiofrequency radiation dosimetry handbook, 3d edition. SAM-TR-80-32,Aug 1980.
Durney, C.H., C.C. Johnson, P.W. Barber, H. Massoudi, M.F. Iskander, J.L.Lords, D.K. Ryser, S.J. Allen, and J.C. Mitchell. Radiofrequency radi-ation dosimetry handbook, 2d edition. SAM-TR-78-22, May 1978.
Gross-Bellard, M., P. Oudet, and P. Chambon. Isolation of high molecular-weight DNA from mammalian cells. Eur J Biochem 36:32-38 (1973).
Hanawalt, P.C., P.K. Cooper, A.K. Ganesan, and C.A. Smith. DNA repair bac-teria and mammalian cells. Annu Rev Biochem 48:783-836 (1979).
Huberman, J.A., and H. Horwitz. Discontinuous DNA synthesis in mammaliancells. Cold Spring Harbor Symposium. Quant Biol 38:233-238 (1973).
Kohli, M., W.N. Mei, E.W. Prohofsky, and L.L. VanZandt. Calculated microwaveabsorption of double-helical B-conformation poly(dG).poly(dC). Biopolymers20:853-864 (1981).
Lampert, F., G.F. Bahr, and E. DuPraw. Ultrastructure of a Burkitt's lymphoma
marker chromosome as investigated by quantitative electron microscopy.Cancer 24:367-376 (1969).
41
Lazarides, E., and U. Lindberg. Actin is the naturally occurring inhibitorof deoxyribonuclease I. Proc. Nat Acad Sci USA 71:4742-4746 (1974).
Lehmann, A.R. Postreplication repair of DNA in mammalian cells. Life Sci15:2005-2016 (1974).
Livingston, G.K., and L.A. Dethlefsen. Effects of hyperthermia and X irradi-ation on sister chromatid exchange (SCE) frequency in Chinese hamsterovary (CHO) cells. Radiat Res 77:512-520 (1979).
Lubs, H.A., W.H. McKenzie, S.R. Patil, and S. Merrick. New staining methodsfor chromosomes. Methods Cell Biol 6:345-380 (1973).
Lynch, W.E., R.F. Brown, T. Umeda, S.R. Langreth, and I. Lieberman. Synthesisof deoxyribonucleic acid by isolated liver nuclei. J Biol Chem 245:3911-3916 (1970).
McRee, D.I., G. MacNichols, and G.K. Livingston. Incidence of sister chroma-tid exchange in bone marrow cells of the mouse following microwave exposure.Radiat Res 85:340-348 (1981).
! Mei, W.N., M. Kohli, E.W. Prohofsky, and L.L. VanZandt. Acoustic modes andnonbonded interactions of the double helix. Biopolymers 20:833-852 (1981).
- Minkler, J., D. Steka, and A.V. Carrano. An ultraviolet light source for con-sistent differential staining of sister chromatids. Stain Technol 53:359-360 (1978).
Perry, P., and H.J. Evans. Cytological detection of mutagen-carcinogenexposure by sister chromatid exchange. Nature 258:121-125 (1975).
Perry, P., and S. Wolff. New Giemsa method for the differential staining ofsister chromatids. Nature 251:156-158 (1974).
Putnam, B.F., L.L. VanZandt, E.W. Prohofsky, and W.N. Mei. Resonant andlocalized breathing modes in terminal regions of the DNA double helix.Biophys J 35:271-287 (1981).
Schneider, E.L., Y. Nakanishi, J. Lewis, and H. Sternberg. Simultaneousexamination of sister chromatid exchanges and cell replication kinetics intumor and normal cell in vivo. Cancer Res 41:4973-4975 (1981).
Schneider, E.L., R.R. Tice, and D. Kram. Bromodeoxyuridine differentialchromatid staining technique: A new approach to examining sister chromatidexchange and cell replication kinetics. Methods Cell Biol 20:379-409(1978).
Schreck, R.R., I.J. Paika, and S.A. Latt. In vivo induction of sister chroma-tid exchanges in liver and marrow cells by drugs requiring metabolic acti-vation. Mutation Res 64:315-328 (1979).
Vogt,. V.M. Purification and further properties of single-strand-specificnuclease from Aspergillus oryzae. Eur J Biochem 33:192-200 (1973).
42
