of an improved gas engine-driven heat - …/67531/metadc696404/m2/1/high...test of an improved gas...
TRANSCRIPT

ORNL/CP-96879
COAIF- 4 801 33--- TEST OF AN IMPROVED GAS ENGINE-DRIVEN HEAT PUMP
F. C. Chen, V. C. Mei, and R. Domitrovic Oak Ridge National Laboratory
Oak Ridge, Tennessee 3783 1-6070
ABSTRACT
A new generation of natural gas engine-driven heat pump (GEHP) was introduced to the marketplace recently. While the units installed have performed exceptionally well and earned rave reviews for comfort and savings on utility bills, the higher initial cost and relatively long payback time have affected the wide commercialization of this advanced technology. According to a study done for the southeastern United States in the Atlanta metropolitan area, the annual operating cost of the GEHP is less than that of a baseline system consisting of a 92% efficiency gas furnace and a SEER 12 air conditioner. The estimated payback time is around 10 years to cover the difference in initial equipment price between the new and the baseline system.
It has been projected that a liquid overfeed (LOF) recuperative cycle concept can simplify the hardware design of a GEHP, resulting in reduced cost and improved performance. Laboratory tests have shown that LOF would improve the energy efficiency of a vapor compression unit by 10%. In addition, LOF will reduce the compressor pressure ratio and thereby improve equipment reliability. Based on the assumed performance improvements and cost reduction, a simple payback calculation indicates LOF can reduce the payback time for an improved GEHP considerably in the Atlanta metropolitan area. Laboratory testing of an improved GEHP has been carried out at Oak Ridge National Laboratory. This paper reports on the equipment design modifications required to implement LOF and the results of performance tests at steady-state conditions. The preliminary cooling test results have indicated that the LOF in conjunction with orifice-type expander can be applied to GEHP for cost and performance enhancements. The improvements in energy efficiency will be dependent upon several controlling parameters including the proper refrigeration charge, the selected ambient temperature, and the system operating condition.
1. INTRODUCTION
A new generation of natural gas engine4riven heat pump (GEHP) for residential applications was introduced to the marketplace recently which offers better energy efficiency and thermal comfort. A GEHP differs from a conventional air conditioner in which the Rankine cycle vapor compression system is driven by a natural gas engine instead of by an electric motor. Because of the availability of a gas engine as the drive, a GEHP can easily vary its speed to provide a better leoad following ability for space conditioning and it can utilize the engine waste heat for winter heating reducing the need for supplemental heating. These salient features result in improved energy efficiencies and thermal comfort, and reduced operating costs.

DISCLAIMER
This report was prepared as an account of work sponsored by an agency of the United States Government Neither the United States Government nor any agency thereof, nor any of their employees, makes any warranty, express or implied, or assumes any legal liability or responsibility for the accuracy, completeness, or use- fulness of any information. apparatus, product, or proass disclosed, or represents that its w would not infringe privately owned rights. Reference herein to any spc- cific commercial product, process, or service by trade name, trademark, manufac- turer, or otherwise docs not necessarily constitute or imply its endorsement, recom- mendation. or favoring by the United States Government or any agency thereof. The views and opinions of authors expmsed herein do not necessarily state or reflect those of the United States Government or.any agency thereof.
9980422 058

While these GEHP units installed have performed exceptionally well and earned rave reviews for comfort and savings on utility bills, the higher initial cost and relatively long payback time have affected the wide commercialization of this advanced technology. According to a study done for the southeastern United States in the Atlanta metropolitan area (Wolfe et al., 1995), the annual operating cost of the GEHP is less than that of a baseline system consisting of a 92% efficiency gas furnace and a SEER 12 air conditioner. While the overall operational costs for the GEHP were calculated $135 less than the baseline system, the estimated payback time is around 10 years to compensate for the difference in initial equipment price between the GEHP and the baseline system. Innovative means of achieving cost reduction yet maintaining its performance and comfort levels appear to be the required development needs to make this new space conditioning technology more affordable to the public.
In our research in the developments of energy-efficient and cost effective space conditioning technologies in recent years, we have patented a liquid overfeed (LOF) recuperative cycle concept (Mei et al., 1993). In an LOF recuperative cycle, high-pressure warm liquid refrigerant goes from the condenser through a heat exchanger in an accumulator. The warm liquid in the heat exchanger boils off the low-pressure liquid refrigerant in the accumulator reulsting in subcooled liquid. The subcooled liquid then goes through an orifice expander and to the evaporator without being fully evaporated so that the evaporator will be flooded and a two-phase flow will exit at the evaporator exit. The carry-over liquid will be trapped in the accumulator, only to be boiled off by the heat from the warm liquid heat exchanger in the accumulator. In addition, the vapor in the accumulator is almost saturated before it goes into the intake of the compressor which reduces the compressor pressure ratio and thereby improves compressor volumetric efficiency and equipment reliability. Laboratory tests (Mei et al., 1993) have shown that LOF would improve the energy efficiency of a vapor compression unit by 10-15%. Since the GEHP under consideration already has an accumulator, modifying it to include the LOF option is a simple hardware redesign resulting in improved performance at Based on the assumed performance improvements and cost reduction, a simple payback analysis indicates LOF can reduce the payback time for an improved GEHP considerably in the Atlanta metropolitan area. Laboratory testing of an improved GEHP is being carried out at Oak Ridge National Laboratory. This paper reports on the equipment design modifications required to implement LOF and the results of performance tests at steady-state conditions for assessing the potential of an improved GEHP.
potentially reduced cost.
2. UNIT MODIFICATION AND TEST SETUP
2.1 Heat Pump Modification
Figure 1 shows the schematic of the heat pump original design. The engine has 17 speeds, the outdoor fan has two speeds, and the indoor fan has five speeds (outlined by the manufacturer, York, 1996). Figure 2 is the schematic of the heat pump modified with liquid over-feeding feature.
The accumulator was replaced with an accumulator heat exchanger. For laboratory test purpose, four metering valves with 0.125 inch orifice diameter, two each for indoor and outdoor unit, were installed in parallel to the original expansion valves. The metering valves provide the flexibility

EXHAUST FROM EXHAUST FROM ENGINE AUX. HEATER OUTDOOR UNIT
I COOLANT OVERFLOW RESERVOIR TANK \ I
HEATER
MUFFLER
OUTDOOR COIL
ZERO T'STAT PRESS. GAS
RADIATOR SUPPLY
ACCUMULATOR I
REVERSING VALVE
ENGINE CONTROL SYSTEM
1
------------[=, LIQUID STRAINER TXV
HEATING COOLING DIRECTION DIRECTION
I
INDOOR UNIT - WATER-GLYCOL HEAT EXCHANQER
0 INDOOR BLOWER
%4 INDOOR COIL
RECEIVER
FILTER P AIR FLOW
AIR F ILTER
Fig. 1. Schematic of original heat pump design

EXHAUST FROM EXHAUST FROM ENGINE AUX. HEATER
I OUTDOOR UNIT I
!UTDO< - 0 1 L
I
RADIATOR
I COOLANT OVERFLOW RESERVOIR
TANK \ I
- AUX. HEATER
SWAY VALVE
I I MUFFLER
AUXILIARY HEATER
C .
ELECTRIC COOLANT AIR
ZERO T'STAT QAS PRESS. QAS
VALVE
VALVE GAS SUPPLY
ACCUMULATOR- HEAT EXCHANQER
ENQINE CONTROL SYSTEM
REVERSIN VALVE
. I
INDOOR UNIT
- ORIFICE PLATE HEATINQ COOUNQ DIRECTION DIRECTION
AIR FILTER
WATER-QLYCOL HEAT EXCHANQER
0 INDOOR BLOWER
INDOOR COIL
RECEIVER
0 FILTER DRYER
PLATE
t AIR FLOW
Fig. 2. Schematic of LOF heat pump design

needed to optimize the expansion process during laboratory tests . No other major components were replaced or modified.
2.2 Temperature, Pressure, and Air and gas Flow Rate Measurements
Pressures at compressor inlet and outlet, condenser outlet, before expansion device, after the expansion device, and evaporator outlet were measured by six pressure transducers. Dry bulb temperatures for evaporator air inlet and outlet were measured with two thermocouple piles. Evaporator outlet air wet bulb temperature were measured with four thermocouples with wicks. Average wet bulb temperature were calculated. Evaporator inlet air wet bulb temperature was measured with a thermometer covered with a wick. Air flow was measured by a ductwork air flow measurement device, which measured the average total head across the ductwork area and then subtracted the average static head, just like a pitot tube. A micromanometer was used to measure the velocity head. Gas consumption was measured with a gas meter. The gas heating valued was found to be between 1000 to 1030 Btu/ff'. For calculation, 1000 Btu/ft3 was adopted.
3. TEST PROCEDURE
3.1 Baseline Cooling Tests
A service analyzer, which allows a service person to obtain system information and to control the heat pump, was attached to the heat pump so that the engine speed can be dialed in. There are 17 speeds for the engine, ranging from 1200 to 3000 rpm. For this experiment, five engine speeds were selected for testing - 1200, 1652, 2104, 2556, 3000 rpm. The ambient temperatures tested were ranged from 80 to 110°F with 5°F interval, including ART rated outdoor condition at 95°F. The environmental chamber was set at proper indoor (80°F and 52% rh) and outdoor conditions, and the heat pump was allowed to run until steady state operation was achieved at a selected engine speed. For each ambient temperature setting, the heat pump performance was tested for five engine speeds.
3.2 LOF Cooling Mode Tests
ODtimization of MeterinP Valve Opening and Refrigerant Charge. One of the feature for the LOF test is that thermal expansion valve needs not be used because there is little or no superheat at the suction line. Fixed opening expansion devices, such as orifice plate or capillary tube will have to be used. The metering valve (as orifice plate) opening becomes crucial. For single speed compressor heat pumps, the optimization of the metering valve opening will simply be set at 95°F ambient for cooling mode operation, which is straight forward. For variable speed compressor heat pumps, as the one tested in this study, the optimum setting is becoming difficult, because the setting will have to work at all engine speed and ambient temperatures. What we expected was to have metering valve setting in such a way that the performance of the heat pump would be optimized at high engine speeds and at high ambient temperatures, and at low speed at low ambient temperatures.
The preliminary test results indicated that at a fixed metering valve opening and ambient temperature, increasing the engine speed will cause the liquid dry-out in the accumulator-heat

exchanger, and decreasing the engine speed will cause the liquid to accumulate in the accumulator- heat exchanger.
It was determined, by trial and error, that the heat pump charging and metering valve opening should be optimized at 95°F ambient and at engine speed of 2 104 rpm. Initially the system performance was optimized at 95°F and 3000 rpm. However, it was soon found that when the ambient temperature increases (engine speed maintained at 3,000), the evaporator coils were over flooded so that the suction temperature increased and the cooling capacity reduced rapidly, and when the engine speed was reduced, the coils was also over flooded and the performance decreased. We selected the engine speed at 2104 rpm (middle speed) as the point for system optimization. It was found that one metering valve was enough for the indoor unit. The other metering valve remained shut throughout the test. First, the metering valve was open wide, additional R-22 was charged into the heat pump until liquid over-feeding effect started, and then the metering valve was slowly adjust down on its orifice opening until maximum cooling performance was achieved, which could be easily detected by the indication of the evaporator outlet dry and wet bulb temperatures.
LOF Heat Pumu Cooling: Mode Test. Once the system optimization is completed, the heat pump test procedure with the LOF feature are the same as baseline test.
Data Collection. The heat pump was run at a fixed indoor and outdoor conditions, and at a fixed engine speed, until steady state operation is achieved. Data were collected for about five minutes, and averaged.
4. TEST RESULTS AND DATA ANALYSIS
4.1 Capacity Performance in Baseline Testing
Baseline cooling capacity is shown according to engine speed and outdoor ambient temperature in Table 1, and latent cooling capacity in Table 2. The outlined diagonal highlights in each table represent probable engine speeds for the given outdoor temperature. At such conditions the latent cooling capacity is approximately one fifth of the total capacity. Latent capacity, as a percentage of total capacity, increases above the highlight and decreases below the highlight due to corresponding increases and decreases in engine speed. The highest latent capacity value, which is also the highest value as a percentage of total capacity, occurs with an engine speed of 3000 rpm and an outdoor temperature of 80°F. This is expected as the evaporator (indoor) coil is its coldest, giving the highest AT between return air temperature and coil temperature. Correspondingly, the lowest absolute value of latent capacity occurs at 1200 rpm and an outdoor temperature of 110°F as is expected since such conditions give rise to the lowest AT between return air temperature and evaporator coil temperature. Supplementally, Figure 3 gives a graphical representation of total baseline cooling capacity.
Cooling coefficient of performance (COP) values for baseline testing are shown graphically in Figure 4. These values represent total system COP including natural gas energy input to the engine and electrical energy input to the indoor and outdoor fans and associates control circuits. As can be

seen from Figure 4, the total system COP decreases both with rising outdoor temperature and increased engine speed. The highest calculated COP, realized at 1200 rpm and 80'F, is approximately 1.47, and the lowest calculated COP, realized at 3000 rpm and 1 lO'F, is approximately 0.67.
Outdoor Temp
80°F 85% 90% 95% IOO'F IOSOF l lO%
4.2 Results of Liquid Over-feed Testing-With Comparisons to Baseline
Engine Speed 1200 rpm I 1652 rprn I 2104 rpm I 2556 rprn I 3000 rpm I
24.5 29.1 35.7 39.3 41.5 22.4 I 26.3 33.5 37.3 39.6 20.9 I 25.5 31.3 35.5 38.1 20.1 24.7 29.8 33.3 35.4 18.5 23.5 27.2 30.2 34.2 17.0 22.0 25.6 28.7 30.2
16.4 21.5 25.2 27.4 29.5
Table 1. Total cooling capacity-baseline. (kilo-Btu / hr)
80-'F 85°F 90% 95°F IOOOF IOSOF 110°F
6.06 7.57 10.35 11.22 12.19 5.03 5.46 9.47 10.60 11.01 4.17 5.18 8.43 9.78 10.52 3.24 5.32 7.34 I 8.32 855 2.80 4.09 5.69 6.08 8.95 2.10 3.61 4.76 5.12 4.92 1.96 3.47 4.39 4.74 2.80
Capacity (kBtu/hr)
50 r
IO I I I 1 I 80 85 90 95 IO0 105 I10
Ambient Temperature (deg F)
I~.l200rpm+1652rpm k2104rpm 52556rpm #3000rpm 1
Figure 3. Total cooling capacity-baseline.
Table 2. Latent cooling capacity-baseline (kilo-Btu / hr)
Engine Speed Temp I 1200 rpm I 1652 rpm 1 2104 rpm I 2556 rpm I 30CO rpm I
Outdoor
COP 1.7 ~
0. -.. ..................................
1 . 1 - - - x\ t t , . . - - -
o,* L ...... ???Ax . . . . . . . . . . . . . . .
& 1 X 0.5 I I I 1
80 85 90 9s 100 105 110
Outdoor temperature
*I200 rpm .f1652 rpm *2104 rpm 9 2 5 5 6 rpm x3000 rpm i
Figure 4. Cooline COP--baseline.
Total cooling capacity and latent cooling capacity for LOF tests are shown in Table 3 and Table 4
respectively. The outlined areas mark the conditions at which results from the LOF tests exceeded those from the baseline tests. At low temperatures and speeds, LOF results are slightly under to just over results for the same conditions in baseline testing. As outdoor temperature and engine speed increase, so too increases the positive differential in performance between LOF results and baseline results-both for total cooling capacity and for latent cooling capacity. At the charging condition of 21 04 rpm and 95 OF, LOF cooling capacity realizes a 13.1 % increase over baseline cooling capacity. However, at 3000 rpm and 11OoF, LOF cooling capacity is increased by 26.1% over baseline cooling capacity. LOF cooling capacity is likewise shown graphically in Figure 5.
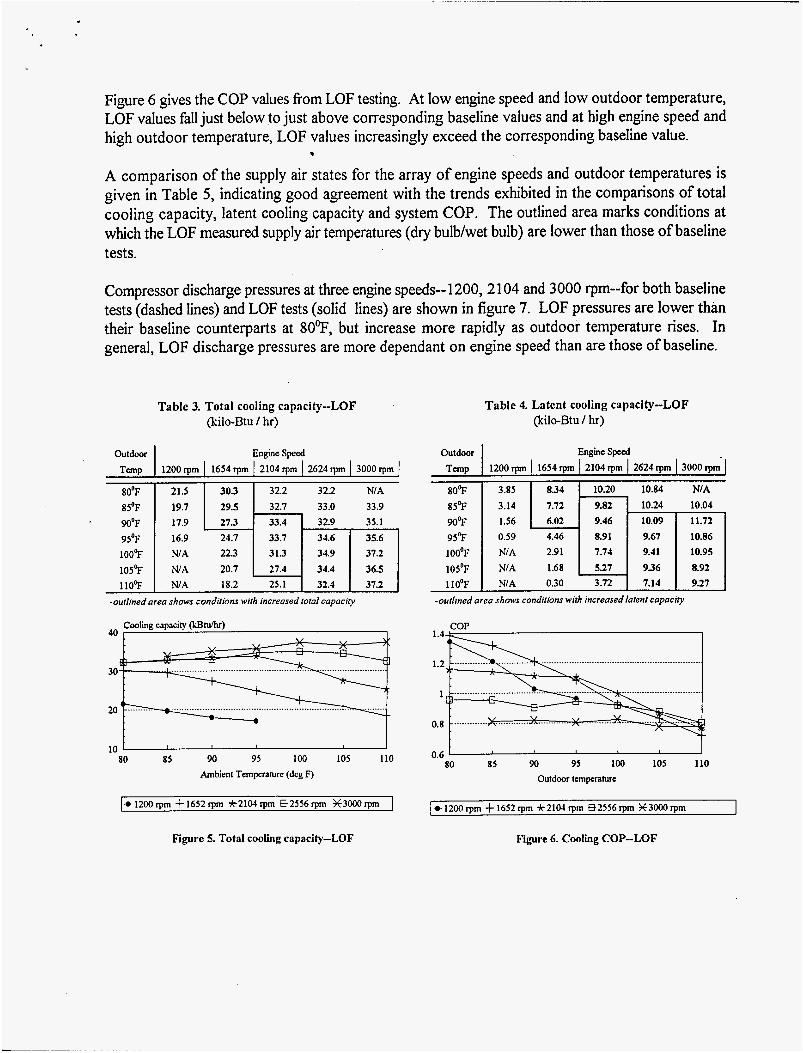
Figure 6 gives the COP values from LOF testing. At low engine speed and low outdoor temperature, LOF values fall just below to just above corresponding baseline values and at high engine speed and high outdoor temperature, LOF values increasingly exceed the corresponding baseline value.
A comparison of the supply air states for the array of engine speeds and outdoor temperatures is given in Table 5, indicating good agreement with the trends exhibited in the comparisons of total cooling capacity, latent cooling capacity and system COP. The outlined area marks conditions at which the LOF measured supply air temperatures (dry bulb/wet bulb) are lower than those of baseline tests.
m
Outdoor
Temp
Compressor discharge pressures at three engine speeds--1200,2104 and 3000 rpm--for both baseline tests (dashed lines) and LOF tests (solid lines) are shown in figure 7. LOF pressures are lower than their baseline counterparts at 809, but increase more rapidly as outdoor temperature rises. In general, LOF discharge pressures are more dependant on engine speed than are those of baseline.
Engine Speed 1200rpm I 1654rpm I 2104rpm I 2624rpm 1 3000rpm
Table 3. Total cooling capacity-LOF (kilo-Btu / hr)
Outdoor
Temp
80'F
Engine Speed 1200 rpm 1 1654 rpm 2104 rpm I 2624 rpm I 3000 rpm
21.5 I 3 0 3 32.2 32.2 NIA 29.5 2 7 3
95'F 1 ;::: I ::: 1 1 :3:; 1 1059 20.1 27.4 34.4 36.5 110°F NIA 18.2 25.1 32.4 37.2
1009
-outlined area shows conditions with increased total capacity
32.1 33.0 33.9 33.4 32.9 35.1
Cooling capacity (kBtu/hr) 40
30
20
lO5'F 1lO'F
I I 80 85 90 95 100 105 110
Ambient Temperature (deg F)
N/A 1.68 5.27 936 8.92 NIA 0.30 3.12 7.14 9.21
Figure 5. Total cooling capacity-LOF
Table 4. Latent cooling capacity-LOF (kilo-Btu / hr)
-outlined area shows conditions with increased latent capacity
COP
1.2 ...........................................................................................
l . - ~ 1 ....................................................................................... 1 ............. x ............. x ............. ............
0.6 80 85 90 95 loo 105 110
Outdoor tcmpture
1+1200rpm +1652rpm 4-2104rpm B2556rpm X3000rpm
Figure 6. Cooling COP-LOF

Table 5. Supply air conditions Baseline
(dry bulb / wet bulb OF)
Outdoor Temp
80°F 85°F 90°F 95°F 100°F 105°F llO"F
LOF (dry bulb / wet bulb OF)
Engine Speed 12M)rpm 1 1654 rpm 2104 rpm I 2621 rpm 1 3000 rpm I 59.2158.8 57.3156.6 59.5157.0 62.758.6 MA
59.91 59.4 51.4 156.8 58.7 156.8 61.5 ' 58.2 62.9 158.1
60.8160.2 58.6158.0 57.9156.7 61.5 '58.3 62.6158.5
61.5160.9 59.7159.1 57.5156.8 60.1j57.9 62.0158.5
NIA 60.5159.7 58.5157.6 598'58.0 60.7158.0
NIA 61.1160.3 59.9159.0 593!57.8 60.0158.0
NIA 62.0161.0 60.4159.5 59.8158.4 59.6151.9
Outdoor Temp
Engine Speed 1200 rpm 1 1654 rpm I 2104 rpm 1 2621 rpm I 3000 rpna
Compressor discharge presaFe (psig) 350
rum 'pm 300
I50 I I I
80 85 90 95 100 105 110 Outdoor temperature (deg F)
I + 1200 rprn +2104 rpm *330WBcpm - - -Baseline tests
Figure 7. Comprussure discharge pressure
5. DISCUSSION AND CONCLUSIONS
In single speed liquid over-fed systems, the general behavior of refrigerant inventory is to tend toward an under-charged state at ambient temperatures below the design point and to tend toward an over-charged state at ambient temperatures above the design point. An associated deviation from optimum performance comes with these tendencies. Recalling that this LOF test was optimized for the central point of 2 104 rpm at 95'F, the above mentioned tendencies toward over-charging and under-charging are evident. However, the multi-speed nature of the unit adds another variable that acts to compensate for these tendencies to a large degree. For example, when the ambient temperature is above 95'F (at 2 104 rpm) the system tends to become over-charged; this however can be compensated for with an increase in engine speed, with the result being that there are optimum points at each ambient temperature, albeit at different engine speeds. Since, in general. the call for cooling capacity is small at low ambient temperatures and greater at high ambient temperatures, it follows that the lower the ambient temperature, the lower the necessary engine speed and the higher the ambient temperature, the higher the necessary engine speed. As is shown in the data on cooling capacity, LOF optimum points tend to follow the same pattern, yielding higher capacity at the optimum speed for a given temperature. Recalling that only five of the possible seventeen engine speeds were tested, interpolation of the cooling capacity data approximates the optimum engine
speed for 8O0F ambient to be 1540 rpm and similarly for 1 10°F to be 2888 rpm, with a linear correlation at intermediate speeds and temperatures.
The COP data reveals the same trend as cooling capacity, that for each ambient temperature there is a corresponding engine speed that optimizes LOF performance. As with cooling capacity, particularly good improvement in system COP is realized at high ambient temperature conditions with high compressor speeds. Compressor discharge pressure at optimum LOF points is slightly higher than for similar points at baseline, particularly at high ambient temperatures. This is a consequence of using a fixed size expansion device. The higher pressures are still well within acceptable levels for maintaining compressor integrity.
At conditions well away from optimum--high engine speed and low ambient temperature, or low engine speed and high ambient temperature--two distinct paths are followed. In the first case, of slow engine speed coupled with high temperature, the system tends to be substantially over-charged creating an abnormally warm evaporator. In such a case, there is a risk of sending too much liquid refiigerant into the accumulator, and hence potentially to the compressor inlet. In the second case of fast engine speed coupled with low temperature, the system tends to be substantially undercharged and hence operates with a high level of evaporator exit refrigerant superheat. While this is not efficient--as reflected in the system COP--it is not particularly detrimental to the system. These just described extreme conditions, while tested in the laboratory, are not conditions for which the tested unit was originally designed and are thus not of great concern in implementation considerations.
An inherent deficiency in vapor compression air conditioning systems is the deterioration of cooling capacity at high ambient temperatures, conditions where the most capacity is needed. This previously explained exploration of the effectiveness of liquid over-feeding in a multi-speed system has revealed that such a system has complementary properties that provide much greater cooling capacity at high ambient temperatures. Additionally, the added capacity does not come with a tax on efficiency, in fact, efficiency--measured as total system COP--increases as well.
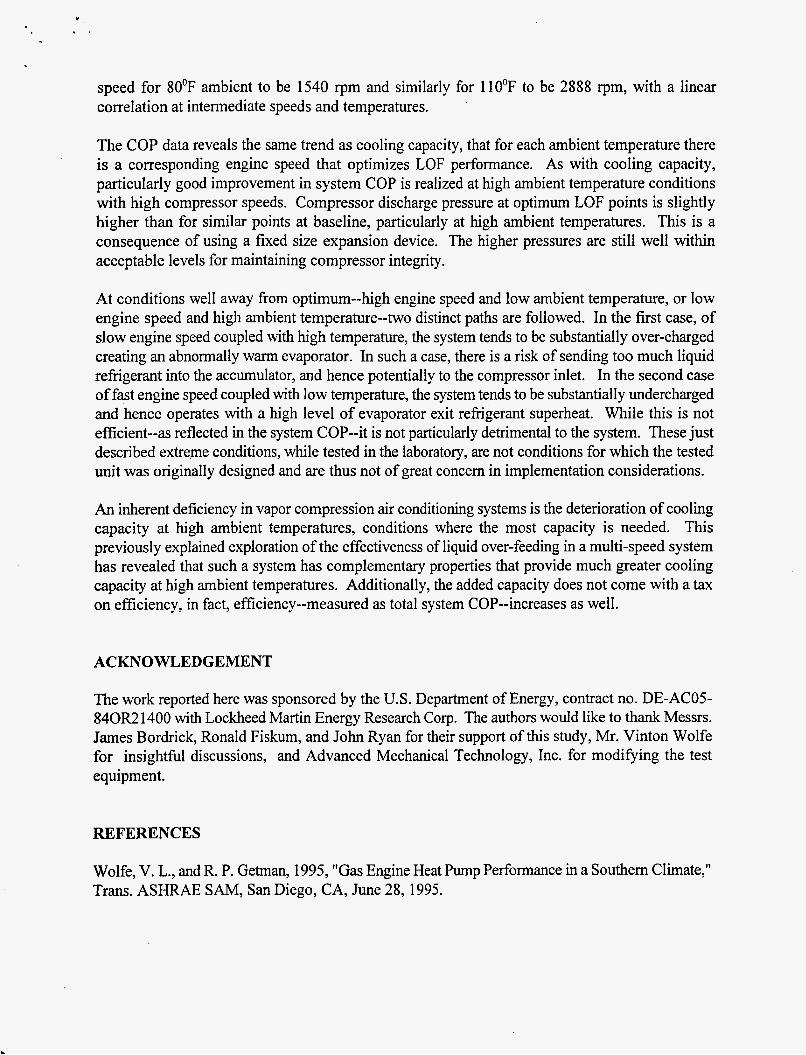
ACKNOWLEDGEMENT
The work reported here was sponsored by the U.S. Department of Energy, contract no. DE-ACO5- 840R2 1400 with Lockheed Martin Energy Research Corp. The authors would like to thank Messrs. James Bordrick, Ronald Fiskum, and John Ryan for their support of this study, Mr. Vinton Wolfe for insightful discussions, and Advanced Mechanical Technology, Inc. for modifying the test equipment.
REFERENCES
Wolfe, V. L., and R. P. Getman, 1995, "Gas Engine Heat Pump Performance in a Southern Climate," Trans. ASHRAE SAM, San Diego, CA, June 28,1995.

Mei, V. C., and F. C. Chen, 1993, "Liquid Over-Feeding Air Conditioining System and Method," US. Patent 5,245,833, Sept. 21, 1993.
Mei, V. C., F. C. Chen et al., 1993, "A Recuperative Air Conditioning Cycle," Heat Pump and Refiigeration Systems Design. Analvsis. and Applications, AES-Vol. 29, AMSE, pp. 19-26.
York Triathlon Heat Pump Installation Instruction, 5 15.35-N1.1Y (695), 1996, York International C o p , York, PA 17405

M98003372 I11111111 11111111 lllll111111111111111111111111111111111
Report Number (14)ORNL/CP- %8'7?
Publ. Date (11) L f?8 I Sponsor Code (18) O C k E XF uc Category (19) &c- 7 0 0 D OEjEK
DOE