oecd science, technology and industry outlook 2006 · 2007-06-12 · he oecd science, technology,...
TRANSCRIPT

2006
OE
CD
Sc
ien
ce
, Tec
hn
olo
gy a
nd
Ind
ustry
Ou
tloo
k
ISBN 92-64-02848-X92 2006 08 1 P
OECD Science, Technology and Industry Outlook
Science, technology and innovation have taken centre stage in efforts to boost economic growth and improve social well-being. OECD countries and non-members alike are introducing far-reaching reforms to strengthen investments in science, technology and innovation, and to enhance their contribution to national economies in a context of increasing globalisation. What types of reforms have they introduced and what are the main issues they aim to address? What emerging issues will policy makers need to address to improve future innovation capabilities? What policies can best stimulate the creation, diffusion, and exploitation of knowledge in all sectors of an increasingly competitive, global economy?
The OECD Science, Technology and Industry Outlook 2006 aims to answer such questions by offering a comprehensive review of key trends in science, technology and innovation policy, and reviewing recent policy developments in OECD countries. In addition to examining main trends across the OECD, the report delves into specific topics that are high on the agenda of innovation policy makers, including the role of intellectual property rights and technology licensing markets in innovation performance, policies to enhance benefits of the globalisation of business R&D, human resources for science and technology, and the evaluation of innovation policy. While retaining its focus on developments in OECD countries, this edition of this biennial publication highlights key developments in a number of important non-member economies, including China, Russia and South Africa. A statistical annex provides up-to-date statistics on R&D funding, patents, researchers and other indicators of innovative performance.
www.oecd.org/sti
-:HSTCQE=UW]Y]\:2006
The full text of this book is available on line via these links:
http://www.sourceoecd.org/industrytrade/926402848Xhttp://www.sourceoecd.org/scienceIT/926402848Xhttp://www.sourceoecd.org/industry/926402848X
Those with access to all OECD books on line should use this link: http://www.sourceoecd.org/926402848X
SourceOECD is the OECD’s online library of books, periodicals and statistical databases. For more information about this award-winning service and free trials ask your librarian, or write to us at [email protected].
OECD Science, Technology and Industry Outlook
2006
«922006081cov.indd 1 08-Nov-2006 11:36:21 AM


ORGANISATION FOR ECONOMIC CO-OPERATION AND DEVELOPMENT
OECD Science,Technology and Industry
Outlook 2006

ORGANISATION FOR ECONOMIC CO-OPERATION AND DEVELOPMENT
The OECD is a unique forum where the governments of 30 democracies work together to
address the economic, social and environmental challenges of globalisation. The OECD is also at
the forefront of efforts to understand and to help governments respond to new developments and
concerns, such as corporate governance, the information economy and the challenges of an
ageing population. The Organisation provides a setting where governments can compare policy
experiences, seek answers to common problems, identify good practice and work to co-ordinate
domestic and international policies.
The OECD member countries are: Australia, Austria, Belgium, Canada, the Czech Republic,
Denmark, Finland, France, Germany, Greece, Hungary, Iceland, Ireland, Italy, Japan, Korea,
Luxembourg, Mexico, the Netherlands, New Zealand, Norway, Poland, Portugal, the Slovak Republic,
Spain, Sweden, Switzerland, Turkey, the United Kingdom and the United States. The Commission of
the European Communities takes part in the work of the OECD.
OECD Publishing disseminates widely the results of the Organisation’s statistics gathering and
research on economic, social and environmental issues, as well as the conventions, guidelines and
standards agreed by its members.
Also available in French under the title:
Science, technologie et industrie
PERSPECTIVES DE L’OCDE 2006
© OECD 2006
No reproduction, copy, transmission or translation of this publication may be made without written permission. Applications should be sent to
OECD Publishing: [email protected] or by fax (33 1) 45 24 13 91. Permission to photocopy a portion of this work should be addressed to the Centre
français d'exploitation du droit de copie, 20, rue des Grands-Augustins, 75006 Paris, France ([email protected]).
This work is published on the responsibility of the Secretary-General of the OECD. The
opinions expressed and arguments employed herein do not necessarily reflect the officialviews of the Organisation or of the governments of its member countries.

FOREWORD
Foreword
The OECD Science, Technology, and Industry Outlook 2006 is the sixth in a biennial series
designed to provide regular overviews of trends, prospects and policy directions in science, technology
and innovation across the OECD area. In addition to synthesising the latest available information on
major policy developments in OECD countries and selected non-members, the report provides in-
depth analyses of key themes in science, technology and industry policy, with a particular emphasis
on innovation. Special chapters examine human resources for science and technology, globalisation
of R&D, technology licensing markets and the evaluation of innovation policy, all of which are areas
of growing policy interest.
The report has been prepared under the aegis of the OECD Committee for Scientific and
Technological Policy (CSTP), with input from its working parties. Chapters were prepared by several
members of the OECD Directorate for Science, Technology and Industry, including Mario Cervantes,
Koen de Backer, Jean Guinet, Thomas Hatzichronoglou, Shigeki Kamiyama, Catalina Martinez,
Jerry Sheehan, Shuji Tamura and Gang Zhang. Luke Georghiou and Philippe Laredo of PREST
contributed to the chapter on evaluation. Jerry Sheehan, and subsequently Ester Basri and
Mario Cervantes, served as the overall co-ordinators of the publication, working closely with
Dirk Pilat, head of the OECD Science and Technology Policy division. Sandrine Kergroach and
Martin Schaaper provided statistical assistance on OECD and non-OECD countries, respectively;
and Marion Barberis, Nathalie Callewaere and Philippe Marson provided secretarial support. The
report benefited from substantive input and comments from delegates to the CSTP, its Working Party
on Innovation and Technology Policy, the Working Party on Steering and Funding of Research
Institutions, and several members of the OECD Secretariat.
OECD SCIENCE, TECHNOLOGY AND INDUSTRY OUTLOOK 2006 – ISBN 92-64-02848-X – © OECD 2006 3

TABLE OF CONTENTS
Table of Contents
Executive Summary . . . . . . . . . . . . . . . . . . . . . . . . . . . . . . . . . . . . . . . . . . . . . . . . . . . . . . . . . 9
Chapter 1. Science, Technology and Industry: Recent Trends at a Glance . . . . . . . . . . 19
A benign economic environment . . . . . . . . . . . . . . . . . . . . . . . . . . . . . . . . . . . . . . . . . . 20
Investments in R&D have rebounded . . . . . . . . . . . . . . . . . . . . . . . . . . . . . . . . . . . . . . . 21
New patterns of R&D performance . . . . . . . . . . . . . . . . . . . . . . . . . . . . . . . . . . . . . . . . . 27
Human resources . . . . . . . . . . . . . . . . . . . . . . . . . . . . . . . . . . . . . . . . . . . . . . . . . . . . . . . . 33
Scientific and technological output has expanded. . . . . . . . . . . . . . . . . . . . . . . . . . . . 38
A more global context for innovation . . . . . . . . . . . . . . . . . . . . . . . . . . . . . . . . . . . . . . . 40
Summing up . . . . . . . . . . . . . . . . . . . . . . . . . . . . . . . . . . . . . . . . . . . . . . . . . . . . . . . . . . . . 46
Notes . . . . . . . . . . . . . . . . . . . . . . . . . . . . . . . . . . . . . . . . . . . . . . . . . . . . . . . . . . . . . . . . . . 46
Bibliography . . . . . . . . . . . . . . . . . . . . . . . . . . . . . . . . . . . . . . . . . . . . . . . . . . . . . . . . . . . . 47
Chapter 2. National Developments in Science, Technology and Innovation Policy. . . 49
Introduction . . . . . . . . . . . . . . . . . . . . . . . . . . . . . . . . . . . . . . . . . . . . . . . . . . . . . . . . . . . . 50
National strategies for science, technology and innovation . . . . . . . . . . . . . . . . . . . . 51
Strengthening public research and public research organisations. . . . . . . . . . . . . . . 59
Support for business R&D and innovation . . . . . . . . . . . . . . . . . . . . . . . . . . . . . . . . . . . 67
Enhancing collaboration and networking among innovators . . . . . . . . . . . . . . . . . . . 74
Globalisation of research and innovation. . . . . . . . . . . . . . . . . . . . . . . . . . . . . . . . . . . . 78
Evaluating innovation policies . . . . . . . . . . . . . . . . . . . . . . . . . . . . . . . . . . . . . . . . . . . . . 80
Outlook: future challenges . . . . . . . . . . . . . . . . . . . . . . . . . . . . . . . . . . . . . . . . . . . . . . . . 86
Notes . . . . . . . . . . . . . . . . . . . . . . . . . . . . . . . . . . . . . . . . . . . . . . . . . . . . . . . . . . . . . . . . . . 90
Chapter 3. Human Resources in Science and Technology: Trends and Policies. . . . . . 91
Introduction . . . . . . . . . . . . . . . . . . . . . . . . . . . . . . . . . . . . . . . . . . . . . . . . . . . . . . . . . . . . 92
Labour market outcomes of S&T graduates. . . . . . . . . . . . . . . . . . . . . . . . . . . . . . . . . . 103
Policy developments in the area of HRST . . . . . . . . . . . . . . . . . . . . . . . . . . . . . . . . . . . . 105
Conclusions. . . . . . . . . . . . . . . . . . . . . . . . . . . . . . . . . . . . . . . . . . . . . . . . . . . . . . . . . . . . . 118
Notes . . . . . . . . . . . . . . . . . . . . . . . . . . . . . . . . . . . . . . . . . . . . . . . . . . . . . . . . . . . . . . . . . . 119
Bibliography . . . . . . . . . . . . . . . . . . . . . . . . . . . . . . . . . . . . . . . . . . . . . . . . . . . . . . . . . . . . 119
Chapter 4. The Internationalisation of R&D . . . . . . . . . . . . . . . . . . . . . . . . . . . . . . . . . . . . 121
Introduction . . . . . . . . . . . . . . . . . . . . . . . . . . . . . . . . . . . . . . . . . . . . . . . . . . . . . . . . . . . . 122
Major trends in the internationalisation of R&D. . . . . . . . . . . . . . . . . . . . . . . . . . . . . . 123
Drivers of the internationalisation of R&D. . . . . . . . . . . . . . . . . . . . . . . . . . . . . . . . . . . 134
Policy implications . . . . . . . . . . . . . . . . . . . . . . . . . . . . . . . . . . . . . . . . . . . . . . . . . . . . . . . 140
Bibliography . . . . . . . . . . . . . . . . . . . . . . . . . . . . . . . . . . . . . . . . . . . . . . . . . . . . . . . . . . . . 147
OECD SCIENCE, TECHNOLOGY AND INDUSTRY OUTLOOK 2006 – ISBN 92-64-02848-X – © OECD 20064

TABLE OF CONTENTS
Chapter 5. Patent Licensing Markets and Innovation . . . . . . . . . . . . . . . . . . . . . . . . . . . . 149
Introduction . . . . . . . . . . . . . . . . . . . . . . . . . . . . . . . . . . . . . . . . . . . . . . . . . . . . . . . . . . . . 150
Managing and exploiting IP . . . . . . . . . . . . . . . . . . . . . . . . . . . . . . . . . . . . . . . . . . . . . . . 150
Measuring technology markets . . . . . . . . . . . . . . . . . . . . . . . . . . . . . . . . . . . . . . . . . . . . 158
Encouraging patent licensing: the role of public institutions . . . . . . . . . . . . . . . . . . . 162
Conclusion . . . . . . . . . . . . . . . . . . . . . . . . . . . . . . . . . . . . . . . . . . . . . . . . . . . . . . . . . . . . . 170
Notes . . . . . . . . . . . . . . . . . . . . . . . . . . . . . . . . . . . . . . . . . . . . . . . . . . . . . . . . . . . . . . . . . . 171
Bibliography . . . . . . . . . . . . . . . . . . . . . . . . . . . . . . . . . . . . . . . . . . . . . . . . . . . . . . . . . . . . 174
Chapter 6. Evaluation of Publicly Funded Research: Recent Trendsand Perspectives . . . . . . . . . . . . . . . . . . . . . . . . . . . . . . . . . . . . . . . . . . . . . . . . . . 177
Introduction . . . . . . . . . . . . . . . . . . . . . . . . . . . . . . . . . . . . . . . . . . . . . . . . . . . . . . . . . . . . 178
Evaluation of research institutes and groups . . . . . . . . . . . . . . . . . . . . . . . . . . . . . . . . 180
Evaluation of research institutions and operators . . . . . . . . . . . . . . . . . . . . . . . . . . . . 183
Evaluation of research programmes and procedures . . . . . . . . . . . . . . . . . . . . . . . . . . 185
Evaluation of research systems . . . . . . . . . . . . . . . . . . . . . . . . . . . . . . . . . . . . . . . . . . . . 190
Conclusions. . . . . . . . . . . . . . . . . . . . . . . . . . . . . . . . . . . . . . . . . . . . . . . . . . . . . . . . . . . . . 192
Notes . . . . . . . . . . . . . . . . . . . . . . . . . . . . . . . . . . . . . . . . . . . . . . . . . . . . . . . . . . . . . . . . . . 198
Bibliography . . . . . . . . . . . . . . . . . . . . . . . . . . . . . . . . . . . . . . . . . . . . . . . . . . . . . . . . . . . . 199
Statistical Annex
Main OECD Databases Used . . . . . . . . . . . . . . . . . . . . . . . . . . . . . . . . . . . . . . . . . . . . . . . 201
Standard Statistical Notes Used in the Annex Tables. . . . . . . . . . . . . . . . . . . . . . . . . . 205
Standard Industry Agreggation by Technology Level . . . . . . . . . . . . . . . . . . . . . . . . . . 206
Annex Tables. . . . . . . . . . . . . . . . . . . . . . . . . . . . . . . . . . . . . . . . . . . . . . . . . . . . . . . . . . . . 207
List of Boxes
1.1. Careers of doctorate holders. . . . . . . . . . . . . . . . . . . . . . . . . . . . . . . . . . . . . . . . . . . . 37
2.1. Research and innovation policies of the European Commission . . . . . . . . . . . . . 63
2.2. The European Research Council (ERC). . . . . . . . . . . . . . . . . . . . . . . . . . . . . . . . . . . . 64
2.3. S&T policy at state level in Australia. . . . . . . . . . . . . . . . . . . . . . . . . . . . . . . . . . . . . 76
2.4. The Europe INNOVA Initiative . . . . . . . . . . . . . . . . . . . . . . . . . . . . . . . . . . . . . . . . . . 77
2.5. S&T Policy Developments in selected non-member economies . . . . . . . . . . . . . . 88
3.1. OECD Global Science Forum study on evolution of student interest
in S&T studies 2006 . . . . . . . . . . . . . . . . . . . . . . . . . . . . . . . . . . . . . . . . . . . . . . . . . . . 98
3.2. Labour market situation for recent PhD graduates: results from
the OECD Careers of Doctorate Holders Survey . . . . . . . . . . . . . . . . . . . . . . . . . . . . 104
3.3. Promoting S&T studies from primary education to the labour market:
a cross-ministerial approach in the Netherlands . . . . . . . . . . . . . . . . . . . . . . . . . . 105
3.4. Industrial PhD training: some policy examples . . . . . . . . . . . . . . . . . . . . . . . . . . . . 108
3.5. Policies to promote human resources in S&T in non-member economies . . . . . 114
3.6. International mobility of researchers in the public research sector:
Germany (Max Planck Society) and France (CNRS) . . . . . . . . . . . . . . . . . . . . . . . . . 115
3.7. International Chairs for Research Excellence . . . . . . . . . . . . . . . . . . . . . . . . . . . . . 116
4.1. International R&D collaboration and alliances . . . . . . . . . . . . . . . . . . . . . . . . . . . . 126
4.2. New initiative on the collection of data on R&D by foreign affiliates. . . . . . . . . . 132
4.3. Policy practices . . . . . . . . . . . . . . . . . . . . . . . . . . . . . . . . . . . . . . . . . . . . . . . . . . . . . . . 145
OECD SCIENCE, TECHNOLOGY AND INDUSTRY OUTLOOK 2006 – ISBN 92-64-02848-X – © OECD 2006 5

TABLE OF CONTENTS
5.1. IP and technology intermediaries . . . . . . . . . . . . . . . . . . . . . . . . . . . . . . . . . . . . . . . 165
5.2. Methods for patent valuation . . . . . . . . . . . . . . . . . . . . . . . . . . . . . . . . . . . . . . . . . . . 169
6.1. The need for a broad perspective on evaluation . . . . . . . . . . . . . . . . . . . . . . . . . . . 179
6.2. The United Kingdom’s Research Assessment Exercise. . . . . . . . . . . . . . . . . . . . . . 182
6.3. The evaluation of ANVAR, the French Innovation Agency. . . . . . . . . . . . . . . . . . . 187
6.4. Evaluation of EUREKA . . . . . . . . . . . . . . . . . . . . . . . . . . . . . . . . . . . . . . . . . . . . . . . . . . . . . . 188
6.5. US Advanced Technology Program . . . . . . . . . . . . . . . . . . . . . . . . . . . . . . . . . . . . . . 188
6.6. The recent OECD study on behavioural additionality. . . . . . . . . . . . . . . . . . . . . . . 189
6.7. Evaluation of foresight programmes . . . . . . . . . . . . . . . . . . . . . . . . . . . . . . . . . . . . . 193
List of Figures
1.1. R&D trends in major OECD regions, 1991-2004 . . . . . . . . . . . . . . . . . . . . . . . . . . . . 22
1.2. R&D intensity in OECD countries, 1995, 2000 and 2004 . . . . . . . . . . . . . . . . . . . . . 23
1.3. Government-financed R&D. . . . . . . . . . . . . . . . . . . . . . . . . . . . . . . . . . . . . . . . . . . . . 24
1.4. Direct government funding of business R&D and tax incentives for R&D. . . . . . 25
1.5. Share of higher education R&D financed by industry 1995, 2000 and 2004. . . . . 26
1.6. R&D performed in higher education and government institutions,
1996-2004 . . . . . . . . . . . . . . . . . . . . . . . . . . . . . . . . . . . . . . . . . . . . . . . . . . . . . . . . . . . . 28
1.7. Higher education research and development . . . . . . . . . . . . . . . . . . . . . . . . . . . . . 29
1.8. Higher education research and development expenditure by field
of study, 2003. . . . . . . . . . . . . . . . . . . . . . . . . . . . . . . . . . . . . . . . . . . . . . . . . . . . . . . . . 29
1.9. Business R&D spending in major OECD regions, 1991-2004. . . . . . . . . . . . . . . . . . 30
1.10. BERD intensity by country, 1995, 2000 and 2004 . . . . . . . . . . . . . . . . . . . . . . . . . . . 31
1.11. Business R&D expenditures in services and manufacturing, 1990-2003 . . . . . . . . 32
1.12. Share of business R&D in the manufacturing sector
by technological intensity, 2003 . . . . . . . . . . . . . . . . . . . . . . . . . . . . . . . . . . . . . . . . . 32
1.13. Employment in professional, scientific and technical occupations . . . . . . . . . . . 33
1.14. Business researchers per thousand employment in industry . . . . . . . . . . . . . . . . 34
1.15. Higher education researchers. . . . . . . . . . . . . . . . . . . . . . . . . . . . . . . . . . . . . . . . . . . 35
1.16. Women researchers, 2004 . . . . . . . . . . . . . . . . . . . . . . . . . . . . . . . . . . . . . . . . . . . . . . 36
1.17. Top places of origin of foreign scholars in the United States,
headcount, 2003/2004 . . . . . . . . . . . . . . . . . . . . . . . . . . . . . . . . . . . . . . . . . . . . . . . . . 37
1.18. Patent families, 1985-2002. . . . . . . . . . . . . . . . . . . . . . . . . . . . . . . . . . . . . . . . . . . . . . 39
1.19. R&D expenditure of foreign affiliates, 1995, 2000 and 2003 . . . . . . . . . . . . . . . . . . 41
1.20. Average annual growth rates of R&D expenditure and R&D personnel,
1995-2004 (%). . . . . . . . . . . . . . . . . . . . . . . . . . . . . . . . . . . . . . . . . . . . . . . . . . . . . . . . . 42
1.21. R&D intensity in non-member economies . . . . . . . . . . . . . . . . . . . . . . . . . . . . . . . . 43
1.22. Geographical distribution of overseas R&D expenditure
by US-owned subsidiaries . . . . . . . . . . . . . . . . . . . . . . . . . . . . . . . . . . . . . . . . . . . . . . 45
3.1. Demand for HRST and researchers, 2004 . . . . . . . . . . . . . . . . . . . . . . . . . . . . . . . . . 93
3.2. Supply of science and engineering graduates in G7 economies, 1998-2002 . . . . 95
3.3. Supply of science graduates in selected non-G7 economies, 1998-2002 . . . . . . . 96
3.4. Supply of engineering graduates in selected non-G7 economies, 1998-2002 . . . . 97
3.5. PhD graduates in science and engineering and other fields, 2002,
per million population. . . . . . . . . . . . . . . . . . . . . . . . . . . . . . . . . . . . . . . . . . . . . . . . . 99
3.6. Duration of full-time PhD programmes, average number of years . . . . . . . . . . . . 100
3.7. Trends in post-doctorates in the United States . . . . . . . . . . . . . . . . . . . . . . . . . . . . 100
OECD SCIENCE, TECHNOLOGY AND INDUSTRY OUTLOOK 2006 – ISBN 92-64-02848-X – © OECD 20066

TABLE OF CONTENTS
3.8. International mobility of PhD students and the highly skilled . . . . . . . . . . . . . . 1033.9. Outward and return migration of Chinese students, 1991-2003 . . . . . . . . . . . . . . 1174.1. R&D flows between EU15, the United States and Japan, 2002 . . . . . . . . . . . . . . . . 1234.2. Trends in the share of R&D expenditure under foreign control in the business
sector in selected OECD countries between 1995 and 2003 . . . . . . . . . . . . . . . . . . . 1244.3. Growth of R&D expenditures of affiliates under foreign control
and firms controlled by the compiling country between 1995 and 2003in selected OECD countries . . . . . . . . . . . . . . . . . . . . . . . . . . . . . . . . . . . . . . . . . . . . . 125
4.4. Share of affiliates under foreign control in total business sector R&Dexpenditures, 1995 and 2003. . . . . . . . . . . . . . . . . . . . . . . . . . . . . . . . . . . . . . . . . . . . 126
4.5. R&D intensity of affiliates under foreign control and firms controlledby the compiling countries, 2003 . . . . . . . . . . . . . . . . . . . . . . . . . . . . . . . . . . . . . . . . 127
4.6. Foreign ownership of domestic inventions . . . . . . . . . . . . . . . . . . . . . . . . . . . . . . . 1284.7. Domestic ownership of inventions made abroad . . . . . . . . . . . . . . . . . . . . . . . . . . 1294.8. Changes in the technology balance of payments as a percentage of GDP. . . . . . 1304.9. Technology balance of payments (receipts – payments) as a percentage
of GDP, 2003 . . . . . . . . . . . . . . . . . . . . . . . . . . . . . . . . . . . . . . . . . . . . . . . . . . . . . . . . . . 1314.10. Business sector R&D expenditure by affiliates abroad as a percentage
of domestic R&D expenditure in selected OECD countries . . . . . . . . . . . . . . . . . . 1324.11. Current foreign R&D locations . . . . . . . . . . . . . . . . . . . . . . . . . . . . . . . . . . . . . . . . . . 1344.12. Most attractive foreign R&D locations. . . . . . . . . . . . . . . . . . . . . . . . . . . . . . . . . . . . 1354.13. Factors in locating R&D activities in developed countries . . . . . . . . . . . . . . . . . . . 1394.14. Factors in locating R&D activities in developing or emerging countries . . . . . . . 139
5.1. An illustration of the evolution of IP exploitation and demand for valuation . . . 1525.2. Receipts from international licensing in major OECD regions . . . . . . . . . . . . . . . 1605.3. Receipts from international patent licences and sales in Europe. . . . . . . . . . . . . 1615.4. International balance of payments for patent licences in Japan, total
and within group, FY2002 . . . . . . . . . . . . . . . . . . . . . . . . . . . . . . . . . . . . . . . . . . . . . . 161
List of Tables
1.1. General economic indicators . . . . . . . . . . . . . . . . . . . . . . . . . . . . . . . . . . . . . . . . . . . 211.2. Scientific articles by geographic region and field of science and technology . . . . 381.3. Number of patent families (priority year). . . . . . . . . . . . . . . . . . . . . . . . . . . . . . . . . 442.1. Revised or new national plans for science, technology and innovation policy
in OECD countries and selected non-member economies, 2006. . . . . . . . . . . . . . 522.2. National targets for R&D spending . . . . . . . . . . . . . . . . . . . . . . . . . . . . . . . . . . . . . . 602.3. Changes in IPR-related policies and business innovation . . . . . . . . . . . . . . . . . . . 682.4. Recent or proposed changes in R&D tax incentives in OECD countries, 2006. . . . 703.1. Types of policies to encourage the supply of S&T graduates . . . . . . . . . . . . . . . . . 1063.2. European Research Charter: general principles and requirements . . . . . . . . . . . 1123.3. Policies to facilitate international mobility of research
and other skilled workers . . . . . . . . . . . . . . . . . . . . . . . . . . . . . . . . . . . . . . . . . . . . . . 1154.1. R&D expenditures of affiliates of US parent companies abroad by country
or zone of destination . . . . . . . . . . . . . . . . . . . . . . . . . . . . . . . . . . . . . . . . . . . . . . . . . 1335.1. Some advantages and disadvantages of patent licensing . . . . . . . . . . . . . . . . . . . 1515.2. Reason for patenting product innovation. . . . . . . . . . . . . . . . . . . . . . . . . . . . . . . . . 1515.3. Reported licensing revenues. . . . . . . . . . . . . . . . . . . . . . . . . . . . . . . . . . . . . . . . . . . . 1556.1. Categories of methods . . . . . . . . . . . . . . . . . . . . . . . . . . . . . . . . . . . . . . . . . . . . . . . . . 180
OECD SCIENCE, TECHNOLOGY AND INDUSTRY OUTLOOK 2006 – ISBN 92-64-02848-X – © OECD 2006 7
TABLE OF CONTENTS
Statistical Annex Tables
1. Key figures on research and development . . . . . . . . . . . . . . . . . . . . . . . . . . . . . . . . 2082. Gross domestic expenditure on R&D (GERD) . . . . . . . . . . . . . . . . . . . . . . . . . . . . . . 2093. GERD intensity . . . . . . . . . . . . . . . . . . . . . . . . . . . . . . . . . . . . . . . . . . . . . . . . . . . . . . . 2104. Gross R&D expenditures . . . . . . . . . . . . . . . . . . . . . . . . . . . . . . . . . . . . . . . . . . . . . . . 2115. Basic research expenditure . . . . . . . . . . . . . . . . . . . . . . . . . . . . . . . . . . . . . . . . . . . . . 2126. Total researchers, full-time equivalent . . . . . . . . . . . . . . . . . . . . . . . . . . . . . . . . . . . 2137. Total researchers, per thousand total employment . . . . . . . . . . . . . . . . . . . . . . . . 2148. Industry-financed GERD . . . . . . . . . . . . . . . . . . . . . . . . . . . . . . . . . . . . . . . . . . . . . . . 2159. Government-financed GERD. . . . . . . . . . . . . . . . . . . . . . . . . . . . . . . . . . . . . . . . . . . . 216
10. Percentage of GERD financed by industry. . . . . . . . . . . . . . . . . . . . . . . . . . . . . . . . . 21711. Percentage of GERD financed by government . . . . . . . . . . . . . . . . . . . . . . . . . . . . . 21812. Percentage of GERD financed by other national sources . . . . . . . . . . . . . . . . . . . . 21913. Percentage of GERD financed by abroad . . . . . . . . . . . . . . . . . . . . . . . . . . . . . . . . . . 22014. Percentage of GERD performed by the business enterprise sector . . . . . . . . . . . . 22115. Percentage of GERD performed by the higher education sector . . . . . . . . . . . . . . 22216. Percentage of GERD performed by the government sector . . . . . . . . . . . . . . . . . . 22317. Percentage of GERD performed by the private non-profit sector . . . . . . . . . . . . . 22418. Business expenditure on R&D (BERD), as a percentage of GDP . . . . . . . . . . . . . . . 22519. Business expenditure on R&D (BERD), constant prices and PPP . . . . . . . . . . . . . . 22620. Percentage of BERD financed by industry . . . . . . . . . . . . . . . . . . . . . . . . . . . . . . . . . 22721. Percentage of BERD financed by government. . . . . . . . . . . . . . . . . . . . . . . . . . . . . . 22822. Percentage of BERD financed by other national sources . . . . . . . . . . . . . . . . . . . . 22923. Percentage of BERD financed by abroad . . . . . . . . . . . . . . . . . . . . . . . . . . . . . . . . . . 23024. Higher education R&D (HERD) . . . . . . . . . . . . . . . . . . . . . . . . . . . . . . . . . . . . . . . . . . 23125. Percentage of HERD financed by industry. . . . . . . . . . . . . . . . . . . . . . . . . . . . . . . . . 23226. Government expenditure on R&D (GOVERD) . . . . . . . . . . . . . . . . . . . . . . . . . . . . . . 23327. Total government budget appropriations or outlays for R&D (GBAORD) . . . . . . . 23428. Civil GBAORD by socio-economic objectives, 2006 . . . . . . . . . . . . . . . . . . . . . . . . . 23529. R&D expenditure of foreign affiliates . . . . . . . . . . . . . . . . . . . . . . . . . . . . . . . . . . . . 23630. Number of triadic patent families . . . . . . . . . . . . . . . . . . . . . . . . . . . . . . . . . . . . . . . 23731. Share of countries in triadic patent families . . . . . . . . . . . . . . . . . . . . . . . . . . . . . . 23832. Technology balance of payments: Receipts . . . . . . . . . . . . . . . . . . . . . . . . . . . . . . . 23933. Technology balance of payments: Payments . . . . . . . . . . . . . . . . . . . . . . . . . . . . . . 24034. Technology balance of payments: Payments as a percentage of GERD . . . . . . . . 24135. Tax treatment of R&D, 1990-2006. . . . . . . . . . . . . . . . . . . . . . . . . . . . . . . . . . . . . . . . 24236. Intensity in business R&D expenditures by sector, 1992 and 2002 . . . . . . . . . . . . 24337. Business R&D expenditures by sector, 1992 and 2002 or nearest year available. . 24538. Science and engineering articles by country, 1990-2003. . . . . . . . . . . . . . . . . . . . . 24739. Portfolio of S&E articles by field, 1996 and 2003. . . . . . . . . . . . . . . . . . . . . . . . . . . . 248
This book has...
StatLinksA service from OECD Publishing
that delivers ExcelTM files from the printed page!
Look for the StatLinks at the bottom right-hand corner of the tables or graphs in this book. To download the matching ExcelTM spreadsheet, just type the link into your internet browser, starting with the http://dx.doi.org prefix. If you’re reading the PDF e-book edition, and your pc is connected to the Internet, simply click on the link. You’ll find StatLinks appearing in more OECD books.
OECD SCIENCE, TECHNOLOGY AND INDUSTRY OUTLOOK 2006 – ISBN 92-64-02848-X – © OECD 20068

ISBN 92-64-02848-X
OECD Science, Technology and Industry Outlook 2006
© OECD 2006
Executive Summary
A brighter outlook for science, technology and innovation
Investment in science, technology and innovation has benefited from stronger economic growth
Several years of economic growth have benefited investment in science, technology and
innovation. Although the pace of growth has varied across the main OECD regions,
business investment has increased and consumer spending has rebounded overall, most
notably in the United States. This has increased demand for innovative products, processes
and services, and with it demand for scientific and technical knowledge. Improved
corporate profitability has paved the way for growing investment in intellectual assets,
including research and development (R&D), human resources and intellectual property.
Prospects for further expansion of investment in science, technology and innovation are
bright, although a number of risks remain. Real economic growth is projected to average
3% across the OECD region in 2006-07, driven by gains in all major economic regions, but a
number of concerns regarding trade imbalances, rising energy costs and other factors
could undermine growth prospects and affect future investment in science, technology
and innovation.
The pace of recovery has been weakest in Europe, where only a few countries are on track to meet R&D targets
Reflecting the improved economic conditions of recent years, OECD-wide investment in
R&D has begun to recover from its slump earlier in the decade. Total R&D spending reached
USD 729 billion in 2004, up almost 10% in real terms from 2000. Measured as a share of GDP,
OECD-wide R&D stood at 2.26% of GDP in 2004, above its level of 2.25% in 2003, but still
below its peak of 2.27% in 2001. Recent rates of growth in R&D spending have been highest
in the United States (4% a year between 2002 and 2004), followed by Japan (2.1% a year
between 2000 and 2004) and the EU25 (2.3% a year between 2000 and 2003), exacerbating
gaps among main OECD regions. R&D intensity reached 3.13% of GDP in Japan, and 2.68%
in the United States in 2004, compared to 1.81% in the EU25 in 2003, where only a few
countries are on track to meet R&D targets of 3% of GDP. Lower R&D intensity in Europe
relative to the United States and Japan is partly linked to cyclical conditions, but is
primarily due to structural factors. These include the make-up of Europe’s business sector,
in particular the small size of its information technology manufacturing and services
sectors, as well as a business climate which, in several EU countries, does not yet
adequately encourage private investment in research and innovation.
9

EXECUTIVE SUMMARY
Government spending drives recent R&D growth in the United States and the European Unionbut less in Japan
Trends in the financing of R&D vary significantly across the main OECD regions. In Europe
and the United States, recent gains were driven primarily by government expenditure;
whereas in Japan and other Asia-Pacific nations, industry has been the main engine of
growth. Government R&D expenditure rose from 0.71% to 0.83% of GDP in the United States
and from 0.62% to 0.63% of GDP in the EU25, while falling slightly in Japan where modest
increases in government R&D expenditures failed to keep pace with GDP growth. Iceland
and Ireland also saw significant growth in government-funded R&D. OECD-wide industry
R&D funding, in contrast, declined between 2000 and 2004, from 1.43% to 1.40% of GDP,
with the steepest declines in Sweden (3.0% to 2.6% of GDP) and the United States (1.91% to
1.7% of GDP). In contrast, industry-financed R&D climbed from 2.17% to 2.34% of GDP in
Japan and from 1.73% to 2.14% of GDP in Korea. Industry funding as a percentage of GDP
has remained relatively flat in the EU25 since 2000.
Industry R&D expenditures are poised to grow
Prospects for future growth in R&D investments are brightening. Government deficits are
expected to decline in coming years, and this may loosen constraints on government R&D
expenditure. More generous government tax incentives for R&D could further boost
business R&D spending. Moreover, recent industry surveys indicate that firms in the
United States and Europe intend to increase their R&D spending moderately in the coming
years, especially if corporate profits remain strong. Venture capital funding also appears to
have stabilised after plunging in the earlier part of the decade, with support for innovation
in small and start-up firms. US venture capital investments topped USD 22 billion in 2005,
up from USD 19.6 billion in 2002, while European venture capital climbed to
EUR 11.4 billion (approximately USD 14 billion), just short of its high of EUR 12.1 billion
in 2002.
Public-sector research has seen a resurgenceand services now comprise one-quarterof total business R&D in the OECD area
Important shifts are also under way in R&D performance. Benefiting from increased
government funding, public-sector research has grown in importance, rising from 0.63% to
0.68% of GDP between 2000 and 2004 as countries aim to enhance knowledge creation.
Business-performed R&D across the OECD also rebounded somewhat to USD 453 billion
in 2004 or 1.5% of GDP, after declining in the early part of the decade. More importantly, its
composition continues to evolve, with service industries accounting for a growing share.
Between 1990 and 2003, services sector R&D grew at an annual rate of 12%, compared to 3%
for manufacturing. Services now comprise one-quarter of total business R&D in the OECD,
and more than one-third in Australia, Denmark, the United States, Canada, the Czech
Republic and Norway. Recent innovation surveys indicate that the share of innovative firms
in some service industries – financial intermediation and business services in particular –
exceeds that of manufacturing.
OECD SCIENCE, TECHNOLOGY AND INDUSTRY OUTLOOK 2006 – ISBN 92-64-02848-X – © OECD 200610
EXECUTIVE SUMMARY
Multinational enterprises are driving the globalisation of R&D, especially in Asia where an ample supply of talent and growing markets offer new opportunities
Accompanying these shifts in financing and performance of R&D is the rapid globalisation
of science, technology and innovation. In most OECD countries, the share of R&D
performed by foreign affiliates has increased as multinational enterprises have acquired
foreign firms and established new R&D facilities outside their home country. More than
16% of business R&D in the OECD area was performed in foreign affiliates in 2004, up from
12% in 1993. In Hungary, Ireland, the Czech Republic, the United Kingdom and Australia,
the share exceeded 40%. Most R&D by foreign affiliates remains within OECD countries, but
the regions of fastest growth lie outside the OECD area, in particular in Asia, where growing
scientific and technical talent, rapidly expanding markets and lower wages offer fertile
ground for new investment. The combined R&D expenditure of China, Israel, Russia and
South Africa was equivalent to almost 17% of that of OECD countries in 2004, up from 7%
in 1995, and these countries attract a growing share of investment by foreign affiliates.
Recent policy initiatives aim to enhance the attractiveness of these countries to foreign
investment by improving their domestic innovation capabilities.
Policies to foster innovation have grown in importance
Many OECD countries have developed a national science and innovation strategy
As policy makers pay greater attention to innovation, more countries are developing
formal plans and strategies for science, technology and innovation – and are backing them
up with funding increases and changing institutional structures. The extended Backing
Australia’s Ability plan, for example, includes financing of AUD 5.3 billion for programmes
to be implemented through 2011. The Finnish government has strengthened its Science
and Technology Policy Council and boosted funding for its innovation agency (Tekes) and
the Academy of Finland by a total of EUR 50 million. France not only boosted funding for
public sector research by EUR 1 billion, but also established a new National Research
Agency to provide selective funding to public research and public/private partnerships. The
German government, which intends to publish a comprehensive High-Tech Strategy in
late 2006, announced its intention to invest an additional EUR 6 billion in R&D
through 2009. The Slovak Republic published an Action Plan for Science, Research and
Innovation to increase R&D funding and established a new Government Council for
Science and Technology to facilitate implementation. In the United States, the American
Competitiveness Initiative promises to strengthen investments in science, technology and
education.
Reform of universities and public research institutions remain a priority…
Central to many of these efforts to boost innovative capacity are reforms of public research
organisations. Most reforms aim to improve the responsiveness of universities and
government research institutions to social and economic needs. Some entail new
OECD SCIENCE, TECHNOLOGY AND INDUSTRY OUTLOOK 2006 – ISBN 92-64-02848-X – © OECD 2006 11

EXECUTIVE SUMMARY
institutional and legislative structures; in Japan, national universities were given a new
administrative status in April 2004 which separates them from the government and gives
them greater autonomy. In Finland, a new university law added technology transfer to the
basic mission of universities.
… but funding mechanisms and quality assurance are also increasingly important
Funding models are also evolving. Many countries, including Finland, Iceland and Ireland,
are moving to more competitive funding models for public research, but Germany and New
Zealand are strengthening institutional funding for non-university research institutes as a
way to foster long-term fundamental research and diversify research portfolios. In
addition, many countries are establishing evaluation systems to ensure the quality of
public research. Australia’s Research Quality Framework seeks to measure quality and
impact, while the Austrian Quality Assurance Agency was established to help universities
develop evaluation standards for education and research. Norway also introduced an
evaluation system that is linked to a results-oriented funding system.
Public support to business R&D is being streamlined and increasingly recognisesthe role of small firms in innovation
Support to business R&D is being streamlined and consolidated. Countries continue to
boost support for business R&D either directly (through grants or loans) or indirectly
(through tax incentives for R&D and early-stage capital funds). Austria, Finland, Germany
and the Netherlands have streamlined and consolidated their innovation support
programmes to make them simpler to use. Since 2004, new R&D tax incentives have been
introduced in Belgium, Ireland and Poland, and existing schemes in many other countries
have been extended and/or made more generous. Support to small firms has also
increased and is channelled through a broadening array of programmes. Some aim at
fostering spin-offs from public research – as in Austria’s Academy plus Business (AplusB)
programme and Germany’s EXIST programme. Others stimulate seed capital, such as
programmes that have been established in Austria, the Netherlands, Norway and New
Zealand. Guarantee schemes and voucher programmes have also been introduced in the
Netherlands to stimulate high-technology start-ups and encourage R&D in small firms.
Programmes similar to the US Small Business Innovative Research programme were
established in the Netherlands and United Kingdom to channel more government R&D
funding to small firms.
Innovation policies focus on collaborationand take on a more regional dimension
In keeping with the growing interest in better links between science and industry, a number
of countries have introduced or expanded public/private partnership programmes for
innovation. In Sweden, up to EUR 110 million (SEK 1 billion) has been set aside to implement
public/private partnerships for research and innovation in sectors related to ICT,
pharmaceuticals and biotechnology, wood and forestry, metals and automobiles. Ireland is
considering the development of competence centres and other mechanisms to foster greater
collaborative activity. Co-operation is also increasingly viewed as a way to strengthen
OECD SCIENCE, TECHNOLOGY AND INDUSTRY OUTLOOK 2006 – ISBN 92-64-02848-X – © OECD 200612
EXECUTIVE SUMMARY
regional economies and is being implemented at that level. Some of these programmes, as in
Iceland and Japan, use universities as seeds of regional clusters in less developed regions,
while others (as in the Netherlands) aim to reinforce existing leaders and improve their
global competitiveness. France uses a mixed model, providing additional funding to 15 new
and existing clusters (pôles de compétivité) in areas such as microelectronics and aeronautics.
Innovation policy addresses new challenges, notably the growing role of services and rapid globalisation
Policy makers still require a better understanding of some of the major forces that are
changing OECD economies and call for policy attention. The services sector is an area of
particular interest. Countries such as Finland and the United States have put in place
special programmes for R&D in the services sector; and many others are considering ways
to better design generic innovation programmes to suit the needs of this sector. In
addition, countries are grappling with the challenges of globalisation, both to attract
foreign investment in R&D and innovation and to foster greater international linkages,
especially within their public research sectors.
Ensuring the supply of human resources for science and technology
Demand for human resources in S&T has grown...
Issues of human resources are also taking on greater urgency on the policy agenda, as
demand for human resources in science and technology has increased in OECD countries.
Workers in professional occupations related to S&T represent between 25% and 35% of the
labour force in OECD countries, and growth in employment in these occupations continues
to outpace overall employment growth. The number of researchers – an important subset
of science and technology professionals – expanded from 2.3 million in 1990 to 3.6 million
in 2002. Smaller OECD economies such as Finland, New Zealand, Spain and Ireland have
made the largest gains in employment of researchers, whereas demand has increased
more slowly in Germany, Italy and Central and Eastern European countries. Overall
employment of researchers is greater in Japan (10.3 researchers per 1 000 labour force) and
the United States (9.3 per 1 000 labour force) than in the EU25 (5.8 per 1 000 labour force).
… while there is a relative decline in S&T graduates in some countries
The supply of S&T graduates continues to expand in absolute terms, but in the EU
between 1998 and 2004, Denmark, Italy, Germany, Hungary and Finland experienced a drop
in the share of university graduates with science and engineering degrees, as did Korea and
the United States. Further exacerbating the situation in the United States is a decline in first-
time, full-time enrolments of foreign PhD students, which fell for the second consecutive
year in 2003. Irrespective of their own recent declines, EU countries still produce a greater
share of S&T graduates than Japan or the United States, despite the smaller share of
researchers in the workforce: 27% of EU university graduates obtain a science or engineering
degree compared to 24% in Japan and just 16% in the United States. The EU also produces
more PhD graduates than the United States, which for its part offers more post-doctoral
positions (46 716 in 2003), more than half of which go to foreign PhD graduates.
OECD SCIENCE, TECHNOLOGY AND INDUSTRY OUTLOOK 2006 – ISBN 92-64-02848-X – © OECD 2006 13

EXECUTIVE SUMMARY
Most policy measures focus on boosting supplies of new S&T graduates and researchers
Countries have taken a number of actions to boost supplies of scientists and engineers by
raising interest and enrolments in S&T. Measures include the reform of school curricula to
make science more accessible and attractive to young students; improvements in the
quality of teaching in mathematics and science in the schools; and increased flexibility so
that students have a chance to enter S&T studies at later points in their education. Public/
private partnerships between industry, tertiary institutions and secondary schools are also
being developed to improve student performance, enhance the relevance of instruction
and raise enrolments. At the graduate level, countries are shortening the duration of PhD
studies while providing more supervision in order to reduce dropout rates. Improvements
in international mobility are also seen as a way of matching supply and demand, especially
for specific skills that are in short supply.
The share of women among OECD researchershas increased as policies have helped to closethe gender gap, but more remains to be done
To further boost supplies, OECD countries are giving greater attention to increasing the
participation of women in science and technology. Women account for some 30% of
science and engineering graduates in OECD countries and for 25% to 35% of researchers in
most OECD countries, except Japan and Korea where they comprise only 12%. In most
OECD countries, the share of women researchers has increased over the past decade. While
most researchers work in business, less than 18% of women researchers in the EU and 6%
in Japan work in the business sector, and they tend to be concentrated in biology, health,
agriculture, and pharmaceuticals. Just over one-third of US university faculty are women.
Policies to improve the participation of women in S&T range from the use of quantitative
targets for the share of women on scientific boards and in senior positions to mentoring
and networking initiatives as well as programmes to help women re-enter the research
workforce after taking parental leave.
Policies to develop human capital in S&T and should focus on the demand side as well
Policies to promote human resources in S&T should focus not only on increasing supplies
of graduates, but also on the demand side, especially in Europe where industry employs
fewer researchers than in the United States or Japan. Ensuring that framework conditions
foster mobility and academic entrepreneurship is a longstanding focus of policies in OECD
countries. Government incentives for business R&D also provide direct and indirect
support for job creation in research-intensive occupations. In addition, some countries are
reducing labour taxes to encourage firms to hire young PhDs. Furthermore, to enhance the
attractiveness of research careers, several countries have increased the amount of
stipends/fellowships for PhDs and post-doctoral researchers, expanded access to social
welfare benefits, limited the number of post-doctorate renewals, and improved conditions
for the recruitment, employment and mobility of early-stage researchers.
OECD SCIENCE, TECHNOLOGY AND INDUSTRY OUTLOOK 2006 – ISBN 92-64-02848-X – © OECD 200614

EXECUTIVE SUMMARY
Policies still need to adjust to the rapid globalisation of R&D
Globalisation of R&D is expanding throughmany channels…
Globalisation dominates recent discussions of innovation policy. Until recently, R&D was
one of the least internationalised of the activities of multinational enterprises (MNEs),
lagging foreign-based production and marketing by a wide margin. Fuelled by growing
competition and interest in foreign markets, and enabled by improved management
techniques and information technology, innovation networks have become more global.
Firms increasingly collaborate across national boundaries via strategic alliances and use
other channels to exploit their inventions abroad. Moreover, foreign affiliates of MNEs
account for a growing share of all R&D in the OECD area, an indication that more of MNEs’
R&D is taking place outside the home country and away from the headquarters’ R&D
laboratories. In addition, half or more of all patent applications to the US and European
patent offices are of foreign origin, and some 14% of all domestic patent applications were
owned or co-owned by a foreign resident in 2000, up from 11% in 1992.
… and has become an integral part of business R&D strategy
While globalisation of business R&D has long been associated with the customisation of
products and services for local markets and the exploitation of knowledge generated in the
home country, MNEs’ strategies appear to be changing. While the R&D intensity of foreign
affiliates remains below that of domestic firms in most countries, there is greater interest
in establishing research and development capabilities abroad. Firms increasingly set up
foreign R&D facilities to tap into local sources of knowledge and pools of local expertise
that they can exploit globally. Recent surveys suggest that location decisions are
determined more by the quality and availability of skilled human resources than by costs.
This appears to be true in developing, as well as in developed, countries.
The most dynamic elements of global innovation networks are in non-OECD countries
Indeed, while most internationalisation of R&D still takes place within the OECD area and
more specifically in its main regions, non-OECD economies have become a dynamic
element of the globalisation of R&D. China, Israel, Singapore and Chinese Taipei, for
example, have seen sizeable increases in their R&D intensity over the past few years, partly
owing to a series of policy reforms that have strengthened domestic capabilities and
expanded opportunities for foreign investment. China’s R&D intensity has more than
doubled from 0.6 to 1.3% of GDP since 1995. At 4.7% of GDP, Israel’s R&D intensity exceeds
that of all OECD countries.
Policy has yet to catch up with the globalisationof innovation
Most OECD governments recognise that the best way to benefit from global innovation
networks is to strengthen domestic innovation capabilities and develop local talent. At the
same time, countries have put in place targeted policies to respond to specific challenges
OECD SCIENCE, TECHNOLOGY AND INDUSTRY OUTLOOK 2006 – ISBN 92-64-02848-X – © OECD 2006 15

EXECUTIVE SUMMARY
posed by globalisation. Several countries use R&D tax incentives to attract and retain
foreign R&D investment, while others are helping firms to identify foreign partners or, as
in the European Commission’s Framework programmes, fostering international
collaboration in research. Still others, such as Australia, offer fellowships to encourage
greater international mobility of researchers, or, like Ireland, provide incentives to
encourage expatriate researchers to return. As yet, few countries have determined how
best to adapt national policy frameworks to a more global innovation system, but small,
open economies, such as Finland and Ireland, appear to be leading the way.
Technology licensing markets are of growing importance
Licensing markets improve the efficiencyof innovation systems…
Well-functioning technology licensing markets are an increasingly important part of an
effective innovation system. As IPR regimes have strengthened and patenting has
increased across the OECD area, licensing has become an increasingly important channel
for diffusing inventions – and the knowledge embedded in them – and facilitating follow-
on innovation. Licensing can increase the efficiency of innovation processes by putting
inventions in the hands of those best capable of commercialising them. It can also
facilitate the entry and commercial success of small firms which often lack the assets
needed to commercialise an invention themselves, but can use licensing to transfer
technology to larger firms for further exploitation, while at the same time generating a
stream of revenue. In a more open innovation system in which firms source technological
inputs from a broad range of public and private sources, licensing has become a key
mechanism for exchanging patented inventions.
… and are growing, more quickly in the United States than in Europe or Asia
Recent surveys suggest that firms in all OECD regions now license more frequently than a
decade ago, and revenues from outward licensing of inventions have climbed, especially for
large firms with large patent portfolios. Royalty receipts from outward licensing have been
estimated at 6.0%, 5.7% and 3.1% of total R&D spending for US, Japanese and European firms,
respectively, suggesting that technology licensing markets are better developed in the United
States than elsewhere. Nevertheless, international licensing accounts for a significant and
growing share of total patent licensing, with world-wide receipts topping USD 100 billion
in 2004. While much international licensing occurs between affiliated firms, a growing share
appears to link unaffiliated firms. High-technology sectors, including information
technology, chemicals (including pharmaceuticals) and machinery account for the vast
majority of all domestic and international transactions, which shows the importance of
knowledge transfers in these fields.
Regulatory, legal and information obstacles can limit the growth of licensing markets…
Expansion of licensing markets can be limited by a number of factors. Most notable is a lack
of information about licensable technologies and potential licensing partners. While a
number of private-sector intermediaries aim to fill this need, gaps remain, especially
OECD SCIENCE, TECHNOLOGY AND INDUSTRY OUTLOOK 2006 – ISBN 92-64-02848-X – © OECD 200616

EXECUTIVE SUMMARY
because expertise is limited and often sector-specific. In addition, considerable difficulties
remain for estimating the value of patented inventions owing to uncertainties about the
development and profitability of anticipated markets and of competing technological
approaches. In recent surveys, the inability to reach mutually acceptable financial terms
was the most frequently reported reason for not concluding successful licensing
agreements (reported by 26% of respondents for outward licensing, and 32% for inward
licensing). This suggests a need for improved methods of identifying and estimating the
returns from valuable patents.
… but governments can help improve their operation
The private sector plays a leading role in developing technology licensing markets, but
governments can take several steps to improve their efficiency. The basic requirement is a
patent administration that ensures patent quality and the timeliness of grants, both of
which give greater certainty to buyers and sellers of patents. Governments can also take
steps to improve the availability of information about licensable patents, especially those
held by government organisations. In Japan and Europe, governments have aimed to more
actively match buyers and sellers of technology through various forums. Financial
incentives can also play a role: licences of right, used in several European countries, offer
reduced patent maintenance fees to patent owners willing to license a patent to all
potential buyers at reasonable rates. The US tax code offers deductions for the donation of
patents to non-profit organisations. In several countries, governments have worked with
industry to develop tools for identifying valuable patents and estimating their value.
Demand for improved evaluation practices has risen
The growing importance of innovation policy has increased demand for better evaluation of policies
Broader recognition of innovation’s importance to economic prosperity and social well-
being has heightened interest in – and need for – effective evaluation of policies and
practices. Whether undertaken at the level of individual policy instruments, specific public
institutions or overall national innovation performance, evaluation is central to the
effective management and governance of publicly funded research. It can inform decision
making regarding the continuation of innovation policy instruments and the allocation of
resources across agencies, fields of science and technology and policy instruments. It can
also aid in better understanding the effectiveness of different types of policy instruments
and tuning them to specific national needs.
New evaluation tools are needed to matchthe complexity of research and innovation
Evaluation now seeks to address a more complex set of questions in an increasingly
complex innovation system. Public research organisations, for example, are increasingly
evaluated not only on the quality of their research, but also on the relevance of their results
and their ability to promote effective technology transfer. Scientific research is increasingly
multidisciplinary, making it harder to use traditional peer review to evaluate research
proposals or outcomes. Business R&D funding programmes also have an important
OECD SCIENCE, TECHNOLOGY AND INDUSTRY OUTLOOK 2006 – ISBN 92-64-02848-X – © OECD 2006 17
EXECUTIVE SUMMARY
influence not on overall levels of R&D spending, but on the behaviour of the firms that
receive funds: the types of R&D they choose to perform, the level or type of collaboration
they pursue, or their capabilities to manage R&D.
Countries are shifting their approach to institutional evaluation from one-off reviews to periodic evaluations…
Evaluation tools are evolving to keep pace with changing demand for evaluation. Countries
are increasingly shifting their approaches to institutional evaluation from one-off reviews
to periodic evaluations. In Germany, Japan, Norway and Spain, such efforts have
highlighted the importance of peer review mechanisms that involve foreign experts, the
crucial role of site visits, and strong links between evaluation and decision making. A few
countries are also beginning to evaluate funding agencies and research councils,
developing new approaches and criteria for doing so. Austria and Norway appear to be
among the leaders in this area. At the national level, system evaluations, such as those in
Finland and Japan, increasingly seek to answer particular policy questions. Countries are
also faced with growing reporting requirements, which often entail new developments in
indicators, as in the United Kingdom and United States.
… but further efforts are needed to improve evaluation practices and share them more widely
Continued international co-operation is needed to improve evaluation practices and share
them more widely. It is important to encourage wider and more in-depth exchanges
between officials in charge of evaluation to share information on methodologies for
conducting evaluations, as well as for ensuring their impact on policy making. More
systematic comparative analysis of innovative approaches to evaluation should be
conducted in international forums that can foster greater commonality and exchanges of
countries’ experiences. Another important task is to improve practices and methodologies
for reviews that more explicitly consider the relationship between innovation and
economic performance.
OECD SCIENCE, TECHNOLOGY AND INDUSTRY OUTLOOK 2006 – ISBN 92-64-02848-X – © OECD 200618

ISBN 92-64-02848-X
OECD Science, Technology and Industry Outlook 2006
© OECD 2006
Chapter 1
Science, Technology and Industry: Recent Trends at a Glance
This chapter provides an overview of recent trends in science, technology andindustry in the OECD area. It reviews major economic factors that shape theenvironment for science, technology and industry and then examines availableindicators related to the inputs, outputs and impacts of innovative activity. Wherepossible, the analysis highlights recent trends, comparing them to longer-termevolutions. It considers the financing and performance of innovative activity,scientific and technological outputs of innovation, issues of human resources, aswell as the role of globalisation in changing patterns of innovation.
19
1. SCIENCE, TECHNOLOGY AND INDUSTRY: RECENT TRENDS AT A GLANCE
Science, technology and innovation attract the attention not only of scientists, engineers
and researchers, but increasingly of policy makers and economists keen to improve
economic growth and social well-being. The significant contribution of scientific and
technical knowledge to the development of new products, processes and services has
become more widely appreciated in recent years, as has the close link between innovation
and economic performance. This recognition has heightened interest in monitoring main
trends in science, technology and innovation to measure progress along various
dimensions and to ensure that policy development tracks important changes in the
economic environment, such as the expansion of the service sectors.
This chapter provides an overview of recent trends in science, technology and industry
in the OECD area and selected non-member economies. It reviews major economic factors
that shape the environment for science, technology and industry and then examines
available indicators related to the inputs, outputs and impacts of innovative activity. Where
possible, the analysis highlights recent trends, comparing them to longer-term evolutions,
and identifies future trends or the forces the will shape them. It considers the financing and
performance of innovative activity, scientific and technological outputs of innovation, issues
of human resources, as well as the role of globalisation in changing patterns of innovation.
A benign economic environmentScience, technology and innovation are as much shaped by trends in the overall
economic environment as they are influenced by them. Recent years have seen an
improvement in the general economic environment. While rates of growth and employment
have not regained the heights of the late 1990s, they have recovered from the stagnation that
marked the beginning of this decade, and OECD economies have enjoyed four years of
economic expansion. Real economic growth averaged 2.7% across the OECD between 2003
and 2005, driven largely by growth in the United States and Japan, but with strong
contributions from eastern Europe, Greece and Turkey (Table 1.1). Unemployment also began
to decline after reaching 6.9% of the workforce in 2003, while inflation remained low, at just
2.3% annually in 2003 and 2004, enabling healthy improvements in corporate profitability.
Future prospects are bright. The OECD anticipates that growth in 2006 and 2007 will
average 3% across the OECD, ranging from 3.4% in the United States to 2.5% in Japan and
2.2% in the euro area (OECD, 2006b). Even higher rates of growth are predicted for several
eastern European economies, as well as for Australia, Greece, Ireland, Korea, Luxembourg,
Mexico and Turkey. Unemployment is also projected to decline to 6% of the labour force
in 2007, with inflation declining even further than its already low levels to just 2% a year on
average. Should this situation play out as anticipated and wage growth continue to lag
productivity growth, corporate profits should remain strong, prompting sustained growing
business investments in research, development and innovation. Declining fiscal
imbalances in government accounts could free up additional public funding for
investments in science, technology and innovation.
OECD SCIENCE, TECHNOLOGY AND INDUSTRY OUTLOOK 2006 – ISBN 92-64-02848-X – © OECD 200620

1. SCIENCE, TECHNOLOGY AND INDUSTRY: RECENT TRENDS AT A GLANCE
That said, several factors could spoil current projections. Turbulence caused by rising
energy prices, natural disasters, globalisation and growing financial imbalances could
affect growth prospects. Although they are expected to decline to 2.6% of GDP in 2007,
government budget deficits will continue to put pressure on discretionary government
spending, including funding for science and technology. In several countries, including
Japan, Switzerland and the United States, there is evidence that budget deficits have
curtailed growth or resulted in real cutbacks in government R&D funding. Continued
current account imbalances, high energy costs and exchange rate fluctuations remain
factors that can affect economic growth and business investments in R&D and innovation.
On the other hand, in countries like Spain and Finland, a healthy fiscal situation, together
with the high political priority given to S&T and innovation policies, has allowed the
government to increase government funding for R&D at real annual rates above 20%.
Investments in R&D have reboundedInvestment in research and development (R&D) is an important indicator of the efforts
that countries are putting into achieving scientific and technological progress.1 Reflecting
the improved economic environment and growth of knowledge-intensive industries, R&D
spending rebounded in the OECD region in recent years. OECD-wide investments in R&D
climbed to USD 729 billion in 2004, up from USD 641 billion in 2001 and USD 607 billion
in 2000. This represents a real increase of 2.4% annually between 2000 and 2004, but more
importantly a jump of 3.6% between 2003 and 2004, following stagnation between 2001
and 2002. As a result, R&D spending reached 2.26% of GDP in 2004, above its 2003 level of
2.25%, but below its peak of 2.27% in 2001 (Figure 1.1).
These aggregate figures mask considerable variation across the main economic
regions of the OECD and among individual OECD countries.
● In Japan, for example, real R&D expenditures increased at an annual rate of 2.1%
between 2000 and 2004, and R&D intensity increased, from 2.99% to 3.13%.
● In the United States, in contrast, real levels of spending declined between 2001 and 2002
before rising by 3.9% annually between 2002 and 2004. As a share of GDP, however,
spending increased only modestly, from 2.65% to 2.68% of GDP between 2002 and 2004,
remaining below the peak of 2.74% achieved in 2001.
Table 1.1. General economic indicators
Average 1993-2002 2003 2004 2005 20061 20071
Real GDP growth2 2.7 2.0 3.3 2.8 3.1 2.9
United States 3.2 2.7 4.2 3.5 3.6 3.1
Euro area 2.0 0.7 1.8 1.4 2.2 2.1
Japan 0.9 1.8 2.3 2.7 2.8 2.2
Unemployment rate3 6.7 6.9 6.7 6.5 6.2 6.0
Inflation4 3.6 2.3 2.3 2.0 2.2 2.0
Fiscal balance5 –2.4 –4.0 –3.5 –2.7 –2.6 –2.6
1. Prevision.2. Year on year increase.3. Per cent of labour force.4. GDP deflator. Year-on-year increase.5. Per cent of GDP.Source: OECD Economic Outlook 79 Database.
StatLink: http://dx.doi.org/10.1787/176367634834
OECD SCIENCE, TECHNOLOGY AND INDUSTRY OUTLOOK 2006 – ISBN 92-64-02848-X – © OECD 2006 21

1. SCIENCE, TECHNOLOGY AND INDUSTRY: RECENT TRENDS AT A GLANCE
● In the EU25, R&D spending increased slowly but surely between 2000 and 2003, at a rate
of just 2.3% per year. In GDP terms, EU25 R&D expenditures rose from 1.77% to 1.81% of
GDP, still far short of the European Union’s ambition of reaching 3% of GDP by 2010 and
still far short of those of the United States or Japan. This persistent gap appears to reflect
not underinvestment by individual European firms compared to their American and
Japanese competitors, but structural factors, including a much smaller sector for
information and communications equipment and services and a lower proportion of
R&D-intensive small firms (IPTS, 2006).
Recent fluctuations in national R&D spending take place against a background of longer-
term growth in R&D. Between 1995 and 2004, real expenditures on R&D increased by more
than one-third across the OECD, reflecting average annual increases of 3.8%. Growth was more
intensive during the second half of the 1990s: total gross expenditure on R&D grew by 4.9%
annually (in real terms) between 1995 and 2000, compared to the 2.4% annual growth rate
between 2000 and 2004. Nevertheless, OECD-wide R&D-intensity rose from 2.07% to 2.26% of
GDP between 1995 and 2004. In the major OECD regions, percentage-point gains were largest in
Japan, which jumped from 2.9% to 3.13%, followed by the United States, which increased from
2.51% to 2.68% between 1995 and 2004, and then the EU25, which saw a more modest increase
from 1.69% to 1.81% between 1995 and 2003. Among the full set of OECD member countries,
the largest gains were in Iceland, Finland, Denmark, Austria and Sweden, each of which added
between 0.6 and 1.4 percentage points to their total R&D intensity (Figure 1.2).
More varied patterns emerge at the national level. In general, countries with the highest
levels of R&D intensity tended to see larger increases between 1995 and 2004. Countries with
average levels of R&D intensity tended to see modest gains at best, with many mid-sized and
larger European countries (e.g. France, the Netherlands and the United Kingdom)
Figure 1.1. R&D trends in major OECD regions, 1991-2004
1. Gross domestic expenditure on R&D as a percentage of GDP.2. Data are adjusted up to 1995.3. Data are EU15 to 1994 and EU25 from 1995.4. USD of 2000 in purchasing power parities (PPP).
Source: OECD, Main Science and Technology Indicators Database, June 2006.StatLink: http://dx.doi.org/10.1787/505288083604
1.5
1.7
1.9
2.1
2.3
2.5
2.7
2.9
3.1
3.3
1991
1992
1993
1994
1995
1996
1997
1998
1999
2000
2001
2002
2003
2004
%
1991
1992
1993
1994
1995
1996
1997
1998
1999
2000
2001
2002
2003
2004
Japan2
OECD
United States
EU15 EU25
Japan2 United States
OECD EU3
0
100
200
300
400
500
600
700
Trends in R&D intensity1 by area, 1991-2004As a percentage of GDP
Gross domestic expenditure on R&D by area, 1991-2004Billions of USD PPP (2000)4
OECD SCIENCE, TECHNOLOGY AND INDUSTRY OUTLOOK 2006 – ISBN 92-64-02848-X – © OECD 200622

1. SCIENCE, TECHNOLOGY AND INDUSTRY: RECENT TRENDS AT A GLANCE
experiencing modest declines. Countries at the low end of the scale tended to see more
sizeable gains (Turkey’s R&D increased by more than 10% annually between 1995 and 2002),
but those with the lowest levels of investment – Poland and the Slovak Republic – saw
declines in their R&D intensity as they continued to restructure their economies. As a result,
the dispersion between most and least R&D-intensive countries continued to widen.
Public funding drove growth in the United States and EuropeRecent increases in R&D spending owe much to government funding, although
considerable variation exists across regions. Government appropriations or outlays for R&D
(GBAORD) climbed 7.4% a year in the OECD area between 2001 and 2004, from USD 214 billion
to USD 265 billion (in current USD). Luxembourg saw the fastest growth in government R&D
funding, at more than 20% annually between 2000 and 2005. Ireland, Spain and Korea also
saw increases of more than 10% annually during this period. As a share of GDP, government
appropriations increased marginally between 2000 and 2004 in France, from 0.96% to 1.0% of
GDP and declined slightly in Germany, from 0.79% to 0.76% of GDP. They increased from
0.86% to 1.1% in the United States between 2000 and 2004 and from 0.64% to 0.72% in Japan
between 2000 and 2003. Such increases reflect the growing recognition that R&D is an
important driver of economic growth and that governments have an important role to play
in funding this public good. Many countries anticipate further increases in appropriations for
R&D, although overall budgetary pressures may constrain growth in some countries.
For the most part, recent increases in government budgets have resulted in actual
expenditures growing faster than GDP. At the OECD level, government funding increased
from 0.63% of GDP in 2000 to 0.68% of GDP in 2004, reversing a pattern of decline seen in the
late 1990s, when government funding fell from 0.70% to 0.63% of GDP between 1995
and 2000 (Figure 1.3). Growth was strongest in Iceland (1.00% to 1.17%), the highest in the
Figure 1.2. R&D intensity in OECD countries, 1995, 2000 and 2004Gross expenditure on R&D as a % of GDP
1. 1996 instead of 1995 for Japan and Switzerland.2. 1999 instead of 2000 for Denmark, Greece, New Zealand, Norway and Sweden.3. 2002 for Australia and Turkey, 2003 for Greece, Iceland, Italy, Mexico, New Zealand, Portugal, Sweden,
United Kingdom, EU-15 and EU-25.
Source: OECD Main Science and Technology Indicators Database, June 2006.StatLink: http://dx.doi.org/10.1787/118284326103
0
0.5
1.0
1.5
2.0
2.5
3.0
3.5
4.0
4.5% 19951 20002 20043
Sweden
Finlan
dJa
pan
Switzerl
and
Icelan
dKore
a
United
States
German
y
Denmark
Total
OECDAus
triaFra
nce
Canad
a
Belgium EU
15
United
Kingdo
mEU
25
Netherl
ands
Luxe
mbourg
Austra
lia
Norway
Czech R
epub
lic
Irelan
d
New Ze
aland Ita
lySpa
in
Hunga
ry
Portug
al
Turke
y
Greece
Poland
Slovak
Repub
lic
Mexico
OECD SCIENCE, TECHNOLOGY AND INDUSTRY OUTLOOK 2006 – ISBN 92-64-02848-X – © OECD 2006 23

1. SCIENCE, TECHNOLOGY AND INDUSTRY: RECENT TRENDS AT A GLANCE
OECD area and the only country in which government-financed R&D exceeded 1% of GDP,
Ireland (0.26% to 0.39%) and the United States, where government financing increased
from 0.71% to 0.83% of GDP between 2000 and 2004. But gains were also posted in the EU25
(0.62% to 0.63% of GDP). In Japan however, government funding declined slightly, from
0.59% to 0.57%.
In addition, governments are financing more business R&D indirectly through the use
of tax incentives. As of 2006, with the addition of Poland, 20 OECD countries offered
specific tax incentives for business R&D expenditures, up from just twelve in 1996, and
incentives have become more generous over time: they are more frequently based on the
total volume of R&D expenditure (rather than on incremental increases in expenditure),
and the rates of tax reduction have increased in many countries. The total value (or cost to
governments) of R&D tax incentives fluctuates with changes in business R&D spending,
but has generally increased over the past decade. In the United States, the total value of
claimed credits rose from USD 1.5 billion in 1995 to USD 7 billion in 2000, before dropping
to USD 6.2 billion in 2001 (in constant dollars). In Canada, they increased from about
USD 0.7 billion in 1995 to almost USD 1.5 billion in 2004.2 In Japan, incentives are estimated
to have nearly tripled from USD 160 million to USD 450 million between 1995 and 2003,
despite the levelling off towards the end of the 1990s. In France, where business R&D
spending increased more slowly, the real value of R&D tax incentives increased from
USD 490 million in 1995 to USD 578 million in 2000, before declining to USD 520 million
in 2002. In smaller economies with generous tax incentive programmes, such as Australia,
Austria, Canada and the Netherlands, tax incentives make up a considerable fraction of all
government support to business R&D, often exceeding direct government funding
(Figure 1.4).
Figure 1.3. Government-financed R&DAs a % of GDP
1. 1996 instead of 1995 for Australia and Switzerland; 2000 for Luxembourg.2. 1999 instead of 2000 for Iceland, Denmark, Italy, Greece New Zealand, Norway and Sweden,3. 2002 for Australia and Turkey, 2003 for Greece, Iceland, Italy, Mexico, New Zealand, Portugal, Sweden, United
Kingdom, EU15 and EU25.
Source: OECD, Main Science and Technology Indicators Database, June 2006.StatLink: http://dx.doi.org/10.1787/318206446018
0
0.25
0.50
0.75
1.00
1.25% 19951 20002 20043
Icelan
d
Sweden
Finlan
dFra
nce
United
States
Austria
German
y
Norway
Austra
lia
Denmark
Total
OECD
Canad
a
Switzerl
andKore
aEU
15
Netherl
ands
EU25
United
Kingdo
mJa
pan
Czech R
epub
lic
New Ze
aland
Portug
al
Hunga
ry
Belgium Spa
in
Irelan
d
Poland
Turke
y
Slovak
Repub
lic
Greece
Mexico
Luxe
mbourg
OECD SCIENCE, TECHNOLOGY AND INDUSTRY OUTLOOK 2006 – ISBN 92-64-02848-X – © OECD 200624

1. SCIENCE, TECHNOLOGY AND INDUSTRY: RECENT TRENDS AT A GLANCE
As it has increased, the nature of public investment in R&D has changed. After a
decline in the early 1990s, the US government defence R&D budget has increased as a
share of GDP and reached around 0.60% in 2005. This is more than 2.5 times the ratio for
the United Kingdom and France, which have the second and third highest ratios in 2004
(about 0.23% of GDP). Three-quarters of the growth in the United States government budget
for R&D between 2001 and 2005 can be attributed to defence R&D. While much of the
remaining growth was attributable to the National Institutes of Health (NIH), future
budgets show slower growth for NIH compared to other US government agencies.
Private-sector funding surged in Asia
Industry continues to finance the majority of R&D in OECD countries, but its share of
total funding has fallen in recent years. After rising from 58% to more than 64%
between 1990 and 2000, the share of total R&D financed by industry declined to 62%
in 2004. This trend was particularly acute in the United States, where industry-financed
R&D fell from 70% to less than 64% of total R&D between 2000 and 2004. Among the EU25,
the share of industry financing dropped modestly from 55.5% to 53.7% during the
period 2000-03. This trend did not hold in the Asia-Pacific region: Australia, Japan and
Korea all saw increases in the share of industry-financed R&D between 2000 and 2004,
despite levels of industry financing of more than 70% in the latter two countries.
With the exception again of Japan and Korea, as well as Switzerland and Austria,
industry R&D financing has also fallen as a share of GDP across much of the OECD region.
Between 2000 and 2004, industry-financed R&D declined from 1.43% to 1.40% of GDP, but
remains above its level in 1995 of 1.23% of GDP. Among the steepest declines were those in
Sweden (3.0% to 2.6% of GDP) and the United States (1.91% to 1.70% of GDP); levels
remained relatively flat in the EU25. Industry-financed R&D increased in Japan, from 2.17%
to 2.34% of GDP, and in Korea, from 1.73% to 2.14% of GDP.
Recent surveys suggest that US firms will increase their R&D spending modestly
in 2005 and 2006 by about 3% to 4% per year, but such increases are under pressure as firms
Figure 1.4. Direct government funding of business R&D and tax incentives for R&DAs a % of GDP
Source: OECD, based on national estimates, some of which may be preliminary.StatLink: http://dx.doi.org/10.1787/108314226461
0
0.05
0.10
0.15
0.20
0.25
United States(2001)
France(2002)
United Kingdom(2004)
Norway(2004)
Austria(2002)
Australia(2004)
Netherlands(2005)
Canada(2004)
Japan(2003)
Direct government funding of BERD Costs of fiscal incentives
OECD SCIENCE, TECHNOLOGY AND INDUSTRY OUTLOOK 2006 – ISBN 92-64-02848-X – © OECD 2006 25

1. SCIENCE, TECHNOLOGY AND INDUSTRY: RECENT TRENDS AT A GLANCE
continue to invest in foreign-based R&D facilities (Battelle, 2006). Surveys in Europe also
indicate a resurgence in business R&D funding, with estimates as high as 5% a year.
Whether or not such gains are achieved will depend on many factors, including the general
economic environment and the relative growth of emerging markets.
While most industry financing supports R&D conducted in the business sector,
industry also funds a share of the R&D performed in the public sector (higher education
and government). This share averaged 6.1% in 2004 in the OECD area and 6.5% in the EU25
(Figure 1.5). Between 1995 and 2004, the share of public R&D financed by industry
increased in most OECD countries: Japan saw a rise from 2% to 3%, and large gains were
posted in Germany, Hungary, Iceland, the Netherlands and Turkey. Nevertheless, aggregate
statistics indicate a decline in the overall share of public R&D financed by industry, owing
to cutbacks in several large countries, including the United States, the United Kingdom,
France and Spain, as well as in Ireland and New Zealand. In the United States, recent
surveys indicate that industry-science links may weaken temporarily in terms of direct
contract research, while longer-term institutional support will continue (Battelle, 2006).
Venture capital funding is stabilising
After the boom and bust cycle at the turn of the century, funding for venture capital
appears to have stabilised. In the United States, venture capital funding reached
USD 22.4 billion in 2005, up moderately from USD 19.6 billion in 2003 and USD 21.8 billion
in 2004.3 Investment levels are far below the peak of USD 104 billion attained in 2000, but
remain high above their 1995 level of USD 7.9 billion. European venture capital also seems
to have emerged from its decline in the early part of the decade. Total venture capital
Figure 1.5. Share of higher education R&D financed by industry,1995, 2000 and 2004
As a % of total higher education R&D
1. 1993 for Austria and 1996 for Switzerland.2. 1999 instead of 2000 for Iceland, Greece, Sweden, Norway, New Zealand; 1998 for Austria.3. 2002 for Australia, Austria and Turkey; 2003 for Belgium, France, Iceland, Mexico, Netherlands, New Zealand,
Norway, Portugal, Sweden, United Kingdom, OECD total, EU15 and EU25.
Source: OECD, Main Science and Technology Indicators, June 2006.StatLink: http://dx.doi.org/10.1787/414001223040
0
5
10
15
20
25% 19951 20002 20043
Turke
yKore
a
Hunga
ry
German
y
Belgium
Icelan
d
Switzerl
and
Canad
a
Greece
Spain
Netherl
ands
EU15
EU25
Total
OECD
Finlan
d
Poland
United
Kingdo
m
Sweden
Austra
lia
United
States
Norway
Austria
New Ze
aland
Denmark
Japa
nFra
nce
Irelan
d
Mexico
Portug
al
Czech R
epub
lic
Slovak
Repub
lic
OECD SCIENCE, TECHNOLOGY AND INDUSTRY OUTLOOK 2006 – ISBN 92-64-02848-X – © OECD 200626

1. SCIENCE, TECHNOLOGY AND INDUSTRY: RECENT TRENDS AT A GLANCE
investments (seed, start-up and expansion stages) climbed to EUR 11.4 billion in 2005.
Although still shy of the EUR 12.1 billion invested in 2001, the 2005 figure is significantly
above the EUR 8.4 billion invested in 2003.
Although stabilising, the nature of venture capital investment has changed. Of total
US investments in 2005, only 57% (or USD 12.7 billion) were allocated to seed, early-stage and
expansion funding, compared to 85% before the bubble. Seed funding stood at just
USD 784 million in 2005, compared to USD 1.3 billion in 1995, even though it has climbed
from even lower levels in 2003 and 2004 as new opportunities have emerged and investor
confidence has improved. In Europe, too, seed funding remains considerably below earlier
levels, at just EUR 89 million in 2005 versus EUR 531 million in 2001, while expansion funding
has grown (EUR 9.2 billion in 2005 versus EUR 8 billion in 2001). Funding is also more
concentrated in a smaller number of investments: approximately 6 600 seed, start-up and
expansion investments were made in 2005, compared to 9 300 in 2001. These changes may
reflect lingering concerns about financial returns to venture investments, but cyclical factors
may also be at work. Venture capital often follows a six-year cycle as investors follow firms
from start-up phases to expansion. Should economic prospects remain strong, a greater
share of future investments could return to earlier stages of company development.
New patterns of R&D performanceChanges in patterns of R&D financing have been mirrored by a series of changes in the
performance of R&D and the locus of innovative activity. As with financing, R&D
performance has seen a small but notable transition from private- to public-sector actors, in
particular universities. The private sector continues to play the major role in R&D
performance, but growth has been faster among higher education institutions. As a result,
the share of total R&D performed by business declined slightly from 70% in 2000 to 68%
in 2004, while the share performed by the higher education sector increased from 16% to
17%. At the same time, private-sector innovation has been characterised by increased
globalisation of R&D, including R&D performed outside OECD countries (even if by firms
headquartered in OECD countries), and by an increase in the role of the services sector. These
trends are not necessarily new, having their roots in decades past, but they have either
accelerated in recent years or reached a point of critical mass that makes them more difficult
to ignore. They are likely to shape future patterns of global innovation performance.
Resurgence of public-sector research
Public-sector research organisations (PROs) play an increasing role in R&D and
innovation. Higher education institutions (primarily universities) and government
research institutions are seen as the primary organisations for creating scientific and
technological knowledge to address a range of social and economic challenges. As a result,
public- and private-sector organisations fund R&D performed in PROs. Between 2000
and 2004, R&D performed in PROs climbed from 0.62% to 0.67% of GDP (Figure 1.6). Again,
this trend was dominated by changes in the United States, where R&D performed in the
public sector surged from 0.59% to 0.69% of GDP, with both universities and government
research institutions seeing significant increases in funding linked primarily to defence
and health needs. Funding in the EU25 remained relatively flat at around 0.64% of GDP
(between 2000 and 2003), as it did in Japan (between 2000 and 2004). But levels of publicly
performed R&D in Japan have exceeded those of the United States or the EU by a wide
margin for many years, having exceeded 0.70% of GDP as early as 1998.
OECD SCIENCE, TECHNOLOGY AND INDUSTRY OUTLOOK 2006 – ISBN 92-64-02848-X – © OECD 2006 27

1. SCIENCE, TECHNOLOGY AND INDUSTRY: RECENT TRENDS AT A GLANCE
There is greater consistency across OECD regions in the relative rise of higher
education R&D. Across the OECD, higher education R&D rose from 0.36% to 0.39% of GDP
between 2000 and 2004. The United States saw a rapid rise in higher education R&D
after 2000, with funding rising from 0.31% of GDP in 2000 to 0.36% by 2004. Over the longer
term, higher education has become the predominant public-sector performer of R&D in the
United States, surpassing the level of R&D performed by government laboratories in 1998.
Even so, R&D performed in the US higher education sector remains below the level of the
EU25, which has risen steadily from 0.35% of GDP in 1996 to 0.40% in 2003. It is also beneath
the levels of R&D performed in the Japanese higher education sector, which have
fluctuated between 0.42% and 0.44% of GDP since 1998.
Similar patterns can be seen at the national level. The largest increases in R&D
spending by higher education institutions occurred in Canada, Denmark and Iceland
(Figure 1.7). Only in the Netherlands did R&D in higher education institutions decline every
year as a percentage of GDP. The difference among OECD countries remains large. Sweden
has the highest ratio of higher education R&D to GDP in the OECD area, at almost 0.90%
in 2003, followed by Canada, Finland, Switzerland (all 2004), Iceland (2003) and Denmark
(2004). Most large OECD countries, including the United States, Japan, Germany, France,
Italy and the United Kingdom, devote between 0.35% and 0.45% of GDP to R&D in higher
education institutions. Luxembourg had the lowest ratio in 2003, the year it established its
university, and in 2004. Other OECD countries with low R&D spending by higher education
institutions are the Slovak Republic, Mexico and Poland.
Significant differences remain in the fields of study towards which higher education
R&D is directed. In the Slovak Republic and the Czech Republic, for example, over 85% of all
research and development is carried out in natural sciences, engineering, medical sciences
and agricultural sciences, with social sciences and humanities accounting for only a small
share (Figure 1.8). In Hungary, Norway and Spain, however, around 35% of all higher
education R&D is carried out in social sciences and humanities. These differences may be
linked to the specialisation of science systems in different countries.
Figure 1.6. R&D performed in higher education and government institutions, 1996-2004As a % of GDP
Source: OECD Main Science and Technology Indicators Database, June 2006.StatLink: http://dx.doi.org/10.1787/733245187710
0.22
0.24
0.26
0.28
0.30
0.32
0.34
0.36
0.38
0.40
0.42
0.44
0.46
1996 1997 1998 1999 2000 2001 2002 2003 2004
%
Highereducation
Government
Japan United States OECD EU25
OECD SCIENCE, TECHNOLOGY AND INDUSTRY OUTLOOK 2006 – ISBN 92-64-02848-X – © OECD 200628

1. SCIENCE, TECHNOLOGY AND INDUSTRY: RECENT TRENDS AT A GLANCE
Figure 1.7. Higher education research and developmentAs a % of GDP
1. 1996 instead of 1995 for Switzerland, 1993 for Austria.2. 1998 instead of 2000 for Austria; 1999 for Greece, Norway, New Zealand and Sweden.3. 2002 for Australia, Austria and Turkey; 2003 for Greece, Iceland, Italy, Mexico, New Zealand, Portugal, Sweden,
United Kingdom, EU15 and EU25.
Source: OECD, Main Science and Technology Indicators, June 2006.StatLink: http://dx.doi.org/10.1787/482158415867
Figure 1.8. Higher education research and development expenditure by fieldof study, 20031
As a % of total higher education R&D expenditure
1. In Korea, R&D in social sciences and the humanities is excluded, as is R&D in the humanities in the United States.
Source: OECD, R&D Statistics (RDS), November 2005.StatLink: http://dx.doi.org/10.1787/845842022658
0
0.2
0.4
0.6
0.8
1.0% 19951 20002 20043
Sweden
Canad
a
Finlan
d
Switzerl
and
Icelan
d
Denmark
Austria
Netherl
ands
Norway
Austra
lia
Belgium
Turke
yJa
pan
EU15
Franc
e
German
y
United
Kingdo
mEU
25
Total
OECD
Italy
United
States
Irelan
d
New Ze
aland
Spain
Greece
Portug
alKore
a
Hunga
ry
Czech R
epub
lic
Poland
Mexico
Slovak
Repub
lic
Luxe
mbourg
0
20
40
60
80
100
Natural sciences
Agricultural sciences
Engineering services and other technical services
Social sciences
Medical sciences
Humanities
Korea (
1998
)
United
States
(200
1)
Slovak
Repub
lic
Czech R
epub
lic
Turke
y (19
96)
Poland
Sweden
German
y (20
02)
Canad
a (20
02)
Belgium
(200
1)
Austria
(200
2)
Netherl
ands
(200
2)
Austra
lia (2
002)
Finlan
d
Irelan
d (20
02)
Denmark
Icelan
d
Mexico
(200
1)
Portug
al (20
01)
Japa
n
Norway
Hunga
rySpa
in
Switzerl
and (
2002
)
Luxe
mbourg
(200
1)
OECD SCIENCE, TECHNOLOGY AND INDUSTRY OUTLOOK 2006 – ISBN 92-64-02848-X – © OECD 2006 29

1. SCIENCE, TECHNOLOGY AND INDUSTRY: RECENT TRENDS AT A GLANCE
The changing nature of business R&D
Business enterprises account for the bulk of R&D performed in OECD countries. Much
business-performed R&D is financed by industry itself. Hence, as industry investments in
R&D slowed in recent years, business performed R&D stagnated also, owing to slow growth
in the United States and Europe. Total R&D performed in the business sector reached
USD 453 billion in 2004, but growth has been weak at 1.8% a year since 2000. The United
States has been putting the brake on overall BERD spending, as BERD grew there by 0.1% a
year in real terms between 2000 and 2004. In the EU25, BERD expenditure rose by 2% a year
between 2000 and 2004, about half the rate of growth of the late 1990s. In Japan, in contrast,
after 2000 real BERD spending increased at a rate of 3.6% a year, almost twice the rate of
growth in the late 1990s. BERD measured in GDP terms followed much this same pattern. It
dropped from 2.1% to 1.9% of GDP in the United States between 2000 and 2004, it remained
at 1.1% of GDP in the EU25 and surged from 2.1% to 2.4% of GDP in Japan (Figure 1.9).
The recent setbacks in business R&D have erased some of the gains made over the
past decade, but future growth in BERD seems feasible. A number of OECD countries have
seen substantial gains in BERD intensity over the past decade. Finland, Iceland, Denmark,
Austria, Sweden and Japan have each seen gains of 0.5 to 1.0 percentage points
between 1995 and 2004 (Figure 1.10). That said, most countries have seen much more
modest increases in business R&D. Prospects for future increases will depend on the
evolution of the economic environment, specific government incentives for investment in
R&D (such as tax incentives), and the ability of economies to expand their high-technology
industries.
As important as changes in the overall level of business R&D are changes in the types of
firms performing that R&D and engaged in business innovation. Increasingly, innovation is
shifting to the services sector. While manufacturing continues to account for the lion’s share
of R&D, services-sector investments in R&D are rising more quickly. Between 1990 and 2003,
Figure 1.9. Business R&D spending in major OECD regions, 1991-20041
1. Data are adjusted for Japan up to 1995.
Source: OECD Main Science and Technology Indicators Database, June 2006.StatLink: http://dx.doi.org/10.1787/352551751058
1991
1992
1993
1994
1995
1996
1997
1998
1999
2000
2001
2002
2003
2004
1991
1992
1993
1994
1995
1996
1997
1998
1999
2000
2001
2002
2003
2004
1.0
1.2
1.4
1.6
1.8
2.0
2.2
2.4%
50 000
100 000
150 000
200 000
250 000
300 000
350 000
400 000
450 000
500 000
Japan United States OECD EU15 EU25
% of GDP Millions of USD (PPP)
OECD SCIENCE, TECHNOLOGY AND INDUSTRY OUTLOOK 2006 – ISBN 92-64-02848-X – © OECD 200630

1. SCIENCE, TECHNOLOGY AND INDUSTRY: RECENT TRENDS AT A GLANCE
services-sector R&D increased at an average annual rate of 12% across OECD member
countries, compared to approximately 3% in manufacturing (Figure 1.11). As a result,
services accounted for more than one-quarter of total business sector R&D in the OECD area
in 2002, an increase of 8 percentage points from 1993. In several countries, more than one-
third of total business R&D is carried out in the services sector: Australia (42%), Denmark
(40%), United States (39%), Canada (36%), the Czech Republic (35%) and Norway (33%).
While some of the rapid growth in services-sector R&D can be explained by better
measurement of R&D in the sector and reclassification of some manufacturing into services
(i.e. as their service activities have expanded), it also reflects real increases in R&D by
services-sector firms, driven by competitive demands or by increased outsourcing of R&D by
manufacturing firms and government. Recent innovation surveys reveal that the share of
innovative firms in the financial services and business service sectors exceeds that in
manufacturing. Not surprisingly, business services and post and telecommunications
account for more than three-quarters of services sector R&D in most countries. Financial
service firms do not invest much in R&D, but report worker training and the acquisition and
deployment of new equipment.
The manufacturing sector remains an important locus of innovation and continues to
account for the largest part of R&D spending in most OECD countries. Within manufacturing,
the high- and medium-high-technology sectors continue to grow in terms of their
contribution to value added and total R&D performance relative to medium-low- and low-
technology industries.4 In the OECD area, high-technology industries (including aerospace,
pharmaceuticals, computer equipment, radio, TV and communication equipment, as well as
instruments) account for more than 53% of total manufacturing R&D, but regional
differences remain (Figure 1.12). In 2002, R&D in high-technology industries accounted for
over 60% of total manufacturing R&D in the United States compared to 48% and 46% in the
Figure 1.10. BERD intensity by country, 1995, 2000 and 2004As a % of GDP
1. 1993 for Austria, 1996 for Switzerland.2. 1998 instead of 2000 for Austria; 1999 for Denmark, Norway, New Zealand and Sweden.3. 2002 for Austria and Turkey; 2003 for Australia, Greece, Iceland, Mexico, New Zealand, Portugal and Sweden.
Source: OECD Main Science and Technology Indicators Database, June 2006.StatLink: http://dx.doi.org/10.1787/130812203177
0
0.5
1.0
1.5
2.0
2.5
3.0% 19951 20002 20043
Sweden
Finlan
dJa
panKore
a
Switzerl
and
United
States
German
y
Denmark
Luxe
mbourg
Total
OECD
Icelan
d
Austria
Franc
e
Belgium EU
15
United
Kingdo
mEU
25
Canad
a
Netherl
ands
Norway
Austra
lia
Czech R
epub
lic
Irelan
dSpa
inIta
ly
New Ze
aland
Hunga
ry
Portug
al
Slovak
Repub
lic
Greece
Turke
y
Poland
Mexico
OECD SCIENCE, TECHNOLOGY AND INDUSTRY OUTLOOK 2006 – ISBN 92-64-02848-X – © OECD 2006 31

1. SCIENCE, TECHNOLOGY AND INDUSTRY: RECENT TRENDS AT A GLANCE
European Union and Japan, respectively. Manufacturing R&D expenditure is primarily
oriented towards high-technology industries in Ireland, Canada and Finland. Medium-high-
technology industries, such as machinery and chemicals, account for 50% of R&D or more in
the Czech Republic and Germany. Norway is the only OECD country in which medium-low
and low-technology industries account for more than 40% of manufacturing R&D.
Figure 1.11. Business R&D expenditures in services and manufacturing, 1990-2003Average annual growth rates (%)
Source: OECD ANBERD Database, 2005.StatLink: http://dx.doi.org/10.1787/120741562864
Figure 1.12. Share of business R&D in the manufacturing sectorby technological intensity, 2003
Source: OECD STAN Database 2005.StatLink: http://dx.doi.org/10.1787/850680277076
-5
0
5
10
15
20
25
30
35% Services Manufacturing
Japa
n
Irelan
d
Finlan
d
German
y (19
91-20
03)
Belgium
(199
2-200
3)
Norway
Denmark
Spain
Netherl
ands
Italy
(1991
-2003
)
Canad
aFra
nce
Korea (
1995
-2003
)
United
States
Sweden
Austra
lia
Poland
(199
4-200
3)
United
Kingdo
m
Czech R
epub
lic (1
992-2
003)
0
20
40
60
80
100
High-technology Medium-high technology Medium-low and low-technology
Irelan
d (20
01)
Canad
a
Finlan
d
United
States
(200
2)
United
Kingdo
m (200
2)
Denmark
(200
2)Kore
a
Sweden
OECD (2
001)
Franc
e (20
02)
Belgium
(200
2)
Netherl
ands
(200
2) Italy
EU (2
001)
Japa
n (20
02)
Spain
(2002
)
Poland
(200
2)
German
y
Norway
Austra
lia (2
002)
Czech R
epub
lic
OECD SCIENCE, TECHNOLOGY AND INDUSTRY OUTLOOK 2006 – ISBN 92-64-02848-X – © OECD 200632

1. SCIENCE, TECHNOLOGY AND INDUSTRY: RECENT TRENDS AT A GLANCE
Human resourcesThe continued progression towards the knowledge-based economy and the expansion
of knowledge-based industries has raised demand for professional workers of all kinds,
including scientists and engineers. Across the OECD, rates of growth of employment in
professional occupations has outpaced employment growth overall, often by a wide
margin. In the EU15, for example, professional employment expanded at an average
annual rate of 2.7% between 1995 and 2004, whereas overall employment increased by only
1.1% (Figure 1.13). In Hungary, Ireland and Spain, professional employment expanded by
6% to 7% per year, while total employment increased by 1% in Hungary, 4.2% in Ireland and
2.5% in Spain. In the United States, professional employment grew at 2% per year, twice as
fast as overall employment.
Such growth demands highly educated workers with a variety of skills and can strain
domestic education systems. Researchers are a particularly important set of professionals
because they serve as a central element of R&D systems and require specialised training,
often extending over many years (tertiary level and beyond).5 In 2002, approximately
3.6 million researchers were engaged in R&D in the OECD area, up from 2.3 million in 1990.
This corresponds to about 8.3 researchers per 1 000 employees, a significant increase from
the 1995 level of seven researchers per 1 000 employees. Out of these 3.6 million researchers,
most were engaged in the business sector and just over 25% were engaged in the higher
education sector. Countries with strong high-technology sectors, such as Finland, Japan and
Sweden, have among the highest densities of researchers, with Finland’s reaching 17.3 per
1 000 employment in 2004, up from 8.2 per 1000 in 1995. Researchers per thousand in the
Figure 1.13. Employment in professional, scientific and technical occupationsAverage annual growth rate, 1995-20041
1. 1996 instead of 1995 for Hungary, Norway, Australia, New Zealand, Switzerland; 1997 for Sweden, Finland, Polandand the Czech Republic; 1998 for the Slovak Republic and total EU19. 2003 instead of 2004 for the Netherlands;2002 for Korea, Canada, the United States.
Source: OECD calculations based on data from the EU labour force survey, June 2005; from the US Current PopulationSurvey, 2003; from the Canadian labour force surveys, 2003, the Korean Economically Active Population Survey,2003 and the Australia and New Zealand censuses, 2003.
StatLink: http://dx.doi.org/10.1787/176145408706
-3.0
-1.5
0
1.5
3.0
4.5
6.0
7.5
9.0%
Czech R
epub
lic
Portug
al
Slovak
Repub
lic
Poland
Switzerl
and
German
yEU
191
Finlan
d
United
States
United
Kingdo
m
Belgium
Franc
e
Sweden
EU15
Denmark
Canad
a
New Ze
aland
Austra
liaKore
a
Icelan
dIta
ly
Austria
Netherl
ands
Greece
Norway
Luxe
mbourg
Hunga
ry
Irelan
dSpa
in
HRST occupations Total employmentFemale HRST occupations
OECD SCIENCE, TECHNOLOGY AND INDUSTRY OUTLOOK 2006 – ISBN 92-64-02848-X – © OECD 2006 33

1. SCIENCE, TECHNOLOGY AND INDUSTRY: RECENT TRENDS AT A GLANCE
Czech Republic, Hungary, Poland and the Slovak Republic remain below the OECD average
and range between 3.4 and 5.2 researchers per 1 000, despite modest growth.
Business enterprise researchers continue to account for the bulk of the researcher
population. In 2002, some 64% of all researchers in OECD countries (or 2.2 million of the total
3.4 million) worked in the business sector, a figure that remained fairly constant over the
previous decade. Nevertheless, there are clear regional differences. Business researchers
represented around 80% of US researchers in 2002; in Japan and Korea, business researchers
accounted for 67% and 74% of the researcher population, respectively, in 2004. These figures
are far above those of the EU25, where business researchers comprised only 49% of the
research population in 2003, a figure that has increased modestly in recent years as BERD
spending has increased. Nevertheless, the low relative levels of business researchers has
remained an issue in the EU, especially as the region attempts to meet its objective of
boosting R&D spending to 3% of GDP by 2010 – a task that by some estimates would require
an additional 700 000 researchers, mostly in the business sector.
Trends in the population of business researchers follow patterns of R&D spending.
Between 1995 and 2004, the number of business researchers per thousand employees
increased from 5 to 6.3 (Figure 1.14). The largest gains were in Finland, which saw a jump
from 4.8 to 15.1 business researchers per 1 000 employees. In Japan and the United States,
the numbers increased from about 9.0 to 11.5. Business researchers per thousand are well
below average in the EU and remain at 1.5 per 1 000 or below in most eastern European
economies. Declining business R&D expenditures constrained growth in the number of
business researchers in several countries in recent years, but most OECD countries report
growing numbers of business researchers, commensurate with increases in business R&D
spending. In Spain, for example, the number of business researchers jumped from
Figure 1.14. Business researchers per thousand employment in industry
1. 1993 instead of 1995 for Austria; 1996 for Switzerland.2. 1999 instead of 2000 for Sweden, Denmark, Norway, New Zealand and Mexico; 1998 for Austria.3. 2002 for Austria, Canada, Turkey, United States and OECD total; 2003 for Australia, France, Germany, Greece, Italy,
Mexico, New Zealand, Norway, Sweden, EU25 and EU15.
Source: OECD MSTI Database, June 2006.StatLink: http://dx.doi.org/10.1787/501767515205
0
2
4
6
8
10
12
14
16
18
Business researchers as a percentage of national total (%)
19951 20002 20043
57.1
79.9
67.3
59.4
60.7
54.7
77.5
74.2
64.4
61.8
52.2
52.1
60.2
66.3
57.9
52.2
56.8
52.0
49.8
49.0
25.8
28.1
31.7
44.8
38.2
28.9
26.3
16.9
18.7
13.7
26.1
15.4
Finlan
d
United
States
Japa
n
Sweden
Denmark
Norway
Luxe
mbourg
Korea
Total
OECD
Canad
aFra
nce
Belgium
German
y
Austria
United
Kingdo
mEU
15
Irelan
d
Netherl
ands
Switzerl
and
EU25
New Ze
aland
Austra
liaSpa
in
Czech R
epub
lic Italy
Hunga
ry
Greece
Slovak
Repub
lic
Portug
al
Poland
Mexico
Turke
y
OECD SCIENCE, TECHNOLOGY AND INDUSTRY OUTLOOK 2006 – ISBN 92-64-02848-X – © OECD 200634

1. SCIENCE, TECHNOLOGY AND INDUSTRY: RECENT TRENDS AT A GLANCE
20 869 in 2000 to 32 054 in 2004;6 in Australia, it increased from around 16 000 to more than
22 000 (2003), while in Japan it increased from 421 363 to 455 868; and in Korea it rose
sharply from 71 894 to 115 850.
Numbers of higher education researchers have also continued to grow (Figure 1.15).
Between 1997 and 2003, the number of researchers in the higher education sector of the
EU25 countries rose from 350 000 to more than 430 000. Numbers of government
researchers, however, have declined slightly from their peak level in 2000. Across the OECD,
the number of government researchers declined slightly from 275 745 in 2000 to
275 195 in 2004. Government researchers represented almost 8% of the total research
workforce in 2002, down from almost 10% in 1991, but they continue to comprise a
significant share in several eastern European countries. In the Czech Republic, Hungary,
Poland and the Slovak Republic, government researchers continued to account for 25% or
more of all researchers in 2004.
Concerns remain about apparent declines in interest in science and engineering
among youth in many OECD countries and declining graduation rates in science and
engineering fields in some countries. Across the OECD, the number of tertiary-level
graduates in science and engineering has grown in recent years. Between 1998 and 2001,
science graduates increased by 5% annually from 511 000 to 566 000; engineering graduates
increased more slowly, rising at less than 1% a year from 657 000 to 669 000. Their growth
has been slower than that of overall graduates; hence, while science graduates increased
from 9.6% to 10% of total graduates, engineering graduates declined from 12.4% to 11.8%,
owing mostly to reductions in the United States and Europe, including both the larger
European economies (France, Germany and the United Kingdom) and those in eastern
Figure 1.15. Higher education researchersAs a percentage of all researchers
1. 1993 for Austria, 1996 for Switzerland.2. 1998 for the United Kingdom, 1999 for Mexico and the United States.3. 2002 for Australia, Austria, Canada and Turkey; 2003 for France, Germany, Greece, Iceland, Italy, Mexico,
Netherlands, New Zealand, Norway, Portugal, Sweden, EU15 and EU25.
Source: OECD, Main Science and Technology Indicators, June 2006.StatLink: http://dx.doi.org/10.1787/205657652615
0
10
20
30
40
50
60
70
80% 19951 20002 20043
Turke
y
Poland
New Ze
aland
Slovak
Repub
lic
Greece
Austra
liaSpa
in
Mexico
Portug
al
Switzerl
and
Belgium
Hunga
ryIta
ly
Irelan
dEU
25
Sweden
EU15
Franc
e
Finlan
d
United
Kingdo
mCan
ada
Denmark
Norway
Icelan
d
Austria
Netherl
ands
Czech R
epub
licJa
pan
German
yKore
a
United
States
Luxe
mbourg
OECD SCIENCE, TECHNOLOGY AND INDUSTRY OUTLOOK 2006 – ISBN 92-64-02848-X – © OECD 2006 35

1. SCIENCE, TECHNOLOGY AND INDUSTRY: RECENT TRENDS AT A GLANCE
Europe (the Czech Republic, Hungary and Poland). In Spain, however, the number of
science and engineering graduates has expanded significantly.
One approach has been to try to increase participation in research careers by under-
represented populations, including women. The under-representation of women in R&D
activities is increasingly gaining the attention of policy makers. In most countries for which
data are available, women represent between 25% and 35% of total researchers (Figure 1.16).
While women represent over 40% of researchers in Portugal and the Slovak Republic, they
represent only 12% in Japan and Korea. Women researchers are principally found in the
higher education sector and their participation is particularly low in the business sector,
which employs the largest number of researchers in most countries. This is partly linked to
the uneven distribution of women science and technology graduates across fields of study,
with few women engaged in engineering and more in life sciences and social sciences.
An alternative has been to recruit foreign workers and foreign students, many of whom
stay in the host country to work after completing their studies. During the 2003-04 school year,
US higher education institutions hosted 82 900 foreign scholars to conduct teaching or
research activities. Most were engaged in research, although the share for whom the primary
function is teaching or non-research activities has increased over the past decade. Two-thirds
are also engaged into scientific or engineering fields, with a fast-growing proportion involved
in life and biological sciences. Just 20 countries account for 80% of foreign scholars in the
United States. Almost one in two was from a non-OECD country and a quarter came from the
European Union. China was the first country of origin and Asia the most important region.
Around 18% of non-US scholars were Chinese, around 8% were Korean or Indian and more
than 6% were Japanese. Among European countries, Germany, France, the United Kingdom,
Italy and Spain each provided between 2% and 6% of foreign academic staff. In addition,
Canada and Russia accounted for 5% and almost 3% of the total, respectively (see Box 1.1).
Figure 1.16. Women researchers, 2004By sector of employment, as a percentage of all researchers, headcount
Source: OECD, Main Science and Technology Indicator Database, June 2006.StatLink: http://dx.doi.org/10.1787/235006333017
0
10
20
30
40
50%
Portug
al (20
03)
Slovak
Repub
lic
Icelan
d (20
03)
New Ze
aland
(200
1)
Poland
(200
0)
Spain
(2003
)
Turke
y (20
02)
Greece
(200
1)
Hunga
ry
Irelan
d
Finlan
d (20
03)
Norway
(200
3)
Italy
(2002
)
Czech R
epub
lic
Denmark
(200
3)
Franc
e (20
03)
Switzerl
and (
2000
)
Austria
(200
2)
Luxe
mbourg
(200
3)
German
y (20
03)
Japa
n (20
03)
Business enterprises Government Higher education Private non profit
OECD SCIENCE, TECHNOLOGY AND INDUSTRY OUTLOOK 2006 – ISBN 92-64-02848-X – © OECD 200636

1. SCIENCE, TECHNOLOGY AND INDUSTRY: RECENT TRENDS AT A GLANCE
Figure 1.17. Top places of origin of foreign scholars in the United States, headcount, 2003/2004
Source: OECD, based on Institute of International Education (IIE), April 2005.StatLink: http://dx.doi.org/10.1787/806601135513
Box 1.1. Careers of doctorate holders
Following the meeting of Science and Technology Ministers in 2004, the OECD launcheda collaborative project to improve countries’ ability to survey recipients of highly advanced(doctorate level) degrees. The objective is to develop an internationally comparable systemof indicators on careers and mobility, building on surveys currently conducted by manycountries (in particular the United States and Canada). An important element of this workis to measure the mobility of doctorate holders both within a country and across borders.Interest in cross-border movements requires surveys to be internationally comparable,and the OECD has partnered with other relevant international organisations, i.e. theUnesco Institute of Statistics (UIS) and Eurostat, to achieve this goal.
A joint OECD-Eurostat-UIS expert group worked in 2005 to develop a framework forindicators, consisting of three components: methodological guidelines, tabulations ofpolicy-relevant indicators and a core model questionnaire. A first data collection waslaunched in autumn 2005, providing first results for five countries: Australia, Canada,Germany, Switzerland and the United States. Preliminary analysis of the data reveals themain demographic, educational, labour market and mobility patterns of doctoralgraduates. The project also adds value by collecting more qualitative information on theperception and plans of doctoral graduates regarding their employment and internationalmobility. For example, data on the satisfaction of doctorate holders regarding theirsalaries, working conditions or career opportunities can be of great value for steeringresearch systems. Next steps in the project will involve the finalisation and endorsementof the new methodological guidelines, hopefully by the end of 2006, and their futureimplementation in a wide number of OECD and non-OECD economies.
82 905 foreign scholars working in the United States academia in 2003/04China 14 871
Korea 7 290
India 6 809
Japan 5 627
Germany 4 737
Canada 4 125
United Kingdom 3 117 Russia 2 403
Italy 2 317
France 2 842
Spain 1 893
Israel 1 409
Chinese Taipei 1 347
Brazil 1 341
Turkey 1 215
Australia 1 197
Mexico 1 032
Netherlands 975
Poland 927
Argentina 820
Other 16 611
Other 26 874
OECD SCIENCE, TECHNOLOGY AND INDUSTRY OUTLOOK 2006 – ISBN 92-64-02848-X – © OECD 2006 37

1. SCIENCE, TECHNOLOGY AND INDUSTRY: RECENT TRENDS AT A GLANCE
Scholarly mobility compared to the size of the local academic population varies across
countries. For most OECD countries, two to four foreign scholars hold positions in
US universities per 100 working at home. Academic mobility is most significant from Korea
(13), Russia (8) and Chinese Taipei (6). Expansion of the population of foreign scholars in the
United States has been driven by a massive and sustained arrival of Asian academics.
Although a large number of Asian academics already worked in US universities in the mid-
1990s, the number of scholars from Korea, India and China has kept growing at average
annual rates of 9%, 6% and 4%, respectively. Academic mobility from Turkey (7.7%) and
Russia (6.6%) has also increased. However, mobility from European countries has slowed.
The number of scholars originating from Finland, Hungary and Iceland decreased by more
than 2.5% annually between 1995 and 2004. Although most foreign scholars are still men,
women are more numerous than in the past; in 2003/04 female academics accounted for a
third of total foreign scholars in the United States.
Scientific and technological output has expanded
More scientific and technical publications
Increased R&D funding has led to an increase in scientific and technological
publications. Between 1996 and 2003, the number of published articles increased from
516 000 to nearly 584 000, a jump of more than 13% (Table 1.2). Rates of growth in Japan and
the EU15 were considerably higher than in the United States, but still lagged those of other
Asian countries, which started from much lower levels. Regional differences remain. In
Japan the share of total publications increased in physical sciences, engineering,
technology and mathematics and social and behavioural sciences and declined in life
sciences. The EU saw declines in life and physical sciences, but increases in other fields. In
the United States, engineering, technology and mathematics increased while other fields
declined, apart from life sciences which remained the same. These results are not
surprising given different patterns of R&D investment.
Slower growth in patenting
Changes in business R&D expenditure are mirrored by changes in patenting, as
patents represent one means of codifying and protecting inventions developed in the
innovation process. Over the past decade, the number of patents filed (and granted) at the
major OECD patent offices – European Patent Office (EPO), Japan Patent Office (JPO) and US
Table 1.2. Scientific articles by geographic region and field of scienceand technology
Total numberof articles1
Life sciences(%)
Physical sciences(%)
Engineering, technologyand mathematics (%)
Social and behavioural sciences (%)
1996 2003 1996 2003 1996 2003 1996 2003 1996 2003
United States 201 798 211 233 54.1 54.1 22.4 22.2 8.0 10.7 8.8 6.4
EU15 193 172 220 002 54.3 52.1 31.6 30.1 7.5 9.6 4.4 5.5
Japan 50 392 60 067 50.1 46.8 38.3 38.6 10.4 12.5 1.0 1.8
Total OECD 516 043 583 913 53.2 51.8 28.7 28.2 8.1 10.7 6.1 5.4
World 593 568 698 726 50.8 48.7 31.4 31.3 8.7 11.2 5.7 5.3
1. Includes health sciences and professional fields which are not shown here (see annex).Source: US National Science Foundation, Science and Engineering Indicators, 2006.
StatLink: http://dx.doi.org/10.1787/630423464503
OECD SCIENCE, TECHNOLOGY AND INDUSTRY OUTLOOK 2006 – ISBN 92-64-02848-X – © OECD 200638

1. SCIENCE, TECHNOLOGY AND INDUSTRY: RECENT TRENDS AT A GLANCE
Patent and Trademark Office (USPTO) – has continued to rise. With the decline in business
R&D at the beginning of the decade, growth rates in patenting have slowed. Patent
applications to the EPO, which grew by more than 5% a year during the latter half of
the 1990s, stagnated in 2001 and 2002, but show signs of picking up again in 2003 and 2004.
Similarly, the number of patent applications to the USPTO grew by an average of 7.3% a year
between 1991 and 2001, but dropped to approximately 2.5% in 2002 and 2003. The growth
rate increased to 4.5% in 2004, but remains below levels of the late 1990s. Growth in French
and UK patent offices remained stable in recent years, while the Canadian patent office
reported growth of 3.5% a year between 1991 and 2000 (OECD, 2005a).
Statistics on patent families also show some cooling off after rapid growth in
the 1990s.7 The number of patent families rose from about 30 000 in 1991 to 52 000 in 2003
following several years of rapid growth between 1994 and 2000 (Figure 1.18). The pace
tapered off considerably after 2000, as it did in the late 1980s, owing largely to stagnation in
the numbers of patent families owned by inventors in Japan and the EU25. The number of
patent families owned by US inventors continued to grow after 2000, although it showed
signs of slowing between 2002 and 2003. Over the 11-year period from 1991 to 2002 the
shares of US- and EU-owned patent families grew slightly, while that of Japan declined.
Several factors may account for the slowdown in patenting in major patent offices.
Most notably, it reflects slowing investment in R&D by industry. The slowdown in
business R&D that occurred after 2000 is likely to have tempered the rate of invention.
The recent up-tick in R&D spending can likewise be expected to boost patenting rates. At
the same time, cost-cutting efforts may have taken a toll on patenting. In the more
difficult economic climate of the early years of the decade, firms may have opted to file
fewer patent applications to avoid costly filing, maintenance and litigation fees. Indeed,
among EU firms, the ratio of patent families to industry-financed R&D fell after 2000,
with firms from Finland, Sweden and Denmark registering the largest declines. The
ratios for Japanese and US patent families did not decrease, however, but remained stable
between 2000 and 2002.
Figure 1.18. Patent families, 1985-2002
Source: OECD Patents Database, June 2006.StatLink: http://dx.doi.org/10.1787/448323182654
0
5 000
10 000
15 000
20 000
1991 1992 1993 1994 1995 1996 1997 1998 1999 2000 2001 2002 2003
Japan United States EU25
OECD SCIENCE, TECHNOLOGY AND INDUSTRY OUTLOOK 2006 – ISBN 92-64-02848-X – © OECD 2006 39

1. SCIENCE, TECHNOLOGY AND INDUSTRY: RECENT TRENDS AT A GLANCE
Future trends in patenting will be influenced as much by rates of invention as by
changing patent management strategies within firms. Recent surveys suggest that firms
are more likely to patent inventions today than a decade earlier, in part because of
expanded patentability criteria (e.g. for genomic and software inventions) and
strengthened enforcement against infringement. At the same time, firms exploit their
patents in more diverse ways. Patents not only allow firms to protect their inventions
against infringement, but allow them to enter into cross-licensing agreements, generate
licensing revenue and attract venture capital or other types of financing (OECD, 2006c). As
firms implement more open, collaborative innovations, they increasingly source
components, technology and knowledge from external organisations, using both market-
based transactions (e.g. licences, acquisitions) and more open sharing of information. This
trend can increase the value of patents to firms, as they seek to stake a proprietary claim
to intellectual property that they might sell to or share with others.
Nevertheless, other forms of intellectual property management may also increase in
importance, limiting growth in patenting. In some sectors of the economy, e.g. information
technology, the time required for a patent to be granted may be considerably longer than
the rate of invention and obsolescence, making mechanisms like copyright more
advantageous. In the software sector, further elaboration of the open source model (which
has already gained ground in some market segments, such as operating systems, and
email), could further supplant the patenting model, and although a large number of
patents related to open source software exist. As the ICT sector accounts for a large fraction
of all patents – roughly 35% in the three main patent offices – changes in intellectual
property management in this sector can affect aggregate statistics on patenting and raise
the importance of other indicators of innovation.
More certain is that internationalisation of patent filings will continue to contribute to
growth in patenting, as it has done in recent years. More applicants use the Patent
Cooperation Treaty (PCT) procedure to obtain international protection for their inventions,
although use of this mechanism also stagnated somewhat during 2001 and 2002. The share
of foreign applications in major patent offices has continued to grow and stood at
approximately 65% in the EPO in 2000 and at 47% in the USPTO. In addition, foreign
ownership of domestic inventions has also increased. On average around 16% of all
domestic inventions filed at the EPO were owned or co-owned by a foreign resident in the
period from 2000 to 2002, representing a significant increase from levels a decade earlier
(11% in 1990 to 1992). The share of foreign ownership of domestic inventions at the USPTO
has also increased in recent years, reaching a figure of around 10% in 1998-2000, more than
three percentage points higher than the share in 1990-1992.
A more global context for innovationThe marked growth in R&D expenditures in OECD countries from the first half of
the 1990s was accompanied by growing internationalisation of R&D activities of
multinational firms, linked to an increase in the number of R&D facilities located abroad.
OECD data show that R&D performed abroad by foreign affiliates represented, on average,
well over 16% of total expenditure on industrial R&D in the OECD area in 2003. In most
OECD countries, the share of foreign affiliates in industrial R&D is growing as foreign firms
acquire local R&D-performing firms (e.g. through mergers and acquisitions) or establish
new subsidiaries.8 Smaller countries such as Ireland typically report higher shares of R&D
expenditures by foreign affiliates; among larger European economies, the share of R&D
OECD SCIENCE, TECHNOLOGY AND INDUSTRY OUTLOOK 2006 – ISBN 92-64-02848-X – © OECD 200640

1. SCIENCE, TECHNOLOGY AND INDUSTRY: RECENT TRENDS AT A GLANCE
performed in foreign affiliates ranged from a low of 23% in France to a high of 45% in the
United Kingdom in 2003, both of which (along with Germany) have seen notable increases
since 1995 (Figure 1.19). In the United States, foreign affiliates accounted for more than
15% of business R&D, up from 12% in 1995, and in Canada the figure jumped from 30% to
35%. Japan has the lowest share of R&D in foreign affiliates, at just 3.6% of total
manufacturing R&D, but that figure has climbed from 1.4% in 1995. Among countries for
which data are available, only the Netherlands, Poland, Spain and Turkey have seen
declines in the share of R&D in foreign affiliates in the past decade, but in all countries
except Hungary and Ireland the R&D intensity of foreign affiliates (R&D as a percentage of
sales) is lower than that of domestic companies. Switzerland is the only country where
R&D expenditure of its affiliates abroad represents more than the R&D expenditure of all
firms located in Switzerland.
Globalisation of innovation is further fuelled by the increased innovative capacity of
non-OECD economies.
Developments in some non-OECD economies
Non-OECD economies have made important progress in strengthening R&D and
innovation activities and related policies. There are two clear trends: rapid absolute
growth, from low starting points, in R&D and patenting, and significantly growing shares
in global R&D and patenting. However these trends are far from uniform across the non-
member economies, and considerable diversity continues to characterise this group.9
Non-member economies improved their standing in terms of R&D investment relative
to OECD economies. The share of R&D expenditure by non-OECD economies increased
Figure 1.19. R&D expenditure of foreign affiliates, 1995, 2000 and 2003As a percentage of R&D expenditures of enterprises
1. 1996 instead of 1995 for the Czech Republic; 1997 for the Netherlands, Finland and Turkey.2. 1999 instead of 2000 for Ireland, Spain, Germany, Greece; 1998 for Hungary and France.3. 2002 for Sweden, Italy, the United States, Turkey, Japan; 2001 for Germany, the Netherlands, Finland; 2003 for
other countries.
Source: OECD AFA Database, June 2006.StatLink: http://dx.doi.org/10.1787/261126026778
0
20
40
60
80% 19951 20002 20033
Hunga
ry
Irelan
d
Belgium
Czech R
epub
lic
United
Kingdo
m
Austra
lia
Canad
a
Sweden Ita
ly
Netherl
ands
German
ySpa
in
Portug
al
Franc
e
Slovak
Repub
lic
United
States
Finlan
d
Poland
Turke
y
Greece
Japa
n
OECD SCIENCE, TECHNOLOGY AND INDUSTRY OUTLOOK 2006 – ISBN 92-64-02848-X – © OECD 2006 41

1. SCIENCE, TECHNOLOGY AND INDUSTRY: RECENT TRENDS AT A GLANCE
from around 10% in 1996 to 19% in 2004.10 In terms of human resources in S&T, however,
the share of the non-OECD economies did not change: the number of researchers in non-
OECD economies combined equalled about one-third of the total number of researchers in
the whole OECD area throughout the period 1996-2002. Since wage costs for R&D workers
and support staff are typically lower in these economies, the rising share of R&D
expenditure paired with a stable share of human resources may imply more rapidly
increasing capital and infrastructure investment in the non-member economies than in
the OECD area during this period.
Considerable attention has focused on China, which between 1995 and 2004 saw its
R&D spending quintuple in real terms. China now has the world’s fourth largest R&D spend
worldwide, at USD 94 billion,11 just behind the United States, the EU and Japan. With an
investment in R&D of almost USD 24 billion, India comes a distant second among the non-
OECD economies, but still holds eighth place worldwide, just following Korea. Further
down the ranking are Russia (USD 17 billion), Chinese Taipei (USD 15 billion) and Brazil
(USD 14 billion), which occupy 11th, 12th and 13th place, respectively, in the world, in
between Italy (10th) and Spain (14th). While Israel, South Africa, Singapore, Argentina and
Chile have relatively less significant amounts of R&D investments, they are still ahead of
some small OECD members in absolute terms.
However, not all non-OECD economies took part in the growth in R&D expenditure.
Figure 1.20 suggests wide dispersion of average annual growth rates.
In terms of growth in R&D expenditure, most non-OECD economies under review
more than doubled their R&D expenditures over the decade between 1995 and 2004, while
growth in the OECD area as a whole was 56% over the same period, in other words, about
half of the growth rate of non-member economies. However Latin American countries, in
particular Brazil and Argentina, were exceptions, with R&D expenditures not only growing
Figure 1.20. Average annual growth rates of R&D expenditure and R&D personnel, 1995-2004 (%)
Note: Growth rates are based on data in constant prices. For expenditure: Argentina 1996-2004, South Africa 1997-2004,OECD 1995-2003; for researchers: Argentina and South Africa 1997-2004, Chinese Taipei 1996-2004, India 1996-2002 andOECD 1995-2002. There is a break in series for Chinese Taipei in 2002, which has some impact on the growth rate.
Source: OECD Main Science and Technology Indicators Database, June 2006 and OECD, based on national sources.StatLink: http://dx.doi.org/10.1787/154714135441
-10
-5
0
5
10
15
20
25
China Singapore Israel SouthAfrica
ChineseTaipei
RussianFederation
India OECD Brazil Argentina
Expenditure Researchers
OECD SCIENCE, TECHNOLOGY AND INDUSTRY OUTLOOK 2006 – ISBN 92-64-02848-X – © OECD 200642
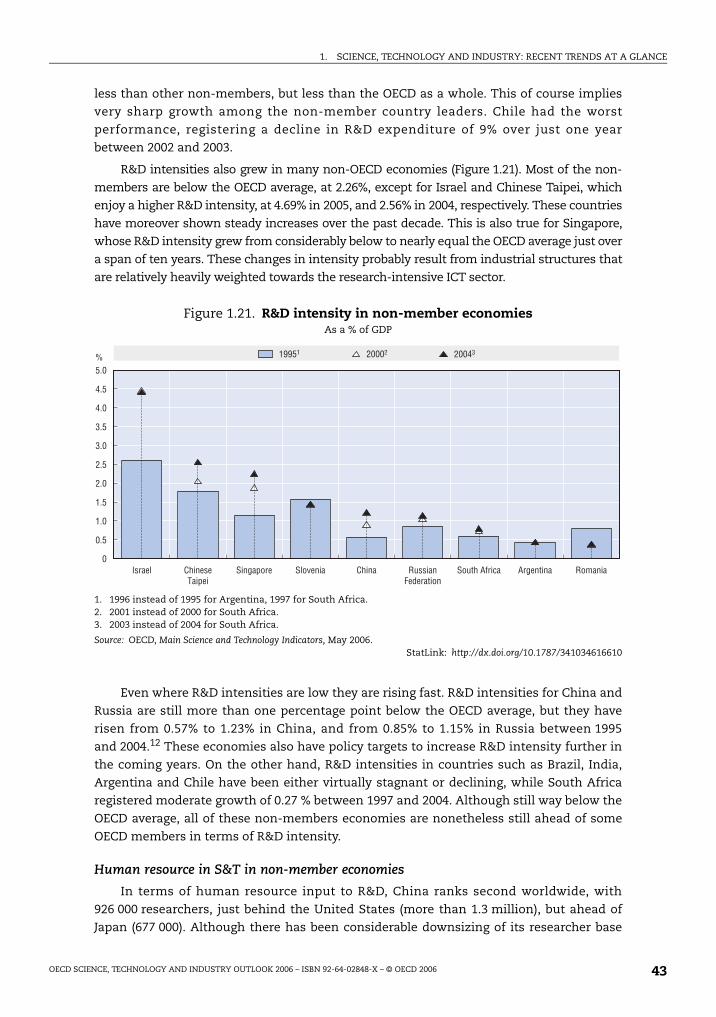
1. SCIENCE, TECHNOLOGY AND INDUSTRY: RECENT TRENDS AT A GLANCE
less than other non-members, but less than the OECD as a whole. This of course implies
very sharp growth among the non-member country leaders. Chile had the worst
performance, registering a decline in R&D expenditure of 9% over just one year
between 2002 and 2003.
R&D intensities also grew in many non-OECD economies (Figure 1.21). Most of the non-
members are below the OECD average, at 2.26%, except for Israel and Chinese Taipei, which
enjoy a higher R&D intensity, at 4.69% in 2005, and 2.56% in 2004, respectively. These countries
have moreover shown steady increases over the past decade. This is also true for Singapore,
whose R&D intensity grew from considerably below to nearly equal the OECD average just over
a span of ten years. These changes in intensity probably result from industrial structures that
are relatively heavily weighted towards the research-intensive ICT sector.
Even where R&D intensities are low they are rising fast. R&D intensities for China and
Russia are still more than one percentage point below the OECD average, but they have
risen from 0.57% to 1.23% in China, and from 0.85% to 1.15% in Russia between 1995
and 2004.12 These economies also have policy targets to increase R&D intensity further in
the coming years. On the other hand, R&D intensities in countries such as Brazil, India,
Argentina and Chile have been either virtually stagnant or declining, while South Africa
registered moderate growth of 0.27 % between 1997 and 2004. Although still way below the
OECD average, all of these non-members economies are nonetheless still ahead of some
OECD members in terms of R&D intensity.
Human resource in S&T in non-member economies
In terms of human resource input to R&D, China ranks second worldwide, with
926 000 researchers, just behind the United States (more than 1.3 million), but ahead of
Japan (677 000). Although there has been considerable downsizing of its researcher base
Figure 1.21. R&D intensity in non-member economiesAs a % of GDP
1. 1996 instead of 1995 for Argentina, 1997 for South Africa.2. 2001 instead of 2000 for South Africa.3. 2003 instead of 2004 for South Africa.
Source: OECD, Main Science and Technology Indicators, May 2006.StatLink: http://dx.doi.org/10.1787/341034616610
0
0.5
1.0
1.5
2.0
2.5
3.0
3.5
4.0
4.5
5.0
Israel ChineseTaipei
Singapore Slovenia China RussianFederation
South Africa Argentina Romania
% 19951 20002 20043
OECD SCIENCE, TECHNOLOGY AND INDUSTRY OUTLOOK 2006 – ISBN 92-64-02848-X – © OECD 2006 43

1. SCIENCE, TECHNOLOGY AND INDUSTRY: RECENT TRENDS AT A GLANCE
during the post-Soviet period, Russia ranks fourth, ahead of the large European OECD
member countries (though not the EU as a whole). In spite of their large population,
however, India and Brazil, with less than 100 000 researchers each, fall just below the top
ten, behind Spain but ahead of Australia among OECD countries.
As noted above, compared with increases in R&D expenditure, numbers of researchers
have grown considerably less rapidly in most non-member economies. In China, the
number of researchers increased by 77% over the decade between 1995 and 2004.
Researchers grew rapidly in East Asian economies such as Singapore (178%) and Chinese
Taipei (59%) during the period, as well as in South Africa (110% between 1997 and 2004). For
the two Latin American countries for which data on R&D personnel are available, Brazil
registered growth of 35% during the first half of the 2000s and Argentina 19% for seven
years up to 2004. On the other hand, there was a decrease of 22% in Russia over the same
period, reflecting post-Soviet adjustments, as well as a 3% drop in India between 1998
and 2002.
The number of researchers per thousand indicates the intensity of R&D personnel
input. By this measure, non-member economies compare less well with OECD countries.
Singapore is the exception among the eight economies for which data are available, as it
employs more researchers per thousand than the OECD average.13 Chinese Taipei and
Russia are close to the OECD average, but the other countries are far below it. In particular,
for the so-called BRICS (Brazil, Russia, India, China, South Africa), intensity of R&D
personnel in South Africa is less than one-fifth, in China just one-seventh, and in Brazil
only one-eighth of the OECD average in 2004.
Patent trends among non-member economies
In terms of non-OECD innovation outputs in the form of patents, Table 1.3 shows that
the number of patent families is still small for non-member economies, compared to the
OECD total, but the numbers have grown rapidly, particularly in recent years, in China and
Chinese Taipei and, to a lesser extent, in India.
Table 1.3. Number of patent families (priority year)
1985 1990 1995 2000 2001 2002 2003
OECD 22 687 32 254 34 439 49 217 49 636 50 726 51 754
Argentina 2 6 6 11 8 9 9
Brazil 9 11 13 27 32 32 35
Chile 0 2 2 2 3 4 5
China 30 12 19 87 128 144 177
India 5 12 12 58 71 78 87
Israel 52 83 154 363 352 331 355
Romania 0 0 2 1 3 2 2
Russian Federation 20 21 51 65 61 58 56
Singapore 1 4 24 78 84 80 82
Slovenia 0 1 7 9 4 6 . .
South Africa 19 14 24 37 38 37 38
Chinese Taipei 5 10 23 77 92 98 108
Note: Patents all applied for at the EPO, USPTO and JPO. Figures for 2000 to 2003 are estimates. Patents are countedaccording to the earliest priority date (the first filing of the patent worldwide) which is the date the closest to the dateof invention.Source: OECD, Patent Database, June 2006.
StatLink: http://dx.doi.org/10.1787/806856284222
OECD SCIENCE, TECHNOLOGY AND INDUSTRY OUTLOOK 2006 – ISBN 92-64-02848-X – © OECD 200644
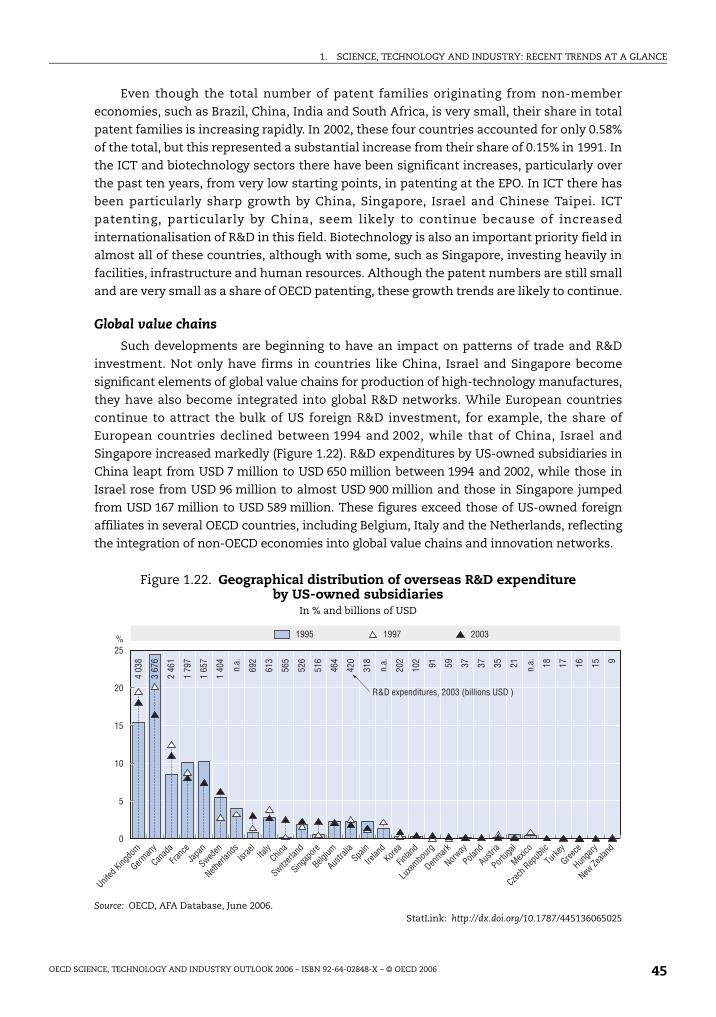
1. SCIENCE, TECHNOLOGY AND INDUSTRY: RECENT TRENDS AT A GLANCE
Even though the total number of patent families originating from non-member
economies, such as Brazil, China, India and South Africa, is very small, their share in total
patent families is increasing rapidly. In 2002, these four countries accounted for only 0.58%
of the total, but this represented a substantial increase from their share of 0.15% in 1991. In
the ICT and biotechnology sectors there have been significant increases, particularly over
the past ten years, from very low starting points, in patenting at the EPO. In ICT there has
been particularly sharp growth by China, Singapore, Israel and Chinese Taipei. ICT
patenting, particularly by China, seem likely to continue because of increased
internationalisation of R&D in this field. Biotechnology is also an important priority field in
almost all of these countries, although with some, such as Singapore, investing heavily in
facilities, infrastructure and human resources. Although the patent numbers are still small
and are very small as a share of OECD patenting, these growth trends are likely to continue.
Global value chains
Such developments are beginning to have an impact on patterns of trade and R&D
investment. Not only have firms in countries like China, Israel and Singapore become
significant elements of global value chains for production of high-technology manufactures,
they have also become integrated into global R&D networks. While European countries
continue to attract the bulk of US foreign R&D investment, for example, the share of
European countries declined between 1994 and 2002, while that of China, Israel and
Singapore increased markedly (Figure 1.22). R&D expenditures by US-owned subsidiaries in
China leapt from USD 7 million to USD 650 million between 1994 and 2002, while those in
Israel rose from USD 96 million to almost USD 900 million and those in Singapore jumped
from USD 167 million to USD 589 million. These figures exceed those of US-owned foreign
affiliates in several OECD countries, including Belgium, Italy and the Netherlands, reflecting
the integration of non-OECD economies into global value chains and innovation networks.
Figure 1.22. Geographical distribution of overseas R&D expenditureby US-owned subsidiaries
In % and billions of USD
Source: OECD, AFA Database, June 2006.StatLink: http://dx.doi.org/10.1787/445136065025
0
5
10
15
20
25%
United
Kingdo
m
German
y
Canad
aFra
nceJa
pan
Sweden
Netherl
ands
Israe
lIta
lyChin
a
Switzerl
and
Singap
ore
Belgium
Austra
liaSpa
in
Irelan
dKore
a
Finlan
d
Luxe
mbourg
Denmark
Norway
Poland
Austria
Portug
al
Mexico
Czech R
epub
lic
Turke
y
Greece
Hunga
ry
New Ze
aland
1995 1997 2003
4 03
8
3 67
6
2 46
1
1 79
7
1 65
7
1 40
4
n.a.
n.a.
n.a.
692
613
565
526
516
464
420
318
202
102 91 59 37 37 35 21 18 17 16 15 9
R&D expenditures, 2003 (billions USD )
OECD SCIENCE, TECHNOLOGY AND INDUSTRY OUTLOOK 2006 – ISBN 92-64-02848-X – © OECD 2006 45

1. SCIENCE, TECHNOLOGY AND INDUSTRY: RECENT TRENDS AT A GLANCE
Summing upAs the evidence in this chapter suggests, the overall outlook for science, technology
and industry remains positive. Prospects for growing investments in innovation remain
strong and patterns of innovation may converge if global economic conditions remain
stable. National governments are committed to increasing public investments in R&D and
to further enhancing the efficiency of national innovation systems through improved
allocation of resources, the strengthening of linkages between science and innovation, and
improved incentives for business innovation.
Nevertheless, governments will need to remain attentive to significant changes in
innovation processes and adapt policies accordingly. The resurgence of public research
organisations – universities in particular – as sources of knowledge for innovation will
require continued reform of their governance to ensure that they maintain the quality of
their output while contributing more to social and economic objectives. The reduction in
industry funding of university research may also suggest a need for more efficient
mechanisms of knowledge and technology transfer. The growth of the services sector will
require attention to a broader set of innovating organisations and to forms of innovation
that are less reliant on R&D. The development of more open innovation processes that link
business, universities and government in a tighter innovation network will necessitate
even greater attention to collaboration and to issues of intellectual property protection.
Finally, globalisation will require governments to develop national policy in a way that
reflects and benefits from the expanding capabilities of OECD and non-member economies
alike. In all these areas, policies for creating a skilled workforce will remain paramount.
Notes
1. A more complete discussion of the benefits and limitations of R&D statistics as an indicator ofinnovation can be found in OECD (2006a).
2. Measured as tax credits earned and claimed in the current year. See, Department of FinanceCanada, Table 2.
3. Data from the PricewaterhouseCoopers Money Tree survey, available at www.pwcmoneytree.com/moneytree/index.jsp. According to the survey, US venture capital investments remain highlyconcentrated, but the mix of industries has changed over time. Software firms continue to accountfor the largest share of venture investments, having received USD 4.8 billion or 21% of allinvestments in 2005. The next three sectors – biotechnology, telecommunications and medicaldevices – accounted for another 37% of total investments in 2005, up from 23% in 2000.
4. Manufacturing industries are often grouped in four categories according to their R&D intensity:high, medium-high, medium-low and low technology.
5. Researchers are defined as professionals engaged in the conception and creation of new knowledge,products, processes, methods and systems and directly involved in the management of projects.
6. Some of the increase in business researchers in the United Kingdom resulted from theprivatisation of the Defence Evaluation and Research Agency in 2001.
7. The term patent family refers to the set of patents filed at the EPO, the JPO and USPTO to protect thesame invention. Because they represent patents filed in the three major patent offices, patentfamilies are often considered to be high-quality patents that inventors expect to exploit globallyand for which they are willing to pay application and maintenance fees to multiple patent offices.By avoiding multiple counts of patents filed in several offices, they also reduce some of the effectsof international patenting on total patent counts.
8. Existing data do not allow an accurate breakdown of foreign affiliate R&D into R&D performed innew facilities versus established facilities.
OECD SCIENCE, TECHNOLOGY AND INDUSTRY OUTLOOK 2006 – ISBN 92-64-02848-X – © OECD 200646

1. SCIENCE, TECHNOLOGY AND INDUSTRY: RECENT TRENDS AT A GLANCE
9. The choice of economies covered here is limited by data availability, and where possible refers toArgentina, China, India, Israel, Russian Federation, Singapore, South Africa and Chinese Taipei.
10. R&D data converted from national currencies into purchasing power parities (PPPs).
11. The PPP rates used to convert Chinese data are likely to be underestimated, leading to anoverestimation of R&D expenditures in PPP dollars.
12. Because of the recent upward revision of China’s GDP, R&D intensities have undergoneconsiderable downward revision.
13. Note that there are no data for Israel.
Bibliography
Battelle, The Business of Innovation (2006), “2006 R&D Funding Forecast”. R&D Magazine, January.
Department of Finance Canada (2005) “Tax Expenditures and Evaluations 2005”, Department of FinanceCanada, Ottawa.
IPTS (2006), “Does Europe Perform Too Little Corporate R&D? Comparing EU and non-EU CorporateR&D Performance”, European Commission, Joint Research Centre (IPTS) Seville.
OECD (2005a), Compendium of Patent Statistics, OECD, Paris. Available at www.oecd.org/sti/ipr.
OECD (2006a), Going for Growth 2006, OECD, Paris.
OECD (2006b), OECD Economic OutlookNo. 79, OECD, Paris.
OECD (2006c), “Research Use of Patented Inventions: Conference Summary”, OECD, Paris. Available atwww.oecd.org/sti/ipr.
OECD SCIENCE, TECHNOLOGY AND INDUSTRY OUTLOOK 2006 – ISBN 92-64-02848-X – © OECD 2006 47


ISBN 92-64-02848-X
OECD Science, Technology and Industry Outlook 2006
© OECD 2006
Chapter 2
National Developments in Science, Technology and Innovation Policy
This chapter presents the main trends in national science and technology andinnovation policies, in particular policies and programmes introduced between 2004and 2006. It discusses developments related to public-sector research, governmentsupport for business R&D and innovation, collaboration and networking amonginnovating organisations, globalisation of innovation, and the evaluation of publicpolicies to stimulate research and innovation.
49

2. NATIONAL DEVELOPMENTS IN SCIENCE, TECHNOLOGY AND INNOVATION POLICY
IntroductionOECD countries continue to focus policies and financial mechanisms on stimulating
science and innovation. Many recent policy developments represent a continuation of
trends that began earlier in the decade and were highlighted in the 2004 edition of the
OECD Science, Technology and Industry Outlook. While some countries have made incremental
changes in their main policy trends, others have made a significant break with past policy
trends. Emerging trends include:
● National S&T plans remain important for priority setting. Several countries have developed
and introduced new national plans for S&T policy. These provide a degree of visibility in
terms of current commitments and future orientations. A new trend is that planning
increasingly takes place at sub-ministry levels: research bodies, funding agencies and
universities are being required to undertake their own strategic planning exercises and
to monitor progress.
● Countries continue to develop technology foresight initiatives to identify challenges and respond to
opportunities in new and emerging science and technologies. Finland, New Zealand,
Korea, Italy, Iceland and the United Kingdom have new foresight initiatives. Such efforts
help identify areas of research priority. Among the main priorities in many countries are
health, ICT, energy and the environment, and, more recently, security issues.
Nanotechnology is also becoming more important in many countries.
● R&D targets act as a catalyst for stimulating public and private R&D. A growing number of
countries have established quantitative targets for R&D spending, although budget
deficits may constrain growth in public R&D. While only a few EU countries seem on
track to meet their R&D spending target of 3% of GDP, the target has nevertheless focused
attention to and support for innovation at the highest levels of government.
● Quality assessment is becoming more widespread as a way to improve publicly funded research.
Quality assessment tools aim to ensure that high-quality research is funded and that
research results contribute to social and economic goals. Better access to public research
data is also a way to improve knowledge transfer, and many countries are seeking to
promote more open access to public research data.
● Balancing competitive funding mechanisms with longer-term institutional funding remains an
issue in Germany, New Zealand and the United Kingdom. Whereas the tendency had
been to shift the balance towards more competitive funding, some rebalancing towards
institutional funding has become apparent. Germany recently boosted institutional
funding for non-university public research organisations; New Zealand, which has
leaned heavily towards competitive funding, is re-evaluating its funding mechanisms.
● Infrastructure is attracting greater attention in many OECD countries, including Australia,
Belgium, Germany, Spain and the United Kingdom. Concerns about the sustainability of
capital funding for infrastructure are not limited to universities but are also found in
public research institutes.
OECD SCIENCE, TECHNOLOGY AND INDUSTRY OUTLOOK 2006 – ISBN 92-64-02848-X – © OECD 200650

2. NATIONAL DEVELOPMENTS IN SCIENCE, TECHNOLOGY AND INNOVATION POLICY
● Support for innovation is being streamlined and consolidated. Countries continue to boostsupport for business R&D either directly (grants, loans) or indirectly (tax incentives forR&D and early-stage capital funds). Austria, Finland, Germany and the Netherlands havestreamlined and consolidated their innovation support programmes to make themsimpler for industry to use. Hungary and Spain are concentrating resources on largerprogrammes rather than small-scale initiatives.
● Government support for business innovation is becoming more oriented towards fostering openinnovation. Many countries have embedded concepts of networking and consortiumdevelopment into their innovation support programmes and initiatives in order to fostergreater collaboration, especially around regions and clusters, among firms and betweenfirms and public research bodies.
● Support for innovation in services. In view of the growing importance of services toemployment and growth, many countries are examining ways to tailor access toinnovation programmes to better attract service-oriented firms. A few have specialprogrammes for the services sector and many others are considering ways to betterdesign generic innovation programmes to suit the needs of the services sector.
● Formalising knowledge transfer between universities and industry is of growing importanceeven in countries where industry-science relations are strong. As a result, a third streamof funding is now being earmarked for knowledge transfer activities at universities.Specific efforts are being made to improve the management of intellectual propertyrights (IPRs) at universities, such as the development of guidelines and model contracts.
● The role of sub-central governments in innovation policy is increasing. A number of OECD countriesare focusing attention on stimulating innovation in regions or clusters, and regionalgovernments themselves have become more active in the design and implementation ofS&T policies in Australia, Belgium, France, Germany, Spain and the United Kingdom.
● There are persistent concerns about the supply of scientists and engineers. Countries continueto report concerns about future supplies of human resources for science and technology(HRST). Several have taken action to improve the quality of science teaching at all levelsof education. Many also seek to boost supply by attracting more women and minoritiesinto science and technology. The international mobility of students and youngresearchers is also a high priority in many countries.
● A holistic approach to evaluation is appearing. Evaluation is an essential part of thegovernance and implementation of science and innovation policy. While the economicefficiency and effectiveness of policies remains the main goal of evaluation, countriessuch as Australia, Poland and the United States are taking a more holistic approach andfocusing on the social and environmental as well as the economic benefits of policies.There is also a growing involvement in the evaluation process of international experts ororganisations such as the OECD or the European University Association and theEuropean Network for Quality Assessment (e.g. in Portugal, Spain).
National strategies for science, technology and innovationAcross the OECD area, national governments continue to develop national strategies
and plans for science, technology and innovation. A number of new plans were introduced
between 2004 and 2006, and many countries have modified or extended existing plans,
ensuring both a degree of continuity in government policy and relevance to a changing
innovation environment. Such changes, if reported, appear in Table 2.1 and the key
elements are summarised below.
OECD SCIENCE, TECHNOLOGY AND INDUSTRY OUTLOOK 2006 – ISBN 92-64-02848-X – © OECD 2006 51

2. NATIONAL DEVELOPMENTS IN SCIENCE, TECHNOLOGY AND INNOVATION POLICY
Table 2.1. Revised or new national plans for science, technology and innovation policyin OECD countries and selected non-member economies, 2006
National plan Period covered Main objectives
Australia Backing Australia’s Ability – Building Our Future through Science and Innovation
2004-10 Strengthen Australia’s ability to generate ideas and undertake research; accelerate the commercialisation of ideas, and develop and maintain skills. Provides approximately AUD 1 billion a year through 2010.
Austria Strategie 2010; National Action Plan for Innovation
2005-10 Improvement of networking and co-operation between science and industry; Strengthen framework conditions; public infrastructure; financing innovation; human resources for innovation.
Belgium Innovation Pact of the Flemish Community; “Marshall Plan for Research by the Walloon Region and French Community”
2005onward
Competition policies, entrepreneurship, taxes, training and research.
Canada Federal Science and Technology Strategy
2006onwards
The Minister of Industry is developing a federal S&T strategy in collaboration with the Minister of Finance that will encompass the broad range of government support for research, including knowledge infrastructure.
Denmark Progress, Innovation and Cohesion 2007-10 Strengthen Denmark’s competitiveness in the global economy; more public investments in R&D; improving the efficiency of public spending in R&D and education, in particular by allocating more public funds in open competition and internationalisation of R&D; long-term research projects and strategic research projects; human resources for innovation. The government has announced its intention to invest an additional EUR 1.5 billion in R&D by 2007-10.
Finland Science, Technology, Innovation 2007-2011 Raise R&D from 3.5% to 4% of GDP by the end of the decade; promote the innovation system and its ability to renew itself; enhance competence base; improve quality and focus of research; promote introduction and commercialisation of research results; secure economic “prerequisites”, including human resources.
France La loi de programme pour la recherche (new law on research)
2006onwards
Improve the strategic vision and coherence of the research system; develop interfaces and co-operation between public research actors and between them and the business sector.
Germany New High-tech Strategy 2006-09 The new government has announced its intention to invest an additional EUR 6 billion in R&D.
Greece National Strategic Reference Framework 2007-2013
2007-2013 The main objectives are the utilisation of European Community funds for regionaland community convergence via, inter alia, the promotion of human capital, innovation, entrepreneurship, employment and the improvement of the quality of life.
Hungary S&T Innovation Strategy 2006-13 Increase total R&D expenditure to 2.1% of GDP by 2013 while doubling the ratio of business to public R&D performance (business at 1.4% of GDP; government at 0.7%). Strong focus on key technology areas, commercialisation and regional innovation systems.
Iceland Policy Statement of the Science and Technology Policy Council
2006-09 Foster an education and research system of high international quality in close contact with the economy; strengthen competitive funding for research and innovation; strengthen university research; re-organise public research labs and link them to higher education; enhance public/private sector co-operation for increased international competitiveness; review the role of the state in supporting long-term research and monitoring in the public interest.
Italy The National Programme for Science and Technology
2005-2007 Support basic and mission oriented research; increase the technological level of the production system through, inter alia, the creation of high-tech spin-offs; develop human capital for science; intensify collaboration among PROs, universities and enterprises.
Ireland Building Ireland’s Knowledge Economy: the Irish Action Plan for Promoting Investment in R&D to 2010
2006-2010 Promote R&D to become an innovation-driven economy; improve competitiveness; remain attractive for FDI; maximise social cohesion.
Japan 3rd S&T Basic Plan 2006-10 Facilitate the creation and utilisation of knowledge; foster national competitiveness; ensure a safe and secure society with a high quality of life by developing a strong economy and industries that can constantly innovate, through reforms in the S&T system.
Korea Revised S&T Basic Plan 2003-2007 Advance the national S&T innovation system; select and focus on strategic future S&T areas; strengthen future growth engines; systemize regional innovation capacity; create new jobs matching demands of the knowledge-based society and expand people’s participation and spread S&T culture.
Luxembourg National Reform Plan 2006-10 Support innovation in all its forms in order to improve productivity. Raise R&D as a share of GDP to 2.4% in 2008 and to 3% in 2010, and raise the number of researchers to the level of 10 per thousand by 2010.
OECD SCIENCE, TECHNOLOGY AND INDUSTRY OUTLOOK 2006 – ISBN 92-64-02848-X – © OECD 200652

2. NATIONAL DEVELOPMENTS IN SCIENCE, TECHNOLOGY AND INNOVATION POLICY
Mexico Programa Especial de Ciencia y Tecnología (PECYT)
2001-2006 Develop a national policy for S&T; increase scientific capacity, improve the ompetitiveness of firms.
New Zealand Picking Up the Pace 2006onwards
Plan for Ministry of Research, Science and Technology to set clearer directions for research, creating a more stable funding environment, accelerate commercialisation of research; support long-term sustainable investment in research, science and technology; support high performers; support engagement of New Zealanders with research, science and technology; and skills for the future.
Norway White Paper on Commitment to Research
2005-10 Increase total R&D spending to 3% of GDP by 2010; raise Norway’s international position in terms of new technology skills and knowledge. Three structural areas will be given priority. Internationalisation is to constitute an overall perspective in research policy and basic research will remain a priority area. Emphasis will be given to quality enhancement rather than capacity building. Research in the field of mathematics, science and technology will be especially strengthened. The overnment will invest in research-based innovation and business development.
Poland Assumptions of the state’s scientific, science and technology and innovation policy until 2020
2005-20 Increase the effectiveness of public spending on R&D; Improve selection of science and technology development priorities; support more private R&D spending via systemic, organisational and legal changes; improve participation in the European Research Area and expand international co-operation.
Portugal Technological Plan of the new Government Programme
2006onwards
Stimulate innovation; increase the number of researchers in Portugal; increase investment in R&D in both the public and private sectors, stimulate scientific employment in both sectors; and consolidate scientific and technological culture.
Slovak Republic Strategy of the Competitiveness of the Slovak Republic to 2010 (a.k.a. The Lisbon Strategy for Slovakia)
2006-10 Support R&D and innovation, information society, human capital and education, business environment.
Spain Ingenio 2010 2005-10 Improve the management of existing S&T policies (the National R&D and Innovation Plan 2004-2007) and focus additional resources on strategic interventions to fulfil more ambitious objectives (2% in 2010).
Sweden Innovation Sweden 2005onwards
Make Sweden competitive through renewal by boosting the knowledge base for innovation; developing innovative trade and industry; fostering innovative public investment and innovative people.
Switzerland Promotion of Education, Research and Technology
2004-07 Update teaching structures; increase research activities; promote innovation; Intensify national and international co-operation; strengthen education, research and technology; foster entrepreneurship; enhance science-industry relationships; learn through international benchmarking.
United Kingdom Science and Innovation Investment Framework
2004-14 Retain and build world-class centres of excellence; improve responsiveness of publicly funded research; increase business investment in R&D; strengthen supplies of scientists, engineers and technologists; ensure sustainable and financially robust universities and public laboratories; boost public confidence in and awareness of scientific research.
United States American Competitiveness Initiative 2006onwards
Boost funding for innovation and competitiveness; foster development of human resources for science and technology.
Chile Science and Technology Bicentenary Program
2003-2010 Design a policy framework and appropriate innovation environment; Increase scientific capacity through public support (grants, subsidies, procurement) and foster public-private consortia.
China National Guidelines on a Medium- and Long-term Programme for Science and Technology Development
2006-2020 Enhance China’s science and technology, and innovation capabilities; use innovation as a tool for restructuring Chinese industry; shift growth modes from investment driven to innovation driven; build a conservation-minded and environmentally friendly society; and enhance independent innovation capabilities’ as a national priority strategy.
Russian Federation
Basic Principles of the Russian Federation Policy in the Field of Development of the Innovation System
2006-10 Maintain and develop the research environment, make sure that Russia plays a prominent role in global science, encourage and provide for co-operation between the scientific and business communities; create a competitive business environment by promoting transfer of pre-competitive technologies and by orienting research training towards industry’s needs for innovation.
South Africa National R&D Strategy Ongoing Promote innovation; human resources in science, engineering and technology (SET) and create an effective government S&T system.
Table 2.1. Revised or new national plans for science, technology and innovation policyin OECD countries and selected non-member economies, 2006 (cont.)
National plan Period covered Main objectives
OECD SCIENCE, TECHNOLOGY AND INDUSTRY OUTLOOK 2006 – ISBN 92-64-02848-X – © OECD 2006 53

2. NATIONAL DEVELOPMENTS IN SCIENCE, TECHNOLOGY AND INNOVATION POLICY
In 2004, Australia reinforced its 2001 programme, Backing Australia’s Ability (BAA),
with a new package, Backing Australia’s Ability – Building Our Future through Science and
Innovation. The extended plan includes financing of AUD 5.3 billion to extend the
government’s investment in BAA to a total of ten years (2001-02 to 2010-11), during which
a total of AUD 8.3 billion will be invested in science and innovation. By announcing the new
package two years before the initial funding for BAA ran out in 2005-06, the government
aimed to give researchers, universities and business assurance of continuity. Under the
expanded programme, funding will be maintained at approximately AUD 1 billion a year
from 2006-07 through 2010-11.
In 2005 the Austrian government launched Strategie 2010, which emphasises linkages
between actors in the innovation system. One of the three pillars of the latest strategy
document is improvement of networking and co-operation between science and industry.
To bridge identified gaps in the innovation process, the Research and Technology
Development (RTD) Council suggested further increases in co-operative research and
further development of the competence centre programme. Other pillars are improvement
of quality and developing excellence in all areas of RTD, and improvement of the efficiency
and effectiveness of the funding system. This strategy document supplements the
National Action Plan for Research and Innovation launched by Austria’s Research and
Technology Council, an advisory body of the federal government.
Following Germany’s elections in 2005, the new government (a coalition of Conservatives
and Social-Democrats) announced its intention to invest an additional EUR 6 billion in R&D up
until 2009. It will publish a comprehensive High-tech Strategy in the autumn of 2006. Ongoing
initiatives launched under the previous government in 2004 have sought to improve support
for public research. Among these are the Excellence Initiative and the Pact for Research and
Innovation. The former promotes excellence and top-level academic research at universities; it
provides funding for universities of EUR 1.9 billion until 2011, 75% of which will be financed by
the Ministry of Education and Research (BMBF) and the remainder by the Länder. It provides
support for three types of activities: i) establishment of university clusters of excellence;
ii) postgraduate studies; and iii) strengthening international top-level research in certain
disciplines at the university level. The goal of the Pact for Research and Innovation is to
strengthen institutional funding for non-university public research institutions that receive
funding from the federal government (e.g. Max Planck Society, Fraunhofer Society, Helmholtz
Centres, Leibniz Association) by 3% annually up until 2010. It seeks to provide planning
reliability for these institutions and is combined with structural reforms and more efforts to
increase quality of research and to transfer research results to application.
Finland’s new government emphasises strengthening expertise and entrepreneurship,
recognising that the keys to maintaining Finland’s competitiveness are promoting R&D,
raising the educational level of the population, pursuing a co-operative approach to income
policy, boosting productivity of the public sector and speeding the application of ICT. The
triennial review of the Science and Technology Policy Council, entitled Knowledge,
Innovation and Internationalisation, found that success in innovation is a key factor in the
success of both business enterprises and societies. In 2005 the Finnish government decided
to boost funding for Tekes (Finland’s agency for innovation) by EUR 30 million and for the
Academy of Finland by EUR 20 million in 2006-07. This represents an overall increase in
government R&D funding of EUR 83 million compared to 2005. Of this, the share of the
Academy is EUR 34 million and that of Tekes is EUR 30 million. Competitive now accounts
for 44% of the government’s total funding on R&D.
OECD SCIENCE, TECHNOLOGY AND INDUSTRY OUTLOOK 2006 – ISBN 92-64-02848-X – © OECD 200654

2. NATIONAL DEVELOPMENTS IN SCIENCE, TECHNOLOGY AND INNOVATION POLICY
The Slovak Republic also has a new Action Plan for Science, Research and Innovation
which aims to increase the amount of funds for science, research and innovation. This
should also help the Slovak Republic leverage funds for science and research from
European Union (EU) funding programmes (e.g. European Social Fund and European
Regional Development Fund) as well as from other international/multilateral sources, such
as the European Commission’s Framework Programmes for research, development and
demonstrations, financial tools of the EEC, the European Science Foundation, etc.). In
Greece, the government is putting greater emphasis on improving the quality of the public
research sector to better support innovation.
Following the change in government, the Spanish government launched a major
initiative, the INGENIO 2010 Programme. INGENIO 2010 complements traditional S&T
instruments (the National R&D and Innovation Plan 2004-2007) by allocating new public
funding to strategic initiatives. The expected amount for the next four years will be around
EUR 8 billion. INGENIO 2010 provides for focusing most of the budget increases on new
instruments. A main new activity is the CENIT (National Strategic Consortiums for
Technological Research) Programme, a public-private partnership initiative to promote and
finance long-term applied research developed in co-operation between firms and public
research centres. CENIT is an outcome of the OECD evaluation of Spain’s public-private
partnerships. A second important programme is CONSOLIDER, which seeks to increase
critical mass and excellence in public research centres by concentrating long-term funding
on the best teams; a specific programme addresses the biomedical areas (CIBER). Finally,
there is a complementary strategy of convergence in the development of the information
society (Plan Avanz).
The United Kingdom continues to invest in its Science and Innovation Investment
Framework 2004-2014. The framework sets out several goals. One is to maintain the
country’s overall ranking as second to the United States in research excellence and its
current lead over the rest of the OECD and to maintain the UK lead in productivity. It also
aims to retain and build up its world-class centres of research excellence – departments as
well as broadly based leading universities – to support growth in its share of internationally
mobile R&D investments and highly skilled people. Another goal is to improve the
responsiveness of the publicly funded research base to the needs of the economy and public
services by ensuring that the Research Councils’ programmes are more influenced by, and
delivered in partnership with, end users of research. It seeks to raise UK performance in
knowledge transfer and commercialisation from universities and public labs to the level of
the world’s leading benchmarks. The United Kingdom is also committed to providing a
strong supply of scientists, engineers and technologists by improving the quality of teaching,
raising student performance and boosting enrolments in S&T, including among ethnic
minorities, and the share of students wishing to pursue research careers.
In Japan, the Third Basic Plan for Science and Technology has two underlying tenets:
to promote science and technology to generate benefits for society and to foster human
resources and a competitive research environment. The plan defines six policy targets,
among which “Innovator Japan” aims to foster continual innovation. To meet this target,
the Japanese Council on Science and Technology has developed a “Comprehensive Strategy
for Creating Innovation” which involves building world-class centres of research,
promoting the use of new technologies, boosting support to industry and academia, and
enhancing innovation policies.
OECD SCIENCE, TECHNOLOGY AND INDUSTRY OUTLOOK 2006 – ISBN 92-64-02848-X – © OECD 2006 55

2. NATIONAL DEVELOPMENTS IN SCIENCE, TECHNOLOGY AND INNOVATION POLICY
Since early 2006 the United States has paid increased attention to the strength of
the US R&D enterprise and the effectiveness of national capabilities for innovation
and productivity growth. In January 2006, President Bush announced the American
Competitiveness Initiative (ACI), to respond to these issues. The budget for fiscal year 2007
includes USD 5.9 billion for the ACI: USD 1.3 billion in new federal funding and an
additional USD 4.6 billion in R&D tax incentives. Specifically, the ACI:
● Doubles, over ten years, funding for innovation-enabling research at key federal agencies
that support high-leverage fields in physical science and engineering: the National
Science Foundation, the Department of Energy’s Office of Science and the National
Institute for Standards and Technology at the Department of Commerce.
● Modernises the research and experimentation tax credit by making it permanent and
working with Congress to update its provisions to encourage additional private-sector
investment in innovation.
● Strengthens K-12 mathematics and science education by increasing understanding of
how students learn and applying that knowledge to train highly qualified teachers,
develop effective curricular materials and improve student learning.
● Reforms the workforce training system to offer training opportunities to some
800 000 workers annually, more than tripling the number under the current system.
Selecting S&T priority areas
In line with national science, technology and innovation strategies and plans,
governments have identified a number of key areas for concentrating and prioritising
support for research and innovation. Foresight exercises are often used to plan and set
priorities. In 2005, for example, the United Kingdom set up a Centre of Excellence in
Horizon Scanning to spot the implications of emerging science and technology and to
enable others to act on them. Iceland is also launching a new initiative for strategic
planning in health-related innovation. New Zealand’s Ministry of Research, Science and
Technology is collaborating with the science sector, users of science and public sector
purchasers of R&D to produce documents on science areas important to New Zealand and
the desired directions for these areas.
The funding for priority areas is often linked to the development of new funds, to the
development of instruments, to a shift in funding channels (e.g. a shift towards university-
based research centres) or towards a limited number of areas of excellence. As in previous
years, the life sciences/biotechnology, ICT, energy, and production technologies dominate.
Nanotechnology is also of growing importance in many countries.
In Canada, data for 2003-2004 show that federal funding, allocated by socio-economic
objectives, was concentrated in public health, industrial production and technology and
basic research with increases allocated towards energy and energy efficiency and the
environment. In Japan, the 3rd Basic Plan for Science and Technology highlights four
priority areas for R&D support, namely life sciences, information and communication
technologies, environmental sciences, and nanotechnology/materials. In addition, four
secondary areas are targeted: energy, manufacturing technology, social infrastructure and
space and oceans research.
At the same time, social issues remain important. For example, Switzerland’s
Innovation Promotion Agency (CTI) launched a new programme in 2004, Innovation for
Successful Ageing, to meet the challenges of an ageing population. This initiative targets
OECD SCIENCE, TECHNOLOGY AND INDUSTRY OUTLOOK 2006 – ISBN 92-64-02848-X – © OECD 200656

2. NATIONAL DEVELOPMENTS IN SCIENCE, TECHNOLOGY AND INNOVATION POLICY
R&D projects that lead to innovative solutions in terms of both products and services.
Furthermore, six centres of excellence in social sciences (National Centres of Competence
in Research, NCCRs) were launched, among them one for ageing. Each NCCR receives
between CHF 5 million and CHF 10 million for a four-year period. Many countries also seek
to promote safety and security in biotechnology-related innovations. Switzerland has
launched a National Research Programme (PNR) in the environment field (security of
genetically modified plants).
Another trend is greater focus on infrastructure for research and innovation.
Australia’s National Collaborative Research Infrastructure Strategy (NCRIS) is intended
to provide researchers with access to modern and relevant infrastructure, to link
infrastructure funding more directly to Australia’s national research priorities and to foster
greater research collaboration and the collaborative use of infrastructure. It builds on
investments made during the earlier Systemic Infrastructure Initiative and Major National
Research Facilities programme, which formed part of the 2001 Backing Australia’s Ability
research and innovation package. AUD 542 million is being provided under NCRIS
from 2005-06 to 2010-11.
Changing institutional structures for innovation policy
To increase the efficiency of national innovation systems, many countries have
modified their institutional structure for developing and implementing science,
technology and innovation policies. In some cases they have adopted new legislation to do
so. The main aims are to better co-ordinate policy making and implementation, reduce
bureaucracy in universities and public research organisations, strengthen links between
scientific research and socioeconomic concerns, and connect research policy better to
industrial development. Such reforms have led to changes in ministerial structures or
responsibilities, the establishment of inter-ministerial working groups, or the creation of
new advisory committees that involve stakeholders from outside government to provide
additional perspectives on policy needs.
New institutions and institutional structures
Changes in institutional structures for science, technology and innovation policy have
resulted in some cases from explicit attempts to consolidate responsibility for related
policy areas under a single institutional umbrella as a way to improve co-ordination or to
reflect the higher priority given to these fields. In other cases, they reflect changes in
government and a reshuffling of responsibilities.
Several countries have established new organisations to centralise or streamline
funding of R&D. The Austrian government set up a National Foundation for Research,
Technology and Development in 2004, which addresses medium- and long-term goals and
distributes additional funds of EUR 125 million annually. In 2005 Belgium’s federal
government created an Innovation Fund to help boost total R&D spending beyond the
amount financed at the regional level. In the same year France created the National Agency
for Research (Agence nationale de la recherche – ANR), which supports public research and
reinforces public/private partnerships. Its main mode of operation is selection and funding
of excellent proposals which are evaluated according to international standards. ANR also
wishes to internationalise public research via participation in EU Framework Programmes,
the future European Council for Research and collaboration with large research countries
outside the EU. The Spanish Parliament, in the New Government and Public Service
OECD SCIENCE, TECHNOLOGY AND INDUSTRY OUTLOOK 2006 – ISBN 92-64-02848-X – © OECD 2006 57

2. NATIONAL DEVELOPMENTS IN SCIENCE, TECHNOLOGY AND INNOVATION POLICY
Agencies Act, provided for the creation of various management agencies for funding
research, one a general purpose agency, associated with the Ministry of Education and
Science, and another focused on health and biomedicine under the Ministry of Health and
Consumer Affairs.
Other institutional structures have resulted from the consolidation of existing
government organisations or funding instruments. In 2005 Switzerland merged the former
Federal Office for Education and Science and the Swiss Science Agency into the State
Secretariat for Education and Research. The parliament further requested the integration
of all relevant parts of the administration dealing with education, science and innovation
policies into one federal department. The Department of Home Affairs and the Department
of Economy have been asked to study the question. Through new legislation the Slovak
Republic modified the role of the Research and Development Agency to make it a central
funding agency for basic and applied R&D. New legislation also centralises financial
support in the budgetary chapter of the Ministry of Education. The application of new
accounting rules in France has created a new macroeconomic framework that groups
together all government funds devoted to scientific and technological research. This new
budgetary framework is managed by the Mission for Research and Higher Education
(Mission de la Recherche et de l’Enseignement Supérieur) and replaces the previous budget for
R&D (Budget Civil de Recherche et développement ). In Denmark, in connection with a broader
restructuring of the Ministry of Science, Technology and Innovation, the department
responsible for developing and implementing innovation policy was merged with the
Danish Research Agency. In Mexico, under the 2002 Organic Law, the National Council for
Science and Technology (CONACYT) reports directly to the Mexican presidency. The Law
also established a General Council for Scientific Research and Development; created a
Inter-ministerial Committee for the Federal Budget for S&T. It also created the National
Conference for S&T with the participation of the 31 federal states and the federal district
and new funding mechanisms (Fondos Sectoriales and Fondos Mixtos).
Several countries have strengthened co-ordination among government ministries.
Sweden established a council for innovation policy in 2004 chaired by the industry
ministry. The mission for the council is to be a forum for discussion about guidelines about
innovation policy and strategies for economic growth and renewal. Greece is envisaging
the establishment of an Inter-ministerial Committee to ensure co-ordination between
Ministries, a National Council for the formulation of the Research and Technological
Development (RTD) policy and an Executive Agency for the implementation of the policy
measures. In July 2004, Japan’s Council for Science and Technology Policy (CSTP) founded
the Science Co-ordination Programme of Science and Technology Projects to eliminate
redundancy and reinforce collaboration. To improve co-ordination, the CSTP establishes
working groups and assign co-ordinators to develop a system for promoting effective R&D
on the basis of co-operation by the relevant ministries, agencies and institutions. Korea has
also established a co-ordination function within the prime minister’s office to improve
overall management of government R&D funding and innovation initiatives. Furthermore,
the Minister of Science and Technology has been promoted to the higher rank of Vice Prime
Minister in 2004. In addition, an independent Office of the Ministry for Science and
Technology Innovation, headed by a vice-ministerial level official, was established within
the Ministry of Science and Technology. The head of the Office will also serve as the
secretariat to the National Science and Technology Council (NSTC).
OECD SCIENCE, TECHNOLOGY AND INDUSTRY OUTLOOK 2006 – ISBN 92-64-02848-X – © OECD 200658

2. NATIONAL DEVELOPMENTS IN SCIENCE, TECHNOLOGY AND INNOVATION POLICY
Advisory councils
Advisory councils continue to play an important role in science, technology and
innovation policy making. In the 2004-06 period, a few countries reported new
developments in this area, to intensify horizontal co-operation and improve decision
making between ministries. In 2005, the Danish government set up a Globalisation
Council, chaired by the prime minister and composed of high-level representatives from
key sections of Danish society. Its task is to advise the government on a strategy for
Denmark in the global economy called Progress, Innovation and Cohesion. Finland’s
Science and Technology Policy Council has been strengthened, and the government has
established the Government Foresight Network. Iceland’s Science and Technology Policy
Council, which was established under the Office of the Prime Minister in 2003, reached the
end of its three-year term in 2006, and plans are in place for a further three-year cycle.1 In
the Slovak Republic, a Government Council for Science and Technology was established as
one of four permanent advisory bodies to the government. Its role is to discuss all
fundamental documentation on the subject of S&T support by the state, i.e. long-term view
of S&T policy, national programme of S&T development, reports on S&T status, proposals
for S&T programmes, and proposals for programmes to develop the S&T infrastructure.
In 2005, Canada established the new Council of Canadian Academies (CCA) with an
operational grant of CAD 30 million. The Council – managed by a Board of Governors drawn
from the three main academies as well as from Industry Canada – will employ expert
panels to perform independent assessments of key policy issues in S&T in order to better
inform public debate as well as to support policy making.
Strengthening public research and public research organisationsIn keeping with the strategies outlined in national plans for science, technology and
innovation and with the higher profile of innovation policy in many countries, efforts are
being made to strengthen public research. These entail increases in public expenditure on
R&D and changes in the governance of public research organisations to raise the quality
and relevance of their output and boost their efficiency.
Increasing public R&D expenditures
Consistent with the higher priority given to science, technology and innovation, OECD
countries have substantially increased public funding for R&D, despite persistent budget
constraints and overall reductions in government funding in some countries. Several
countries have established explicit targets for public expenditure on R&D and taken
preliminary steps to achieve them. Such targets reflect growing recognition of the linkages
among R&D, innovation and economic growth as well as increased efforts to use S&T policy
(e.g. R&D funding policy) to meet economic objectives.
In EU countries, much of the increase in public funding for R&D is driven by the
Barcelona objective of increasing R&D expenditures to 3% of GDP by 2010. Many countries
have established their own goals in this respect (Table 2.2). Luxembourg recently affirmed
a goal of boosting R&D spending to 2.4% of GDP by 2008 and to 3% by 2010. Hungary, Poland
and the Slovak Republic are using the Barcelona objective to boost support for innovation
at home. Many of these countries seek to leverage European structural funds to boost
investment for research and innovation.
OECD SCIENCE, TECHNOLOGY AND INDUSTRY OUTLOOK 2006 – ISBN 92-64-02848-X – © OECD 2006 59

2. NATIONAL DEVELOPMENTS IN SCIENCE, TECHNOLOGY AND INNOVATION POLICY
In Austria R&D spending has been rising faster than growth of GDP, and the latest
provisional estimates indicate that R&D expenditure will reach EUR 5.8 billion in 2005 (or
2.35% of GDP), an 8% increase over 2004. In May 2005 the Austrian government announced
another increase in public R&D spending of EUR 1 billion for the period 2005-10:
EUR 50 million was added to the 2005 budget and an additional EUR 75 million will be
spent in 2006. In 2006 the Danish government, in relation to its Progress, Innovation and
Coherence strategy, affirmed that publicly financed expenditure on R&D should reach 1%
of GDP by 2010. The government has announced its intention to invest an additional
EUR 1.5 billion in R&D for the period 2007-10. The overall objective is for public and private
companies and institutions to spend a total of at least 3% of GDP on R&D by 2010. In France,
in line with the new law on research (Loi de programme pour la recherche), spending for public-
sector civil research, which increased by EUR 1 billion to EUR 9.3 billion in 2005, will rise by
an additional EUR 1 billion in 2006 and another EUR 1 billion in 2007. Funds allocated to
ANR, the new National Research Agency, will rise from EUR 350 million in 2005 to
EUR 630 million in 2006 and up to EUR 910 million in 2007. In line with the Lisbon
objectives and the Barcelona target, the new law also foresees increasing public funding for
research and higher education from EUR 19 billion in 2004 to EUR 24 billion by 2010.
In Spain, the new socialist government has fulfilled an electoral commitment to
increase the R&D budgets by 25% annually in the next four years. Total government
budgets and appropriations for R&D rose from EUR 4.4 billion for 2004 to EUR 6.5 billion
for 2006. In Italy, the ratio of R&D to GDP has remained stable over the last few years at
around 1.1%. However, financial resources devoted to R&D by the government have
increased slightly to 7.9 billion (government and higher education sectors), after having
declined in the early 2000s. Most of the increase in government funding has been allocated
to universities, while public research agencies like CNR (National Research Centre) and
ENEA (Agency for New Technology, Energy and the Environment) have experienced a
decrease both in current and in constant terms due to the fact that the government
Table 2.2. National targets for R&D spending
Country Target Date Most recent
Austria 2.5% GDP 2005 2.3% GDP (2005)
Denmark 3% GDP 2010 2.5% (2004)
Finland 4% GDP 2011 3.5% (2006)
Germany 3.0% GDP 2010 2.5% GDP (2004)
Greece 1.5% of GDP 2010 0.6% GDP (2004)
Hungary OECD avg. 2006 0.9 (2004)
Ireland 2.5% GNP 2010 1.2% GDP (2004)
Japan 1% of GDP for the public sector 2010 3.13% GDP (2004)
Korea Double public investment 2007 2.9% GDP (2004)
Luxembourg 3.0% GDP 2010 1.8% GDP (2004)
Netherlands 3.0% GDP 2010 1.8% GDP (2004)
Norway 3.0% GDP 2010 1.6% GDP (2004)
Poland 2.2%-3.0% GDP 2010 0.6% GDP (2004)
Portugal Double public investment in R&D to 1% of GDP and triple business R&D
2010 0.8% GDP (2003)
Russia 2.0% GDP 2010 1.15% GDP (2004)
Spain 2.00% GDP 2010 1.1% GDP (2004)
United Kingdom 2.5% GDP 2014 1.9% GDP (2003)
China 2.5% GDP 2020 1.23% (2004)
Chinese Taipei 3% GDP 2006 2.56% (2004)
OECD SCIENCE, TECHNOLOGY AND INDUSTRY OUTLOOK 2006 – ISBN 92-64-02848-X – © OECD 200660
2. NATIONAL DEVELOPMENTS IN SCIENCE, TECHNOLOGY AND INNOVATION POLICY
required PROs to find additional funding from competitive public grants and from private
sources. In fact, the decrease in public funding has been partially offset by additional
income from private, public and foreign organisations. Financial resources granted to
universities through the yearly block grant (Fondo Finanziamento Ordinario) were increased
from EUR 6.16 billion in 2001 to EUR 6.93 billion in 2005. In Greece, R&D as a share of GDP
has slipped in 2004 (0.6% of GDP) but the government (intramural) expenditure on R&D
(GOVERD) increased in constant prices (USD PPP) by 4.3% between 1999 and 2003 while and
higher education expenditure for R&D (HERD) increased by 5% between 1999 and 2003.
Greece has adopted an R&D target of 1.5% of GDP by 2010, with 40% coming from the
business sector. To this end, the Ministry of Education recently launched two schemes to
support fundamental research in Universities: Herakleitos (funded at EUR 29 million) and
Pythagoras with a budget of EUR 36 million and a maximum amount of EUR 170 000 for the
first programme and EUR 130 000 for the second. Moreover, a third scheme, “Archimedes”,
is subsidising RTD activities in technological colleges.
The United Kingdom has set a target to increase R&D intensity from the current level
of 1.9% of GDP to 2.5% by 2014. In keeping with this objective, the Science and Innovation
Investment Framework announces the government’s intention to increase investments
in the public science base at least as fast as the trend growth rate of the economy
between 2004 and 2014 by increasing science spending as a proportion of GDP. The
framework calls for the public science budget to increase 5.8% a year (in real terms) during
the period from 2004-05 to 2007-08. For its part, the Finnish the government decided in
June 2006 to increase funding from 3.5% of GDP to 4% of GDP by 2011. Between 2005
and 2006, overall government R&D funding rose by EUR 83 million. In its May 2006 federal
budget, the Canadian government announced it intention to increase R&D-related
investments by over CAD 1.1 billion, mainly to improve postsecondary education
infrastructure, conditional on a 2005-2006 budget surplus in excess of CAD 2 billion. In
fiscal 2005-2006 federal support for S&T activities (R&D and related scientific activities)
was expected to total CAD 9.1 billion, similar to the level of support in 2004-2005 which
nevertheless represents a trend increase in comparison to the CAD 5.8 billion spent
in 1998-1999. As in previous years, increases in support for R&D are directed towards the
higher education sector, which accounts for 40% of federal R&D expenditures. In the 2006
budget, the government announced its intention to boost annual support to the three main
funding councils: the Canadian Institutes of Health Research (+CAD 17 million) and the
National Sciences and Engineering Research Council (+CAD 17 million) the Social Sciences
and Humanities Research Council (+CAD 46 million) as well as to the Canada Foundation
for Innovation (+CAD 20 million).
Not all countries anticipate rapid growth in public R&D expenditure. Belgium’s R&D
funding of the higher education and government sectors has remained quite stable over
the last years. There is however a growing tendency for scientific institutes either to break
away from their university or to cluster together outside traditional university borders.
Support for socioeconomic objectives also shows some stability while support for
industrial production and technology has increased. Interestingly, non-oriented research
and university research remain important. In contrast, government appropriations for
environment research have fallen. Iceland boasts the highest level of publicly funded R&D
(as a share of GDP) in the OECD area; while the share of public appropriations in the higher
education sector has decreased slightly the levels of other public financing have been
maintained. This indicates that changes in financing by source did not change much
OECD SCIENCE, TECHNOLOGY AND INDUSTRY OUTLOOK 2006 – ISBN 92-64-02848-X – © OECD 2006 61

2. NATIONAL DEVELOPMENTS IN SCIENCE, TECHNOLOGY AND INNOVATION POLICY
between 2001 and 2003. The shares of funding from abroad and private funding are quite
constant but expenditure increased notably during the period. As for financing of public
research, the trend is similar: there have been few changes in the sources of funding but an
increase in total financing.
Furthermore, pressures on government budgets are taking their toll on R&D funding in
some countries. In Switzerland, despite the projected annual increase of 4.1% foreseen in
the national plan, the budget in 2004 was cut by over CHF 24 million owing to a rise
in the 2003/04 budget deficit and further restrictions cannot be excluded. In the
United States, total federal funding for R&D continues to grow (in current dollars) but the
pace has slowed. With a major expansion of biomedical research funding now largely
completed, some 97% of the planned R&D funding increase in fiscal year (FY) 2006 is
allocated to human space exploration and development of defence weapons. In Japan, for
the first time in recent history, public spending on S&T fell between FY 2005 and FY 2006 as
a result of the decline in the overall government budget. Nevertheless the drop in public
spending on science and technology (0.8%) was smaller than that in the overall
government budget (3.3%) excluding social security expenditure.
Reforming the governance of public research
In addition to changing levels of funding, many countries have implemented
initiatives to reform the governance of public research organisations to increase their
efficiency and responsiveness to social needs. This has included steps to increase the
flexibility and/or accountability of universities and other public research organisations, for
example by granting them more autonomy, implementing performance measurement
systems or more in-depth evaluation, and adopting new funding structures. France’s new
law on research, for example, makes a number of important structural changes in the
research system and creates new tools to improve coherence in policy making. It calls for
better prioritising and evaluating research and innovation policies, strengthening
co-operation among the various actors (including between universities), improving the
attractiveness of research careers and deepening public/private partnerships. Similar
changes have occurred in other OECD countries.
Spain’s government has decided to change the Universities Act approved in 2001 in
order to increase universities’ autonomy and flexibility. It is also promoting the
transformation of the main public research institution (CSIC – Consejo Superior de
Investigaciones Científicas) into a performing research agency working under “contractual
agreements”. In Europe, the European Commission has launched a series of new measures
to support research and innovation in member states (Boxes 2.1 and 2.2).
In April 2004, Japan’s national university system became a national university
corporation, an independent entity. The aim of the reform was to increase universities’
autonomy. A new budgetary scheme was created which no longer sets specific limitations
on the use of the operating cost subsidy granted to universities. “Special education and
research expenses” are allocated, on a competitive basis, to activities that fit the
university’s characteristics. Furthermore, each national university must publish financial
statements, based on business accounting principles, in order to promote good
governance. In Denmark, one recommendation for its strategy in the global economy was
to integrate the government research institutions in the universities to increase synergies
in the Danish research system and strengthen the education of university graduates.
OECD SCIENCE, TECHNOLOGY AND INDUSTRY OUTLOOK 2006 – ISBN 92-64-02848-X – © OECD 200662

2. NATIONAL DEVELOPMENTS IN SCIENCE, TECHNOLOGY AND INNOVATION POLICY
Box 2.1. Research and innovation policies of the European Commission
Against the background of the renewal of the Lisbon Strategy, the European Commissionhas launched an integrated action plan to upgrade the conditions of research andinnovation in the 25 member states. The plan calls for initiatives in a range of areas fromframework conditions for research and innovation to the funding environment for publicand private research and incentives for innovation in the business sector, including inSMEs and in services. The Commission is also playing a greater role in supporting policyanalysis and development in the member states through tools such as the EC Trend Chart,the European Research Area (ERA) Watch and the recent PRO INNO initiative which aims tofoster transnational co-operation among national innovation agencies. Among the priorityareas identified by the Commission are:
Regulatory reform: The Commission will step up its dialogue with stakeholders toidentify regulatory barriers to research and innovation, particularly using EuropeanTechnology Platforms and Sectoral Innovation Panels to be set up under the EuropeINNOVA initiative. This will facilitate coherent development of technology and of theregulatory environment.
Boosting funding for public and private research and innovation: The Commission’s7th Framework Programme, pending acceptance by the EC parliament, will devote overEUR 50 billion to research over the next seven years. The Commission also encourages theuse of the Structural Funds and the Rural Development Fund for research and innovationby providing guidelines and assistance to member states and their regions.
Leveraging public procurement to foster research and innovation: The Commission willrelease a “Handbook on public procurement and research and innovation” to raiseawareness of the benefits of reorienting public procurement towards stimulating researchand innovation and the scope for this under Community public procurement law.
Intellectual property rights: The Commission will strengthen existing information andsupport services, such as the IPR Helpdesk, and encourage better co-operation amongrelevant national agencies. Community co-financing may be provided for joint projectsunder the PRO INNO initiative and for policy co-ordination under the RTD OMC-Netinitiative. The Commission will also launch a dialogue with industry and otherstakeholders in 2006 to determine what more can be done to provide European industrywith a sound IPR framework.
Human resources: The EC continues to promote the elimination of barriers to mobilityof researchers and policies to promote the attractiveness of research careers, notablythrough the European Research Area (ERA) mobility centres. In addition, the Commissionsupports and monitors the implementation of its recommendations on a EuropeanCharter for Researchers and on a Code of Conduct for the Recruitment of Researchers. TheEuropean Directive on the admission and residence of third-country researchers aims toenhance the attractiveness of Europe for foreign researchers by removing barriers.
Tax incentives: The Commission is promoting more effective, stable and concerted useof R&D tax incentives across the EU through guidance on their design and implementation.
University-industry partnerships: The Commission plans to establish voluntary EUguidelines to improve research collaboration and knowledge transfer between publicresearch organisations and industry. The guidelines will build on existing good practice (byboth member states and stakeholders) such as the Responsible Partnering Initiativelaunched by several European industrial and academic associations.
OECD SCIENCE, TECHNOLOGY AND INDUSTRY OUTLOOK 2006 – ISBN 92-64-02848-X – © OECD 2006 63

2. NATIONAL DEVELOPMENTS IN SCIENCE, TECHNOLOGY AND INNOVATION POLICY
A merger process has been launched and it is the government’s goal to see the process
completed within a few years.
In Italy, the government launched a new university reform with the goal of raising
the quality of university standards, in particular the reduction of the drop-out rate;
increasing the competitiveness of Italian universities both in the national and
international context; promoting co-operation with both private and public organisations;
and support to the international competitiveness in relation to the Lisbon strategy. Italy
was one of the first countries to achieve the Bologna standards and to introduce the
European credit system for university students. Furthermore, the government introduced
a clearer definition of the role of Public Research Organizations (PROs) in Italy while
assigning them greater autonomy than before. In particular, the new mission of PROs
requires that they respond more closely to socio-economic needs emerging from citizens
and firms. In order to achieve this goal, PROs receive a block grant intended to cover
basic expenses, and are encouraged to compete for additional funding from government
departments as well as private and public, national and international, sources. Portugal
has also made reforms to its system of funding universities. Under the 2006 budget, the
Ministry of Science, Technology and Higher Education has defined a new funding system
for higher education based on two main quality factors, namely the qualification of
Box 2.1. Research and innovation policies of the European Commission (cont.)
Innovation poles and clusters: The Commission invites member states to developregional and national policies for innovation clusters and poles, using the support offeredby the European Structural Funds. In addition, the Europe-INNOVA initiative willencourage networking between industrial cluster and the Regions of Knowledge initiativewill support transnational co-operation between research-driven clusters, bringingtogether regional authorities and development agencies, public research organisations,industry and other relevant stakeholders.
Source: European Commission, 2006.
Box 2.2. The European Research Council (ERC)
The European Research Council is expected to be launched in late 2006 under theEuropean Commission’s 7th Framework Programme. The ERC will act as a pan-Europeanfunding organisation to support the best science and scholarship. The European Council ofMinisters recently approved a EUR 7.5 billion budget for the ERC over the next seven years.The fundamental principle for all ERC activities will be that of stimulating investigatorinitiated frontier research across all fields of research, on the basis of excellence.
It is envisaged that the ERC will have two funding streams, first an initial ERC StartingIndependent Researcher Grant Scheme and, later, an ERC Advanced Investigator Grant scheme.
The funding will be competitively based and will operate on a “bottom-up” basis, across allresearch fields. An independent Scientific Council will assist the ERC in developing itsscientific strategy. It is expected that as the ERC develops, that the Scientific Council willbe in a position to evaluate the programme achievements, adjust mechanisms andprocedures and the overall strategy as needed.
Source: European Commission, 2006.
OECD SCIENCE, TECHNOLOGY AND INDUSTRY OUTLOOK 2006 – ISBN 92-64-02848-X – © OECD 200664

2. NATIONAL DEVELOPMENTS IN SCIENCE, TECHNOLOGY AND INNOVATION POLICY
teaching staff (measured by the fraction of PhD’s in the total number of teachers of each
institution) and the graduation rate (based on the number of univeristy bachelor degree
graduates and the number of masters and PhD degrees awarded). The funding formula,
which takes into account for differences at the level of institutions in terms of costs and
the teacher/student ratio, favours higher education institutions that show better teaching
performance and rewards institutions which are hiring more qualified teachers.
Balancing competitive and institutional funding mechanisms
In recent years, many countries have reported increases in project-based and
competitive funding. Iceland, for example, has increased the size of its competitive
funding programmes – the Research Fund and the Technology Development Fund – to 14%
of total government funding in 2003, up from 10% a few years earlier. Discussions are under
way on the possibility of introducing an element of competition into institutional funding
for universities and public research institutions. In Ireland, almost half of all government
funding was awarded competitively in 2004 (including 38% of the funding for research
performed in universities and public research institutes), up from 28% in 1998. The
creation and expansion of Science Foundation Ireland contributed to this increase.
Competitively awarded project funding has allowed research systems to encourage
competition between researchers and between research institutes and encouraged
institutions to attract external funding, in particular from industry. Nevertheless, many
countries report that institutional funding remains important. Germany has recently
boosted institutional support to its non-university public research organisations. In New
Zealand, which relies heavily on competitive funding, the Ministry of Research, Science and
Technology reformed the Non-specific Output Fund (NSOF) for research in Crown Research
Institutes (CRIs). Previously the NSOF provided CRIs with funding to complement periodic
contestable funding rounds. The NSOF has been renamed the Capability Fund with the
specific aim of strengthening institutional capabilities. This reform gives greater support to
the CRIs’ long-term research in key areas that underpin a diversity of research areas.
Facilitating interaction with industry
In many OECD countries, interaction between public research organisations and
industry is an area of continuing reform. All OECD countries seek to strengthen industry-
science relationships, and a key policy area is the management of IPR in public research
organisations. In recent years, countries have passed legislation requiring universities and
other public research organisations to transfer technology to the private sector and have
begun to put in place a regulatory framework to enable a variety of transactions, including
the creation of spin-off companies and licensing of IPR. Since the early 2000s, many OECD
countries have made legal and regulatory changes in the governance of public research in
order to stimulate technology transfer. In some cases, governments are making additional
funding available to support the efforts of universities and public laboratories to transfer
technology to industry. In addition, the emergence of European Technology Platforms
within the context of the EC’s Seventh Framework Programme for R&D is expected to
strengthen technology transfer between universities and industry in Europe.
In Japan, since FY 2004, IPR resulting from university research belongs to the
university. To aid in technology transfer, the Ministry of Education, Culture, Sports, Science
and Technology (MEXT) selected and supports 43 university offices which are responsible
for the strategic management of IPR. While each university is responsible for management
OECD SCIENCE, TECHNOLOGY AND INDUSTRY OUTLOOK 2006 – ISBN 92-64-02848-X – © OECD 2006 65

2. NATIONAL DEVELOPMENTS IN SCIENCE, TECHNOLOGY AND INNOVATION POLICY
and licensing of its IPR, the government has supported the establishment of 41 technology
licensing offices (TLOs). In addition, the Japan Society for the Promotion of Science (JSPS)
has sponsored transfer support centres which provide advice on patenting, feasibility
studies on technologies as well as financial support for applications for overseas patents.
In Italy, a recent government act of November 2005 concerning the “status” of
university researchers and professors grants both the MIUR and each individual university
the autonomy to develop collaborative research tools. Furthermore, according to a new law,
public sector researchers and technicians can spend a period of time working in private
firms keeping their salary and career path, and receiving an additional salary from the
company. In Finland, a new university law affects the overall definition of university tasks;
the so-called “third mission” – transferring technology to the private sector – was added to
universities’ basic tasks. Furthermore, a new Act on Inventions concerning universities’
intangible rights and innovations made in universities is under discussion in the Finnish
parliament. It is expected to be in force by the beginning of 2007. for its part, the Hungarian
Patent Office has developed guidelines to help universities develop policies and procedures
for protecting and exploiting IPRs.
Australia’s TechFast, a pilot programme to strengthen the transfer of intellectual
property from research institutions to small and medium-sized enterprises (SMEs), was
funded thanks to an election commitment. AUD 2.4 million is being provided to the
Australian Institute for Commercialisation for a 12-18 month pilot. New Zealand is piloting
a technology transfer programme on the model of the Danish Technology Institute. It is a
service programme designed to identify technical requirements of firms, especially SMEs,
and to provide suitable sources of technology and knowledge.
Promoting quality through assessment and institutional evaluation
A desire to increase the quality of public research and education, as well as to enhance
the efficiency of public research funding, has led to renewed emphasis on the evaluation
of public research organisations in many OECD countries. This has resulted in the
establishment of new institutions and requirements for quality assessment.
In Australia, the government is establishing Quality and Accessibility Frameworks for
Publicly Funded Research as part of the Backing Australia’s Ability – Building our Future
through Science and Innovation package. Two frameworks are being developed in
consultation with universities and publicly funded research agencies: i) a research quality
framework (RQF) to measure the quality and impact of research conducted in universities
and publicly funded research agencies, as well as its benefits for the wider community; and
ii) an accessibility framework to ensure that information about research and how to access
it is available to researchers and the wider community. The NCRIS and the quality and
accessibility frameworks aim to better inform major research infrastructure investments,
encourage research collaboration, strengthen monitoring of research quality and promote
accessibility of research information and resources.
In Austria, for example, the newly established Austrian Quality Assurance Agency
helps universities to implement evaluation cycles and develop evaluation standards for
research, education and training. Evaluation of the main funding body for academic
research (the FWF) serves as a basis for the current reform. Such evaluations are an integral
part of a new organisational framework for Austrian public universities, implemented
OECD SCIENCE, TECHNOLOGY AND INDUSTRY OUTLOOK 2006 – ISBN 92-64-02848-X – © OECD 200666

2. NATIONAL DEVELOPMENTS IN SCIENCE, TECHNOLOGY AND INNOVATION POLICY
in 2004, which gives them greater autonomy and requires more formal evaluation of their
activities and output (education and research).
Norway has introduced a new results-oriented funding system for higher education
institutions in budget year 2002. The main indicators for evaluation include: i) completed
student credits; ii) number of international exchange students (in and out); iii) funding
from research co-operation within the EU and from the Research Council of Norway;
iv) scientific publications (beginning in 2006) and v) number of doctoral candidates. As part
of the plan, the Norwegian Agency for Quality Assurance in Education (NOKUT) was
established on 1 January 2003 as an independent state body to monitor the quality of
Norway’s higher education institutions by means of accreditation and evaluation.
In Spain, one of the effects of the Universities Act approved in 2001 has been the
expansion of the university evaluation and quality assessment agencies promoted by
regional authorities. Up to now nine regional authorities have created their own evaluation
institutions. Additionally, in 2005, for the first time, a new system for monitoring and
evaluating the National R&D and Innovation Plan, called SISE, has been set up. Different
panels have analysed results and issued recommendations for the next round of calls.
In the United Kingdom, the government seeks to sustain research funding but is
requiring universities to demonstrate robust financial management in order to achieve
sustainable levels of research activity and investment.
Support for business R&D and innovationMore than ever, governments wish to raise business investment in R&D. Global
competition and the emergence of new players such as China and India have been
catalysts for countries to focus on boosting the innovative capacity of the business sector.
In the EU, another catalyst has been the EU’s target to raise R&D spending to 3% of GDP
by 2010, an objective to be achieved primarily by increasing business investments in R&D.
The integration of new members into the EU and slow economic growth among the larger
members have served as additional drivers of investment in business innovation, as firms
and governments seek to accelerate economic growth.
The general trend in public support to business innovation has been to recognise that
innovation is more than just R&D, especially in growing sectors like services. Consequently,
the main mechanisms for supporting business innovation remain competitive and merit-
based grant programmes, but tax incentives and support for firm creation and start-ups
and other programmes that focus on co-operation, networking and technology
commercialisation are gaining ground. Some countries have reformed laws governing IPR
in an effort to improve consistency with international laws or the ability of firms to manage
their intellectual property (Table 2.3).
Trends in direct public funding
Direct support to business innovation in the form of competitive grants or subsidised
or guaranteed loans remains important even if use of indirect schemes such as tax credits
has tended to increase. Recent reviews of innovation policy have prompted reforms in
countries such as Austria, Finland, the Netherlands, Norway and the United Kingdom.
Several countries with numerous small programmes have recently attempted to
streamline support and focus programmes on systemic failures in innovation, especially in
the area of networking and co-operation.
OECD SCIENCE, TECHNOLOGY AND INDUSTRY OUTLOOK 2006 – ISBN 92-64-02848-X – © OECD 2006 67

2. NATIONAL DEVELOPMENTS IN SCIENCE, TECHNOLOGY AND INNOVATION POLICY
The new Innovation Omnibus Law in the Netherlands calls for replacing the Ministry
of Economic Affairs’ policy instruments for research and innovation of by 2007-08. At
present the various instruments hamper tailor-made financing of programmes and
projects and limit interaction between programmes and projects. A single legal framework
will allow for more flexibility and synergy, thereby raising programme’s effectiveness. The
Innovation Omnibus Law ensures that financial support for programmes and projects
comes under European legal and financial (supporting) frameworks. It also eliminates the
distinction between programmes launched by knowledge institutes like TNO and
programmes launched by other consortia. Furthermore, innovation projects that do not fit
within a specific programme but fit the conditions of the Innovation Omnibus can be
supported as well.
Australia is boosting support to business innovation via the Commercial Ready
programme, an AUD 200 million per annum competitive grant programme to support
innovation and its commercialisation in SMEs. Sectoral support continues to be provided to
key industries (the Automotive Competitiveness and Investment Scheme, the Food
Industry Innovation Scheme and the Pharmaceuticals Partnership Programme for Business
R&D). Austria reported no major policy changes and continues to provide ERP (European
Recovery Programme) loans for R&D, emphasising critical technologies for the future,
notably biotechnology, environment and energy, and the aerospace supply chain (i.e.
components).
Under the United Kingdom’s framework strategy, the government provides incentives
to help increase business investment in R&D as a share of GDP from 1.25% towards the goal
of 1.7% over the decade and in this way to narrow the gap in business R&D intensity and
business innovation performance between the United Kingdom and leading EU and US
levels in individual sectors. The ten-year framework outlined a range of direct and indirect
(e.g. tax credits) measures to achieve these goals. Among these are the Collaborative
Research and Development and the Knowledge Transfer Networks programmes. Also a
high-level UK Science Forum has been created to bring together government, business
leaders and scientists in support of the country’s R&D and innovation goals.
Table 2.3. Changes in IPR-related policies and business innovation
Australia On 3 October 2005, IP Australia introduced a new service called the Trade Marks Assisted Filing Service which provides applicants with an up-front assessment of the suitability of their trademark for registration, i.e. prior to filing the application. This service was developed to assist private applicants with little knowledge of trademark law and those who have not obtained legal or professional advice regarding the suitability of their trademark. Australia’s current copyright laws include exceptions for fair dealing, which allow copyright material to be used for specific purposes provided the use is “fair” in the circumstances. These purposes are limited to research and study, criticism and review, reporting the news and provision of legal advice. The government is reviewing whether an exception or specific exceptions to copyright based on principles of “fair use” should be adopted to make copyright law more flexible and appropriate in the digital age as well as to promote and support mechanisms underpinning innovation, research and development activity.
Ireland In 2004 the government announced its intention to abolish stamp duty on the transfer of intellectual property. The Finance Bill 2004 provided for a stamp duty exemption for the sale, transfer or other disposition of intellectual property, including any patent, trademark, copyright, registered design, design right, invention, domain name, supplementary protection certificate or plant breeders’ rights. A new Commercial Division of the High Court has been set up to take cases entered after 12 January 2004. It is hoped that the formation of this specialist division will serve to strengthen the legal protection for IP in Ireland, as IP cases can now be brought before judges who have the opportunity to develop a specialist competence in commercial matters. It is contended that this strengthens mechanisms for enforcing IPR in Ireland and may enhance Ireland’s attractiveness as a location in which to register and from which to manage IP.
Switzerland The Swiss Parliament passed a partial revision of its patent law to conform to the EU directive on the legal protection of biotechnological inventions. The Federal Council launched a public discussion on the controversial issue of patenting biotechnology inventions with a broad consultation on the revision of the patent law at the beginning of 2002.
OECD SCIENCE, TECHNOLOGY AND INDUSTRY OUTLOOK 2006 – ISBN 92-64-02848-X – © OECD 200668

2. NATIONAL DEVELOPMENTS IN SCIENCE, TECHNOLOGY AND INNOVATION POLICY
Innovative approaches to tax incentives for R&D
R&D tax concessions are extensively used by OECD countries as an indirect way of
encouraging business R&D expenditures, on the understanding that R&D expenditures
have benefits that cannot be fully appropriated by the investing firms so that firms are
reluctant to invest in socially optimal levels of R&D. Recent years have seen the
introduction of new tax incentive schemes, as well as changes in existing schemes to make
them more generous (Table 2.4). While many existing tax incentive programmes reward
incremental increases in R&D investment (based on various formulas), a number of new
incentives are based on the level of R&D spending in a given year. Special tax incentives
have also been introduced for SMEs or specific technological sectors.
A number of OECD countries do not use specific tax incentives for R&D, including
some with high levels of business R&D investment. Germany does not use tax incentives to
stimulate corporate R&D investments, but improving the overall fiscal framework for
innovation is a major priority of the federal government. Recently changes have been
implemented to improve fiscal treatment of venture capital (taxation of carried interest of
venture capital fund investors). Finland, Iceland, Sweden and Switzerland have also
refrained from implementing R&D tax incentives, as has New Zealand.
Financing innovation
Venture capital (VC), including early-stage funding, remains a crucial support for
innovation. The capital market needs to be able to give businesses ready access to finance.
However, the financial sector is cautious about providing finance for innovative activities
and start-ups owing to the relatively high risks, the lack of a track record among start-ups
and/or high administration costs for small loans. Many countries have focused on
improving framework conditions for financing and improving their attractiveness for
investment, including VC flows. Nevertheless, countries maintain specific early stage
programmes remain due to the gaps in early stage financing.
In Austria, the Federal Ministry for Transport, Innovation and Technology (BMVIT)
supports new technology-based firms through the Seed Financing programme (operated by
Austria Wirtschaftsservice – AWS) and spin-offs through the AplusB – Academy plus
Business programme, operated by the Austrian Research Promotion Agency (FFG). The
former promotes high-technology start-ups before and during the establishment phase.
The criteria for allocations are novelty and technological intensity, development potential
and willingness to risk. The latter helps university researchers found new firms. The Seed
Financing programme provides mezzanine capital for high-growth technology-based SMEs
and guarantees for venture capital. As a sponsoring bank, the AWS – which covers all forms
of business-related support for economic operators – offers several programmes in this
context: subsidies, favourable interest rates on credits from the AWS-administered agency
fund ERP, assumption of liability, backing and advice (Eigenkapitalförderung, Protec 2002+,
etc.). AWS provides soft aid programmes, especially to SMEs, to support inward technology
transfer (protec TRANS and innovation management (protec INNO).
To better meet the need for capital in the market, the Netherlands Ministry of
Economic Affairs will introduce a single capital market package that groups existing
schemes together. This should lead to greater transparency, greater awareness among
entrepreneurs, lower acquisition and implementation costs, and shorter and simpler
procedures. The package will consist of finance for start-ups, growing enterprises,
OECD SCIENCE, TECHNOLOGY AND INDUSTRY OUTLOOK 2006 – ISBN 92-64-02848-X – © OECD 2006 69

2. NATIONAL DEVELOPMENTS IN SCIENCE, TECHNOLOGY AND INNOVATION POLICY
Table 2.4. Recent or proposed changes in R&D tax incentivesin OECD countries, 2006
Austria In 2005 the set of fiscal and other indirect measures to promote R&D investment was extended once more. Not only companies carrying out R&D but also companies contracting out R&D are eligible for an allowance/premium of 25% of R&D expenditure up to EUR 100 000 a year.
Australia Continuation of the R&D tax concessions introduced under Backing Australia’s Ability.
Belgium Belgium has introduced a series of measures designed to diminish salary costs of researchers and give firms an immediate reduction in research costs. Since the 1 October 2005, all companies collaborating with a European university or with one of the Belgian research institutes are entitled to keep 50% of the withholding tax the researchers are supposed to pay. There are two conditions: i) the researchers need to have a degree at a level higher than secondary school; and ii) the tax credit can apply only to taxes due for researchers involved in the collaboration and working on the collaborative project. Furthermore, since 1 January 2006, companies can (on top of the measure above) keep 50% of the withholding tax of all PhDs in science or medical sciences and civil engineers involved in company research. A third measure grants all personnel involved in research a 50% reduction in the withholding tax. Researchers must be young and participating firms must be small. The basic difference regarding these three measures is the category of people for which the company can claim to keep the withholding tax.
Canada In 2004 the refundable research and experimental development tax credit (SR&ED) was modified to allow SMEs that receive funding from common investors not acting as a group to be allowed to each claim the full tax credit (35% on the first CAD 2 million of qualifying expenditures).
France The Finance Bill of 2006 expands the R&D Tax Credit which is based in part on the level of expenditures as well as the incremental expenditure relative to previous years. The bill calls for a doubling of the volume component of the tax credit, from 5% to 10% of total R&D expenditure and a reduction in the incremental component, from 45% to 40%. This new system will be open to all firms. An additional tax credit is granted to offset twice the costs of the first year of employment of a PhD. The PhD graduate must be hired on an indefinite contract and the total staff of the firm must not fall. The law also provides for a higher ceiling for offsetting the costs of patent protection. The Finance Bill doubles the maximum amount that can be considered in this case, up to EUR 120 000 for patent protection expenditure as of 1 of January 2006. In addition, new firms will be able to obtain an immediate refund for the first five years, up from three years previously. This tax refund will be retroactive for all R&D expenditures from 1 January 2005.
Ireland In 2004, a tax credit for incremental R&D spending was introduced. A tax credit of 20% of such expenditure can be taken against corporate tax.
Italy The “Tecno-Tremonti” decree (passed in 2003) introduces, for the 2004 fiscal period, a tax exception for firms’ income corresponding to 10% of research and development labour costs (applied research), recorded among immaterial immobilisations. Furthermore, the decree grants fiscal benefits to Italian researchers resident in foreign countries to facilitate their return to Italy with the following five years. Earnings or payments to managers or researchers are taxable at a rate of 10% of the income and fully exempt from the Regional Tax for Productive Activities. This benefit is applicable in the tax period in which the researcher becomes resident, in fiscal terms, in Italy and in the two following periods.
Japan In FY 2003 the government modified its tax incentive system to establish a permanent credit of 8-10% for total R&D expenditures. At the same time, it created an additional 2% temporary credit as an aid in overcoming the depressed economic situation. In FY 2005, the government decided to abolish the additional 2% credit, but in order to maintain the incentive for companies to increase R&D expenditures, the current tax credit for R&D expenditures (which varies according to whether companies choose to apply it to their total R&D expenditures or only to the increase in those expenditures) will be integrated into a single credit based on total R&D expenditures. Moreover, as a temporary measure, for the next two years an additional credit equivalent to 5% of the amount exceeding “comparable R&D expenses”, defined as the average of R&D expenditures over the past three years, will be implemented.
Mexico The 2002 Organic Law of the CONACYT provides for a 30% tax credit for annual expenditure on R&D carried out by firms.
Netherlands The budget for the WBSO tax scheme (reduction of wage tax and social security contributions for companies with R&D personnel) was increased by another EUR 100 million between 2004 to 2006. In addition, there has been a reduction in the corporate tax rate.
Norway A tax deduction scheme, Skattefunn, was launched in 2002. The Research Council of Norway administers the scheme, but Innovation Norway and the tax authorities area also important players. The scheme generated tax subsidies for R&D expenditures in Norwegian companies amounting to NOK 1.2 billion in 2005. Currently the scheme is to be supplemented by measures that will extend the support to unpaid work in Skattefunn projects. The first measure, the Unpaid R&D Labour Scheme, will extend the aid to unpaid work performed in Skattefunn projects from 2005 onwards. Under the EEA agreement, this scheme has to be approved by the European Free Trade Association (EFTA) Surveillance Authority before it can enter into force. The second measure, the Compensation Scheme, is to provide retrospective subsidies for unpaid work performed in Skattefunn projects in the period 2002-04. As the latter scheme is of limited scope, it can be implemented without an EEA notification procedure. The Skattefunn scheme is currently subject to an independent evaluation. This will be finalised in 2007.
OECD SCIENCE, TECHNOLOGY AND INDUSTRY OUTLOOK 2006 – ISBN 92-64-02848-X – © OECD 200670

2. NATIONAL DEVELOPMENTS IN SCIENCE, TECHNOLOGY AND INNOVATION POLICY
innovative companies, company transfers and capital-intensive sectors (such as
shipbuilding and aircraft construction) and investment in emerging markets. It will offer
various financing options. The most suitable option will depend on the entrepreneur’s risk
profile. The aim is a capital package that is, as far as possible, cost-neutral for the
government. Spain has established a new fund of EUR 200 million, in the context of the
INGENIO 2010 Programme, to support a Society of Venture Capital to leverage a “guarantee”
for private venture funds.
In spite of the availability of private venture capital in the United Kingdom, the
government has taken several measures to promote equity investment, including the
Capital Gains Tax (CGT) business asset taper relief and the Enterprise Investment Scheme
and Venture Capital Trusts. In 2004, Canada set aside CAD 250 million for the Business
Development Bank (BDC) to fund new investments in venture capital. Based on the BDC
plan approved by the government, funding for early and late stage capital investments will
be divided between pre-seed and seed investment (CAD 100 million); specialized venture
funds (CAD 100 million) and direct investments in start-ups (CAD 50 million). When
combined with private sector investments, government funds are expected to lever over
CAD 1 billion in new venture activity.
Funding for new ventures and small firms
Dedicated support for start-ups and new ventures has recovered in many countries in line
with the rebound in venture capital markets. The Austrian Research Promotion Agency (FFG),
as the central organisation for promotion of applied research and innovation, is conducting a
start-up programme for support and financing for young (not more than three years old) and
high-technology SMEs. The AWS has a special funding programme, High-Tech Double Equity,
which doubles private equity or venture capital via a 100% guarantee for a bank loan.
In Germany, support for university spin-offs takes place through the EXIST programme
which was started in 1997 in the context of the launching of a competition for regional
networks. The programme also provides direct support to start-ups through the sub-
programme EXIST-Seed. In public-sector research establishments (PSREs), funds are provided
to promote the foundation of new enterprises from out of research institutions (EEF funds).
Poland On 29 July 2005, Poland introduced a number of tax incentives for research and development centres (defined as entrepreneurial entities that obtain at least 50% of their income from the sale of their R&D results). The new law enables entrepreneurs to deduct from their tax base expenditures on purchase of new technologies from research units. The deduction cannot exceed 50% for SMEs and 30% for non-SMEs. Another instrument is the shortening of the period for writing off completed experimental developments from 36 to 12 months. It is also possible to include expenditures on R&D in operational costs, regardless of the results of the R&D activities. Another new instrument is the 22% VAT rate for scientific research services. These services were previously exempted from VAT, thereby creating a barrier for co-operation between research units and enterprises, as the VAT could not be deducted.
Spain The proposal for fiscal reform includes corporate tax reductions of up to 40% of the Social Security cost of personnel working in R&D. Tax incentives for R&D and innovation investments will continue, with a 3% annual reduction, until 2012.
United Kingdom At the end of 2005, the government published a series of proposals to improve the R&D tax credit. Among these are: i) the creation of a dedicated R&D unit within HM Revenue and Customs, which administers the credits, to ensure that all SME tax credit claims are dealt with by specialist staff; ii) an R&D tax credit statement of practice for SMEs, detailing how SMEs can expect staff to deal with their claims; and iii) a package of legislative and operational simplifications, including expanding qualifying costs to include payments to clinical trial volunteers.
United States The American Competitiveness Initiative proposed to make permanent the research and experimentation tax credit.
Table 2.4. Recent or proposed changes in R&D tax incentivesin OECD countries, 2006 (cont.)
OECD SCIENCE, TECHNOLOGY AND INDUSTRY OUTLOOK 2006 – ISBN 92-64-02848-X – © OECD 2006 71

2. NATIONAL DEVELOPMENTS IN SCIENCE, TECHNOLOGY AND INNOVATION POLICY
The funding covered researchers’ labour costs for the first year of business operation during
which they formally remained part of the research organisation. This allowed the research
organisation to finance other R&D personnel to replace the entrepreneurial researchers.
Funding was also available for external consulting, qualification, market analysis and
patenting costs. The measure ended in 2004. Experience with the EEF funds was used to design
a comprehensive approach to start-up promotion from PSREs on an institutional level.
The Netherlands has several schemes exist creating new firms and SMEs. One is the
SME Credit Guarantee Decree (BBMKB), a general SME guarantee scheme. The Dutch Ministry
of Economic Affairs backs the loans. The risk premium amounts to 3% of the principal
amount. There are three guarantee sub-schemes in place: i) a 50% guarantee for bank
financing of SMEs (with a cap on the guarantee of EUR 1 million); ii) an 80% guarantee for
start-ups (less than EUR 100 000) which requires adjustment given decreasing demand due
to Basel II; iii) a two-thirds guarantee for innovative companies which is little used as yet.
The new Dutch TechnoPartner Seed Facility, introduced in 2005 as part of the overall
TechnoPartner programme to raise the number and quality of high-technology start-ups by
improving access to capital and providing specific information and coaching, seeks to
eliminate the equity gap frequently faced by Dutch high-technology start-ups. Drawing on
experience with related schemes in the United States and the United Kingdom, this facility
aims to stimulate small business investment companies (SBICs) established by private
parties. Own capital brought into the SBICs is matched by government loans.
Also in the Netherlands, a pilot scheme was implemented to address the limited
involvement of SMEs in R&D and innovation. It is modelled on the American Small
Business Innovation Research (SBIR) programme. With the help of this pilot programme,
the Ministry of Economic Affairs wants to learn how an SBIR-like programme can best be
implemented in the Netherlands.
In Norway, two seed capital schemes have been set up to support R&D and innovation in
SMEs and new technology-based firms. One is the nationwide seed capital scheme for
increasing the supply of seed capital to projects by encouraging investors through state
incentives and increasing commercialisation of research-based projects from universities. The
state provides a total of NOK 667 million in subordinated loans to investment companies. The
investment companies will be located in the university cities of Oslo, Bergen, Trondheim and
Stavanger. Up to NOK 167 million (25%) will be converted to grants through a fund for potential
losses. The state sets an interest rate of a 12-month average NIBOR +2 percentage points. There
are no geographical restrictions on where in Norway the investment companies may invest.
The second scheme is the regional seed capital scheme for assisted areas. Its aim is to increase
the supply of seed capital by encouraging investors and triggering development in lagging
regions. The state has allocated a total of NOK 700 million in subordinated loans to the
scheme. Up to NOK 175 million (25%) will be converted to grants through a loss fund.
Furthermore, the state set an interest rate of a 12-month average NIBOR +0.5 percentage point.
The state will also cover parts of the administrative costs of the fund.
The New Zealand government has established the Seed Co-Investment Fund to
overcome an identified barrier – a lack of capital – to the growth of new innovative
businesses, particularly in the technology sector. The fund is managed by the New Zealand
Venture Investment Fund and is designed to encourage business angel investment in such
firms. Government investment is up to 50% for each venture with the balance being
supplied by private equity investment.
OECD SCIENCE, TECHNOLOGY AND INDUSTRY OUTLOOK 2006 – ISBN 92-64-02848-X – © OECD 200672
2. NATIONAL DEVELOPMENTS IN SCIENCE, TECHNOLOGY AND INNOVATION POLICY
Preferential financial support for SMEs
In the United Kingdom, the Small Business Research Initiative (SBRI) aims to raise
productivity and business innovation by providing R&D contracts to technology-based small
businesses, thereby helping to ensure early revenue and a route to market for firms that
typically face barriers for financing their early development. In 2005 a mandatory target was
announced for departments participating in the initiative: at least 2.5% of the value of
departments’ and agencies’ extra-mural R&D contracts must now be placed with SMEs. This
requirement will encourage SMEs to enter bids for public-sector work, while maintaining value
for money and quality of procurement. The government will also work to embed innovation in
public-sector procurement policy. Support for individuals and SMEs has been in place since
June 2003 through the grant for research and development, which helps to cover the costs of
carrying out R&D on technologically innovative products and processes. The grants support
specific projects. A pilot scheme, the “grant for investigating an innovative idea”, also
continues to help SMEs obtain practical advice when exploring their ideas for innovative
products, services or processes. The grant provides 75% of the costs of outside experts.
Several new programmes provide financial support to SMEs. In the Netherlands, the
government is conducting a review of the BBMKB in the area of small loans (up to about
EUR 0.5 million). The review aims to examine banks’ increasingly standardised and
automated credit loan processes and should lead to a reduction in administrative costs and
greater use of the scheme by SMEs. Furthermore, the pilot scheme Innovation Vouchers
aims to increase the innovativeness of SMEs and their interaction with knowledge
institutes. The idea is that SMEs can use “innovation vouchers” (worth EUR 7 500 each) to
buy knowledge from knowledge institutes (or large R&D-intensive companies). The
knowledge supplier then gives the voucher to the Dutch innovation agency SenterNovem
for payment. The first round, held in September 2004, resulted in 100 vouchers and was
considered a success. A second round was started in March 2005 with 400 vouchers, which
were “sold out” on the first day. This new initiative was recommended by the Innovation
Platform and will be implemented for 2006-07.
In addition, a new Dutch guarantee facility for SMEs will be launched in early 2006
(pending EU approval on rules for state aid). This “growth facility” consists in general terms
of a 50% guarantee on venture capital in the form of shares and/or subordinate loans, up to
a maximum of EUR 5 million. The facility will be available to SMEs through banks and
participation companies. In terms of its structure, the facility resembles that of the BBMKB,
although there are a few important differences:
● More focus on venture capital instead of loan capital.
● The use of participation companies.
● A stronger focus on growth enterprises and company transfers.
● A higher upper limit (guarantee of EUR 2.5 million compared to EUR 1 million in the
BBMKB).
In 2006, Tekes in Finland introduced in 2006 an extensive new technology programme
to support start-ups in the services sector. The “Austria Wirtschaftsservice (AWS)” provides
“Business Angels Börse” as a service for technology-based SMEs. Similarly, Canada
expanded its Industrial Research Assistance Program to provide competitive technical
intelligence and mentoring services to SMEs via the Competitive Technology Intelligence
(CTI) initiative and the National Research Council’s Technology Partnership Facilities.
OECD SCIENCE, TECHNOLOGY AND INDUSTRY OUTLOOK 2006 – ISBN 92-64-02848-X – © OECD 2006 73

2. NATIONAL DEVELOPMENTS IN SCIENCE, TECHNOLOGY AND INNOVATION POLICY
Enhancing collaboration and networking among innovatorsIt is widely recognised that the effectiveness and efficiency of innovation systems are
determined to a considerable extent by the degree and quality of linkages and interactions
among various actors, including firms, universities, research institutes and government
agencies. Across the OECD there is continuing intensification of networking and
collaboration among innovation actors. Some programmes focus more on inter-firm
networking, others aim at boosting public/private co-operation, and some have a more
regional focus.
Industry-oriented networking
Industry-oriented networking programmes aim to link firms for pre-competitive
research that can benefit all participants. In Ireland, five pilot networks of companies in
key emerging technology areas, including wireless technology and power electronics, are
being developed. These are company-driven initiatives in which the firms involved agree
on themes of mutual interest within the technology area for further research and
subsequently select a research group or groups to engage actively with them to carry out
the work. It is intended that each network, facilitated by Enterprise Ireland, will run for two
to three years during which time strategically important research will be conducted.
Participants will benefit through knowledge and skills transfer. A key feature of each
network will be the strong relationship between the research group(s) and industry; this
will allow the direction of the research to be modified in line with emerging enterprise
needs.
Public/private co-operation
Considerable effort is being made to forge stronger links between researchers in the
public and private sectors, especially as innovation has become more science-based. Some
of these programmes take the form of funding for specific projects or sets of projects that
link researchers from different institutions. In the Netherlands, for example, the Ministries
of Education, Culture and Science and of Economic Affairs have decided on a so-called
Smart Mix programme. This is a fund of EUR 100 million annually, starting in 2007.
Consortia of research institutes, universities, corporations and other organisations can
apply for co-operative research and valorisation programmes. Every programme should be
directed to enhancing focus and mass in excellent research and valorisation of research, be
it in innovation/technology or in knowledge that is useful for solving societal issues.
Australia is also focusing on public-private partnerships through its Industry Co-operative
Innovation Programme (ICIP) a competitive grants programme launched in June 2005 to
support co-operative industry projects which relate to the development and use of new
technologies. The total value of the programme is AUD 25 million.
In addition, more formalised public/private partnerships (P/PPs) have been established
by OECD countries to establish an institutional framework for longer-term interaction
among public- and private-sector research organisations. The last two years have seen a
stronger focus on the contribution to commercial output and a number of existing P/PPs
have been expanded:
● Australia has committed an extra AUD 127.5 million for the Co-operative Research
Centres (CRC) which will have a stronger commercial focus.
OECD SCIENCE, TECHNOLOGY AND INDUSTRY OUTLOOK 2006 – ISBN 92-64-02848-X – © OECD 200674

2. NATIONAL DEVELOPMENTS IN SCIENCE, TECHNOLOGY AND INNOVATION POLICY
● Austria has established three competence centre programmes (Kplus, Kind, Knet) in the
last five years in which universities, research organisations and industrial firms carry
out pre-competitive research. After an evaluation of the existing programmes, a new
programme for competence centres is being designed and will start in the second half
of 2006.
● Canada’s Networks of Centres of Excellence (NCE), a 15 year old programme with a CAD
77.4 million budget, has launched a new initiative to support networking activities of
research groups that aim to develop partnerships with receptor communities.
● In 2005 the Italian government financed 19 research projects to promote a multi-
disciplinary and networking approach, involving public and private laboratories. These
laboratories are spread over the whole national territory and cover the following S&T
areas: new materials, biotechnology, and other relevant areas to sustain new high-tech
industries. The financing devoted to the projects was EUR 85 million.
● Ireland is working towards developing competence centres and other mechanisms to
foster greater collaborative activity. Existing competence centres such as the Tyndall
Institute in Cork and the National Diagnostics Centre in Galway are the subject of
renewed attention. Recent additions, including the National Centre for Bioprocessing
Research and Training and the National Digital Research Centre, will be supported and
monitored closely as they are built up.
● In Norway, the Norwegian Centres of Expertise (NCE) were established to strengthen
regional core competence by supporting and developing existing industry clusters in
their innovation and internationalisation efforts. Their main focus is promoting
networking of companies, academia and regional authorities. The programme had a
budget of NOK 36 million in 2006, which will finance the initiation of six regional NCE
projects.
● In Spain, the new CENIT initiative, under the umbrella of the INGENIO 2010 Programme,
has approved 16 P/PPs, with EUR 200 million of subsidies and mobilising an estimated
total investment of EUR 430 million, in biomedicine, ICT, environment, energy, transport,
agro-food and security.
● Sweden is also boosting support for P/PPs. Up to EUR 110 million (SEK 1 billion) has been
set aside to implement P/PPs for research and innovation in the IT, telecommunications,
pharmaceutical and biotechnology sectors as well as in the wood and forest sector,
the metal sector and the automotive sectors. The budget will increase by some
SEK 500 million until 2008.
Regional innovative clusters
Innovation is often found in geographically based clusters of firms, universities and
public research organisations which bring together producers and users, learners and
teachers. Since the early 1990s, many OECD countries have promoted a cluster-based
approach to innovation policy, and much of this work has a regional dimension. In
Australia, this focus has also fostered innovation activities at the level of the sub-national
government (Box 2.3). Regional development activities pursue a range of objectives: in
some cases they aim to improve the competitiveness of economically weaker regions, in
others they aim to strengthen the global competitiveness of national leaders. Multiple
objectives are also seen (Box 2.4).
OECD SCIENCE, TECHNOLOGY AND INDUSTRY OUTLOOK 2006 – ISBN 92-64-02848-X – © OECD 2006 75

2. NATIONAL DEVELOPMENTS IN SCIENCE, TECHNOLOGY AND INNOVATION POLICY
The Netherlands is an example of a country that is shifting the focus of its regional
development policies away from helping underdeveloped regions and towards backing
winners, i.e. regions with the capacity to develop into internationally competitive
innovation hot spots. The Ministry of Economic Affairs recently introduced a programme-
based package to improve performance in a number of areas by enhancing collaboration
among industry, knowledge institutes and government to create strong clusters and
networks. Through this package, businesses, knowledge institutions and other
government bodies can pool their resources to further develop potential strengths of the
Dutch economy, the core concepts being choice, demand management and customisation.
Box 2.3. S&T policy at state level in Australia
The Queensland government commenced a series of “Smart State” initiatives in 1998,including a ten-year Bioindustries Strategy to position Queensland as a regional hub forbiotechnology. The second stage, Smart Queensland: Smart State Strategy 2005-2015 waslaunched in 2005. Smart Queensland is backed by more than AUD 470 million over fouryears for initiatives across several portfolios, including around AUD 220 million allocatedto science, research and industry innovation activities (www.smartstate.qld.gov.au/).
Through the government’s AUD 620 million Science, Technology and InnovationInitiative, Victoria has made significant investments in innovation, including newscientific and communications infrastructure such as the Australian Synchrotron, centresof research excellence, programmes to help business become more innovative and projectsto maintain and build a skilled and creative workforce. In 2005, the Victorian governmentannounced the allocation of AUD 104 million over five years for an Energy TechnologyInnovation Strategy and a range of ICT enhancements (www.businessaccess.vic.gov.au/BUSVIC.1179884/LANDING/380673979/SEC10.html).
The New South Wales (NSW) Government Department of Primary Industries’ (DPI)Science and Research Programme receives a significant portion of the state’s investment ininnovation, science and research. It aims to provide strategic science that enhances thecompetitiveness, growth, sustainability and bio-security of NSW primary industries. It wasallocated AUD 110 million in the NSW 2005-06 budget. DPI seeks to co-ordinateinvestments in primary industry innovations and to foster alliances and co-operativeventures with universities, other states, the Australian government and industry bodies(www.nsw.gov.au/).
The South Australian government has developed a ten-year science, technology andinnovation plan (STI) in addition to the State’s Broadband and ICT strategy. Thegovernment supports the development of STI precincts across the state each of distinctcapability, including the precincts forming the Adelaide Innovation Constellation(www.innovation.sa.gov.au/).
The Western Australian government continues to implement its Innovate WA package,which is aimed at strengthening Western Australia’s long-term economic competitivenessby establishing Western Australia as a leader in innovation related activities(www.scienceandinnovation.dpc.wa.gov.au/).
In April 2004, Tasmania announced a Science and Technology Industry Plan, whichprovides a framework for the future development of the Tasmanian science andtechnology sector (www.development.tas.gov.au/).
Source: Country responses to STI policy questionnaire, 2006.
OECD SCIENCE, TECHNOLOGY AND INDUSTRY OUTLOOK 2006 – ISBN 92-64-02848-X – © OECD 200676

2. NATIONAL DEVELOPMENTS IN SCIENCE, TECHNOLOGY AND INNOVATION POLICY
The promotion of innovation through systemic aggregations at territorial level is one of
the main objectives of Italy’s S&T policy. In order to achieve this goal, the government has
recently adopted two initiatives: on the one hand, the creation of “joint labs” between
university or public research agencies and industry, in some specific area (new materials,
biotechnology, and other relevant areas to sustain new high-tech industries) and, on the
other hand, the creation of technological districts (TDs) in designated geographic locations.
Technological Districts (TDs) are territorial systems set up by the confluence of Universities,
PROs and enterprises (both large and SMEs) into an integrated organisation. The target is to
focus and to integrate the activities within specific research fields in order to develop new
technologies to the support of enterprises’ production. TDs are set up by agreements
between regional Governments and the Ministry of Research. Therefore, they must be viewed
as top-down political initiatives. Thus far 12 TDs have been created in fields ranging from
wireless technologies (in the Piemonte); advanced mechanics (Emilia Romagna);
nanotechnologies (Veneto) to molecular biotechnology (Friuli Venezia Giulia) and ICT and
security (Tuscany). The initial start-up costs of the TDs are financed by the MIUR.
France maintains a balanced system, with a clear effort to boost the country’s overall
competitiveness and its attractiveness to foreign R&D and talent. An Inter-ministerial
Committee identified and selected 15 competitive clusters (pôles de compétitivité) for
additional funding. The aim is to finance joint projects that exploit synergies among public
and private actors and generate wealth for the region and the country. Of the 15 clusters
selected, six are seen as world-class in terms of research and their industrial capabilities
will be strengthened (e.g. the Crolles microelectronics cluster near Grenoble, which will
focus on nanotechnologies, and the aeronautics cluster around Toulouse), and nine others
are viewed as having global potential. Funding for the clusters will come from the Ministry
of Economics and Finance, which will increase the resources already available from various
sources including the regional governments.
Iceland is also keen on strengthening regional knowledge centres, including some
regional universities, by linking them to national institutes in Reykjavík. Plans are afoot to
create a financial framework for large-scale investment in a cluster of closely linked
Box 2.4. The Europe INNOVA Initiative
The Europe INNOVA initiative, launched at the end of 2005, is a family of sectoralinnovation projects bringing together analysis and practical experience. It includes:
● A “Sectoral Innovation Watch” to assess innovation performance in different industrialsectors and identify drivers and challenges to innovation.
● Networks of industrial clusters across Europe, organised by sector, to identify andexchange good practice in related policies.
● Networks of innovation financing actors, organised by sector, to identify specific needsof companies in these sectors.
● Innovation panels composed of high-level experts of relevant industrial sectors,academies and policy makers to validate the findings of the project and draw policyrecommendations.
● A Europe INNOVA Forum consisting of a virtual platform where any initiative related toinnovation policy may network and exchange good practice.
Source: European Commission, 2005.
OECD SCIENCE, TECHNOLOGY AND INDUSTRY OUTLOOK 2006 – ISBN 92-64-02848-X – © OECD 2006 77

2. NATIONAL DEVELOPMENTS IN SCIENCE, TECHNOLOGY AND INNOVATION POLICY
research and educational institutions and high-technology industries in the knowledge
park of Vatnsmýrin in Reykjavík. At the same time, the country aims to develop knowledge
clusters outside the Reykjavík region to create job opportunities in other parts of the
country and stem the migration to its largest urban area.
Hungary has a number of initiatives that focus on regional innovation clusters. Among
these are the Regional Innovation Development Programme (Gábor Baross programme)
whose main components are a Regional Innovation Agency, founded in 2004 to provide
information to entrepreneurs, and the Innocheck programme, which offers innovation
support services for SMEs. In addition, the Focus Sector Innovation Programme (Oszkár
Asbóth programme) offers support for establishing R&D clusters at international level.
Specifically, it provides funding for innovation clusters in scientific areas that can
significantly influence Hungary’s technological and economic development and attract
qualified young researchers and return migration of expatriate Hungarian researchers. The
Péter Pázmány programme funds the establishment of Regional University Knowledge
Centres (RET) to co-operate with companies and other organisations dealing with research
and innovation and manage innovative R&D projects. The task of the knowledge centres is
to strengthen the existing industrial environment and boost employment of young as well
as senior researchers.
Japan has placed considerable emphasis on the development of regional innovation
clusters. A Knowledge Cluster Initiative was implemented in 18 areas of Japan. The
initiative supports a series of research institutes which collaborate with each other. The
university in the region is expected to play the role of a centre of excellence, anchoring the
regional cluster. In addition, the Japan Science and Technology Agency (JST), an
independent administrative institution under the MEXT, launched a Comprehensive
Support Programme for the Creation of Regional Innovation in 2006. This is a new funding
scheme for innovation in JST’s Innovation Plaza, in collaboration with local government.
In Denmark a new initiative for regional technology centres has been launched. It aims to
promote co-operation between companies, educational institutions, knowledge brokers and
other relevant parties within a certain geographical and technological area. Meanwhile Canada
is investing new money to renew the Atlantic Cluster Initiative (+CAD 100 million over five
years), which is open to foreign partners, and the Toronto-based Medical and Related Sciences
Centre (+CAD 20 million) as well as to the Toronto Regional Research Alliance (+CAD
2.25 million) which supports linkages and networking among existing clusters.
Globalisation of research and innovationGlobalisation of R&D continues to accelerate as trade and financial flows increase and
technological progress facilitates the exchange of ideas and the development of new
markets for goods and services. Capturing the benefits of globalisation requires firms and
countries to identify opportunities for innovation and production in overseas markets and
to ensure that their national innovation systems are attractive to foreign firms, foreign
talent and foreign research, including from the public sector. Most OECD countries have
put in place generic framework policies to facilitate inward foreign direct investment (FDI),
and most innovation policies have the effect of making a country’s national innovation
system more attractive to domestic and foreign investments.
As a first step towards developing policies to benefit from globalisation, a number of
national studies are under way to better understand the degree to which globalisation
OECD SCIENCE, TECHNOLOGY AND INDUSTRY OUTLOOK 2006 – ISBN 92-64-02848-X – © OECD 200678

2. NATIONAL DEVELOPMENTS IN SCIENCE, TECHNOLOGY AND INNOVATION POLICY
affects national innovation systems and overall economic performance. A recent study in
the Netherlands found that outward R&D of the main Dutch multinationals did not come
at the expense of their Dutch R&D activities. Nevertheless, the same study found that
Dutch inward R&D investments were far below the international average: only one-quarter
of total private R&D investment was made by foreign affiliates compared to an anticipated
50% in an open economy like the Netherlands. While the Netherlands performs quite well
in attracting FDI, the R&D component of inward FDI remains low, suggesting that efforts
should be made to improve the domestic climate for R&D.
To respond to this challenge, the Netherlands is seeking to improve its position on the
most important factors for locating R&D. These factors are: availability of highly skilled
(science and engineering) personnel, international accessibility, the quality of knowledge
institutions, the value added of foreign firms, the stock of private R&D capital, and
co-operation between firms and knowledge institutes. Three prominent tracks have been
identified: i) fostering human capital and research; ii) providing the right framework
conditions; and; iii) enabling strategic innovation areas. In addition to these generic policy
measures, more specific policy measures exist to improve the R&D investment climate.
First, the Dutch Foreign Investment Agency is responsible for attracting foreign countries
to the Netherlands. Second, the Netherlands Office for Science and Technology fulfils an
important matchmaking function by providing innovative Dutch companies with
information about relevant knowledge networks. Canada also focuses on strengthening its
own domestic capacity in S&T to attract funding and talent. For example, as of result of the
various initiatives undertaken by the Canada Foundation for Innovation (CFI), some
1 200 faculty and 2 000 postdoctoral fellows have been recruited from abroad to conduct
research in Canada.
Ireland is another country that has benefited greatly from the globalisation of R&D.
In 2003, foreign affiliates accounted for 72% of business expenditure on R&D in Ireland.
Ireland is developing as a major gateway to Europe for many of the world’s leading R&D-
performing companies from the United States. This success notwithstanding, the
promotion and marketing of Ireland as a location for enterprise R&D is being stepped up
significantly and a more forceful approach is being taken with the existing base of foreign
firms in Ireland to attract additional R&D functions. The Irish Development Agency is
bolstering its drive to ensure that firms in Ireland can maximise their involvement in
global activities. Ireland is also keen on maximising participation in international R&D
initiatives (e.g. Sixth and Seventh European Framework Programmes, European Space
Agency). Another goal is to leverage international technology transfer opportunities,
e.g. through the Innovation Relay Centre and efforts by Enterprise Ireland to identify
intellectual property generated by foreign firms considered non-strategic by them but of
use to Irish enterprise. Enterprise Ireland also helps domestic firms to access a range of
international research initiatives and sources of R&D expertise (e.g. the Fraunhofer Society
in Germany and visits to firms overseas).
Sweden also faces new challenges due to globalisation. Despite all-time-high profits,
large industrial groups with activities in Sweden seem reluctant to invest in R&D in
Sweden. Instead, the trend is towards slowly decreasing these activities. Insofar as some
50% of Sweden’s total business R&D is under foreign control, off-shoring of R&D outside
Sweden is a risk if the national climate for innovation is weak. For its part, the UK
government is actively promoting the United Kingdom as the partner of choice for
international R&D, and work on the facilitation of inward investment and outward trade by
OECD SCIENCE, TECHNOLOGY AND INDUSTRY OUTLOOK 2006 – ISBN 92-64-02848-X – © OECD 2006 79

2. NATIONAL DEVELOPMENTS IN SCIENCE, TECHNOLOGY AND INNOVATION POLICY
various government departments has progressed, in conjunction with the development of
the international strategy of the Global Science and Innovation Forum.
Globalisation of public research institutionsThe globalisation of universities and public research is also a priority for many countries.
In the EU, the creation of a European Research Area has fostered greater co-operation across
borders. However, the EU is not the only focus. Many EU countries have bilateral research
agreements with the United States, Russia, Israel, China, India to name a few. In Canada, the
main instrument to support the internationalisation of public research institutions is the
Natural Sciences and Engineering Council whose core programmes provide funding that
can be used to support collaboration between countries. Canada also supports the
internationalisation of specific research fields such genomics. Genome Canada’s International
Consortium Initiative funds unique projects that involve international collaboration and have
a significant impact on Canadian science. In Japan the Committee on International Affairs
under the Council for Science and Technology (an advisory board of the MEXT) is taking a
strategic approach to strengthening the funding system to support international activities in
S&T. A special focus is the establishment of S&T partnerships in Asia in line with the
emergence of the East Asian Community. To this end, Japan has set the following goals:
● Promote the exchange of research personnel and develop personnel in Asia to face
future challenges relating to common regional problems such as environmental issues,
natural disasters, and emerging/re-emerging infectious diseases.
● Create a platform for sharing S&T information and a multilayered framework to support
activity in the Asia community and build networks of research personnel.
● Invite outstanding foreign researchers to work abroad and reinforce efforts to send
young Japanese researchers abroad.
Moreover, the MEXT launched the Asia Science and Technology Strategic Co-operation
Promotion Programme in FY 2006, using special co-ordination funds for promoting science
and technology. This programme encourages Japanese research institutes and universities
to start collaborative R&D projects with their Asian counterparts. The Japan Science and
Technology Agency has increased its funding for international R&D collaboration, the
so-called Strategic Fund for Establishing the International Headquarters of Universities.
Evaluating innovation policiesIn many countries, evaluation has high and increasing priority as an essential part of
governance and policy implementation. The main motivation is to increase the efficiency and
effectiveness of innovation policy programmes. Efficiency and effectiveness are of increasing
importance owing to tight budgets for research and innovation policy programmes as a
consequence of general restrictions on government expenditures. Thus, science, technology
and innovation policy evaluation has come into play as investment in the area has increased,
with questions about value for money and achievement of intended outcomes.
A few countries explicitly make evaluation part of their national innovation policy
strategy. For example, the Science and Technology Policy Council of Iceland has
emphasised the need for evaluation of R&D to promote the effectiveness of its policies.
In the United Kingdom, there has been a shift towards greater emphasis on more
formal evaluation, with the introduction of the ten-year framework and annual reports on
progress and the introduction of the performance management system for the Research
OECD SCIENCE, TECHNOLOGY AND INDUSTRY OUTLOOK 2006 – ISBN 92-64-02848-X – © OECD 200680

2. NATIONAL DEVELOPMENTS IN SCIENCE, TECHNOLOGY AND INNOVATION POLICY
Councils. This is a reflection of the move in the overall public spending environment
towards a much greater emphasis on securing maximum value for money from public
spending and on performance against specified targets.
In early 2005, the Director of the White House Office of Science and Technology Policy
of the United States expressed the view that: i) better knowledge is needed of the complex
linkages between R&D investments and economic and other variables that lead to
innovation, competitiveness and social benefits; and ii) improved analytical tools and
metrics are needed for making sound national science policy decisions, even though such
high-level statements still await translation into specific new initiatives, policies and
resources. As a result, a series of initiatives have been taken to better elaborate what is
being called the science of science policy.
Many countries also recognise that it is difficult to measure the impacts and benefits
of government policy measures. Innovation systems are complex and dynamic, and
causality is difficult to establish. In addition, many benefits and impacts have long lead
times. Thus, various aspects should be taken into account, with a mix of qualitative and
quantitative approaches, and short-, medium- and long-term outcomes. Evaluation of R&D
programmes is also widely regarded as particularly challenging owing to the difficulty of
gauging the value of the immediate outputs and to the often long-term nature of the
outcomes that make research meaningful. In practice, R&D programme goals, priorities
and content vary widely across agencies, so that the specific approaches and methods
employed for evaluation must be appropriately tailored.
New initiatives/framework (e.g. legislation, guidelines, protocol) for evaluation
Australia plans to establish quality and accessibility frameworks for publicly funded
research to evaluate the impact of public research and to assess the extent to which
research results are accessible to the wider community. Iceland is discussing new
legislation for universities that stipulates regular internal and external evaluation and
provides relevant criteria. The Icelandic Ministry of Education recently set up a special
office for evaluation to follow up on the legislation and develop expertise in managing
systematic evaluation.
Since Japan’s National Guidelines for Evaluating Government Funded Research and
Development were drawn up in 2001, reform of the evaluation system has led to more
impartial and transparent approaches. New issues have emerged as evaluations are carried
out, such as encouraging researchers to be more challenging and reducing bureaucratic
formalities in the evaluation process. As a result, the Council for Science and Technology
Policy conducted a follow-up study and made suggestions, which led to the revised
national guidelines issued by the Cabinet Office in March 2005. In addition, the MEXT
issued its own Guidelines for Evaluation of Research and Development, which sets out the
basic approach for conducting evaluations of R&D that fall under the MEXT’s jurisdiction.
In the United States, the Government Performance and Results Act of 1993 (GPRA)
continues to provide the most encompassing policy framework for evaluation of federally
funded R&D programmes. GPRA requires all federal agencies – including those with R&D
programmes – to prepare periodic strategic plans, annual performance plans, and annual
performance assessments to aid the organisation in making progress towards its goals. In
addition, the Program Assessment Research Tool (PART) reviews of selected federal
programmes, initiated by the Office of Management and Budget in 2002 as part of the
OECD SCIENCE, TECHNOLOGY AND INDUSTRY OUTLOOK 2006 – ISBN 92-64-02848-X – © OECD 2006 81

2. NATIONAL DEVELOPMENTS IN SCIENCE, TECHNOLOGY AND INNOVATION POLICY
President’s Management Agenda, have generally worked to deepen the GPRA process and draw
federal agencies’ attention to programme evaluation. Both these formal frameworks and
informal professional organisations, such as the Washington Research Evaluation Network,
provide ways for the agencies to work together to compare experiences and best practices.
Under the new Act on Principles of Financing Science, Poland assesses public research
institutions every four years. The Committee on Research for the Development of Science
and the Committee on Research for the Development of the Economy together conduct the
evaluation in three areas: i) general activity of the institution; ii) output of scientific
activity; and iii) practical application of R&D results. These evaluation exercises attribute to
each public research institution a rating of 1 to 5 which is taken into account when
allocating financial resources.
In Hungary, a new government decree came into force in 2005 which defines the range
of public R&D programmes to be evaluated. The decree obliges the responsible bodies to
undertake an ex post evaluation of publicly financed RTD programmes exceeding the
threshold of HUF 1 billion. Evaluations are to be carried out by an independent national or
international evaluation body. There is no requirement for ex ante evaluations, but the
decree appears to anticipate a new procedure involving ex ante evaluation.
In Spain, the National R&D and Innovation Plan 2004-2007 approved the creation of
the SISE (the Monitoring and Evaluation System), making ex post evaluation of programmes
and the overall plan mandatory for the first time. Besides a framework for evaluation, some
countries are developing a framework for providing standardised information for
conducting evaluations. For example, the Platform for Research and Technology Policy
Evaluation of Austria has launched evaluation standards and runs a workshop programme
to spread good practices in evaluation.
South Africa is developing a framework for the strategic management system which
helps in the monitoring and evaluation of government investments in public-sector R&D
programmes. The system is designed to provide data and information on research inputs
and outputs as well as processes that can help the Science Councils and the government
departments conduct evaluations. A few countries have also established new evaluation
bodies during the past decade. For example, Austria’s Platform Research and Technology
Policy Evaluation of 1996 underlines the progress made in anchoring evaluation as learning
instrument within the policy-making process.
Greater focus on social and environmental impacts as well as economic benefits
The Australian government has asked the Productivity Commission to undertake a
major review of the economic social and environmental returns from public support for
science and innovation. It will explore the economic impact of public support on
Australia’s recent productivity performance, and impediments to the effective functioning
of Australia’s innovation system.
The Norwegian Ministry of Education and Research has asked the Research Council of
Norway to review research institutes in terms of foreign policy and social policy. Customer
satisfaction and international competitiveness of the institutes are assessed as well, along
with the quality of the institution, in order to propose areas for improvement. Since its
creation in 1999, the National Research Fund of Luxembourg undertakes systematic
evaluation of its programmes and of projects financed in the framework of its priority
themes, to judge scientific quality and socioeconomic impact at the national level. In
OECD SCIENCE, TECHNOLOGY AND INDUSTRY OUTLOOK 2006 – ISBN 92-64-02848-X – © OECD 200682

2. NATIONAL DEVELOPMENTS IN SCIENCE, TECHNOLOGY AND INNOVATION POLICY
Poland, one of the most important recent changes based on the new Act on Principles of
Financing Science encourages scientific units to channel their research activities towards
meeting social and economic needs.
In the United States, there has been increasing interest in better concepts and tools for
R&D portfolio management and in evaluation to help identify the most productive content
and configurations for critical research system components, such as peer review, grant-
making processes, electronic research administration, public-private partnerships, IPR and
technology transfer. Key drivers are increased scrutiny of R&D programmes by funding
sources and increased competition for funding among research performers.
More international organisations or experts are participating in countries’ evaluations
External evaluations are being commissioned to independent bodies, in some cases
international organisations with certified competence in the appropriate methodologies. For
example, Iceland has a long history of OECD evaluations of its science and technology policies
and educational systems. It recently asked the OECD to evaluate its innovation policy mix. The
most recent collaboration with the OECD was a review of the higher education system. The
OECD’s recommendations are taken into consideration in the policy discussion, and are often
implemented following a socio-political process and associated debate. Ireland also has recent
experience of collaboration with the OECD. A comprehensive review of higher education in
Ireland has been recently completed, which covers: i) the role of higher education; ii) strategic
management and structure; iii) teaching and learning; iv) research and development;
v) investment and financing; and vi) international competitiveness.
Luxembourg also asked the OECD to undertake an evaluation of its national policy
measures for research and innovation with a particular focus on public research and its
partnership with the private sector. This study is the first evaluation by an independent
international organisation on such issues since the creation of public research in
Luxembourg in 1987. It serves as an ex post evaluation of policies to identify weaknesses in
the current system and ways to improve them and make the system more efficient in order
to face recent challenges. In Portugal, the OECD, the European Network for Quality
Assessment and the European University Association have recently been involved in
evaluation of the higher education sector. Reorganisation of accreditation and quality
assurance is currently under way. All research centres are periodically evaluated by
international peer review panels. An external evaluation by an international panel is also
under way for the state laboratories.
Under France’s new law on research activities, an agency will be charged with
evaluating research and higher education. It will be responsible for evaluating research
activities in public institutes and will also comment on personnel management and
operating conditions. The agency will also participate in the formation of the doctoral
curriculum. It will consist of international experts from the European Union and beyond as
well as domestic experts. Belgium also calls on foreign experts when it evaluates its public
research organisations. Greece actively seeks an international point of view when carrying
out evaluations. In most cases of ex ante evaluation, the proposals are assessed by groups
of national and international experts, none of whom is involved in the elaboration and/or
implementation of the project in any way; their names are kept confidential. A current
trend in Greece is to increase the number of foreign experts in peer reviews and panels. In
some cases, an evaluation is carried out exclusively by foreign experts. Besides the
evaluation process itself, development of an evaluation framework also involves
OECD SCIENCE, TECHNOLOGY AND INDUSTRY OUTLOOK 2006 – ISBN 92-64-02848-X – © OECD 2006 83

2. NATIONAL DEVELOPMENTS IN SCIENCE, TECHNOLOGY AND INNOVATION POLICY
consultation with international experts. The development of the Research Quality
Framework of Australia is being overseen by an Expert Advisory Group comprising
international and national representatives from universities, publicly funded research
agencies and industry groups.
In Spain the OECD evaluation of P/PPs for innovation has been very influential in
reshaping the country’s innovation policies. Spain has also been involved in peer review
exercises promoted by the European Commission, involving experts and foreign policy
makers. At the end of 2005, the National Research Centre CSIC, in the context of the
preparation of its Strategic Plan (2006-09), was evaluated by 23 international panels (with
145 foreign experts) nominated by European Molecular Biology Organisation (EMBO) and
the European Science Foundation (ESF).
Balancing ex ante and ex post evaluation
Many countries’ policy reviews show a good balance among ex ante, ongoing and ex
post evaluations. Greece, for example, has a formal ex ante, ongoing and ex post evaluation
for all measures and schemes. At the ex ante level, the evaluation aims to show evidence of
the relevance of the scheme to the programme’s objectives, the feasibility of the actions
and the appropriateness of specific objectives and the budget allocation. It is based on a set
of well-defined criteria of scientific quality and impact, in accordance with each
programme’s objectives. The overall procedure for ex ante evaluation, including the criteria
and their relative weight, are described in detail in the “Application Guide” which is made
public together with the launch of the call for proposals for each programme. The results
of the ex ante evaluation are published at the end. The proposal leader can access the
experts’ remarks that justify the ranking of the proposal.
Ex post evaluations in Greece have an indirect effect on policies and planning. The
evaluation report is used to document arguments for the continuation, the modification or
the cancellation of the programme. The evaluator is usually a consulting company,
selected by the managing authority of the programme, with prior experience or using
external experts. For the ex post evaluation, the evaluator has to identify the programme’s
achievements relative to the initial objectives, the appropriateness of the methodology, the
mechanisms of delivering the programme and accessibility to funding by the target
population. A questionnaire is sent to participants to collect information on what was
achieved, the obstacles or other weaknesses of the scheme, and the opportunities created.
In Iceland, ex ante evaluation of R&D project proposals has been a regular activity for
decades. Ex ante evaluation of bottom-up proposals for new research programmes was
tried for the first time in 2005 with considerable success and was well received by the
science community. This resulted in a new programme on health-related genomics and
nanotechnology. Ex post evaluation of programmes and organisations/institutions has been
performed irregularly. It has been included in the explicit policy agenda of the Science and
Technology Policy Council.
The Netherlands’ ministerial decree of 2002 on performance measurement and
evaluation sets a number of requirements for policy evaluation including the obligation to
consider an ex ante evaluation when starting to think about a new instrument. The Act on
Principles of Financing Science and the Regulation on Criteria and Procedures for Granting
and Settling Funds for Science have established a comprehensive evaluation system for
public-sector R&D projects. Evaluations of applications ex ante are prepared by committees
OECD SCIENCE, TECHNOLOGY AND INDUSTRY OUTLOOK 2006 – ISBN 92-64-02848-X – © OECD 200684

2. NATIONAL DEVELOPMENTS IN SCIENCE, TECHNOLOGY AND INNOVATION POLICY
of the Council for Science, the Committee on Research for the Development of Science or
the Committee on Research for the Development of the Economy on the basis of an
appraisal by a working, specialised or interdisciplinary group (consisting of members of the
committees as well as competent external experts). Before the committees examine
applications for financing of research projects and goal-oriented projects, reviewers
appointed by members of the committees examine the applications. The outcome of the
evaluation prepared by the committees should contain a proposal for the amount of
financing for a particular project or a proposal to reject the application for funding. The
evaluation exercise should rank the applications.
Mid-term and ex post evaluations in the Netherlands are conducted on the basis of
annual and final reports submitted by the scientific entity that conducts the project. The
Minister of Science is responsible for the evaluations and controls the legality,
purposefulness and reliability of the spending of science funds. This control is exercised on
the basis of reports, accounts and other documents, or directly at the location of the
scientific entity by an audit team appointed by the minister. In Poland, every National
Development Plan (NDP) and Sectoral Operational Programme should undergo an ex ante,
ongoing, mid-term and ex post evaluation. Ex ante evaluation covers in particular
an assessment of the socioeconomic environment for the assistance in terms of
competitiveness and innovativeness of the economy, the labour market, including
job opportunities for both sexes, the condition of the natural environment and
the macroeconomic impact. The on going, mid-term and ex post evaluations cover
efficiency of spending of financial resources, effectiveness in reaching the objectives,
impact on socioeconomic situation, including employment, and functioning of the means
of implementation.
In Spain, the new Monitoring and Evaluation System (SISE), involving more than
300 experts and reviewers organised in 35 commissions, along with a national commission
(COSEP), has issued reports and guidelines for reviewing the Spanish R&D and Innovation
Plan, which suggest a change from an approach based on sectoral and scientific areas to
one based more on instruments to cope with problems. It recommended starting the
planning process for the new National Plan with a clearer statement of the National
Strategy for Science and Technology before starting to build the different programmes.
Feeding evaluation results into policy making
In most cases, results of evaluations feed back to the policy making level and are
reflected in budget allocations. The Australian Research Quality Framework is designed to
provide a basis for distributing public research resources to areas of excellence and public
benefit. In France, the financial law (LOLF: la Loi organique relative aux lois de finance), which
took effect on 1 August 2001, provides a framework in which evaluations can be reflected
in budget allocations even though the LOLF principles are not easy to apply to R&D.
Germany also has such a feedback mechanism. Results of evaluations of public research
organisations are used when deciding budget allocations and reshaping research priorities.
In some cases, evaluation may lead to closing down or downgrading institutes. Ireland
recently undertook a review of science and technology expenditure, on the basis of three
evaluations of specific aspects of the science and technology programmes, which were
united to assess the overall level of activities and outputs. In 2005, Italy’s Committee for
R&D Steering and Evaluation evaluated 17 329 “research products” (books and book
chapters, articles in journals, patents and other research results). The aim was to examine
OECD SCIENCE, TECHNOLOGY AND INDUSTRY OUTLOOK 2006 – ISBN 92-64-02848-X – © OECD 2006 85

2. NATIONAL DEVELOPMENTS IN SCIENCE, TECHNOLOGY AND INNOVATION POLICY
scientific and technical results in the light of the resources spent by research organisations.
The exercise is expected to have an impact on allocation of resources, but the extent and
duration of the implementation of this mechanism is still under the discussion. In parallel,
the National Committee for Evaluation of the University System is carrying out a similar
exercise focusing on the results of university education.
Evaluation can have an effect not only on individual programmes or institutions but
also on the establishment of new policy schemes. For example, the Research Council of
Norway reviewed national research institutes and proposed a new system for the core
funding of the institutes.
Enhancing the transparency/visibility of evaluation
The Australian government publishes most evaluations and, where appropriate, its
responses, on relevant websites. In Japan, a new university evaluation system requires all
national, public and private universities to undergo periodic evaluation. Under this system,
the evaluation organisations publicly disclose evaluation results, this encourages
universities to undergo evaluation and make improvements based on the evaluation
results. A number of workshops and meetings between evaluators and policy makers have
proved a good medium for transferring evaluation results into policy making in Germany.
Outlook: future challengesAs this chapter indicates, OECD countries continue to reform their science and
technology policies to improve the efficiency of their national innovation systems and
respond to perceived changes in the global economy. While much has been achieved in
recent years, continued reforms will be needed as new challenges emerge. Efforts
to improve the management of public science and to better link the public and private
sectors to facilitate commercialisation of research results will continue to be important.
Experience to date can provide important lessons and an opportunity for sharing of good
practice.
For many countries, the dominant future challenge will be responding to globalisation.
Several countries perceive that their technological leadership in areas of importance to
their economies is threatened by new challengers. At the same time, it is recognised that
globalisation offers opportunities to exploit foreign capabilities and knowledge networks.
Countries will need not only to improve the competitiveness of national innovation
systems in a global environment, but to learn better how to tap into global innovation
networks to achieve national benefits.
Promoting innovation in services will also remain a challenge. It has become clear that
services are a growing source of employment and economic growth, yet their patterns of
innovation differ from those of manufacturing, in particular in the importance of
intellectual assets to business value2. Many countries aim to develop innovation policies to
stimulate services sector innovation and several programmes have been introduced.
Further efforts will be needed to broaden the concept of innovation and better understand
how firms manage and exploit various intellectual assets (e.g. knowledge and human
capital) to generate economic growth.
Many countries also identify a need for better means of anticipating future innovation
needs. While foresight has become more common across OECD countries, many still lack
formal methods for identifying future trends and linking them to decision making and
OECD SCIENCE, TECHNOLOGY AND INDUSTRY OUTLOOK 2006 – ISBN 92-64-02848-X – © OECD 200686

2. NATIONAL DEVELOPMENTS IN SCIENCE, TECHNOLOGY AND INNOVATION POLICY
innovation strategies. As noted by Finland, a diverse set of social challenges that can be
addressed by innovation remain: the ageing of society, developing effective services,
energy needs, etc. Improved techniques and institutional structures for addressing these
needs will be required in many countries.
Another challenge is the maintenance of adequate framework conditions and
the fostering of the competitiveness of industry via innovation. An unfavourable
macroeconomic environment and low domestic demand, as well as barriers to innovation
financing for early-stage ventures, can impede innovation. Not only are efforts required to
better understand these phenomena, but actions will need to be taken to intensify
horizontal co-operation and decision making between ministries whose policies affect
innovation performance. New types of inter-ministerial councils and advisory bodies may
be important to such efforts.
Human resource issues will continue to loom large. For countries like Iceland, a key
challenge is to improve the quality of higher education while meeting increasing demand
for education in science and engineering. Human resources in S&T, in particular the weak
performance of students leaving the education system, are also a concern in Germany,
especially in light of expected shortages of highly qualified labour and the continued out-
migration of top scientists, mainly to the United States. Like other countries, Switzerland
is concerned about how to guarantee high-quality education as well as long-term support
of public research and to better position the Swiss system successfully in a European and
international context in order to remain attractive for human capital and to generate high
value added jobs. In the Netherlands, HRST also remains a key challenge, notably
the growing shortage of knowledge workers, particularly scientists, technologists and
R&D workers.
Developments in some non-OECD member economies (Box 2.5) suggest that these
countries are catching up (albeit from a low level) with OECD countries in terms of
resources for and outputs of R&D, and that policy systems are becoming more complex,
and more closely aligned with those of OECD member countries. It is noteworthy that
many of the policy issues in focus in non-member countries are shared with member
countries. These include the broad need to integrate R&D policy more closely with
innovation measures, to improve public-private interactions, to reform PROs, and to focus
on the nature and impacts of research training and human resources. These developments
suggest a degree of convergence between member and non-member countries. Given that
the absolute levels of S&T activity in some non-member countries are already significantly
higher than many OECD member countries, non-member countries are likely to become
much more important players in the global R&D picture. If current trends in the growth of
R&D inputs and patent outputs continue some non-member countries are likely to
overtake some of the larger OECD countries. In terms of both trends in investment and
policies, it is clear that the strong domestic growth of key non-OECD member countries is
changing the global structure of science, technology and innovation development.
OECD SCIENCE, TECHNOLOGY AND INDUSTRY OUTLOOK 2006 – ISBN 92-64-02848-X – © OECD 2006 87

2. NATIONAL DEVELOPMENTS IN SCIENCE, TECHNOLOGY AND INNOVATION POLICY
Box 2.5. S&T Policy Developments in selected non-member economies
Strategic planning and institutional reform
Several non-OECD economies, including Chile, China, Chinese Taipei, South Africa andRussia have recently adopted long term strategic plans for the development in S&T andinnovation. China’s plan to become a major innovation economy by 2020 is probably themost significant as it will launch a series of reforms and strategic projects to makeresearch and innovation the motor of its new economic development strategy. In 2004,Russia revised its Federal Goal-oriented R&D Programme in Priority Areas of S&TDevelopment for 2002-2006 (FGRDP) to give a greater emphasis on commercialisation of R&D.That same year saw the creation of the Ministry of Education and Science, responsible bothpolicy development and implementation in S&T and education, as well as enforcingintellectual property protection. In 2005, South Africa announced a three-tier governancemodel for all Science, Engineering and Technology (SET) institutions in the country, withthe objective of encouraging better co-ordination of SET activities and expenditure. In thenew model, the Department for Science and Technology (DST) is charged to lead theportfolio of cross-cutting S&T activities, including large scale, broad scope S&T platformscarried out either by government laboratories or by universities. The responsibilityregarding priority setting for technology development and funding has been transferredfrom Department of Trade and Industry to DST.
Support to research and innovation
One of the challenges facing non-OECD economies has been the weak level ofinvestments in private R&D and innovation. Like OECD countries, non-member economiesuse a range of measures to support R&D and innovation ranging from matching funds, taxincentives and procurement policy as well as measures to improve intellectual propertyprotection. The China Development Bank for example provides subsidised loans for firmsin high-tech export industries. In Chinese Taipei, matching funds of up to 50% are used tostimulate private R&D. In Chile, co-funding ratios range from 50% for business innovationprojects, to 60% for commercially innovative projects, and to 80% for foresightcommercially viable projects (within a ceiling of 500 million pesos). China’s new taxincentive policy will allow firms to use 150% its spending on R&D to offset income taxes.The part that is not offset in any current year can be carried forward for the next five years.The new policy also encourages companies to accelerate depreciation of research-relatedfacilities. Moreover, local governments in the national high-tech industry developmentzones are authorised to offer two-year exemptions of income tax to newly founded high-tech enterprises, which could also apply for the favourable income tax rate at 15% in thefollowing two years. The South African government announced that companies will beallowed a 150% tax deduction on their R&D expenditure as opposed to the current levelof 100%.
Protection of intellectual property rights
China is also trying to improve IPR protection to enhance innovation. Recent measuresin this area include reducing the time required to examine patent applications, creatingplatforms for IPR information service, and providing funding help enterprises to apply forpatents both domestically and abroad. In South Africa, the government has modified thelegal framework governing IP protection in order to keep up with international IPprotection regimes. In addition, South Africa has developed a Draft Bill for the protectionof Indigenous Knowledge Systems that recognises the importance of protecting itsbiological resources and indigenous knowledge which are seen as a comparativeadvantage.
OECD SCIENCE, TECHNOLOGY AND INDUSTRY OUTLOOK 2006 – ISBN 92-64-02848-X – © OECD 200688
2. NATIONAL DEVELOPMENTS IN SCIENCE, TECHNOLOGY AND INNOVATION POLICY
Box 2.5. S&T Policy Developments in selected non-member economies (cont.)
Support of venture capital
China encourages relevant central government departments and local governments tocreate seed funding for venture capital and to facilitate the flow of funds available toventure capital funds. It now also allows insurance and investment companies to invest inventure capital funds and it provides tax incentives for venture capital enterprises thatfocus on supporting start-ups in high and new technology industries. By early 2005, Russiahad 64 specialised funds and 27 management companies, with an aggregate volume offunds of USD 4.1 billion. Seventy-one companies obtained financing for their projectsbetween 2003 and 2004; the average amount of investment was USD 6.3 million. Whileforeign investors account for 89% of all venture investments, government programmes forcreating new venture funds, including regional ones, are being implemented with funds tobe provided by the federal, regional government and private sector.
Stimulating entrepreneurship and supporting innovative SMEs
In China, new measures for supporting SMEs focus on expanding the scale of funding forinnovation; promoting education on innovation-related subjects in junior and middleschools, and creating visiting positions in universities and research organisations formanagers and specialists from SMEs. Russia has several measures in place to promote SMEs,including a funding programme which supported 100 start-ups within the Russian Academyof Sciences in 2004. The government has also worked on improving venture capital fundsand the creation of technology transfer centres and Science Parks to improve the conditionsfor innovative SMEs. The Russian Private Equity and Venture Capital Association (RPEVCA) isdeveloping a system of coaching centres for venture businesses consisting of basic coachingcentres, district-level coaching centres and agents’ networks operating in different regions.Furthermore, an international training, scientific and consulting centre for innovationentrepreneurship is to be created at Moscow State University in 2006. Meanwhile theRussian government is also looking at ways to improve the country’s system of informationprovision for innovation activities, and to provide assistance on technology transfer betweenthe different players of Russia’s innovation system.
In South Africa, the government launched the GODISA Trust to provide technology andbusiness development support to SMEs. The Tshumisano Trust acts as an implementationagency for the Technology Station Programme, by providing technical and financial supportto Technology Stations, which in turn provides technical support to SMEs in the form oftechnology solutions, services and training. Furthermore, the Industrial DevelopmentCorporation (IDC) has introduced several financing mechanisms to support small business.
Enhancing collaboration and networking among innovators
A persistent legacy of the pre-reform S&T systems in Russia and China is that linksbetween the R&D institutions and universities, on the one hand, and business andindustry, on the other, remain underdeveloped. China has adopted two new strategies topromote stronger industry-science relationships. The first is the creation of NationalEngineering Laboratories or Industry Engineering Centres in large Chinese enterprises inco-operation with the competence and resources from universities and researchorganisations. The objective is to build an open innovation system with these labs andcentres as main R&D hubs to provide key generic technologies of the whole Chineseindustry, facilitating knowledge flows and technology transfer among firms, and theinteractions among firms, universities and PROs. The second strategy is to encourage firmsto co-operate with universities and PROs through forming various kinds of technology andinnovation alliances. These include allowing researchers from universities and PROs towork part-time in R&D enterprises, setting up practice and training sites for college andvocational school students, and postdoctoral workstations in firms.
OECD SCIENCE, TECHNOLOGY AND INDUSTRY OUTLOOK 2006 – ISBN 92-64-02848-X – © OECD 2006 89

2. NATIONAL DEVELOPMENTS IN SCIENCE, TECHNOLOGY AND INNOVATION POLICY
Notes
1. Iceland’s Science and Technology Policy Council is composed of five ministers and 14 additionalmembers. Its two subcommittees, the Science Committee and the Technology Committee, eachdraw nine members from the 14 non-ministerial members of the Council. The resulting overlap offour members on the two committees is intended to ensure a strong policy link between scienceand socioeconomic concerns, including support to innovation.
2. See European Commission (2006), Reporting intellectual capital to augment Research,Development and Innovation in SMEs – Report to the Commission of the High Level Expert Groupon RICARDIS, Luxembourg: Office for Official Publications of the European Communities.
Box 2.5. S&T Policy Developments in selected non-member economies (cont.)
In Russia, the number of Technology Transfer Centres (TTC) at academic institutions hasincreased from only six in 2003 to about 70 in the first half of 2006. In particular, theMinistry of Education and Sciences initiated and supported the opening of TTCs in certainkey institutions. In Chile, a Business Technological Research Consortia has set up ninetechnological consortia, which bring together firms and public and private researchinstitutes. These consortia are designed to encourage firms, universities and othertechnological organisations to form stable alliances or consortia capable of solvingsignificant technological challenges for the country’s medium-term competitiveness anddevelopment. Furthermore, in 2005 four Co-operative Research and DevelopmentConsortia will be added to the existing five Regional Research Centres in the areas ofmining, aquiculture and ecosystems to strengthen scientific production throughout thecountry and to expand regional R&D activity.
Source: STI Outlook questionnaire, 2006.
OECD SCIENCE, TECHNOLOGY AND INDUSTRY OUTLOOK 2006 – ISBN 92-64-02848-X – © OECD 200690

ISBN 92-64-02848-X
OECD Science, Technology and Industry Outlook 2006
© OECD 2006
Chapter 3
Human Resources in Scienceand Technology: Trends and Policies
This chapter analyses recent trends and policies in human resources in science andtechnology (HRST). It examines in particular the supply of new S&T graduates,including those at PhD level and the demand for researchers and other categories ofHRST. In addition it discusses the contribution of women in S&T and foreignresearchers to national supply. Finally, it reviews recent policy developments inmember and selected non-member countries to boost supplies but also to makeresearch careers more attractive.
91

3. HUMAN RESOURCES IN SCIENCE AND TECHNOLOGY: TRENDS AND POLICIES
IntroductionThe economic growth of OECD countries increasingly relies on innovation. From a
policy perspective, innovation requires a well-trained and mobile workforce. Governments
have long supported investments in education because of the large social returns
associated with it. While innovation requires a broad range of skills – technical,
communication, management and entrepreneurial to name a few – globalisation and the
associated technological upgrading of employment in OECD countries have raised demand
for individuals with basic skills in science and mathematics and for specialists with
advanced training in science and technology. The expansion of public and private
investment in R&D in the OECD area referred to in Chapter 1 of this volume has further
boosted demand for human resources in science and technology (HRST). However, a
number of OECD countries are concerned that the supply is waning and will not suffice to
meet demand or even to replace retiring faculty and researchers – 40% to 55% of university
faculty in Austria, France and Sweden are over 55 years of age (Enders and Musselin, 2005).
Furthermore, countries are concerned about the effectiveness and quality of education,
especially in areas like mathematics and science, which can affect student performance
and thus the ability of OECD countries to compete against one another and against
emerging economies like Brazil, China and India (Box 3.1). This chapter draws on a number
of activities under way in the OECD’s Committee for Scientific and Technological Policy
(CSTP) to analyse the main trends in supply and demand as well as the policies being
implemented in OECD countries to ensure a sufficient supply of HRST to meet future
demand and to contribute to research and innovation and thus to enhanced
competitiveness and economic growth.
Demand for human resources in science and technology is strong and broad-basedPeople working in HRST occupations represent 25% to 35% of total employment in
OECD countries. Demand for HRST has never been higher: employment in HRST
occupations grew twice as fast as overall employment between 1995 and 2004 in most
OECD countries (Figure 3.1). The number of researchers in OECD countries, a subset of
HRST, grew from 5.8 researchers per 1 000 employees in 1995 to 6.9 per 1 000 in 2002.
Demand for researchers is greater in Japan (10.4 researchers per 1 000 labour force) and the
United States (9.6 per 1 000) than in the European Union-25 (5.8 per 1 000). Many countries
expect demand to increase. The US Bureau of Labor Statistics estimates that scientific and
engineering (S&E) occupations will increase by 26% in 2012 compared to 15% for all other
occupations. Since the 1980s, growth in S&E occupations in the United States has been
more than four times the growth rate of all other occupations (NSF, 2006). In Europe, efforts
to increase spending on R&D and innovation will further increase demand for HRST.
According to EU estimates, meeting the EU Lisbon/Barcelona targets of 3% of GDP for R&D
will require another 700 000 researchers. Japan, Korea, the United States, Canada and non-
OECD countries are also boosting R&D and the training of S&T graduates and researchers.
OECD SCIENCE, TECHNOLOGY AND INDUSTRY OUTLOOK 2006 – ISBN 92-64-02848-X – © OECD 200692

3. HUMAN RESOURCES IN SCIENCE AND TECHNOLOGY: TRENDS AND POLICIES
Demand for HRST and for researchers in particular includes both business sector and
public sector demand. In both sectors, the nature of demand is evolving, with implications
for supply-side education and training strategies. In firms, for example, competition,
globalisation and shorter product life cycles are changing how business R&D is conducted.
During the 1990s many larger R&D-performing companies such as IBM, Lucent and
Siemens reorganised their R&D activities and downsized corporate labs. The development
of information and communication technologies (ICT) and the Internet ushered in an era
in which research could be compartmentalised and carried out in multiple locations
(OECD, 2005c). Firms are also increasingly adopting a more networked, open model of
innovation that relies on partnerships and alliances as well as the acquisition of needed
technology from a variety of sources, including public research institutions and new
technology-based firms. Meanwhile, the expansion of the services sector and with it,
knowledge-intensive services (e.g. banking, financial and business services) has also
Figure 3.1. Demand for HRST and researchers, 2004
1. OECD estimates.2. National estimates.3. Overestimated. Also include holders of engineering degrees and graduates of vocational polytechnics.
Source: OECD calculations from the EU labour force survey and national sources, 2005.OECD, MSTI Database, June 2006.
StatLink: http://dx.doi.org/10.1787/158771127381
0 10 20 30 40 50%
Percentageof women
SwedenLuxembourgSwitzerland
Netherlands (2003)Denmark
Australia (2001)Norway
GermanyFinland
United States (2002)Iceland
BelgiumCzech Republic
AustriaFrance
ItalyCanada (2002)
Slovak RepublicEU15
EU191
EU25Hungary
New Zealand (2001)United Kingdom
PolandSpain
IrelandGreece
PortugalKorea (2002)
Japan (2002)2
51.1 45.1 45.9 49.1 52.0 52.2 50.2 50.7 53.9 56.8 54.8 48.4 52.1 46.1 47.0 46.3 53.8 60.6 48.3 49.7 49.9 60.7 53.6 47.2 61.0 47.3 51.7 47.7 50.0 35.4 45.5
Professionals Technicians
Mexico (2003)Turkey (2002)
Italy (2003)Czech RepublicPortugal (2003)
Greece (2003)Hungary
Poland (2003)Slovak Republic
Netherlands (2003)Ireland
United Kingdom (1998)Spain
EU25 (2003)Austria (2002)
Luxembourg (2003)Switzerland
OECD (2002)Korea
Germany (2003)Canada (2002)France (2003)
Australia (2002)Belgium
New Zealand (2003)Norway (2003)
DenmarkUnited States (2002)
JapanSweden (2003)
Finland3
0 2 4 6 8 10 12 14 16 18 20
Of which: business enterprise researchers
Others
HRST occupations, 2004 As a percentage of total employment
Researchers, 2004 Per thousand employment
OECD SCIENCE, TECHNOLOGY AND INDUSTRY OUTLOOK 2006 – ISBN 92-64-02848-X – © OECD 2006 93
3. HUMAN RESOURCES IN SCIENCE AND TECHNOLOGY: TRENDS AND POLICIES
increased demand for graduates with science and technology backgrounds. Demand for
human resources in science and technology has never been higher in OECD countries but
it is also more broadly based. One implication is that the education of students in science
and technology should prepare graduates for careers outside the traditional paths of
academia and large R&D firms. Another qualitative change in demand concerns the
content of research work and the rising importance of combining technical skills with
“soft” skills such as communication and management skills.
The other key component of demand for researchers is the public research sector, which
comprises higher education institutions and government research institutes/laboratories.
More than half of the research population works in the public sector in many OECD
countries. The number of faculty positions in most countries continues to rise to meet
demand generated by ever larger numbers of university students. However, part of this
growth has taken the form of a rise in adjunct or non-tenured temporary positions. The shift
in public research funding towards a more complex funding system involving competitive
and project-based funding as well as funding from business exerts pressure on public
research to adopt more flexible employment arrangements. According to the US Department
of Education (2003), the total number of postsecondary faculty grew by 26% from 1995
through 2003, but the number of full-time faculty on the tenure track increased by only 17%.
During the same period, the number of part-time faculty increased by 43%. In some fields
this trend is even more pronounced. The number of life scientists aged 35 or under in the
United States increased from 11 715 in 1993 to 18 671 in 2001 (59%). However, the number of
life scientists 35 or under in “tenure track” positions has remained almost constant, rising
from 1 212 to 1 294 (7%). Thus the probability of holding a tenure track position in the United
States for a young person trained in biomedical life sciences has declined in recent years:
from 10.3% to 6.9% (Stephan, 2005). Indeed, in most OECD countries it appears that two
models of academic careers are developing; the first an “insider” model protected by tenure
or indefinite contracts and based on early selection and a second model based on successive
temporary contracts with selection occurring later in the career path.
Supply of S&T graduates continues to expand, but less so in some countries
Since 1998, the numbers of S&E graduates have continued to increase (Figure 3.2).
Overall, about 23% of the 5.9 million degrees granted at universities in the OECD area were
granted in science and engineering. There are however important differences among
countries in terms of starting points as well as the evolution of the supply of S&T
graduates; some countries tend to have more engineering graduates and others tend to
have more science graduates (Figure 3.3). This generally reflects the industrial structure,
historical academic traditions, but also higher education and research funding policies.
Finland for example saw the number of engineering graduates rise from 5 478 in 1998 to
7 393 in 2002. During that period the number of science graduates rose from 1 816 to 2 549.
The United States has seen stronger growth in the number of science graduates
(158 321 in 2003) than in the number of engineering graduates 120 121 in 2003).
Similarly, the United Kingdom has experienced a strong rise in science graduates but a
weaker rise (even an absolute decline) in engineering graduates. Among catching-up
economies, Ireland has had stronger growth in science than in engineering graduates. To
some extent the relatively greater growth in science graduates is fuelled in part by the rise in
public funding for research, especially in biotechnology and health. In contrast, both France
and Germany have seen a drop in the number of science graduates although the number of
OECD SCIENCE, TECHNOLOGY AND INDUSTRY OUTLOOK 2006 – ISBN 92-64-02848-X – © OECD 200694

3. HUMAN RESOURCES IN SCIENCE AND TECHNOLOGY: TRENDS AND POLICIES
engineering graduates has rebounded recently after having declined in 2001 following the
downturn in the ICT sector. Both Japan and Korea, where the share of engineering graduates
is greater, have seen a continued increase in S&T graduates overall (Figure 3.4).
In relative terms, Denmark, Italy, Germany, Hungary and Finland experienced a drop
in the share of university graduates with science and engineering degrees between 1998
and 2002, as did Korea and the United States. The EU countries still produce a greater share
of S&T graduates than Japan or the United States, despite the lower share of researchers in
the workforce: 27% of EU university graduates obtain a science or engineering degree
compared to 24% in Japan and just 16% in the United States.
Supply of PhDs continues to expand
While many researchers do not possess PhD degrees, the supply of PhDs and their
participation in the labour market is of special concern. PhDs are the source of supply of
university and college professors who dispense knowledge and training to future
generations of students. Any policy effort to increase the quality and quantity of university
Figure 3.2. Supply of science and engineering graduates in G7 economies,1998-2002
Source: OECD, Education Database, June 2006.StatLink: http://dx.doi.org/10.1787/388254343740
0
20 000
40 000
60 000
80 000
100 000
120 000
140 000
160 000
180 000
200 000
1998 1999 2000 2001 2002
Science
0
20 000
40 000
60 000
80 000
100 000
120 000
140 000
160 000
180 000
200 000
1998 1999 2000 2001 2002
Engineering
Japan
Germany
United States
France
United Kingdom
Canada
Italy
OECD SCIENCE, TECHNOLOGY AND INDUSTRY OUTLOOK 2006 – ISBN 92-64-02848-X – © OECD 2006 95

3. HUMAN RESOURCES IN SCIENCE AND TECHNOLOGY: TRENDS AND POLICIES
Figure 3.3. Supply of science graduates in selected non-G7 economies,1998-2002
Source: OECD, Education Database, June 2006.StatLink: http://dx.doi.org/10.1787/617768030658
1998 1999 2000 2001 2002
1998 1999 2000 2001 2002
1 000
2 000
3 000
4 000
5 000
6 000
0
500
1 000
1 500
2 000
2 500
3 000
0
5 000
10 000
15 000
20 000
25 000
30 000
35 000
1998 1999 2000 2001 2002
NetherlandsNew ZealandIsrael
SwedenBelgium
Ireland Czech Republic
Switzerland
AustriaDenmarkFinland
Hungary
NorwaySlovak Republic
Iceland
AustraliaKorea PolandSpain TurkeyMexico
OECD SCIENCE, TECHNOLOGY AND INDUSTRY OUTLOOK 2006 – ISBN 92-64-02848-X – © OECD 200696

3. HUMAN RESOURCES IN SCIENCE AND TECHNOLOGY: TRENDS AND POLICIES
Figure 3.4. Supply of engineering graduates in selected non-G7 economies,1998-2002
Source: OECD, Education Database, June 2006.StatLink: http://dx.doi.org/10.1787/433258345752
0
2 000
4 000
6 000
8 000
10 000
12 000
1998 1999 2000 2001 2002
0
1 000
2 000
3 000
4 000
5 000
6 000
7 000
8 000
1998 1999 2000 2001 2002
0
10 000
20 000
30 000
40 000
50 000
60 000
70 000
80 000
90 000
1998 1999 2000 2001 2002
BelgiumIsrael
Ireland
Netherlands Czech Republic
New Zealand
Sweden
Switzerland
Austria DenmarkFinland
Norway
Slovak RepublicHungary
Iceland
AustraliaKorea Poland Spain TurkeyMexico
OECD SCIENCE, TECHNOLOGY AND INDUSTRY OUTLOOK 2006 – ISBN 92-64-02848-X – © OECD 2006 97

3. HUMAN RESOURCES IN SCIENCE AND TECHNOLOGY: TRENDS AND POLICIES
graduates in science and engineering or output from public research will need to focus on
the training of PhDs. Furthermore, the rigours of advanced research generally require PhD-
level training, even if more and more higher institutions are including research training at
lower levels of tertiary education (i.e. at Master’s and Bachelor’s level). Advances in
scientific discovery and the productivity of the public research system (e.g. scientific
publications) rely mainly on PhD-trained personnel. Even in industry – which in most
countries employs fewer PhDs than academia – the PhD is of particular relevance,
especially in sectors high up the technological value chain whose research problems are
close to those in basic research (e.g. the life sciences, nanotechnology, computing).
The EU dominates in the production of PhD graduates overall as well as in the supply of
PhDs in science and engineering. Out of a total of 156 190 PhD graduates in the OECD area
in 2002, the EU19 (EU15 plus Poland, Czech Republic, Hungary and Slovak Republic) accounted
for 51% while the United States represented 28% and Japan 13%. In science and engineering,
the EU also produces more PhDs (55%) than the United States (25%) or Japan (9%). In some EU
countries, the relative production of PhDs is even more marked. Sweden and Switzerland have
the highest share of PhDs per million population followed by Finland, the United Kingdom and
Germany. Between 1998 and 2002, Belgium, the Czech Republic, the Slovak Republic, Denmark
and Mexico all experienced average annual double-digit growth in PhDs (Figure 3.5). The
increase in the number of PhD graduates in the EU is largely due to the creation and expansion
of doctoral schools and programmes in Europe in the 1980s and 1990s (e.g. in Finland,
Denmark, Italy and France). In a number of countries the increase has also been influenced by
Box 3.1. OECD Global Science Forum study on evolution of student interestin S&T studies 2006
A two-year study on declining enrolments in scientific studies by the OECD GlobalScience Forum found that between 1993 and 2003 there was an overall increase inenrolments in science and engineering studies as well as in the number of graduates,including at the PhD level. However, the study also found that the relative share ofgraduates in science and technology disciplines had actually declined over the period inten out of 16 countries studied and that the trends were even more negative at thedoctorate level in all but three countries. Furthermore, it found that S&T disciplines wereaffected differently by the decline; for instance, enrolments decreased in absolute andrelative terms for physics and mathematics in several countries while the oppositeoccurred in computing studies. In terms of contributing factors, the study noted that:
● The image of science and scientists remains positive but S&T professions are lessattractive to young people.
● Poor opinion of S&T studies (and drops-out) is often linked to negative pedagogicalexperience and inadequate curricula.
● Female and minority students are not sufficiently encouraged to follow S&T studies.
While interest at the primary level is strong and stable over time, interest in S&T studiestends to decline at age 15 when students are faced with more academic choices and whengender differentiation begins to affect choices. While many countries are implementingnew programmes to increase interest in and awareness of science among youth (e.g.pedagogical projects at schools, media programmes) as well as measures to improvestudent performance in mathematics and science (e.g. curriculum reform, improvementsin teacher training and pay) only a few of these programmes are evaluated.
Source: OECD 2006a.
OECD SCIENCE, TECHNOLOGY AND INDUSTRY OUTLOOK 2006 – ISBN 92-64-02848-X – © OECD 200698

3. HUMAN RESOURCES IN SCIENCE AND TECHNOLOGY: TRENDS AND POLICIES
increases in funding/fellowships as well as labour market conditions for lower levels of
education, which may send graduates into PhD programmes because of a lack of jobs at lower
degree levels. PhD study in certain fields, such as the natural and physical sciences, while
fewer in number, tend to be better funded in many countries.
Policy concerns about the supply of future researchers have also focused on the duration
of PhD programmes: too lengthy PhD studies or excessive periods of post-doctoral training can
delay access to the independent research status which is often necessary to compete for
research funding at national or international level. Even in the social sciences, which have
traditionally not required post-doctoral training, additional training is now more important as
research becomes more interdisciplinary and as the academic job market becomes more
competitive, including at the global level.
Data on the age of PhD degree recipients are not available for many countries. However,
results from the OECD’s working group on the Steering and Funding of Research Institutions
(SFRI) show large variations in the duration of PhD programmes, which range from up to three
to four years in France and Germany to six years in Spain and 7.5 years in the United States
(Figure 3.6). The duration depends of course on many factors, including country-specific and
institutional differences such as the availability of funding for PhD studies and the status/
conditions of the PhD candidate (e.g. employee or student). In many countries, the average
duration is higher in the humanities and social sciences. Some countries have tried to address
this issue at the selection stage: in Sweden, an assessment is made of available funding and
the possibility of completing the studies within a reasonable time before admission to the PhD
is granted. Nevertheless, the duration of PhD programmes plays a role in the ability of some
countries to increase the supply of PhDs.
Figure 3.5. PhD graduates in science1 and engineering2 and other fields, 2002,3 per million population
1. Sciences include life sciences, physical sciences, mathematics and statistics, and computing.2. Engineering includes engineering and engineering trades, manufacturing and processing and architecture and
building.3. 2000 instead of 2002 for Canada and Portugal.4. 1999 instead of 1998 for Denmark, Mexico and the Slovak Republic; 2000 for Belgium and Portugal; 2001 for Poland.
Source: OECD, Education Database, June 2006.StatLink: http://dx.doi.org/10.1787/803731418563
6.4 -0.2 1.3 6.5 -1.1 2.8 0.5 3.7 4.5 10.4 14.2 3.8 0 0.7 7.3 5.6 19.0 -1.0 1.2 15.0 8.1 0 3.5 -5.1 1.1 1.4 22.1
0
50
100
150
200
250
300
350
400
450
Average annual growth rates of total PhD graduates, 1998-20024
Science Engineering Others
Sweden
Switzerl
and
Finlan
d
United
Kingdo
m
German
y
Austria
Franc
e
Irelan
d
Austra
lia
Belgium
Czech R
epub
licSpa
in
Portug
al
Netherl
ands
Korea
New Ze
aland
Slovak
Repub
lic
United
States
Canad
a
Denmark
Japa
n
Poland Ita
ly
Hunga
ry
Turke
y
Norway
Mexico
OECD SCIENCE, TECHNOLOGY AND INDUSTRY OUTLOOK 2006 – ISBN 92-64-02848-X – © OECD 2006 99
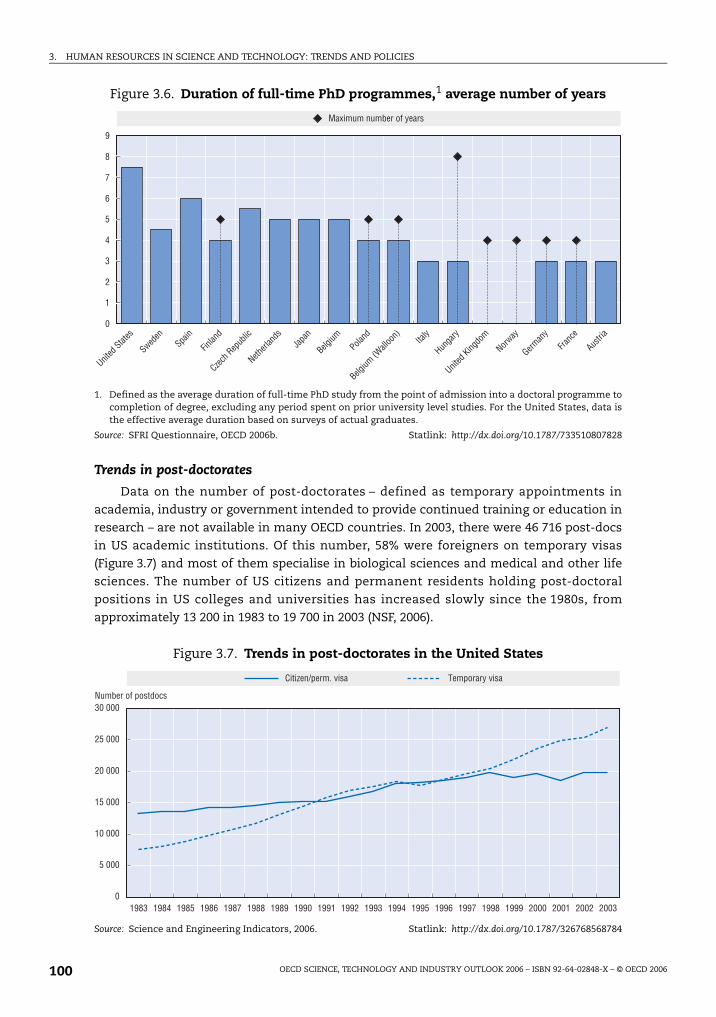
3. HUMAN RESOURCES IN SCIENCE AND TECHNOLOGY: TRENDS AND POLICIES
Trends in post-doctorates
Data on the number of post-doctorates – defined as temporary appointments in
academia, industry or government intended to provide continued training or education in
research – are not available in many OECD countries. In 2003, there were 46 716 post-docs
in US academic institutions. Of this number, 58% were foreigners on temporary visas
(Figure 3.7) and most of them specialise in biological sciences and medical and other life
sciences. The number of US citizens and permanent residents holding post-doctoral
positions in US colleges and universities has increased slowly since the 1980s, from
approximately 13 200 in 1983 to 19 700 in 2003 (NSF, 2006).
Figure 3.6. Duration of full-time PhD programmes,1 average number of years
1. Defined as the average duration of full-time PhD study from the point of admission into a doctoral programme tocompletion of degree, excluding any period spent on prior university level studies. For the United States, data isthe effective average duration based on surveys of actual graduates.
Source: SFRI Questionnaire, OECD 2006b. Statlink: http://dx.doi.org/10.1787/733510807828
Figure 3.7. Trends in post-doctorates in the United States
Source: Science and Engineering Indicators, 2006. Statlink: http://dx.doi.org/10.1787/326768568784
0
1
2
3
4
5
6
7
8
9
Austria
Franc
e
German
y
Norway
United
Kingdo
m
Hunga
ryIta
ly
Belgium
(Wall
oon)
Poland
BelgiumJa
pan
Netherl
ands
Czech R
epub
lic
Finlan
dSpa
in
Sweden
United
States
Maximum number of years
0
5 000
10 000
15 000
20 000
25 000
30 000
1983 1984 1985 1986 1987 1988 1989 1990 1991 1992 1993 1994 1995 1996 1997 1998 1999 2000 2001 2002 2003
Number of postdocs
Citizen/perm. visa Temporary visa
OECD SCIENCE, TECHNOLOGY AND INDUSTRY OUTLOOK 2006 – ISBN 92-64-02848-X – © OECD 2006100

3. HUMAN RESOURCES IN SCIENCE AND TECHNOLOGY: TRENDS AND POLICIES
Exact figures on the numbers of post-docs in the EU are unavailable. However,
according to a study by the European Commission, there were at least 10 700 post-doc
positions (schemes or programmes resulting from an open call for proposals) awarded
through open competition across the EU in 2004, including 2 100 by pan-European
organisations, mainly the Marie Curie Fellowships programme (European Commission,
2004). The study found that the average duration of a post-doc was two years even though
Austria, Finland, Germany, Spain and the United Kingdom have recently implemented five-
year contracts to allow post-docs to pursue longer-term research and provide them with
more stable employment. This would suggest that the actual number of recipients of post-
doctorate awards in any given year in the EU exceeds 20 000.1 Their small number relative
to the number of PhD graduates produced in the EU may weaken career prospects insofar
as positions increasingly require such training. Furthermore, the diversity of post-doctoral
positions, with their own criteria and recruitment procedures, may make the market less
transparent and thus affect the attractiveness of research careers.
There are several possible reasons for the apparently lower number of post-doctoral
positions in the EU. The first relates to the system of university funding which until the 1980s
was dominated by block grants to institutions that left little room for funding such positions.
A second is that the post-doc is still a relatively recent development in many EU countries.
Most PhD graduates tended to find permanent employment in the university or in public
research institutes. Now, however, the increase in the number of PhD graduates in the EU has
made competition for academic posts stiffer. The internationalisation of research has made
the post-doc an important vehicle for obtaining not only additional experience but also
access to networks and employment. The long-standing tradition in Europe of seeking post-
doctoral positions abroad, especially in the United States and Canada, has also increased
awareness of the importance of post-doctoral training. Arguably the relatively large amount
of post-doctoral opportunities in the United States, especially in the life sciences, has
resulted in an international division of labour, so that many PhD graduates choose the
United States as a place for temporary post-doctoral training, which may reduce demand for
post-doctorates at home.
Women in S&T are gaining ground but remain under-represented
Against a background of growing demand for human resources in S&T, OECD
governments are encouraging women to pursue studies and careers in S&T. Women
account for around 30% of science and engineering graduates in OECD countries, a figure
that hides important discrepancies by field: women account for more than 60% of life
science graduates in a number of OECD countries, but account for less than 30% of
graduates in computing and 40% of graduates in the physical sciences. The population of
female researchers has also increased; women account for 25% to 35% of researchers in
most OECD countries, with the exception of Japan and Korea (12% each). While nearly two-
thirds of women researchers in the United States work in industry/business, the figures are
17.5% for the EU and 6% for Japan.2 This contrasts with a general pattern in which most
OECD researchers, though primarily men, work in the business sector. Women researchers
tend to be concentrated in fields and industries such as biology, health, agriculture and
pharmaceuticals, with low representation in physics, computing and engineering.
In terms of participation in careers, just over one-third of US university faculty are
women, a figure that is much lower in EU countries and in Australia and Korea (14.5%).
Women also make up less than 20% of senior academic staff in most EU countries.
OECD SCIENCE, TECHNOLOGY AND INDUSTRY OUTLOOK 2006 – ISBN 92-64-02848-X – © OECD 2006 101
3. HUMAN RESOURCES IN SCIENCE AND TECHNOLOGY: TRENDS AND POLICIES
Women obtain more than half of all university degrees in many countries but only
around 30% of university degrees awarded in science and technology. OECD countries
therefore face a paradoxical situation: a feminisation of the workforce in general and of
university-trained graduates in particular, but continued under-representation of women in
research. Furthermore, the available data tend to reinforce results in the academic literature
which show that women remain unevenly distributed in research occupations and under-
represented in senior positions. Recent studies on women and science have identified a
number of factors that can influence women’s careers: the difficulty of reconciling
professional and childcare requirements, less mobility than men, evaluation methods which
may be gender-biased or ill-adapted to female choices (e.g. preference for teaching over
research) and research agendas that are unattractive to women, partly because women are
absent from or under-represented in the scientific boards that set research agendas.
Foreign students and scholars are an important source of HRSTOECD countries continue to benefit from the inflow of talented students and scholars.
Although the large majority of foreign tertiary-level university students enrol at the
undergraduate level, they represent a higher proportion than domestic students at
postgraduate level (OECD, 2005b). The proportion of foreigners among PhD graduates
exceeded 30% in Belgium and Switzerland in 2002 (Figure 3.8). The United States hosted
the largest foreign PhD population, with about 79 000 students from abroad (OECD, 2005a).
Asian students account for the bulk of PhDs awarded to foreigners in the United States
(NSF, 2006). This is partly due to “pull” factors, such as funding and the number of positions
available, but some sending countries also stimulate demand. Since 2001, the Indian
government has provided funds (in FY2005, USD 5 billion) for “soft loans” to students who
wish to travel abroad for their education, and the number of students going abroad
increased by 7% between 2003 and 2004. In 2002, India surpassed China as the major
sender of graduate students to the United States (NSF, 2006; NAP, 2005).
As regards the share of foreign highly skilled workers in OECD countries, the United
States accounts for 45% of all foreign highly skilled residents. The EU19 takes in about 30%
of the foreign highly skilled in the OECD area, mainly from other OECD countries. Countries
with a strong tradition of immigration such as Australia, Canada, New Zealand and the
United Kingdom also have high shares of foreigners among their highly skilled populations
(Figure 3.8). It is noteworthy that former emigration countries such as Ireland and Portugal
are also attracting highly skilled foreigners. Finland, Mexico, Japan and Korea have the
smallest share of foreigners among the highly skilled population in their countries. While
migration patterns have deep historical, economic and geographical patterns, framework
conditions such as immigration rules and naturalisation criteria, ease of access to
education and the labour market for foreigners play an important role in shaping the scale
and direction of the migration of foreign talent.
Foreign students, especially from developing countries, often stay on in OECD countries
for further research or employment, thereby contributing to innovation in those countries.
However, there has been an increase in return flows to non-member countries such as China
and India and to OECD countries like Ireland which actively court expatriate researchers.
Such “brain circulation” helps limit brain drain and arguably confers benefits on both
sending and receiving countries. OECD countries are increasingly aware that while foreign
talent can boost the supply of S&T skills, it cannot substitute for national investments in
human capital, not least because the direction of migration flows can shift in response to
OECD SCIENCE, TECHNOLOGY AND INDUSTRY OUTLOOK 2006 – ISBN 92-64-02848-X – © OECD 2006102

3. HUMAN RESOURCES IN SCIENCE AND TECHNOLOGY: TRENDS AND POLICIES
economic factors or the education and research strategies of the sending countries.
Consequently, much policy effort in this area is being directed towards improving the
attractiveness of research and innovation systems to foreign talent while improving
incentives for citizens/nationals, especially women and minorities, to invest in S&T skills.
Labour market outcomes of S&T graduatesThe labour market for S&T graduates affects students’ incentives to undertake science
studies and research careers (Box 3.2). It sends a signal to young people about the relative
attractiveness of careers in science and technology. Overall, university S&E graduates tend
to have higher employment rates and lower unemployment rates than university
graduates in general. Even though the business sector may employ over half of the
“researchers” in most OECD countries, the business sector is not the main employer of
PhDs. In the United States, only 34% of science and engineering PhDs in employment
in 2001 were working in the private for-profit sector, the remainder worked in the higher
Figure 3.8. International mobility of PhD students and the highly skilled
1. Graduates at tertiary level.2. Whatever the citizenship and the place of birth (native and foreign-born).
Sources: OECD, Education Database, February 2006. OECD, Database on immigrants and expatriates, February 2006.
StatLink: http://dx.doi.org/10.1787/226812848104
0 5 10 15 20 25 30 35 40 45%
Number of foreign doctoral students
Switzerland
Belgium
United KingdomUnited States
(2001)Australia
Denmark
Austria
Canada
Norway
Sweden
Spain
Czech Republic
Hungary
Finland
New Zealand
Portugal
Iceland
Korea
Turkey
Slovak Republic
Mexico
Italy
5 359
218
Share in total highly skilled expatriatesacross the OECD area (%)
0 5 10 15 20 25 30%
KoreaJapan
MexicoFinlandPoland
Slovak RepublicHungary
TurkeyCzech Republic
SpainDenmark
NorwayNetherlands
BelgiumGermany
EU19OECDEU15
GreeceFrance
United StatesSwedenAustria
PortugalUnited Kingdom
IrelandNew Zealand
CanadaSwitzerland
AustraliaLuxembourg
0.2
0.149.0
1998
1 990
22 824
78 884
8 033
872
2 705
4 655
727
3 147
8 677
1 367
496
1 350
341
718
2
649
378
110
991.50.50.10.50.10.30.90.32.20.30.41.11.06.4
29.6100
28.40.85.6
45.21.10.60.67.60.70.9
11.21.5
8.1
Foreign students enrolled in doctoral programmes, 2002As a percentage of total doctoral enrolment in host country
Highly skilled immigrants, 2001As a percentage of total highly skilled1 residents2
in host country
OECD SCIENCE, TECHNOLOGY AND INDUSTRY OUTLOOK 2006 – ISBN 92-64-02848-X – © OECD 2006 103

3. HUMAN RESOURCES IN SCIENCE AND TECHNOLOGY: TRENDS AND POLICIES
education and government sectors (NSF, 2006). In Finland, which leads the OECD in the
share of researchers in the labour force, some 80% of PhDs were employed in the public
sector (universities, public research institutes and government sector) in 1999 according to
data from the Academy of Finland (Husso, 2002). A survey of recent PhD graduates in Spain
found that 53% worked in public sector research and only 18% worked in industry while
29% were unemployed (Cruz, 2005). Several countries are implementing measures to
increase the share of PhDs in industry.
The linear career path from PhD to tenured faculty is giving way to more diverseand multiple career paths
Why do most PhDs end in up in academia or public sector research? One reason is that
in many countries the design of PhD programmes and the selection of candidates have
historically been geared towards steering researchers down the academic path. At the
same time, R&D in the business sector, especially developmental research, has long relied
on the supply of engineers and scientists without advanced degrees. This is partly due to
the shorter length of time needed to produce science and engineering graduates and the
focus of business on applied research and engineering. Firms have traditionally
Box 3.2. Labour market situation for recent PhD graduates: results fromthe OECD Careers of Doctorate Holders Survey
Preliminary results from the OECD’s survey of the Careers of Doctorate Holders (CDH) fora subset of countries confirm that, on average, PhD graduates tend to have lowunemployment rates (2.3% in Australia, 3.7% in Canada, 3.2% in Germany and 2.9% in theUnited States). However, with the exception of Canada, female PhDs have higherunemployment rates than men. Young female PhDs also tend spend a longer time inunemployment than men. As regards unemployment by field of PhD degree,unemployment tends to be lower among PhD graduates in the medical sciences and thehumanities and social sciences but relatively higher in the natural sciences and inengineering. Part-time and temporary employment can be high, especially for women. Interms of the match between degree and occupation, 76% of employed doctorate holders inCanada and 72.5% of those in the United States are researchers. In the United States, workas researcher is more frequent for men (74%) than for women (70%). Post-doctoralpositions are held by 7.3% of researchers with a doctoral degree in natural science, 11.3%for women against 6.9% for men Post-doctoral positions are also held by 5.8% of US femaleresearchers with a doctoral degree in medical sciences and 1.3% of male researchersholding a doctoral degree in engineering.
In terms of mobility, PhDs in the United States are more mobile than those in theGermany: 62% of doctorate holders in Germany have been with the same employer for atleast five years compared to 55% in the United States. Mobility in the United States is lowerin the higher education sector, however: 60% of US PhDs in academia have been with thesame employer for at least five years compared to 50% in other sectors. The vast majorityof PhDs in the United States express satisfaction with their employment situation. Theyare more satisfied with the content of their work (intellectual challenge, level ofresponsibility, degree of independence and contribution to society) than with employmentconditions (salary, benefits, job security, location and opportunities for advancement). Upto 20% of US doctorate holders (25% of women) express dissatisfaction with their salaryand 25% (30% of women) with the situation for career development.
OECD SCIENCE, TECHNOLOGY AND INDUSTRY OUTLOOK 2006 – ISBN 92-64-02848-X – © OECD 2006104

3. HUMAN RESOURCES IN SCIENCE AND TECHNOLOGY: TRENDS AND POLICIES
compensated for the lack of advanced degrees by providing young graduates firm-based
training. Another reason is that, during their training, PhDs have lacked guidance and
mentoring with regard to career prospects. This is starting to change and many countries
are paying more attention to the mentoring of PhD candidates and preparation for careers
outside academia in response to bottlenecks in the academic career path. In addition,
public policy in many countries has sought to encourage PhDs to seek careers in industry
as a way to foster greater industry-science relationships and upgrade the technological
“absorptive capacity” of firms and as a means to promote mobility and a more efficient
allocation of S&T skills in the economy. However, the traditional career path is also being
challenged by researchers themselves who want a degree of stability and career prospects,
but also more autonomy and independence early in their careers, something that
academia has been slow to provide. As a result, there is pressure for careers paths to
become more dynamic, involving periods of mobility between sectors and across borders,
a departure from the linear model of a lifelong career in academia or in industry.
Policy developments in the area of HRSTAs the preceding analysis of the main quantitative trends indicates, issues associated
with the development and mobility of human resources in science and technology – from
the early stages of primary through tertiary education to the training and employment of
researchers – are multiple and complex. Policy instruments that affect HRST development
are also diverse and multifaceted. The governance structures related to policy making for
HRST cut across administrative, judicial, regulatory and ministerial boundaries.
Furthermore the decentralised nature of higher education policy in many countries limits
the scope and coverage of national policy measures (the Netherlands’ effort to address this
problem is described in Box 3.3). Such a policy landscape makes it extremely difficult to
assess the effectiveness of individual policies and measures, many of which take place at
Box 3.3. Promoting S&T studies from primary education to the labour market: a cross-ministerial approach in the Netherlands
In 2004 the Dutch Ministry of Economic Affairs, the Ministry of Social Affairs andEmployment and the Ministry of Education, Culture and Science launched a Science andTechnology Platform (Platform Bèta Techniek) to increase the number of new S&Tgraduates in 2010 by 15% compared to 2000 and to ensure that scientists and technologistsare more effectively retained and used. The Platform’s approach is to anchor S&T studiesinstitutionally, from primary schooling to the labour market. The Platform is alsodeveloping a range of methods which schools can use to improve science curricula andteaching, participation by girls, development of partnerships, etc., as they wish. Innovationand performance agreements are made with the school or company regarding ultimateobjectives. The core of this approach, then, is the school’s autonomy. Nothing is imposed.Progress is monitored, and the results of monitoring are discussed with the school atauditing meetings so the school can see its strengths and weaknesses. In addition to itsnationwide programme, the Platform is also active in the regions, collaborating with thebusiness community, schools and regional and local government to establish and carry outscience and technology agendas. The Platform’s aim is to offer institutions – primary,secondary, vocational and universities – as much support and expertise as possible toensure they have the capacity and tools to increase the quality and relevance of S&Tstudies and ultimately, the supply of S&T graduates.
Source: STI Outlook Questionnaire, 2006.
OECD SCIENCE, TECHNOLOGY AND INDUSTRY OUTLOOK 2006 – ISBN 92-64-02848-X – © OECD 2006 105

3. HUMAN RESOURCES IN SCIENCE AND TECHNOLOGY: TRENDS AND POLICIES
the grassroots or institution level and whose impact (or lack thereof) may depend on the
success of other measures at different levels and under the competence of different actors
(e.g. schools, local governments, national education ministries, research funding agencies)
and require time to be evaluated: many types of policies to foster HRST date back ten to
15 years, even if some have been redesigned or expanded.
Several critical policy areas for encouraging the development of HRST can nevertheless
be identified and are described in the following paragraphs,
Policies to increase enrolments in S&T and improve educational outcomes
The first policy area covers access to education from primary and secondary schooling
to S&T education at the tertiary levels (Table 3.1). Empirical studies in various countries
have documented the importance of stimulating awareness of and interest in science at
the earliest stages of schooling, especially for girls. Given the compulsory nature of primary
and lower secondary education, many countries have naturally focused on improving
participation of students in mathematics and science courses. Related initiatives in
Finland and Ireland, for example, have attempted to adapt or reform school curricula to
make science more accessible and attractive to young students. Adapting academic
curricula, for example by further developing interdisciplinary courses and linking S&T
studies to societal issues, such as sustainable development and the environment, have
been found to increase interest in S&T among girls.
Portugal aims to raise the supply of human resources in R&D by 50% and the supply of
PhDs from 1 000 a year to 1 500 a year. In October 2005 it reinitiated the Ciência Viva programme
which brings together researchers, schools, students, local authorities, science centres and
science museums with universities, polytechnics and research laboratories in an initiative that
supports experimental science teaching in schools. Between 1997 and 2001 this programme
involved 7 000 teachers and 500 000 students in 3 000 science projects in all schools. The
Portuguese government is also planning to reinforce the infrastructure for science teaching,
including libraries, and to broaden fast and efficient access to the Internet. Like Portugal,
Mexico has several programmes including La Ciencia en tu Escuela (Science in your School) to
increase awareness of science among young people. Furthermore, the Mexican Academy of
Sciences is creating a database, Atlas de la Ciencia, surveying all science activities in Mexico in
Table 3.1. Types of policies to encourage the supply of S&T graduates
Primary and secondaryeducation
Vocational education Universities PhD and post-doctorate training
– Public awareness initiatives (science weeks, scienceand technology fairs, etc.)
– Autonomy and incentives– Reform of curricula
– Autonomy and incentives– Reform of curricula– ICT infrastructure
– Specialised doctoral schools– Enhancing PhD supervision– Increasing PhD stipends
and fellowships– Information on labour market
and careers
Girls/women in science initiatives
– Public private partnerships– Allowing students a second
chance to choose S&T studies
– Improvements in school labs and equipment
– Information on labour market and careers
– Encouraging entrepreneurship– Information on labour market
and careers
– Enhance maths and science teaching
– Attracting foreign students – Attracting foreign scholars
OECD SCIENCE, TECHNOLOGY AND INDUSTRY OUTLOOK 2006 – ISBN 92-64-02848-X – © OECD 2006106

3. HUMAN RESOURCES IN SCIENCE AND TECHNOLOGY: TRENDS AND POLICIES
order to inform young people and the public at large about the state of scientific research in
Mexico, thus improving public understanding and awareness of science.
In Switzerland, several initiatives been launched to raise interest in science among
youth. The Swiss Academy of Sciences (SCNAT) and partner organisations have started the
“Maturity at Work” programme to bring high school students to laboratories. Students are
also given the chance to do their maturity thesis at university institutes. This programme
includes fields in life sciences, information technology, physics and mathematics.
Another example of an initiative to raise supply comes from Italy where the National
Conference of Deans of Science and Technology Faculties (Con-Scienze) in co-operation with
the Association of Italian Industries (Confindustria) and the Ministry of Education, Universities
and Scientific and Technological Research (MIUR) set up the Progetto Lauree scientifiche (The
Science Diploma Project) to increase the number of university students enrolling in the hard
sciences and thus the number of S&T graduates entering the labour market. The project,
which was financed in 2005 and 2006 for a total amount of EUR 8.5 million, provided: ad hoc
pre-university orientation for high-school students with information on the job prospects for
scientific careers; revised curricula in undergraduate hard-science programmes; internships in
public and private research labs; and a one-year masters programme in the sciences more
closely aligned with business needs.
In Japan, the Ministry of Education and Research (MEXT) has implemented the Science
Literacy Enhancement Initiatives, a package programme to promote S&T education policies.
For example, the Super Science High School programme is to develop an intensive science/
mathematics curriculum at high schools designated by the MEXT. Another example is the
Science Partnership Project, which supports pupils’ exposure to science through special study
programmes supplied through collaboration between schools, universities and science
museums. These programmes aim to enhance primary and secondary pupils’ interest in S&T.
Making the path of S&T studies more permeable and allowing students a “second chance”
to access S&T studies at later points in the education system, already possible in Sweden,
Ireland and the United Kingdom, is another strategy being adopted by OECD countries.
Similarly, developing partnerships involving S&T professionals and students and tertiary
institutions and secondary schools, such as the US National Science Foundation’s Math-
Science Partnership (MSP), can improve students’ and teachers’ knowledge of S&T professions
and thus help fight stereotypes that may deter students from choosing S&T careers.
Policies to improve mobility and the match between supply and demand
Policy action is needed to encourage mobility of young researchers and a better match
between supply of S&T skills and demand, especially from industry. There is increasingly a
focus on ensuring that S&T graduates are equipped with “soft skills” in addition to
technical skills. Partnerships between education institutions and firms as well as regional
development agencies or other local actors are one way of reducing the risk of skill
mismatches and providing students with more information on labour market/career
prospects. In recent years, such partnerships have led to the development of industrial
PhD training programmes (Box 3.4). The European Commission is also focusing more
attention on the development of complementary skills and competences, particularly for
early-stage researchers (e.g. via “Marie Curie” actions in the EC’s Seventh Framework
“People” programme).
OECD SCIENCE, TECHNOLOGY AND INDUSTRY OUTLOOK 2006 – ISBN 92-64-02848-X – © OECD 2006 107

3. HUMAN RESOURCES IN SCIENCE AND TECHNOLOGY: TRENDS AND POLICIES
Box 3.4. Industrial PhD training: some policy examples
Australia: The Australian Post-doctoral Fellowship Industry (APDI) covers training costsfor young researchers, a sum of approximately AUD 52 240 a year (plus on-costs), underthe Linkage – Projects project. This represents the maximum contribution that may bepaid as salary to the fellow from Commonwealth funds in any one calendar year. The hostinstitution must match local salary levels reached under enterprise bargainingagreements. Successful applicants are appointed by the institution for three years as anAPDI to be employed full-time on the approved project.
Austria: 15 yearly awards of EUR 50 240 a year cover personnel costs to supportscientists who wish to switch from a university to an Austrian company, primarily firmswith up to 500 employees that wish to expand their R&D activities. In addition, thecompany makes 25% of this sum available annually for the use of external facilities.Researchers must have completed doctoral studies within the last ten years. Proposals areprepared by the university or other scientific institute together with the company. Proof isrequired that the company has the technical and financial capacity to carry out and applythe results of the project. Proposals are reviewed by the Austrian Science Fund (FWF), insome cases with advice from external experts.
Canada: The NSERC manages two major programmes, the Industrial PostgraduateScholarship (IPS) and the Industrial Research and Development Fellowship (IRDF). The IPSprogramme allows graduate students (M.Sc. and PhD) to pursue their studies incollaboration with industry. They must perform at least 20% of their research in the industryfacilities. NSERC provides an annual stipend of CAD 15 000 and the industrial partner mustprovide at least CAD 6 000. The IRDF programme allows post-doctoral fellows to pursue theirresearch in industry. They are considered employees of the company and should perform100% of their research at the company facility. NSERC provides an annual stipend ofCAD 30 000 and the industrial partner must provide at least CAD 10 000. In 2004, the averageIRDF salary was around CAD 52 000. NSERC awards around 250 IPS and 90 IRDF a year.
Denmark: Since 1970, the Danish Industrial PhD initiative has aimed at enhancing R&D inthe Danish business sector and provides funding for 200 PhD fellowships for candidates towork on a project defined by a company in co-operation with the university. A subsidy goesto the company (50% of researchers’ salary) and to the university for supervision costs andtraining and complementary business-targeted courses. The university may be foreign.
Japan: A programme to provide practical training in industry exists, mainly at theMaster’s level; the NEDO fellowship is for post-docs.
Netherlands: The Casimir programme, launched in 2004, provides financial incentives forcompanies and knowledge institutions to organise exchanges between talented researchersin the public and private sectors and offer them enhanced career prospects. The Casimirprogramme budget for 2005 is approximately EUR 3 million. The programme is open toPhDs, Bachelor’s-level research staff, post-doctoral researchers, university lecturers or seniorlecturers, professors and researchers working in the private sector. It is targeted primarily atresearchers in science and technology. Applicant companies and knowledge institutionsmust be based in the Netherlands. The knowledge institution may be a university or PRO.
New Zealand: Technology for Industry Fellowships (TIF) provides funding forundergraduates, Master’s and PhD students and experienced researchers to work onscience, technology and engineering projects conducted in, and managed by, firms.Evaluations show that companies using the scheme required a lot of time to mentor andmanage the students. However, many companies felt positive about their role in helpingstudents and exposing them to the commercial realities of business.
OECD SCIENCE, TECHNOLOGY AND INDUSTRY OUTLOOK 2006 – ISBN 92-64-02848-X – © OECD 2006108

3. HUMAN RESOURCES IN SCIENCE AND TECHNOLOGY: TRENDS AND POLICIES
More and more countries are funding (a small number of) PhD fellows to carry out part
of their work for and with industrial partners. Most of the funding goes to offset the wage
costs of the PhD or Master’s student in residence at the firm. Such programmes may have
a limited impact owing to their size but nevertheless contribute to familiarising firms with
PhDs and vice versa. Regulatory and legal barriers to mobility between the public sector and
industry have been the object of past reforms in larger OECD countries but are still the
focus in catching-up countries like Poland and Hungary.
Another important issue is the removal of barriers to the mobility of researchers. The
European Commission plans to publish a set of concrete recommendations to improve
mobility between academia and industry as a way to promote knowledge transfer and the
development of cross-sector skills and competences. The recommendations concern four
areas: knowledge and skills development, career appraisal, legal and administrative
obstacles to mobility, and structuring initiatives. The recommendations are to serve as
guidance for dialogue and action among various stakeholders throughout Europe.
Policies to improve the participation of women in science education and careers
OECD countries are focusing greater attention on increasing the participation of
women in science and technology. Some countries have targeted programmes for the
primary and secondary level; others focus on the PhD level and on improving working
conditions for women researchers in academia (e.g. initiatives for balancing work and
family). Measures range from funding grants to support positions for women at
universities to promoting women’s networking initiatives.
Promoting gender research and “gender mainstreaming” in institutions and research
funding agencies is another tool being used to improve the participation of women in S&T. The
Swedish Research Council has increased funding (by some SEK 12 million) for gender research
and for the National Gender Secretariat in Göteborg (by SEK 1 million). The funding is used to
ensure mainstreaming of gender in academic areas as gender research develops its own
theoretical and knowledge base. The United Kingdom has established a Resource Centre for
Women in Science, Engineering and Technology (SET) to help female undergraduates make the
transition to the SET workplace, through measures such as mentoring, work experience and
placement. Switzerland has promotion programmes such as the Federal Gender Equality
Programme for Universities and the Federal Programme for Equal Opportunities at Universities
of Applied Science (Fachhochschulen) which cover aspects such as financial support for hiring
female professors, mentoring programmes and improvement of childcare at universities.
Box 3.4. Industrial PhD training: some policy examples (cont.)
Portugal: The Enterprise PhDs programme of the Foundation for Science (FCT) aims topromote career diversification as well as collaboration between firms and universities. Inaddition, during 1997-2003, the FCT helped to place 77 PhD holders and 63 Masters innearly 50 firms, through the support of the Innovation Agency.
Spain: The Becas FPI Programme (training of PhDs) permitted PhDs students to developshort-term stays in enterprises for the first time in 2005. The Torres Quevedo Programmehas financed about 1 000 labour contracts for doctorate holders and technologists inenterprises and technological centres.
Source: SFRI Questionnaire, OECD 2006b.
OECD SCIENCE, TECHNOLOGY AND INDUSTRY OUTLOOK 2006 – ISBN 92-64-02848-X – © OECD 2006 109

3. HUMAN RESOURCES IN SCIENCE AND TECHNOLOGY: TRENDS AND POLICIES
Canada’s “Chairs for Women in Science and Engineering” is one of several programmes to
attract and retain more women into senior faculty ranks.
On the employment side, equal opportunity policies, flexible working hours and
parental leave are important for encouraging women to pursue research careers in the
public and private sectors. In Norway, the new government has ambitious goals for
recruiting women in research in general and in science and technology in particular.
Currently 30% of Norway’s researchers are women, and 17% of professors are women.
Higher education institutions are expected to develop their own plans for gender equality.
The Ministry of Education and Research encourages higher education and research
institutions to make use of the opportunity provided by high retirement rates in the
coming years to recruit more women in research. In January 2004, the ministry established
the Committee for Mainstreaming Women in Science to support the integration of women
in research. The European Commission has proposed explicit support measures to
facilitate the reintegration of researcher careers into their new programme for researchers’
training, mobility and career development.
Many countries seek to raise the share of women in senior positions in the research
system. Some programmes aim at increasing the participation of women on scientific and
research boards:
● The United Kingdom has set as a target that by 2008 40% of the representation on SET
boards should be women.
● Canada has a range of funding schemes to encourage greater participation of women in
academic careers, including in the mathematical/physical sciences and engineering and
to encourage universities to appoint more women to tenure-track positions.
● The Netherlands Ministry of Education, Culture and Science, the Netherlands Research
Council (NWO) and the universities have a national programme, the Aspasia Programme, for
promoting women assistant professors to the position of associate professors.
● Norway has launched a “start-up funding programme for women in male-dominated
areas” which provides financial support to pay for equipment and research assistants.
However, the government considers that this programme aimed at individual women
must be balanced by more structurally oriented measures and changes to the cultural
mindsets of institutions regarding gender.
Much of this policy action addresses public sector research, and governments have
generally not taken extensive measures, with the exception of equal opportunity and/or
affirmative action laws, to increase the proportion of women in private-sector research.
Recently both Norway and France adopted gender equality laws to increase the number of
women on the boards of public companies (to 40% and 20%, respectively). Austria, Finland
and France have programmes to encourage industry to recruit women; Germany relies on
voluntary agreements with industry. The United Kingdom has a comprehensive
programme to foster women’s entrepreneurship, including in R&D. As with many human
resource policies, few of these programmes have been evaluated. Furthermore, important
data gaps remain regarding the labour market outcomes of S&T women graduates who do
not go into public research.
Policies to improve the working conditions and attractiveness of researcher careers
Attracting students from within the country but also from abroad to S&E careers is a
concern for both industry and academia. Policy measures in many countries focus on
OECD SCIENCE, TECHNOLOGY AND INDUSTRY OUTLOOK 2006 – ISBN 92-64-02848-X – © OECD 2006110

3. HUMAN RESOURCES IN SCIENCE AND TECHNOLOGY: TRENDS AND POLICIES
increasing the number and amount of PhD and post-doctoral fellowships, the salary levels
for junior researchers, the quality of the research infrastructure, and on making the
academic employment structure more flexible so as to increase the entry of young talent.
Other initiatives focus on improving the image of researchers among young people. In
Luxembourg, the recent initiative “Researchers in Schools” brought national and foreign
scientists to schools to promote science among 15 to 18 year old students. Luxembourg,
which created its first university only in 2003, has also increased the level of teaching-
research fellowships for PhDs and post-docs in order to attract graduates to research
careers. In the United Kingdom, the government has granted nearly 400 new Research
Council fellowships to help researchers develop their careers by moving from short-term
contracts to permanent positions to a total of 73 universities and colleges across the UK.
The scheme is designed to ease the progression and increase the security of research
careers. The scheme will ultimately create 1 000 new academic fellowships, each worth
GBP 125 000, over a five-year period. In addition to funding, policies in countries such as
Germany focus on improving the work environment in terms of organisational flexibility,
interdisciplinary collaboration and a stable funding environment.
The Netherlands government has launched a special programme, Renewal Impulse, to
retain more young researchers in the public research sector. Over the period 2000-10,
1 000 researchers will be selected for this programme. In Germany, reforms aimed at
shortening doctoral programmes have been launched. Additional measures include
strengthening the positions of junior staff in German universities and more funding for
research in high-demand areas. In Sweden, during the Promotion Reform launched in 1999,
1 100 lecturers in higher education were promoted to the rank of professor. Italy has recently
taken the “centre of excellence” route by establishing an “Italian MIT” in Genoa, although the
decision has not been uncontroversial. The Spanish region of Catalonia, where research in
health science has a long tradition, is developing BioCat as a centre of excellence in
biotechnology by recruiting top scientists from the Spanish diaspora and elsewhere.
In 2006 Japan launched the “Promote Diversification of HRST’s Career Fields”
programme to encourage students to pursue careers outside academia. The programme
sponsors consortia of universities and private firms to provide career guidance, meetings
between private firms and young researchers and internships. Norway’s Research Council
is considering a scheme of national research training schools to support the development
of excellent research training primarily based on co-operation between institutions.
Internationalisation and exchange of lecturers and students will be important
components. It is also considering a scheme for doctoral training through formal
co-operation between universities and the private sector. The scheme would stimulate the
private sector to invest more in research and provide PhD candidates with a training
programme relevant to business and industry.
Switzerland’s National Science Foundation (SNF) recently launched a new scheme to
support graduate programmes (Pro*Docs). From October 2006, it will support research in
the humanities and the social sciences as well as other scientific fields. The aim of
Pro*Docs is to shorten the duration of the thesis by making it possible for PhD students
(who will receive a salary) to concentrate on their research and education.
The Slovak Republic has initiated a new grant scheme to support PhD students and
post-doctoral students, including those working in firms. To grant researchers more
autonomy, Poland’s Focus programme provides subsidies for creating research teams and
OECD SCIENCE, TECHNOLOGY AND INDUSTRY OUTLOOK 2006 – ISBN 92-64-02848-X – © OECD 2006 111
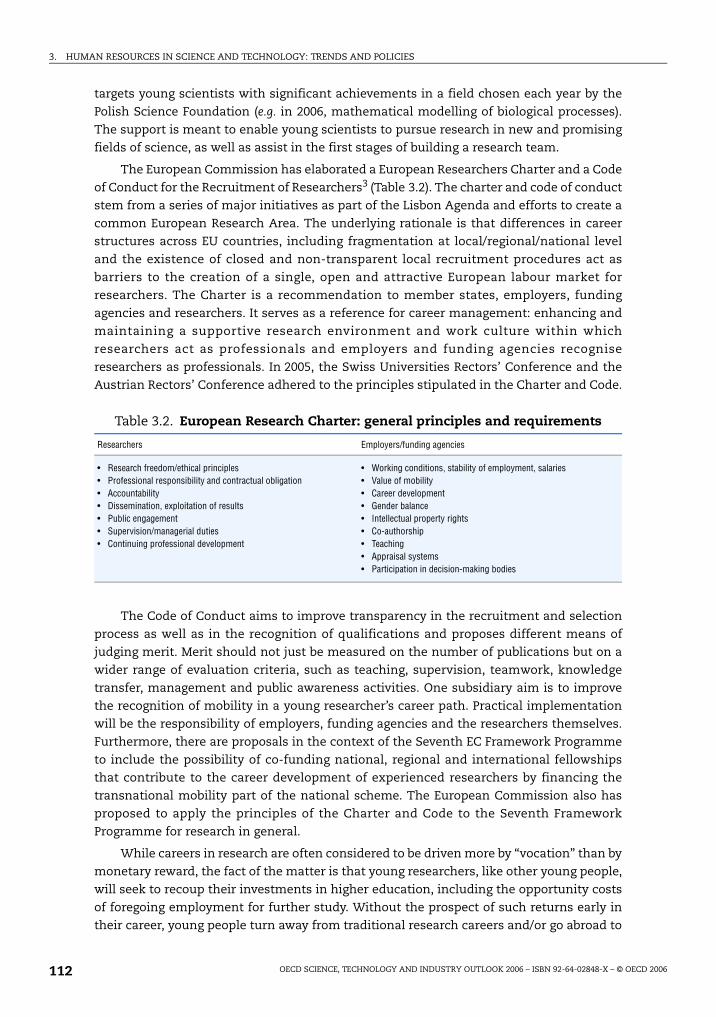
3. HUMAN RESOURCES IN SCIENCE AND TECHNOLOGY: TRENDS AND POLICIES
targets young scientists with significant achievements in a field chosen each year by the
Polish Science Foundation (e.g. in 2006, mathematical modelling of biological processes).
The support is meant to enable young scientists to pursue research in new and promising
fields of science, as well as assist in the first stages of building a research team.
The European Commission has elaborated a European Researchers Charter and a Code
of Conduct for the Recruitment of Researchers3 (Table 3.2). The charter and code of conduct
stem from a series of major initiatives as part of the Lisbon Agenda and efforts to create a
common European Research Area. The underlying rationale is that differences in career
structures across EU countries, including fragmentation at local/regional/national level
and the existence of closed and non-transparent local recruitment procedures act as
barriers to the creation of a single, open and attractive European labour market for
researchers. The Charter is a recommendation to member states, employers, funding
agencies and researchers. It serves as a reference for career management: enhancing and
maintaining a supportive research environment and work culture within which
researchers act as professionals and employers and funding agencies recognise
researchers as professionals. In 2005, the Swiss Universities Rectors’ Conference and the
Austrian Rectors’ Conference adhered to the principles stipulated in the Charter and Code.
The Code of Conduct aims to improve transparency in the recruitment and selection
process as well as in the recognition of qualifications and proposes different means of
judging merit. Merit should not just be measured on the number of publications but on a
wider range of evaluation criteria, such as teaching, supervision, teamwork, knowledge
transfer, management and public awareness activities. One subsidiary aim is to improve
the recognition of mobility in a young researcher’s career path. Practical implementation
will be the responsibility of employers, funding agencies and the researchers themselves.
Furthermore, there are proposals in the context of the Seventh EC Framework Programme
to include the possibility of co-funding national, regional and international fellowships
that contribute to the career development of experienced researchers by financing the
transnational mobility part of the national scheme. The European Commission also has
proposed to apply the principles of the Charter and Code to the Seventh Framework
Programme for research in general.
While careers in research are often considered to be driven more by “vocation” than by
monetary reward, the fact of the matter is that young researchers, like other young people,
will seek to recoup their investments in higher education, including the opportunity costs
of foregoing employment for further study. Without the prospect of such returns early in
their career, young people turn away from traditional research careers and/or go abroad to
Table 3.2. European Research Charter: general principles and requirements
Researchers Employers/funding agencies
• Research freedom/ethical principles• Professional responsibility and contractual obligation• Accountability• Dissemination, exploitation of results• Public engagement• Supervision/managerial duties• Continuing professional development
• Working conditions, stability of employment, salaries• Value of mobility• Career development• Gender balance• Intellectual property rights• Co-authorship• Teaching• Appraisal systems• Participation in decision-making bodies
OECD SCIENCE, TECHNOLOGY AND INDUSTRY OUTLOOK 2006 – ISBN 92-64-02848-X – © OECD 2006112

3. HUMAN RESOURCES IN SCIENCE AND TECHNOLOGY: TRENDS AND POLICIES
countries where working conditions and career prospects are more attractive. At the same
time, the research profession is also one where non-monetary values such as
independence and academic freedom are important. These non-monetary values must not
be neglected in efforts to make research an attractive career.
Policy initiatives in non-member economies
Non-member economies that invest in R&D and innovation also focus attention on
HRST. As noted in Chapter 1, non-OECD countries account for a growing share of the
world’s supply of S&E graduates. While some of the policy challenges in this area are quite
different from those faced by OECD countries, others are quite similar (Box 3.5).
Policies to foster the international mobility of researchers
An increasing number of OECD and non-member countries implement measures to
attract foreign students and to facilitate their access to the labour market. Foreign students
are a potentially highly qualified reserve of workers who are familiar with the host
country’s rules and conditions. The traditional immigration countries have, within the
general framework of their migration legislation, developed specific policies to promote
temporary residence (European countries) or permanent residence (Australia, Canada) of
foreign HRST, both students and workers (Table 3.3). In January 2002, the UK government
launched the Highly Skilled Migrant Programme to allow highly skilled workers to enter the
United Kingdom without a prior offer of employment. The science and engineering scheme
was set up in October 2004 to allow graduates of UK universities who are not citizens of the
European Economic Area to seek work in the United Kingdom for one year after graduation.
France has established a “scientific visa” that is not subject to labour market testing.
In 2006, Germany immediately granted permanent residence and permission to work to
researchers and other qualified workers with concrete job offers. The new rules continue a
process of liberalising immigration rules. Germany has also made its labour market more
accessible to foreign students. Foreign graduates of German universities will have a year to
look for work in the country if they wish to stay. Previously, it was quite difficult for such
students to remain in Germany upon completion of their studies. This provision is seen as a
way to keep highly skilled researchers in the country. At EU level, a European directive and two
associated recommendations were adopted in October 2005 to substantially ease the
admission of third-country nationals to carry out research in the European Community.
Member states are to transpose the directive into national legislation by autumn 2007 and a
plan to foster rapid uptake has been put in place. Norway adopted a fast-track immigration
scheme in 2002, easing foreign experts’ access to the labour market. In 2005, there was a slight
relaxation of the rules relating to the amount of time researchers who stay in Norway through
this scheme can spend abroad. In 2005, around 1 200 persons were granted a stay in Norway
through this quota. A maximum of 5 000 persons a year may enter Norway under this scheme.
In 2005, Norway established a virtual mobility portal to promote outbound and
inbound researcher mobility. The portal is part of a European network of national
researcher mobility portals. Norwegian universities and university colleges are obliged to
publish information about all vacant academic positions on the portal. In addition, the
Research Council of Norway has opened a mobility centre to help foreign researchers plan
their stay in Norway and facilitate their arrival.
OECD SCIENCE, TECHNOLOGY AND INDUSTRY OUTLOOK 2006 – ISBN 92-64-02848-X – © OECD 2006 113

3. HUMAN RESOURCES IN SCIENCE AND TECHNOLOGY: TRENDS AND POLICIES
Box 3.5. Policies to promote human resources in S&Tin non-member economies
China: As the world’s second largest producer of graduates in science and engineering,China has a range of programmes to raise awareness of and interest in science amongyouth, including one that involves the mentoring of young boys and girls by thousands ofretired school teachers. The current policy focus is on improving curricula and the qualityof science education at all levels. The government is also focusing on developing non-S&Tskills necessary for innovation, including entrepreneurship and management skills, and isimplementing new curricula and programmes in this direction.
Russian Federation: With 621 higher education establishments and 831 scientificorganisations offering postgraduate and doctoral programmes, Russia possesses asignificant capacity for training scientists and engineers. There are currently over142 700 postgraduate students and about 4 500 doctoral candidates. However, the past fewyears have witnessed a number of negative trends, such as rising dropout rates amonggraduate students (up to 30% across all disciplines). Furthermore, large numbers ofuniversity graduates (from 5% to 25% depending on the field) choose to go abroad to workor to find jobs in non-technological professions (management, business, etc.). At the sametime, the professional status of a university degree is changing, as it is gradually losing itsrole as a criterion for professional researchers. The policy response has been toconcentrate resources for the education of researchers on the country’s leading academicand scientific institutions. Plans also call for promoting the educational function ofRussia’s scientific research organisations and for the integration of graduate degreeprogrammes across Russia’s leading universities. In addition, certain research institutes ofthe academies of sciences will be assigned to the country’s leading universities. Thesemeasures aim to enhance the quality of Russian graduate programmes by fostering closerlinks between scientific research and graduate education.
South Africa: To raise awareness of science among youth, the Department of Scienceand Technology of South Africa developed a draft Youth into Science Strategy (2005-09)which seeks to strengthen efforts to develop high skills levels among school-age youth andunder-graduates. The strategy aims to enhance science and technology literacy among thepublic in general and the youth in particular, and to nurture young talent for science andtechnology-based careers. South Africa is also preparing a policy to raise women’sparticipation. The policy on women in science engineering and technology (SET) willinclude three sections: SET by Women; SET for Women; and Monitoring and Evaluation ofGender in the National System of Innovation. The policy aims to address the low level ofwomen’s participation in the natural sciences and engineering, the feminisation of someaspects of the health sciences, low numbers of women professors, low publication outputof women in SET, and the lack of attention to women’s specific needs regarding thedifferential impact of SET research and innovation on women and men.
Chinese Taipei: Chinese Taipei has a number of measures to stimulate the supply ofHRST. In 2004 the Ministry of Education increased the number of scholarships for overseasstudy by 46% over the previous year. It also increased the quota of university teachers andstudent enrolments in subjects such as electronics, ICT and opto-electronics. Thegovernment has also set up a programme to help students to complete Master’s degreesover a shorter period in order to address shortages of qualified researchers in high-technology industries.
Source: STI Outlook Questionnaire, 2006.
OECD SCIENCE, TECHNOLOGY AND INDUSTRY OUTLOOK 2006 – ISBN 92-64-02848-X – © OECD 2006114

3. HUMAN RESOURCES IN SCIENCE AND TECHNOLOGY: TRENDS AND POLICIES
Since 2004, Switzerland has been fully associated with the EU’s Sixth Framework
programme. Swiss researchers are now able to benefit from the mobility programmes of
the EU, and foreign students and researchers are encouraged to study and work in
Switzerland. Moreover, several bilateral agreements have been reached on research
exchanges. There are initiatives on the institutional level to increase international
mobility. An example is the international PhD programme of EMPA (a research institute for
material science and technology) in co-operation with Warsaw University (established in
April 2005). A specific grant programme supports joint doctoral degrees of Swiss and
French or Swiss and Italian universities. It is administered by the Swiss Universities
Rectors’ Conference and was re-launched in 2001 after an intermediate break for
evaluation.
Table 3.3. Policies to facilitate international mobility of researchand other skilled workers
Policy goals Measures/programmes
Meet shortage of specialty occupations(e.g. medical, doctors, software engineers)
Special immigration visas (France, Ireland, Germany, United Kingdom, United States)
Promote young researcher mobility Access by foreign students/researchers to national PhD fellowshipsand post-doctorates (Australia, Germany, Japan, Italy, Sweden, United States,United Kingdom, European Commission Marie Curie Actions)
Attract foreign and expatriate researchers Fellowships for mid-career and senior researchers (Japan); targeted fellowshipsand reintegration grants (Australia, Austria, Belgium, Italy, France, Greece, Hungary, Poland, Spain, European Commission Marie Curie Actions)
Retain foreign students Facilitate access to the labour market by allowing foreign students to change their visa status (United Kingdom, Germany, United States).
Box 3.6. International mobility of researchers in the public research sector: Germany (Max Planck Society) and France (CNRS)
Germany
The Max Planck Society, with an annual budget of EUR 1.3 billion, runs 78 researchinstitutes and units. It is also very internationalised:
● Of the 260 scientific directors, 70 are foreign citizens, representing 24 countries,although more than half previously worked in the United States.
● Of the 4 300 staff scientists, 26% are foreigners.
● Of the 10 900 junior and guest scientists, about 50% are foreigners
France
In 2003, 70% of National Centre for Scientific Research (CNRS) researchers workingabroad worked in Europe. Of these, 54.5% worked in other EU15 countries. Germany hasbecome the first destination of CNRS researchers, ahead of the United States. In 2003,CNRS researchers participated in 4 800 missions to Germany. Furthermore:
● 12% of tenured CNRS researchers are foreign nationals, of whom 54% are nationals ofanother EU country.
● Each year the CNRS hosts 400 high-level European researchers for stays ranging from6 months to 1 year.
● Each year the CNRS hosts more than 1 500 European post-docs and 650 foreignEuropean PhDs.
Source: STI Outlook Questionnaire, 2006 ; Max Planck Society, 2006.
OECD SCIENCE, TECHNOLOGY AND INDUSTRY OUTLOOK 2006 – ISBN 92-64-02848-X – © OECD 2006 115

3. HUMAN RESOURCES IN SCIENCE AND TECHNOLOGY: TRENDS AND POLICIES
The Swiss SNF professorships provide for a personal salary (comparable to that of an
assistant professor), a research grant and a contribution to infrastructure costs to
encourage highly qualified scientists to return to Switzerland. International mobility of
highly skilled personnel is also fostered by the four Swiss Houses in Boston, San Francisco,
Singapore and Shanghai. The Swiss universities belong to the European network of
mobility centres (ERA-MORE).
Fellowships are also used to attract foreign researchers. In Japan, the Japan Society for
the Promotion of Science (JSPS), an independent administrative institution under the
MEXT, has offered fellowships for young foreign researchers, the Post-doctoral Fellowships
for Foreign Researchers to Study in Japan. The target group is young foreign researchers
(post-docs) who wish to do research in Japanese universities or public research institutes
and foreign students who will soon get a PhD degree from Japanese universities.
Most PhD and post-doc fellowships offered in EU countries are open to foreigners,
although some give preference to EU citizens. Japan provides fellowships to foreign PhD
students as well as short-term fellowships to mid-career and senior researchers. Several
former emigration countries, including Greece, Hungary, and Poland have recently created
“reintegration” fellowships to facilitate access to employment in public research for
returning researchers. The Marie Curie Actions of the European Commission also aim to
attract foreign researchers (both early-stage and experienced) and encourage the return and
reintegration of experienced researchers. However, many of these initiatives provide funding
for a limited time after which the researcher must leave or find regular employment.
Beyond the focus on recruiting foreign talent and expatriates, temporary outward
migration of young researchers remains a concern of HRST policies in OECD countries,
especially in catching-up countries with limited capacity for advanced research training.
Greece, Mexico as well as Poland and the Slovak Republic maintain fellowships for PhD
study abroad as well as programmes to encourage young researchers to carry out further
training abroad.
Box 3.7. International Chairs for Research Excellence
The French Research Ministry will fund ten research chairs for young researchersrecognised at the international level at around EUR 250 000 per chair over a three-yearperiod, of which EUR 150 000 is provided the first year. These young researchers will have theopportunity to recruit four collaborators (post-doctorates, CIFRE fellows or foreign students).The ten chairs would be eligible to apply for the positions of principal investigator (chargé derecherche) or lecturer (maître de conferences). The ministry will also fund five additionalchairs to recruit world-class senior researchers. They will be able to develop researchprojects on future-oriented issues but will be responsible for ensuring the funding and thelongevity of the projects. To help with start-up costs, the ministry has set aside grants of EUR500 000 over three years of which EUR 300 000 will be disbursed the first year. These world-class researchers will also receive research support in the form of access to 12 support staff.They are also eligible to seek employment as full professor or director of research. Throughthis programme, 70 applications were received and 15 eminent scientists, of which sevenAmericans, were chosen to join the French scientific community during the last quarterof 2004. Of the 15, ten are working in CNRS national laboratories across France.
Source: STI Outlook Questionnaire, 2006.
OECD SCIENCE, TECHNOLOGY AND INDUSTRY OUTLOOK 2006 – ISBN 92-64-02848-X – © OECD 2006116
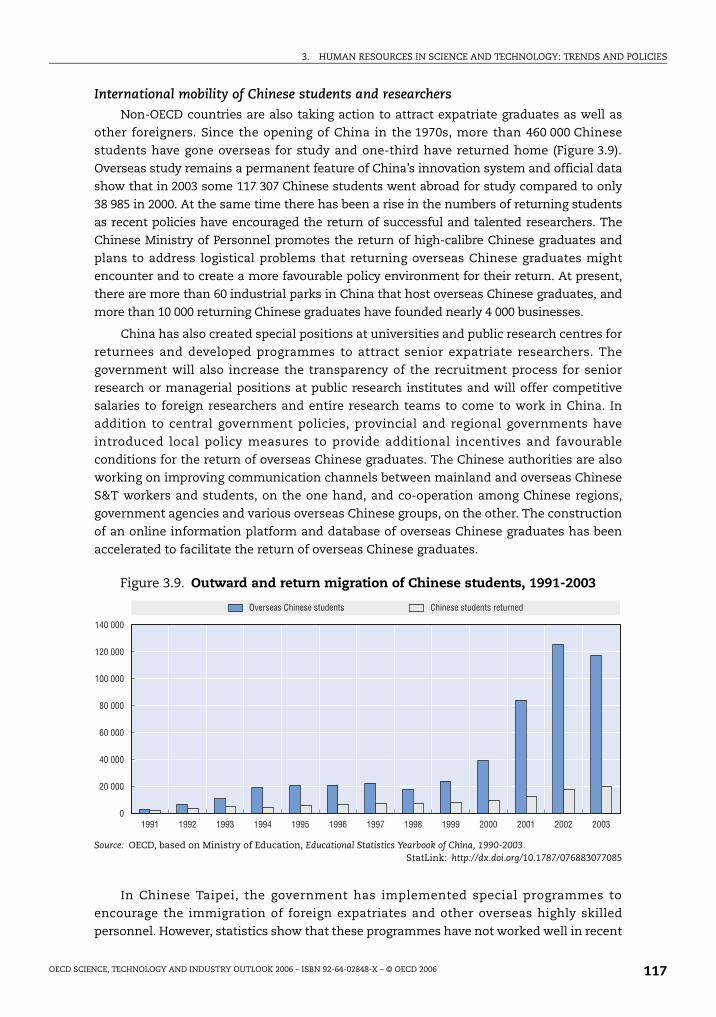
3. HUMAN RESOURCES IN SCIENCE AND TECHNOLOGY: TRENDS AND POLICIES
International mobility of Chinese students and researchers
Non-OECD countries are also taking action to attract expatriate graduates as well as
other foreigners. Since the opening of China in the 1970s, more than 460 000 Chinese
students have gone overseas for study and one-third have returned home (Figure 3.9).
Overseas study remains a permanent feature of China’s innovation system and official data
show that in 2003 some 117 307 Chinese students went abroad for study compared to only
38 985 in 2000. At the same time there has been a rise in the numbers of returning students
as recent policies have encouraged the return of successful and talented researchers. The
Chinese Ministry of Personnel promotes the return of high-calibre Chinese graduates and
plans to address logistical problems that returning overseas Chinese graduates might
encounter and to create a more favourable policy environment for their return. At present,
there are more than 60 industrial parks in China that host overseas Chinese graduates, and
more than 10 000 returning Chinese graduates have founded nearly 4 000 businesses.
China has also created special positions at universities and public research centres for
returnees and developed programmes to attract senior expatriate researchers. The
government will also increase the transparency of the recruitment process for senior
research or managerial positions at public research institutes and will offer competitive
salaries to foreign researchers and entire research teams to come to work in China. In
addition to central government policies, provincial and regional governments have
introduced local policy measures to provide additional incentives and favourable
conditions for the return of overseas Chinese graduates. The Chinese authorities are also
working on improving communication channels between mainland and overseas Chinese
S&T workers and students, on the one hand, and co-operation among Chinese regions,
government agencies and various overseas Chinese groups, on the other. The construction
of an online information platform and database of overseas Chinese graduates has been
accelerated to facilitate the return of overseas Chinese graduates.
In Chinese Taipei, the government has implemented special programmes to
encourage the immigration of foreign expatriates and other overseas highly skilled
personnel. However, statistics show that these programmes have not worked well in recent
Figure 3.9. Outward and return migration of Chinese students, 1991-2003
Source: OECD, based on Ministry of Education, Educational Statistics Yearbook of China, 1990-2003.StatLink: http://dx.doi.org/10.1787/076883077085
0
20 000
40 000
60 000
80 000
100 000
120 000
140 000
1991 1992 1993 1994 1995 1996 1997 1998 1999 2000 2001 2002 2003
Overseas Chinese students Chinese students returned
OECD SCIENCE, TECHNOLOGY AND INDUSTRY OUTLOOK 2006 – ISBN 92-64-02848-X – © OECD 2006 117

3. HUMAN RESOURCES IN SCIENCE AND TECHNOLOGY: TRENDS AND POLICIES
years. In January 2005, the government approved a plan to liberalise existing regulations on
the recruitment of overseas personnel and has plans for a number of measures, including
the provision of scholarships for overseas studies; exemption of military service for young
students studying abroad; incentives for young second-generation overseas students to
return and work in Chinese Taipei; widening the area of overseas recruitment to include
India, Russia and eastern Europe; and reinforcing the “one-stop” service window for
overseas personnel coming to Chinese Taipei.
ConclusionsHuman resource issues are high on the policy agenda as demand for human resources
in science and technology continues to rise. The supply of S&T graduates continues to
expand in absolute terms, but between 1998 and 2002 Denmark, Italy, Germany, Hungary
and Finland experienced a drop in the share of university graduates with science and
engineering degrees, as did Korea and the United States. Further exacerbating the situation
in the United States is a decline in first-time, full-time enrolments of foreign PhD students,
which fell for the second consecutive year in 2003. Irrespective of recent declines, EU
countries still produce a greater share of S&T graduates than Japan or the United States,
despite the lower share of researchers in the workforce: 27% of EU university graduates
obtain a science or engineering degree compared to 24% in Japan and just 16% in the
United States. The EU also produces more PhD graduates than the United States. Non-
member countries like China are increasingly developing a larger share of the world’s
supply of S&T graduates.
OECD countries and some non-member countries continue to take action to boost the
supply of scientists and engineers. Measures include reforming school curricula to make
science more accessible and attractive to young students; improving the quality of school
teaching in mathematics and science; and allowing students a chance to enter S&T studies
at later points in their education. Public/private partnerships between industry, tertiary
institutions and secondary schools are also being developed to improve student
performance, enhance the relevance of instruction and raise enrolments. At the graduate
level, countries are placing more emphasis on reducing the duration of PhD studies while
providing more supervision in order to reduce dropout rates. Improvements in mobility are
also seen as a way of matching supply and demand, especially for specific skills that are in
short supply. For non-OECD countries, overseas studies, especially at the PhD level, are still
an important vehicle for acquiring skills and research training, especially given the limited
capacity for higher education.
To provide a further boost to supplies of researchers, OECD countries are giving greater
attention to increasing the participation of women in science and technology. Women
account for some 30% of science and engineering graduates in OECD countries and for 25%
to 35% of researchers in most OECD countries, except Japan and Korea where they
comprise only 12%. While most researchers work in business, less than 18% of women
researchers in the EU and 6% in Japan work in the business sector, and they tend to be
concentrated in biology, health, agriculture, and pharmaceuticals. Just over one-third of US
university faculty are women. Policies to improve the participation of women in S&T range
from the use of quantitative targets for the share of women on scientific boards and in
senior positions to mentoring and networking initiatives and programmes to help women
re-enter the research workforce after taking parental leave.
OECD SCIENCE, TECHNOLOGY AND INDUSTRY OUTLOOK 2006 – ISBN 92-64-02848-X – © OECD 2006118

3. HUMAN RESOURCES IN SCIENCE AND TECHNOLOGY: TRENDS AND POLICIES
Both OECD and non-member countries are competing to attract foreign and expatriate
students and researchers. This competition is likely to increase in line with the
globalisation of R&D. Meanwhile, persistent concerns about shortfalls in national supply
will also focus attention on attracting foreign talent. As the growth of investments in R&D
and innovation capacity in non-member countries fuels demand for talent, it may modify
the migration paths of the highly skilled into more multi-directional patterns characterised
by emigration, return migration, re-emigration to a third country followed by return
migration, etc.
Policies to promote human resources in S&T should focus not only on increasing
supplies of graduates, but also on the demand side, especially in Europe where industry
employs fewer researchers than in the United States or Japan. Ensuring that framework
conditions foster mobility and academic entrepreneurship is a longstanding focus of
policies in OECD countries. Government incentives for business R&D also provide direct
and indirect support for job creation in research-intensive occupations. Further efforts to
improve mechanisms for commercialising research and conditions for company spin-offs
and business start-ups could also boost demand for S&T personnel, especially in the
services sector and in smaller firms.
Notes
1. This estimate does not include individual post-docs offered by institutions.
2. Data for the United States refer to “women scientists and engineers” as defined by the NationalScience Foundation. As such the data is not directly comparable with that of the European Unionwhich uses the Frascati Manual definition of “researchers”. The EU data is taken from the report,She Figures, 2006, published by the European Commission.
3. Recommendation of the European Commission to the member states, EC(2005)576 of11 March 2005.
Bibliography
Cruz, L. (2005), “The employment of PhDs in firms: trajectories, salaries and gender inequality”,presentation at the OECD Workshop on “Changing Supply and Demand for S&T Professionals in aGlobalised Economy”, 21 April, Paris, see www.oecd/org/sti/stpolicy.
Enders J. and C. Musselin (2005), “Back to the Future? Academic Professions in the 21st Century”,background paper for the OECD Expert Meeting on Demography and the Future of HigherEducation, Paris, 5-6 December.
European Commission (2004), “Inventory of Post-Doctorate Schemes in Europe”, unpublished report,Brussels.
European Commission (2005), “Recommendation of the Commission of the European CommunitiesEC(2005) 576 final”, Brussels, 11 March.
European Commission (2006), She Figures 2006: Women and Science; Statistics and Indicators, Brussels.
Husso, K. (2002), “Tohtoreiden työllistyminen, sijoittuminen ja liikkuvuus työmarkkinoilla.EsitelmäpaperiSuomen Akatemian ja opetusministeriön järjestämään ‘Tutkijanuran haasteita ja mahdollisuuksia’ –seminaariin”, Suomen Akatemia, Helsinki.
National Academies Press (2005), Committee on Science, Engineering, and Public Policy, PolicyImplications of International Graduate Students and Postdoctoral Scholars in the United States, Arlington,Virginia.
National Science Foundation, Division of Science Resources Statistics (2005), “Survey of GraduateStudents and Postdoctorates in Science and Engineering”, August.
National Science Foundation (2006), Science and Engineering Indicators, 2006.
OECD SCIENCE, TECHNOLOGY AND INDUSTRY OUTLOOK 2006 – ISBN 92-64-02848-X – © OECD 2006 119

3. HUMAN RESOURCES IN SCIENCE AND TECHNOLOGY: TRENDS AND POLICIES
OECD (2004), Education at a Glance OECD, Paris.
OECD (2005a), Science, Technology and Industry Scoreboard OECD, Paris.
OECD (2005b), Internationalisation of Higher Education OECD, Paris.
OECD (2005c), Summary Report of the OECD Workshop on Changing Supply and Demand for S&TProfessionals in a Globalised Economy, DSTI/STP/SFRI(2005)6 21 April 2005. Paris.
OECD (2006a), “Report on the Declining Interest in Science and Technology Studies Among YoungPeople”, internal working document, February.
OECD (2006b), Country responses to the SFRI Questionnaire on the Working Conditions andAttractiveness of Research Careers, internal working document.
Stephan, P. (2005), “Changing Career Paths of Young Scholars in the United States: Example of the LifeSciences”, presentation at the OECD Workshop on Changing Supply and Demand for S&TProfessionals in a Globalised Economy, 21 April, Paris, www.oecd/org/sti/stpolicy.
US Department of Education (2003), Staff in Postsecondary Institutions, Washington, DC.
OECD SCIENCE, TECHNOLOGY AND INDUSTRY OUTLOOK 2006 – ISBN 92-64-02848-X – © OECD 2006120

ISBN 92-64-02848-X
OECD Science, Technology and Industry Outlook 2006
© OECD 2006
Chapter 4
The Internationalisation of R&D
This chapter provides an overview of the increasing internationalisation of R&D andinnovation and analyses the drivers behind this trend. It presents available indicatorsrelated to the globalisation of inputs, outputs and trade of R&D and examines thechanging innovation strategies of multinational enterprises. It also considers thepolicy challenges and opportunities posed by R&D-internationalisation, and tracessome policy initiatives that have been undertaken by governments in OECD countries.
121

4. THE INTERNATIONALISATION OF R&D
IntroductionThe internationalisation of R&D is a key dimension of globalisation, with important
implications for economic development and public policy. It is not a totally new
phenomenon, since some R&D has been undertaken abroad for a long time. However,
cross-border R&D has traditionally been the corollary of foreign direct investment (FDI) and
until recently largely aimed at adapting technologies for sales in host countries.
Current R&D internationalisation has three distinguishing characteristics: it is taking
place at a much faster pace, it is spreading to an increasing number of countries, including
developing countries, and it involves R&D that extends beyond adapting technology to local
conditions. This chapter suggests that the last of these phenomena may represent a
distinctive new trend in the internationalisation of R&D. In the past, the evidence suggested
that major global firms kept their key technology creation activities – as evidenced by R&D
and patenting – close to their home bases. Now, however, they seem not only to seek to
exploit knowledge generated at home in other countries, but also to tap into worldwide
centres of knowledge. This implies genuinely international sourcing of knowledge.
Multinational enterprises (MNEs) play a major role in this process since they account
for the major share of global business R&D. Until recently, R&D was among the least
internationalised segments of MNEs’ value chains. While production, marketing and other
functions moved abroad quite quickly, R&D was considered one of the least “fragmentable”
economic activities because it involves knowledge that is strategic to firms, and because it
often has a tacit, non-transferable character. Consequently, firms by and large performed
R&D and undertook patenting in their home bases.
While corporate R&D activities still maintain a home-country bias – in the sense that
firms continue to carry out R&D predominately where their head offices are located – MNEs
are increasingly changing how they innovate and this involves building global distributed
R&D networks. Following the broader fragmentation of the value chain and the
corresponding internationalisation of manufacturing, MNEs increasingly establish R&D
facilities at many locations worldwide. This foreign technological activity increasingly
aims to tap into local knowledge and to provide further sources of new technology.
This chapter largely focuses on MNEs in order to identify trends and analyse drivers
behind the internationalisation of R&D. Multinationals are the leading players in the global
R&D landscape as they are the largest R&D investors: firms account for almost 70% of total
R&D expenditure in the OECD area and most is carried out by large firms. However,
innovation nowadays also requires cross-functional co-operation and interaction not only
within firms but also with external parties (customers, suppliers, universities and research
institutes for example). The focus on business should not detract from other important
aspects that complement the internationalisation of business R&D such as the
internationalisation of science and the international mobility of researchers. Successful
innovative firms are typically part of a system of formal and informal links with other
firms, public research institutions, universities and other knowledge-creating bodies.
OECD SCIENCE, TECHNOLOGY AND INDUSTRY OUTLOOK 2006 – ISBN 92-64-02848-X – © OECD 2006122

4. THE INTERNATIONALISATION OF R&D
Governments also play a role since policies for R&D, education and infrastructure affect the
structure and functioning of innovation systems.
To identify major trends, this chapter first looks at a number of observations and
indicators of the internationalisation of R&D and innovation (inputs, outputs and trade of
R&D); it should be noted however that countries’ data on cross-border R&D flows are often
incomplete and that it is difficult to compare and interpret them. There are also problems
of timeliness. The chapter then analyses the major drivers of the increasing
internationalisation of R&D and discusses factors relating to location of R&D centres
abroad. The internationalisation of R&D poses new policy challenges and opportunities for
governments, as foreign R&D has important impacts on countries’ economies and their
national innovation systems. These policy challenges range from attracting and retaining
R&D activity, to encouraging domestic firms to internationalise R&D, to capturing the
economic benefits from global R&D activities. Examples of how countries have tackled
these challenges are discussed in a final section.
Major trends in the internationalisation of R&D
The growing role of foreign affiliates in host countries’ R&D
The largest cross-border flows of R&D take place within the OECD area, mainly
between the three main regions, the United States, the European Union (here EU15) and
Japan. Figure 4.1 shows that in 2002 US multinationals placed over 61% of their foreign R&D
investment in the European Union (USD 12.9 billion) and 7% in Japan (USD 1.5 billion) while
the European Union invested USD 17.5 billion in the United States and USD 2.2 billion in
Japan. Whereas the United States was a net exporter of R&D to the EU in the late 1990s, the
situation changed in the early 2000s with more European firms establishing foreign R&D
affiliates in the United States than vice versa. Japan invested only 1.4 billion USD in the
United States and 0.7 billion in the EU.
These flows tend to be highly concentrated in sectoral terms. European R&D
investments in the United States are mainly in the chemical and pharmaceutical industry
(50%), computers and electronics (13%) and petroleum distribution (10 %). On the other
hand, investment by US multinationals in the European Union essentially involves three
sectors: automobile (33%), the pharmaceutical industry (26%) and computers and
electronics (14%). Japanese R&D investments in the United States are concentrated in
services (69%), especially in wholesale trade and professional/scientific services, rather
than in manufacturing (31%). The United States’ R&D investment in Japan is essentially in
the pharmaceutical industry (63%) and computers (20 %).
Figure 4.1. R&D flows between EU15, the United States and Japan, 2002Millions of PPP USD
Source: OECD, AFA Database and OECD estimates.
1 452
17 554 720
12 941 2 239
1 541
USATotal business sector
193 868
EUTotal business sector
127 802
JapanTotal business sector
80 582
OECD SCIENCE, TECHNOLOGY AND INDUSTRY OUTLOOK 2006 – ISBN 92-64-02848-X – © OECD 2006 123

4. THE INTERNATIONALISATION OF R&D
Increasing R&D investments abroad by MNEs have resulted in the growing role of
foreign affiliates in host countries’ R&D. Between 1995 and 2003, R&D expenditure by
foreign-controlled affiliates in OECD countries rose by USD 36.5 billion in purchasing power
parity (PPP) dollars. Within the OECD, these flows are also geographically concentrated.
Although its share slightly decreased over the period 1995-2003, the United States
continues to attract the largest share of R&D expenditure by foreign affiliates in the OECD
area (41.9%). Other countries that attract important R&D investments of foreign MNEs, are
Germany, the United Kingdom and, to a lesser extent, Japan, France and Canada
(Figure 4.2). The three largest EU R&D performers (Germany, the United Kingdom and
France) together attract 37.4% of foreign R&D investments in the OECD area.
The growth of R&D investments by foreign affiliates in the manufacturing sector was
much higher than the corresponding growth by domestically controlled firms, except in
Spain, (Figure 4.3). In the United Kingdom, Sweden and the Netherlands, only R&D
expenditure of foreign-controlled affiliates grew rapidly, while that of domestically
controlled firms declined. It is because of R&D investment by foreign affiliates that the
overall growth of business R&D in these three countries has not been negative. The
difference in trends may be due to choices between mergers and acquisitions and greenfield
investments when setting up R&D facilities abroad; however detailed data for analysing
these trends empirically are not available (see also below). In addition, the figures do not
include collaboration between firms, which has been increasing (see Box 4.1).
These different growth patterns have resulted in an increasing share of foreignaffiliates in countries’ business R&D expenditures. Except in Spain and Turkey, the“foreign” share of R&D investments increased substantially during the period 1995-2003(Figure 4.4). In OECD countries such as Ireland, Belgium and Hungary, foreign affiliates nowplay a major role in national R&D investments. Smaller countries seem to report larger
Figure 4.2. Trends in the share of R&D expenditure under foreign controlin the business sector in selected OECD countries between 1995 and 2003
PPP USD
1. The Czech Republic, Finland, Hungary, Ireland, Poland, the Netherlands and Sweden.Source: OECD, AFA Database and OECD estimates.
StatLink: http://dx.doi.org/10.1787/166422501773
05
1015202530354045505560657075
1995 2003
Billion USD
33.9 billion USD
70.6 billion USD
5.8% 4.9%
8.9% 12.3%
12.8%5.2%2.2%7.7%
51.7%10.0%
8.7%
41.8%
14.3%
13.9%
Other OECD1
United Kingdom
Canada
Germany
France
United States
Japan
OECD SCIENCE, TECHNOLOGY AND INDUSTRY OUTLOOK 2006 – ISBN 92-64-02848-X – © OECD 2006124

4. THE INTERNATIONALISATION OF R&D
shares; this may be due to a combination of smaller domestic R&D bases and proactivemeasures and favourable conditions for the attraction of FDI and accompanying R&D.However, in some (larger) countries, the share of R&D conducted by foreign affiliates is alsohigh; it exceeds 40% in the Czech Republic, Sweden, the United Kingdom and Australia.
The importance of foreign MNEs in host countries’ R&D has raised concerns about thedependency and vulnerability of the local R&D base (OECD, 2005a). These concerns aregreater in countries such as Ireland and Hungary where the ratios of R&D expenditure toturnover are higher in foreign affiliates than in domestically controlled firms (Figure 4.5),an indication of the latter’s relative lack of investment in R&D. There is some evidence thatfirms in these countries tend to buy the bulk of their technology abroad rather thandevelop it at home. In both Hungary and Ireland, technological payments (licences,patents, know-how, technical assistance, studies, R&D, etc.) are far higher than the R&Dexpenditure of enterprises in general (see also below).
Figure 4.3. Growth of R&D expenditures of affiliates under foreign controland firms controlled by the compiling country between 1995 and 2003
in selected OECD countriesIn constant PPP (2000)
Note: Finland: 1997-2003; Netherlands: 1997-2002; Portugal: 1999-2003.Source: OECD, AFA Database.
StatLink: http://dx.doi.org/10.1787/660362414141
-50
0
50
100
150
200
Canada France Germany Japan United Kingdom United States
%
435
Firms controlled by the compiling countryAffiliates under foreign control
% Firms controlled by the compiling countryAffiliates under foreign control
-50
0
50
100
150
200
Ireland Spain Sweden Finland Portugal Netherlands
242
OECD SCIENCE, TECHNOLOGY AND INDUSTRY OUTLOOK 2006 – ISBN 92-64-02848-X – © OECD 2006 125
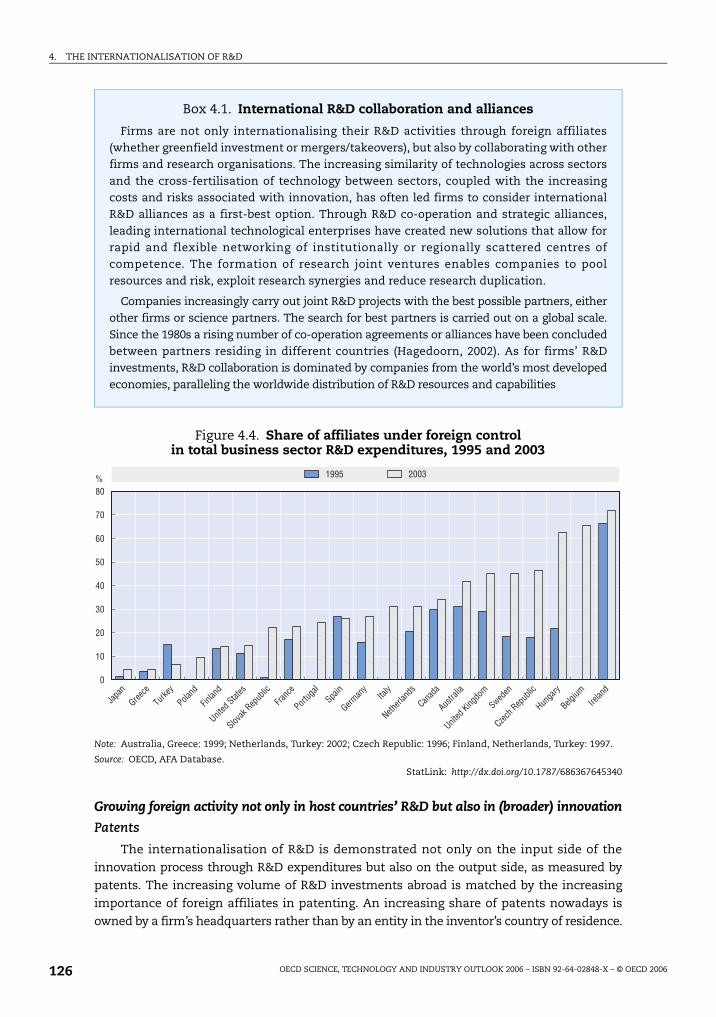
4. THE INTERNATIONALISATION OF R&D
Growing foreign activity not only in host countries’ R&D but also in (broader) innovation
Patents
The internationalisation of R&D is demonstrated not only on the input side of the
innovation process through R&D expenditures but also on the output side, as measured by
patents. The increasing volume of R&D investments abroad is matched by the increasing
importance of foreign affiliates in patenting. An increasing share of patents nowadays is
owned by a firm’s headquarters rather than by an entity in the inventor’s country of residence.
Box 4.1. International R&D collaboration and alliances
Firms are not only internationalising their R&D activities through foreign affiliates(whether greenfield investment or mergers/takeovers), but also by collaborating with otherfirms and research organisations. The increasing similarity of technologies across sectorsand the cross-fertilisation of technology between sectors, coupled with the increasingcosts and risks associated with innovation, has often led firms to consider internationalR&D alliances as a first-best option. Through R&D co-operation and strategic alliances,leading international technological enterprises have created new solutions that allow forrapid and flexible networking of institutionally or regionally scattered centres ofcompetence. The formation of research joint ventures enables companies to poolresources and risk, exploit research synergies and reduce research duplication.
Companies increasingly carry out joint R&D projects with the best possible partners, eitherother firms or science partners. The search for best partners is carried out on a global scale.Since the 1980s a rising number of co-operation agreements or alliances have been concludedbetween partners residing in different countries (Hagedoorn, 2002). As for firms’ R&Dinvestments, R&D collaboration is dominated by companies from the world’s most developedeconomies, paralleling the worldwide distribution of R&D resources and capabilities
Figure 4.4. Share of affiliates under foreign controlin total business sector R&D expenditures, 1995 and 2003
Note: Australia, Greece: 1999; Netherlands, Turkey: 2002; Czech Republic: 1996; Finland, Netherlands, Turkey: 1997.
Source: OECD, AFA Database.StatLink: http://dx.doi.org/10.1787/686367645340
0
10
20
30
40
50
60
70
80% 20031995
Japa
n
Greece
Turke
y
Poland
Finlan
d
United
States
Slovak
Repub
licFra
nce
Portug
alSpa
in
German
yIta
ly
Netherl
ands
Canad
a
Austra
lia
United
Kingdo
m
Sweden
Czech R
epub
lic
Hunga
ry
Belgium
Irelan
d
OECD SCIENCE, TECHNOLOGY AND INDUSTRY OUTLOOK 2006 – ISBN 92-64-02848-X – © OECD 2006126

4. THE INTERNATIONALISATION OF R&D
Patent data are considered a unique, broadly available and reliable source of statistical
material (OECD, 2005b). Patents can be used to study internationalisation over a long period
and a large sample of firms and sectors. The main disadvantage of patent statistics is that
they fail to capture all innovative activity as not all innovations are patented and not all
patents lead to innovations.
On average, 15.8% of all patented inventions at the European Patent Office (EPO) were
owned or co-owned by a foreign resident in 2000-02, a significant increase from 1990-92
(10.8%). For a majority of reported countries, the share of patents owned (or co-owned) by
a foreign resident was higher in 2000-02 than in the early 1990s (Figure 4.6).
Foreign ownership of domestic inventions is particularly high in Luxembourg, the
Russian Federation, Hungary and Singapore, where 50% or more of domestic inventions
filed at the EPO are owned or co-owned by a foreign resident. Japan, Korea and Finland are
much less internationalised; less than 10% of their patents filed at the EPO are foreign-
owned. In the case of Japan and Korea, possible reasons for low foreign ownership include
linguistic barriers and the low penetration of foreign affiliates.
During the 1990s, there has also been a considerable increase in the share of domestic
ownership of inventions made abroad. This share increased from 10.8% of all EPO patents
in 1990-92 to 15.8% in 2000-2002. Again, for the majority of reported countries, the share of
domestic ownership of inventions made abroad is higher in 2000-02 than in 1990-92. Notable
exceptions are Korea, the Netherlands, New Zealand, Spain and South Africa (Figure 4.7).
There is a high level of domestic ownership of inventions made abroad in small, open
economies. For example, close to 80% of all inventions owned by residents of Luxembourg
were made abroad. This share is also high in Switzerland (48.7%) and Ireland (48.0%). Japan,
Korea, Italy and Spain are the least internationalised with respect to domestic ownership
of inventions made abroad.
Figure 4.5. R&D intensity of affiliates under foreign control and firms controlledby the compiling countries, 2003
Source: OECD, AFA Database.StatLink: http://dx.doi.org/10.1787/442804035870
0
0.5
1.0
1.5
2.0
2.5
3.0
3.5
Firms controlled by the compiling countriesAffiliates under foreign control
Poland
Hunga
ry
Turke
y
Greece
Irelan
d
Portug
al
Slovak
Repub
lic
Austra
liaItaly
Czech R
epub
licSpa
in
Canad
a
Netherl
ands
United
Kingdo
mFra
nce
German
y
Belgium
United
States
Sweden
Japa
n
Finlan
d
OECD SCIENCE, TECHNOLOGY AND INDUSTRY OUTLOOK 2006 – ISBN 92-64-02848-X – © OECD 2006 127
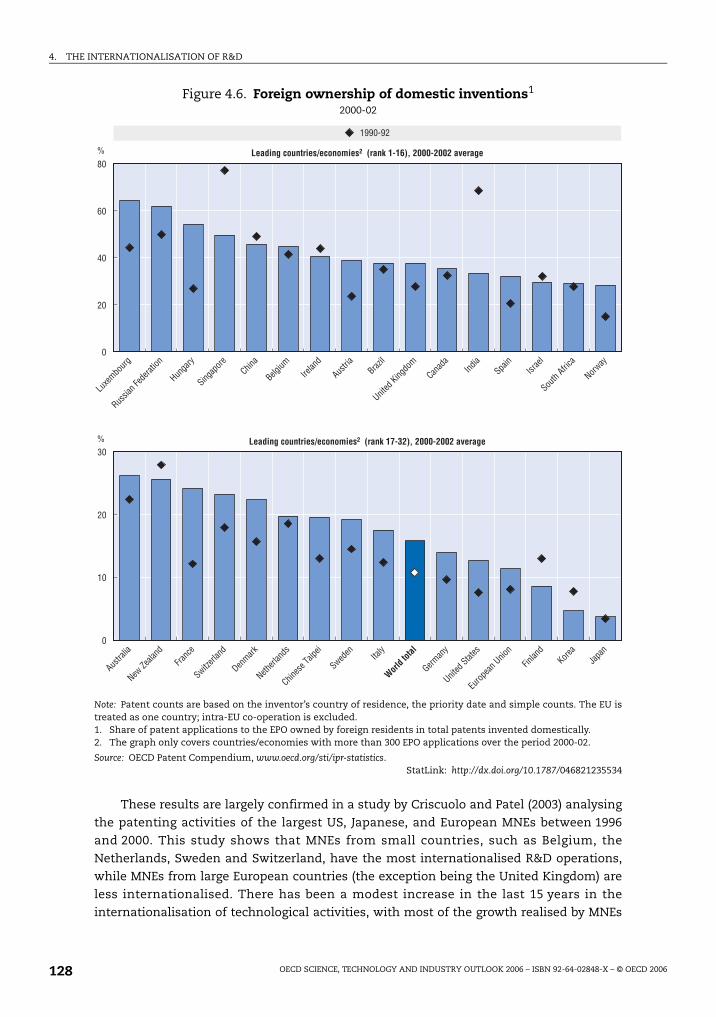
4. THE INTERNATIONALISATION OF R&D
These results are largely confirmed in a study by Criscuolo and Patel (2003) analysing
the patenting activities of the largest US, Japanese, and European MNEs between 1996
and 2000. This study shows that MNEs from small countries, such as Belgium, the
Netherlands, Sweden and Switzerland, have the most internationalised R&D operations,
while MNEs from large European countries (the exception being the United Kingdom) are
less internationalised. There has been a modest increase in the last 15 years in the
internationalisation of technological activities, with most of the growth realised by MNEs
Figure 4.6. Foreign ownership of domestic inventions1
2000-02
Note: Patent counts are based on the inventor’s country of residence, the priority date and simple counts. The EU istreated as one country; intra-EU co-operation is excluded.1. Share of patent applications to the EPO owned by foreign residents in total patents invented domestically.2. The graph only covers countries/economies with more than 300 EPO applications over the period 2000-02.
Source: OECD Patent Compendium, www.oecd.org/sti/ipr-statistics.StatLink: http://dx.doi.org/10.1787/046821235534
0
20
40
60
80%
Luxe
mbourg
Russia
n Fed
eratio
n
Hunga
ry
Singap
oreChin
a
Belgium
Irelan
d
Austria
Brazil
United
Kingdo
mCan
ada
India
Spain
Israe
l
South
Africa
Norway
1990-92
0
10
20
30%
Austra
lia
New Ze
aland
Franc
e
Switzerl
and
Denmark
Netherl
ands
Chines
e Taip
ei
Sweden Ita
ly
World t
otal
German
y
United
States
Europ
ean U
nion
Finlan
dKore
aJa
pan
Leading countries/economies2 (rank 1-16), 2000-2002 average
Leading countries/economies2 (rank 17-32), 2000-2002 average
OECD SCIENCE, TECHNOLOGY AND INDUSTRY OUTLOOK 2006 – ISBN 92-64-02848-X – © OECD 2006128

4. THE INTERNATIONALISATION OF R&D
from small European countries. At the same time, the study suggests that home-based
technological activities of large firms from large countries continue to have a significant
influence on the R&D activities of their home countries.
Technology balance of payments
The internationalisation of R&D can also be gauged by the evolution of countries’
technology balance of payments (TBP), because technology payments and receipts
represent to some extent the trade in R&D outcomes across borders. The technology
Figure 4.7. Domestic ownership of inventions made abroad1
2000-02
Note: Patent counts are based on the applicant’s country of residence, the priority date and simple counts. The EU istreated as one country; intra-EU co-operation is excluded.1. Share of patent applications to the EPO invented abroad in total patents owned by country residents.2. The graph only covers countries/economies with more than 200 EPO applications over the period 2000-02.
Source: OECD Patent Compendium, www.oecd.org/sti/ipr-statistics.StatLink: http://dx.doi.org/10.1787/837285471075
0
20
40
60
80%
1990-92
Luxe
mbourg
Switzerl
and
Irelan
d
Netherl
ands
Singap
ore
Belgium
Sweden
Austria
Canad
a
Finlan
dChin
a
Norway
Franc
e
United
Kingdo
m
Denmark
United
States
%
0
5
10
15
20
Hunga
ry
South
Africa
Russia
n Fed
eratio
n
World t
otal
New Ze
aland
German
y
Chines
e Taip
eiIsr
ael
Austra
liaBraz
ilInd
ia
Europ
ean U
nion
Spain
Italy
Korea
Japa
n
Leading countries/economies2 (rank 1-16), 2000-2002 average
Leading countries/economies2 (rank 17-32), 2000-2002 average
OECD SCIENCE, TECHNOLOGY AND INDUSTRY OUTLOOK 2006 – ISBN 92-64-02848-X – © OECD 2006 129

4. THE INTERNATIONALISATION OF R&D
balance of payments measures disembodied international technology transfers: licences,
patents, know-how, research and technology assistance. In most OECD countries,
technological receipts and payments increased sharply during the 1990s.
Overall, the OECD area has maintained its position as a net exporter of technology
(Figure 4.8). The European Union, however, has continued to run a deficit on its technology
balance of payments. In Ireland, Hungary, the Czech Republic, Poland and Korea, the
technology balance of payments shows a significant deficit (Figure 4.9).
Although the balance reflects a country’s ability to sell its technology abroad and its use
of foreign technologies, a growing deficit does not necessarily indicate low competitiveness
in technology. In some cases, it results from increased imports of foreign technology; in
others, it is due to declining receipts. Likewise, if the balance is in surplus, it may be due to a
high degree of technological autonomy, a low level of technology imports or a lack of capacity
to assimilate foreign technologies. In addition, since most transactions also correspond to
operations between parent companies and affiliates, the valuation of the technology transfer
may be distorted. Therefore, additional qualitative and quantitative information is needed to
analyse correctly a country’s deficit or surplus position.
The financial transactions measured by TBP data encompass transactions between
different firms as well as within MNEs. However, it is important to note that transactions
within firms largely dominate. Hence TBP data mainly reflect international technology
transfers within MNEs’ R&D networks. The international R&D activities of MNEs not only
significantly affect R&D investments and patent activities in host countries, they also
influence to a large extent these countries’ technology balance of payments. For example,
Ireland’s deficit in technology payments is due to the strong presence of foreign affiliates
that import technology from their parent companies.
Figure 4.8. Changes in the technology balance of payments as a percentage of GDP
1. Including intra-area flows. EU 15 excluding Demark and Greece.2. OECD excluding Czech Republic, Denmark, Greece, Hungary, Iceland Poland the Slovak Republic and Turkey. Data
partially estimated
Source: OECD, Technology Balance of Payments.StatLink: http://dx.doi.org/10.1787/250335716246
-0.10
-0.05
0
0.05
0.10
0.15
0.20
0.25
0.30
United States Japan EU131 OECD221, 2
% 1993 2003
OECD SCIENCE, TECHNOLOGY AND INDUSTRY OUTLOOK 2006 – ISBN 92-64-02848-X – © OECD 2006130

4. THE INTERNATIONALISATION OF R&D
Increasing industrial R&D investments abroad by MNEs
The converse of the increase in inward R&D investment in host countries is the growth
of R&D investments abroad by multinational firms. As noted above, MNEs’ strategies until
recently kept R&D at home while globalising other operations, but a newer strategy sees
the world in terms of global technology sourcing. While data on outward R&D investment
are less readily available than data on inward R&D investment because most countries do
not undertake surveys relating to R&D activity by national firms’ affiliates abroad, there is
some direct and indirect evidence (see Box 4.2).
For countries for which data on outward investment are available in the AFA database,
Figure 4.10 shows that R&D performed abroad has increased since 1995 relative to R&D
performed at home. The only exception is Switzerland which has seen a slight reversal;
nevertheless Swiss affiliates abroad do as much research as all firms inside Switzerland.
Other countries show a smaller share of R&D investments abroad although the share is
over 20% in Germany, Finland and Sweden.
While these historical data may not allow for identifying the most recent trends, the
internationalisation of R&D is confirmed by some recent surveys. A survey of the largest
R&D investors, undertaken by UNCTAD from November 2004 to March 2005, suggests that
the pace of internationalising R&D may be accelerating (UNCTAD, 2005): as many as 69% of
responding firms stated that their share of foreign R&D is set to increase (only 2% indicated
a decline and the remaining 29% expected the level of internationalisation to remain
unchanged). Momentum appears to be particularly strong among companies in Japan and
Korea, which have so far been less aggressive in terms of internationalisation of R&D: nine
out of ten Japanese firms in the sample and about 80% of the Korean firms planned to
Figure 4.9. Technology balance of payments (receipts – payments)as a percentage of GDP, 2003
1. 19992. 20003. 20014. 1998
Source: OECD, Technology Balance of Payments.StatLink: http://dx.doi.org/10.1787/785667375774
0
0.5
1.0
1.5
2.0
2.5
%
New Ze
aland
1
Austra
lia4
Mexico
Spain4
Japa
n
Canad
a3
Slovak
Repub
lic3
Italy
Franc
e
Poland
2
United
States
Korea
Portug
al
Luxe
mbourg
Czech R
epub
lic
Norway
Hunga
ry1
Denmark
1
United
Kingdo
m
German
y
Finlan
d
Austria
Switzerl
and
Belgium
Irelan
d
Receipts Payments
OECD SCIENCE, TECHNOLOGY AND INDUSTRY OUTLOOK 2006 – ISBN 92-64-02848-X – © OECD 2006 131

4. THE INTERNATIONALISATION OF R&D
Box 4.2. New initiative on the collection of data on R&D by foreign affiliates
It is widely agreed that various aspects of the data on the internationalisation of R&D need
to be improved. The March 2005 OECD Forum on the internationalisation of R&D underlined
the strong need to develop and improve indicators in this area. Many of the measurement
issues related to cross-border flows have to do with how MNEs operate on a global basis and
how they keep their books. For example, sales and purchases of R&D may include intra-
company R&D (own account R&D) produced by separate entities on behalf of affiliated
producers. MNEs may not be able, or rules on financial reporting might not require them, to
distinguish all transactions undertaken by affiliates in different geographic locations. While
MNEs have to produce a consolidated account, they may find it difficult to compile separate
accounts for each affiliate.
A coherent and systematic framework is needed for analysing the internationalisation of
R&D activities. Since R&D surveys are the vehicle commonly used to collect statistics
international flows of R&D funds, this seems a natural starting point. In the OECD working
group of National Experts on Science and Technology Indicators (NESTI), new initiatives have
been launched to analyse how countries apply the OECD’s Frascati Manual to measure flows of
R&D funds from and to abroad and how they use different sources to measure international
transactions of R&D. An especially challenging area is measuring R&D performed outside the
country by affiliate firms. In general, there is a need to understand the extent to which R&D
surveys cover the target population of interest and capture R&D transactions within MNEs.
There is also scope to leverage other surveys and administrative sources, to examine the
extent to which they can be reconciled with R&D surveys, and to collaborate with national
accountants on the issue of measuring international R&D transactions.
Figure 4.10. Business sector R&D expenditure by affiliates abroad as a percentage of domestic R&D expenditure in selected OECD countries
1. 1996 and 2004.2. 1993 and 1998.3. 1997 and 2002.
Source: OECD, AFA Database.StatLink: http://dx.doi.org/10.1787/421772030075
0
20
40
60
80
100
120
Switzerland1 Germany Sweden Finland2 Belgium United States Japan3 Italy
% 1995 2003
OECD SCIENCE, TECHNOLOGY AND INDUSTRY OUTLOOK 2006 – ISBN 92-64-02848-X – © OECD 2006132

4. THE INTERNATIONALISATION OF R&D
increase their foreign R&D, while 61% of the European firms indicated similar intentions.
The average firm in the UNCTAD survey spent 28% of its R&D budget abroad in 2003,
including in-house expenditure by foreign affiliates and extramural spending on R&D
contracted to other countries. Japanese and Korean MNEs displayed the lowest share of
foreign R&D (15% and 2%, respectively).
R&D investments abroad are largely located in OECD countries but also in emerging economies
As indicated, most internationalisation of R&D still takes place within the main OECD
regions (with the United States the major location for foreign R&D). Developing countries are
increasingly attracting R&D centres, however, although R&D investments remain relatively
small from a global perspective. Large increases in foreign R&D investment in developing
Asia, particularly in China and India, have attracted much attention in recent years.
According to official Chinese statistics, some 750 foreign R&D centres had been established
in China by the end of 2004, most of them after 2001. Over 100 multinational firms had
established R&D facilities in India by 2004. Eight of the world’s top ten R&D-spending MNEs
have set up R&D centres in China or India (Microsoft, Pfizer, DaimlerChrysler, Genera Motors,
Siemens, Matsushita Electric, IBM and Johnson and Johnson) (BAH, 2005).
This is confirmed by the location of R&D investments abroad for the United States, one
of the few countries that publish recent detailed information. The main trends in the
geographical distribution of US R&D investment abroad are set out in Table 4.1. The main
change between 1995 and 2003 is the decline in the European Union’s share as a destination
and the increase in that of Asia-Pacific, especially China. The overall pattern of investment
in other geographical zones has not changed significantly. In spite of the relative decline in
its share, Europe continues to attract over 60% of US MNEs’ R&D investment.
Latin America, eastern Europe, the Middle East and Australia together attract only
8.5% of total US R&D investment (Table 4.1). Among individual countries, the decline in US
R&D investment in Europe mainly concerns Germany and France, while investment in the
United Kingdom and Sweden doubled in value.
Table 4.1. R&D expenditures of affiliates of US parent companies abroadby country or zone of destination
1995 1996 1997 1998 1999 2000 2001 2002 2003
Canada 8.5 11.1 12.5 11.9 9.3 11.4 10.8 10.8 11.0
European Union (15) 70.4 66.9 66.4 68.6 65.6 61.0 58.8 61.4 61.5
Eastern Europe1 0.1 0.3 0.3 0.5 0.3 0.4 0.2 0.3 0.3
Latin America 3.1 3.9 4.5 5.1 3.4 3.2 2.9 3.7 3.1
of which Brazil 2.0 2.5 3.0 3.0 1.6 1.2 1.0 1.4 1.5
Africa 0.2 0.1 0.2 0.2 0.1 0.1 0.1 0.1 0.1
Middle East 0.8 1.2 1.4 1.0 2.1 3.1 3.7 3.5 3.1
Asia-Pacific 14.8 14.8 12.8 10.9 17.8 19.2 21.3 18.0 18.2
of which Japan 10.2 9.5 7.5 6.6 8.4 8.0 7.6 7.3 7.4
China 0.1 0.2 0.2 0.4 1.8 2.5 . . 3.1 2.5
Australia 2.3 2.9 2.5 2.0 1.6 1.7 1.5 1.5 1.9
Total 100 100 100 100 100 100 100 100 100
Total in billion USD 12 582 14 039 14 593 14 664 18 144 20 457 19 702 21 063 22 328
1. From 1999 onwards, eastern Europe only includes the Czech Republic, Hungary, Poland and Russia.Source: Moris (2005).
StatLink: http://dx.doi.org/10.1787/544734182346
OECD SCIENCE, TECHNOLOGY AND INDUSTRY OUTLOOK 2006 – ISBN 92-64-02848-X – © OECD 2006 133

4. THE INTERNATIONALISATION OF R&D
These emerging geographical patterns are confirmed by recent surveys on the location
of R&D centres undertaken by different international organisations. In the UNCTAD survey
of the largest R&D spenders worldwide, China (3rd) and India (6th) were among the top
ranks as current locations for R&D (Figure 4.11). Other developing countries, including
Singapore, Brazil and some eastern European countries, also appeared in the ranking.
Likewise, recent information on new greenfield and expansion FDI projects involving R&D
over the period 2002-04, reveals that of the 1 773 projects identified, 1 095 were undertaken
in developing countries, eastern Europe and the Commonwealth of Independent States
(CIS) (LOCO-monitor of OCO-consulting, cited in UNCTAD, 2005). More than 90% of these
projects were undertaken by MNEs from developed countries; the United States was the
top source country followed by the EU15 and Japan.
It is expected that this shift towards emerging countries will continue to some extent,
as demonstrated by the findings on future R&D investments in the same UNCTAD survey
(Figure 4.12). China was the R&D location mentioned most often, followed by the United
States. India was in third place, and Russia was also among the top ten target locations.
Other emerging economies named were Singapore, Chinese Taipei and Thailand.
Drivers of the internationalisation of R&D
MNEs’ changing innovation strategies
The consensus among analysts has been that R&D is probably the least mobile of
MNEs’ activities because of its complex and tacit nature. Perhaps the most influential work
in this respect was done by Pavitt and Patel (1999) in a series of studies from the
early 1990s. They argued that the technological capabilities of firms were far less globalised
than their other activities, such as marketing and investment in production facilities.
Firms by and large performed R&D and undertook patenting at home for two main reasons.
The first was the tacit, person-embodied non-transferable character of much technological
Figure 4.11. Current foreign R&D locations% of responses
Source: UNCTAD (2005).StatLink: http://dx.doi.org/10.1787/543478010655
0
10
20
30
40
50
60
70%
United
States
United
Kingdo
mChin
a
Franc
e Ja
pan
India
Canad
a
German
y
Singap
ore Italy
Brazil
Spain
Belgium
Sweden
Switzerl
and
Austra
lia
Finlan
d
Norway
Russia
n Fed
eratio
n
Netherl
ands
Irelan
d
Poland
Chines
e Taip
ei
Austria
Israe
lKore
a
Thail
and
OECD country Non-OECD economy
OECD SCIENCE, TECHNOLOGY AND INDUSTRY OUTLOOK 2006 – ISBN 92-64-02848-X – © OECD 2006134

4. THE INTERNATIONALISATION OF R&D
knowledge, which led to locational “stickiness”. Second, they argued that firms (even major
MNEs) are strongly shaped by their home country’s specialisations and national innovation
systems (including for example, accumulated research skills and labour force skills).
Therefore, R&D was only to a limited extent dispersed and the home market was the
preferred location for performing R&D. Economies of scale in R&D and agglomeration
effects, as well as the need for co-ordination and control of expensive and risky
investments were also reasons for keeping R&D and the initial stage of production in the
home location.
To exploit these intangible assets beyond the home market, firms preferred to set up
or acquire affiliates in host markets through FDI rather than sell technology internationally
through licensing. FDI allows the multinational to appropriate more benefits from its
innovations, given the high transaction costs involved when transferring technology
through market mechanisms. As firms increasingly locate production closer to their
customers and suppliers they need R&D laboratories to adapt the technologies and
products developed at home to local conditions. In this type of R&D facility technological
knowledge tends to flow from the parent firm’s laboratory to the foreign-based facility so
that the technological advantages of the affiliate primarily reflect those of the home
country (where the core of innovation activities continues to be concentrated) and foreign
R&D units tend to exploit the existing parent-company technologies. This type of R&D site
has been termed “home-base exploiting” (Kuemmerle, 1997), or “asset-exploiting” (Dunning
and Narula, 1995).
Current evidence on flows of R&D suggests that the global business environment has
changed. Because global competition has intensified, companies have been forced to
innovate more quickly and develop commercially viable products and services more rapidly.
Relevant knowledge has become increasingly multidisciplinary and global in scope, making
innovation both more expensive and riskier. At the same time, some barriers to the
Figure 4.12. Most attractive foreign R&D locations% of responses
Source: UNCTAD (2005).StatLink: http://dx.doi.org/10.1787/410825310285
0
10
20
30
40
50
60
70% OECD country Non-OECD economy
China
United
States
India
Japa
n
United
Kingdo
m
Russia
n Fed
eratio
nFra
nce
German
y
Netherl
ands
Canad
a
Singap
ore
Chines
e Taip
ei
Belgium Ita
ly
Malays
iaKore
a
Thail
and
Austra
liaBraz
il
Czech R
epub
lic
Irelan
dIsr
ael
Mexico
Morocc
o
Norway
Poland
Roman
ia
OECD SCIENCE, TECHNOLOGY AND INDUSTRY OUTLOOK 2006 – ISBN 92-64-02848-X – © OECD 2006 135

4. THE INTERNATIONALISATION OF R&D
dispersion of R&D have become less significant owing to rapid developments in information
and communication technology. These trends imply changes in the governance of
innovation in MNEs, with important implications for the role of subsidiaries in recognising
and exploiting the potential for innovation.
This further implies that innovation strategies increasingly require global sourcing: they
need to sense new market and technology trends worldwide and respond adequately by
developing new ideas which are then implemented on a global scale. Technological spillovers
from the local public knowledge base or from specific technological know-how present in the
host locations and of benefit to the MNE at corporate level are absorbed as much as possible.
Such decentralised R&D activities have been defined as “home-base augmenting”
(Kuemmerle, 1997) or “asset-seeking” R&D activity (Dunning and Narula, 1995). Pearce and
Singh (1992) label these as “internationally interdependent labs”, which play a role in the
group’s long-term basic research and will collaborate closely with similar labs. Through
such investments, firms aim either to improve their existing assets or to acquire (and
internalise) or create completely new technological assets by locating R&D facilities
abroad. Knowledge relations between the foreign laboratory and the central home
laboratory become far more interdependent (Archibugi and Michie, 1995, 1997; Cantwell,
1997; Pavitt and Patel, 1999). As a result of these changes, Cantwell (1997) has argued that
while home bases remain very important:
“… technology leaders have altered the nature of international technology creation by
pioneering the international integration of MNC facilities into regional or global networks.
Globalisation in this sense involves the establishment of new international structures for technology
creation. In the past, foreign technological activity exploited domestic strengths abroad … By
contrast, today for companies of the leading centres, foreign technological activity now increasingly
aims to tap into local fields of expertise, and to provide a further source of new technology that can
be utilised internationally in the other operation of the MNC. In this respect, innovation in the leading
MNCs is more genuinely international or, in the terminology used here, it has become ‘globalised’”
(Cantwell, 1997, p. 236).
Location factors for different categories of R&D investment
From the perspective of home-based exploitation, motives for decentralising R&D are
primarily demand-oriented and relate to market proximity when it is important to be close
to “lead users” and to adapt products and processes to local conditions. Supply-related
motives, i.e. those related to the creation and renewal of core capabilities by allowing
access to a wider range of scientific and technological skills, are less important. The R&D
undertaken in affiliates is merely adaptive, directed at customising technologies to local
conditions. Such research is typically closely related to production and is determined by
the size of the host market.
The shift towards subsidiaries that are actively engaged in R&D, not simply in
incremental, adaptive innovations but also in radical innovations, points to supply-related
location factors and the presence of scientific and technological skills. Location decisions for
R&D facilities that augment those of the home base are typically supply-oriented, based not
only on the host country’s technological infrastructure, but also on the presence of other
firms and institutions that may create spillover benefits that investing firms can absorb.
Such externalities may result from spillovers of information from other R&D units, access to
trained personnel, established links with universities or government institutions, and the
OECD SCIENCE, TECHNOLOGY AND INDUSTRY OUTLOOK 2006 – ISBN 92-64-02848-X – © OECD 2006136

4. THE INTERNATIONALISATION OF R&D
existence of an appropriate infrastructure for specific kinds of research. The R&D
undertaken in these affiliates is more innovative and/or technology-monitoring, and is
largely determined by the quality of the individual components of the regional or national
innovation systems. The precise features of a host country that are needed to attract
innovative R&D depend on the industry and the activity involves.
A wide range of empirical studies have indicated that both demand- and supply-
related motives are important for the location of R&D activities in host countries, but that
technology-sourcing motives are on the rise (for an overview, see OECD and Belgian
Science Policy, 2005). The distinction between adaptive and innovative R&D centres seems
less clear in the real world. Knowledge flows from foreign units to the parent company are
more likely if the foreign affiliates undertake asset-augmenting R&D activities that
generate knowledge that is valuable for the rest of the organisation. To be able to absorb
localised sources of knowledge, foreign subsidiaries need to be embedded in the host
country innovation system, but they also need to be embedded in the firms’ organisational
network. This explains why, according to most empirical studies, acquired units are less
likely to contribute to the internal transfer of knowledge.
The role played by subsidiaries in the innovation process of MNEs depends on the
technological capabilities and the strategic importance of the host market. At one extreme,
subsidiaries can simply implement projects if they have low levels of technological
expertise and if the market has little strategic importance. In this case the technology
transfer is a pure import into the local market.
If the location has a high level of technological capability for a particular innovative
project, it can be assigned a role in developing generic central know-how or even play a crucial
leading role as a “centre of excellence” with a “global product mandate” (Rugman and Poynter,
1982). In such cases, the transfers of know-how are numerous, with the subsidiary responsible
for sourcing know-how from other units of the MNE (including headquarters) but also for
accessing external sources. For an effective global innovative strategy, know-how needs to flow
across units and locations within the MNE. This requires effective linking of R&D units,
mobility of staff, the existence of long-distance interpersonal communication and adequate
reward systems and responsibilities (Westney, 1997; Bartlett and Ghoshal, 1997).
Choosing between mergers/takeovers and greenfield investment when
internationalising R&D is to some extent determined by the firm’s innovative strategy.
Greenfield entry is the most common mode when setting up asset-exploiting R&D
investment, as adaptive R&D has to be closely linked to production activities. In the case of
technology-sourcing and asset-augmenting R&D facilities abroad, acquiring an existing
R&D facility through a merger or takeover may be the preferred option in order to gain
quick access to foreign knowledge. Overall, greenfield investment still tends to dominate in
R&D investment abroad, with mergers and takeovers undertaken especially in more
developed countries owing to their larger numbers of target R&D facilities.
Are location factors in emerging countries different?
Apart from the strong rise in the number of R&D centres in emerging countries,
evidence also points to a qualitative shift in the activities of their R&D facilities. Asia appears
to have taken the lead among developing countries in playing a more sophisticated role in
MNEs’ global R&D networks. Some R&D centres in these countries have evolved from
OECD SCIENCE, TECHNOLOGY AND INDUSTRY OUTLOOK 2006 – ISBN 92-64-02848-X – © OECD 2006 137

4. THE INTERNATIONALISATION OF R&D
performing adaptive R&D targeted at customising technologies to local markets into more
innovative R&D for local markets but in some cases also for regional and global markets. This
trend suggests that supply-oriented conditions, which are typical location factors for
attracting foreign R&D, have become more important in some emerging countries.
Most emerging countries that have successfully attracted foreign R&D, motivated by
the success of developed countries, have put in place policies to strengthen their national
innovation system. Innovative R&D and technology sourcing are indeed still undertaken
predominantly in developed countries, mainly because of the presence of world-class
clusters of technological and industrial activity including centres of excellence and an
effective national innovation system. In addition to proximity of manufacturing activities,
there are other reasons for the increasing attractiveness for foreign R&D of some emerging
countries.
UNCTAD (2005) points to a new set of drivers for the internationalisation of R&D in the
cost and availability of researchers. Intense global competition and rising R&D investments
push MNEs to innovate quickly and efficiently to bring new products, services and
processes more rapidly to market. Just as the internationalisation of manufacturing had
important cost advantages, the internationalisation of R&D is also motivated to some
extent by cost-cutting, resulting in outsourcing of activities and location of R&D in
countries with low costs. However, the reason seems less to be lower wages per se than the
available pool of skilled scientists and engineers. Schwaag (2006) identifies the presence of
an increasingly strong and competitively priced human capital base next to markets and
production facilities as the most important reason for locating R&D in China.
Some emerging countries seem to offer a combination of low wages and a good
education system, that results in a large mass of well-trained researchers. In China, for
example, only a small proportion, but a very large absolute number, of the population has
a tertiary degree. Furthermore, absolute numbers of enrolments in, and graduates from,
tertiary education in China match the numbers in the United States and the EU. However,
China’s level of enrolments in and graduations from advanced research programmes such
as the PhD, is still low compared to other countries (Schaaper, 2005). Recently, however,
some evidence has been presented on the suitability of new graduates from China and
India for working in internationally active MNEs. Based on interviews with human resource
managers, McKinsey (2005) concluded that on average only 3% of the potential talent
supply in low-wage countries is suitable for employment by MNEs.
A recent survey by the Kauffman Foundation (Thursby and Thursby, 2006) on the
reasons for locating multinational R&D in developed and emerging countries confirmed
the lesser importance of (wage) costs (Figures 4.13 and 4.14). The survey found that
emerging countries such as India and China will continue to be major beneficiaries of R&D
expansion over the coming years. More than half of the respondents identifying the United
States as their home country reported that they had either recently expanded or planned
to locate R&D facilities in China and India; the percentage is somewhat lower for western
European MNEs. R&D activities in emerging countries seem to build more on existing
technology than those in developed countries. At the same time, however, the results
indicate that firms increasingly move more basic and applied research to emerging
countries than development and customisation work.
OECD SCIENCE, TECHNOLOGY AND INDUSTRY OUTLOOK 2006 – ISBN 92-64-02848-X – © OECD 2006138
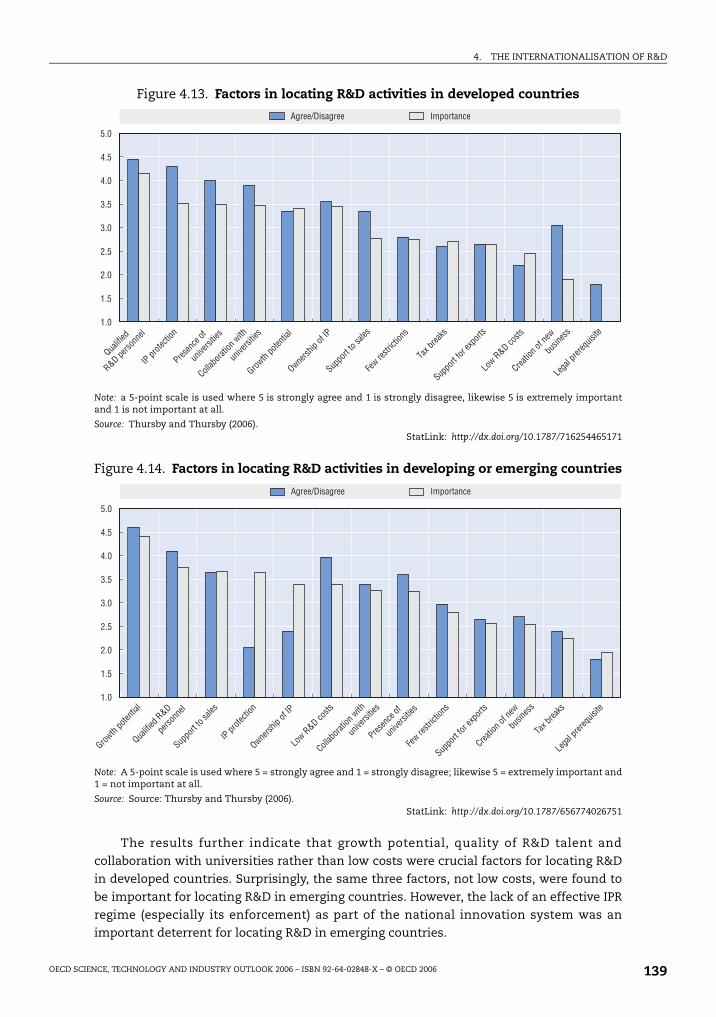
4. THE INTERNATIONALISATION OF R&D
The results further indicate that growth potential, quality of R&D talent and
collaboration with universities rather than low costs were crucial factors for locating R&D
in developed countries. Surprisingly, the same three factors, not low costs, were found to
be important for locating R&D in emerging countries. However, the lack of an effective IPR
regime (especially its enforcement) as part of the national innovation system was an
important deterrent for locating R&D in emerging countries.
Figure 4.13. Factors in locating R&D activities in developed countries
Note: a 5-point scale is used where 5 is strongly agree and 1 is strongly disagree, likewise 5 is extremely importantand 1 is not important at all.
Source: Thursby and Thursby (2006).StatLink: http://dx.doi.org/10.1787/716254465171
Figure 4.14. Factors in locating R&D activities in developing or emerging countries
Note: A 5-point scale is used where 5 = strongly agree and 1 = strongly disagree; likewise 5 = extremely important and1 = not important at all.
Source: Source: Thursby and Thursby (2006).StatLink: http://dx.doi.org/10.1787/656774026751
1.0
1.5
2.0
2.5
3.0
3.5
4.0
4.5
5.0
Qua
lified
R&D perso
nnel
IP prote
ction
Presen
ce of
u
nivers
ities
Collab
oratio
n with
u
nivers
ities
Growth
poten
tial
Ownersh
ip of
IP
Suppo
rt to s
ales
Few re
strict
ions
Tax b
reaks
Suppo
rt for
expo
rts
Low R&D co
sts
Creatio
n of n
ew
busin
ess
Lega
l prer
equis
ite
Agree/Disagree Importance
1.0
1.5
2.0
2.5
3.0
3.5
4.0
4.5
5.0
Agree/Disagree Importance
Growth
poten
tial
Qualifi
ed R&D
pers
onne
l
Suppo
rt to s
ales
IP prote
ction
Ownersh
ip of
IP
Low R&D co
sts
Collab
oratio
n with
u
nivers
ities
Presen
ce of
u
nivers
ities
Few re
strict
ions
Suppo
rt for
expo
rts
Creatio
n of n
ew
busin
ess
Tax b
reaks
Lega
l prer
equis
ite
OECD SCIENCE, TECHNOLOGY AND INDUSTRY OUTLOOK 2006 – ISBN 92-64-02848-X – © OECD 2006 139

4. THE INTERNATIONALISATION OF R&D
Policy implications
Challenges and opportunities for the internationalisation of R&D
Until recently, R&D policy has largely been national in scope, often supporting the
development of critical knowledge bases and technologies or particular national
specialisations. The new forms of internationalisation of R&D, based on global sourcing
and integration of complex knowledge bases, present challenges to national approaches.
When innovation networks span national boundaries, how should national innovation
systems relate to the global division of labour in knowledge production? A central problem
is that many instruments of policy – R&D support, education and training policies and
infrastructure policies – are predominantly national in scope.
A key policy problem, then, is how to integrate essentially national measures and
instruments and companies’ globalised knowledge strategies. Should policy measures
themselves be more internationalised, and what is the future role for national
instruments? In part, this is a matter, as suggested above, for major MNEs. But innovation
and collaboration surveys have shown that smaller firms also engage in cross-border
collaboration and international sourcing of knowledge. In fact, the internationalisation of
R&D affects a large share of innovating firms and therefore all aspects of business-oriented
R&D and innovation policies.
Some key policy issues are:
● What are the R&D benefits and costs of inward FDI, in terms of augmenting domestic
capabilities?
● What national benefits might flow from the participation of national companies in
global innovation networks or global supply chains and outward investment?
● How are changing strategies altering the cost and benefits of international R&D
investments?
● How does internationalisation affect levels of domestically performed R&D, and hence
national R&D intensities?
● How should national policy instruments be used to support integration with global R&D
and innovation networks?
● What issues arise for host countries for creating absorptive capacity of global R&D flows?
These issues are discussed briefly in turn.
Attracting FDI in general and FDI in R&D specifically has traditionally been high on the
policy agenda of many countries, based on arguments that inward flows of R&D provide
net benefits for the host country. The prospect of acquiring modern technology, interpreted
broadly to include product, process and distribution technology as well as management
and marketing skills, is typically identified as the main component of this net benefit.
Knowledge spillovers to the host country economy and its firms can have very positive
effects, including an upgrading of domestic innovative capacity. In addition, there may
follow important benefits for human capital: increased R&D employment, better training,
support to education and formation, reverse brain drain effects. However, empirical
evidence has largely shown that these spillover effects do not appear automatically. In
order to maximise these positive effects, countries that receive FDI have to invest in
networking and strengthen agglomeration effects in domestic clusters and the absorptive
capacity of the local economy. There then arise questions concerning the types of policy
initiative that might support such effects.
OECD SCIENCE, TECHNOLOGY AND INDUSTRY OUTLOOK 2006 – ISBN 92-64-02848-X – © OECD 2006140

4. THE INTERNATIONALISATION OF R&D
On the other hand, it would be wrong to present attraction of foreign R&D solely in
positive terms. There is a danger of loss of control over domestic innovative capacity, with
potential damage to the technological competitiveness of domestic firms owing to
intensified competition. Many empirical studies find that foreign presence lowers the
average dispersion of a sector’s productivity with firms with lower productivity exiting the
market (see OECD and Belgian Science Policy, 2005). Some countries may become heavily
dependent on FDI and on R&D performed by foreign affiliates, and minor changes in
location decisions might have large impacts on the local R&D base in these countries.
There are also policy questions relating to the benefits of outward R&D flows. The key
question is how to benefit not only from attracting and retaining R&D, but also from
encouraging firms to engage in global innovation networks and capture economic benefits
from global innovation activities. Such flows may generate positive effects for home
countries, since the transfer of knowledge is not unidirectional. An MNE may benefit from
establishing subsidiaries in foreign centres of excellence by drawing on the existing stock of
technical knowledge and by learning from innovations of local firms. Smaller firms may
benefit from greater involvement in global networks and significantly expand their
innovative capabilities. Griffith et al. (2004) have recently cast interesting light on the benefits
of the internationalisation of R&D by exploring the spillover effects of locating in the United
States. They analysed UK firms that had located R&D facilities in the United States and
showed that total factor productivity (TFP) growth was higher in these firms than in UK firms
that had not located there. This suggests a specific spillover effect from internationalisation
of R&D. Moreover the effect was stronger for firms whose productivity gap with the United
States was greatest, that is, the benefits were greater for those with the “most to learn”.
The shift towards asset-augmenting and technology-sourcing internationalisation of R&D
has caused concern among policy makers of both net recipient and net source countries.
Foreign subsidiaries increasingly try to tap into the knowledge generated in centres of
excellence around the world. This has led to combined inward and outward learning and
reverse and interactive technology transfer between different organisational and geographical
locations. Governments of net recipient countries fear that foreign-owned firms may act as
“Trojan horses” and both reduce the national technology and production base and keep the
core of their innovative activities in their home countries. For the host economy, the trend
towards technology-sourcing motives for internationalising R&D would predict more potential
for diminishing than for increasing domestic innovative capacity. At the same time, however,
it creates more scope for potential benefits since more technology transfers to the host
locations are likely to take place. For their part, countries that are net sources of foreign R&D
investment are worried that the internationalisation of R&D may erode (“hollow out”) the
domestic knowledge base, because foreign affiliates may export technology developed at home
and because fewer R&D activities may be undertaken at home.
Some policy makers, especially in countries with R&D intensity targets, are concerned
by the scale of inward and outward flows of R&D, because they affect levels of domestically
performed R&D. While this may not be a major issue in terms of volumes of R&D, it can be
a cause for concern in particular sectors. It can also be a problem for some small economies
with large MNE R&D performers because relatively small relocation decisions by key firms
can substantially affect volumes of business expenditure on R&D (BERD).
It is claimed that individual countries cope with globalisation largely according to the
characteristics of their national innovation systems. That is, success in the global economy
OECD SCIENCE, TECHNOLOGY AND INDUSTRY OUTLOOK 2006 – ISBN 92-64-02848-X – © OECD 2006 141

4. THE INTERNATIONALISATION OF R&D
depends on local capabilities. International R&D activities are nowadays driven by the need
to interact with local systems of technological competence and end users. Many of these
systems are affected by national policies. The core components of innovation systems are
education provision at all levels (and related human resource policies), labour market
institutions, provision of physical and knowledge infrastructures, corporate and public
sector governance arrangements, and R&D support policies. To differing degrees, all of
these elements of the system are – subject to budget constraints – developed through
discretionary national policies. Two policy challenges stand out at present: education
provision and knowledge infrastructures (such as universities, public-sector research
organisations, standards organisations and government laboratories). Policies in these
areas may be critical to accessing the benefits of internationalised R&D flows. As an
example of how measures in these areas can affect flows, the funding of the infrastructure
for biotechnology and biopharmaceutical research by the US National Institutes of Health
appears to be linked to strong inward R&D flows. Global pharmaceutical companies clearly
seek to locate close to the major US infrastructure in these fields.
Finally, there is an issue of absorptive capacity. With the growth of new world centres of
excellence, the economic welfare of a country or region depends increasingly on its ability to
assimilate and acquire knowledge developed elsewhere. In this respect, the absorptive
capacities of both large and small enterprises, as well as R&D institutions, need to be
strengthened. In addition, international mobility needs to be fostered. Local firms,
institutions and researchers need to be encouraged to access international networks and to
network in domestic clusters with foreign firms. At the same time, the foreign R&D activities
of MNEs may provide access to foreign technologies and therefore be a channel for
transferring knowledge back to the home country. There is some empirical analysis to
suggest that to benefit from technology acquired abroad by their own MNEs, home countries
should develop their absorptive capacity and networking to enable technology sourcing
through multinational firms. In addition, to compensate for the internationalisation of R&D
investment by its domestic firms and for institutions and R&D workers moving abroad, a
country should be able to simultaneously attract innovative companies, R&D institutes and
R&D workers from abroad. The following section traces some policy responses to these
emerging issues in OECD countries.
Policies towards the internationalisation of R&D
In order to gain insight into how OECD countries are tackling increasing
internationalisation of R&D, the OECD conducted in 2005 a policy survey analysing practices
with respect to the internationalisation of R&D in OECD countries. Australia, Canada,
Denmark, Finland, France, Germany, Italy, Japan, Korea, the Netherlands, New Zealand,
Norway and Poland were willing to share some features of their policies. The main
conclusions are described in the following paragraphs.
While incentives to attract FDI in general are quite common, special incentives for FDI
in R&D are relatively uncommon. This is in line with theoretical and empirical findings
that show that R&D investment by MNEs is largely driven by fundamental economic factors
(market size, tax rates, labour market conditions, etc.), the political environment (stability
and an appropriate public infrastructure) and the scientific and technological
specialisation and capabilities of the country. Only one country reported offering direct
financial support for FDI in R&D (Australia through its Invest Australia Strategic
Investment Coordination).
OECD SCIENCE, TECHNOLOGY AND INDUSTRY OUTLOOK 2006 – ISBN 92-64-02848-X – © OECD 2006142

4. THE INTERNATIONALISATION OF R&D
Countries have a number of initiatives to attract foreign firms and link domestic firms to
foreign knowledge. The measures are mostly non-monetary in nature and concentrate on
administrative and managerial support, matchmaking between domestic and foreign firms
willing to co-operate, provision of information services, consultancy services, etc. Several
countries indicated that they offer some administrative support and/or infrastructure
(Austria, Germany, France, Italy and the Netherlands). Investment agencies in almost all
countries were especially active in recruitment and advertising (examples include Invest in
Denmark, Invest in Finland, and the Netherlands Foreign Investment Agency).
Non-discrimination vis-à-vis domestic firms and free access to national funding for
domiciled foreign-owned enterprises is the guiding principle for the treatment of foreign
affiliates in most OECD countries. In Austria, for instance, the Kplus programme stimulates
indigenous industry, on the one hand, and knowledge pools of technical expertise
independently of their domestic base, on the other. In Finland Tekes has opened its
technology programmes in order to gather sufficiently large clusters of competence able to
attract international interest. In Germany, the federal government provides various
instruments that promote research co-operation between foreign firms or research
partners and German partners. In the Netherlands, foreign-owned affiliates and foreign
research institutions domiciled in the country can participate in national research projects.
However, New Zealand applies the criterion of “national benefits” for allowing foreign
firms and institutes to access national R&D programmes.
An important determinant of a country’s attractiveness is the quality and
specialisation of the domestic knowledge base. Hence, all measures to improve the
scientific and technological capabilities of an economy will also increase the country’s
attractiveness for R&D investment by MNEs. In this context, the most important measures
relate to human resource development, intellectual property protection, a first-class
knowledge infrastructure, excellent universities and research organisations, and
co-operative partners in the business enterprise sector.
Promoting international collaboration in science and technology and helping to link
domestic enterprises to knowledge abroad is high on the agenda of OECD countries. However,
domestic enterprises must have a certain level of technological expertise to be able to absorb
spillovers from foreign affiliates. Since these spillovers are regarded as one of the main benefits
a country derives from the presence of MNEs, the technological capacities of the domestic
economy also crucially affect the degree to which countries benefit from FDI in terms of
technological effects (rather than the more usual benefits of employment, value added, etc.).
The Australian government supports collaboration of domestic firms with foreign innovators
via various programmes (Intelligent Manufacturing Systems, Commercial Ready, Invest
Australia and Cooperative Research Centres). Denmark provides financial support for SMEs
that want to submit an application for international research programmes (e.g. the EU Sixth
Framework Programme). Germany provides through Pro InnoII (the major co-operation
programme for SMEs) a specific promotion bonus for projects involving European partners.
Another key area for policy initiatives is the attraction of international talent.
Countries make considerable efforts to remove barriers to the mobility of highly skilled
personnel. This area can be expected to gain in importance in the coming years. Australia’s
migration programme for example strongly emphasises developing Australia’s skills base.
While Canada does not articulate a deliberate strategy to augment its S&T capacity
through immigration, some measures greatly facilitate the immigration of highly qualified
OECD SCIENCE, TECHNOLOGY AND INDUSTRY OUTLOOK 2006 – ISBN 92-64-02848-X – © OECD 2006 143

4. THE INTERNATIONALISATION OF R&D
personnel. Denmark has a special 25% tax scheme which provides favourable conditions
for foreign employees and researchers. Japan has widened the career path of foreign
researchers. In Korea, the Brain-Pool programme and the exchange programme support
the invitation of foreign scientist to Korea, while the Post-Doc programme provides foreign
scientists with opportunities for research and training. Australia, Canada, Denmark,
Finland, Germany, Italy, Korea, the Netherlands and Poland have all implemented
incentive/supporting schemes for the return of expatriated scientists and engineers.
To date, policies have largely been ad hoc and aimed at specific problems, such as lack
of inward investment, lack of mobility of human resources, and too much mobility,
i.e. brain drain. However more holistic approaches are emerging in some countries. The
examples in Box 4.3 show some interesting recent practices aimed at benefiting as much
as possible from the internationalisation of R&D.
Policy summary
Policy recommendations for facing the challenges and opportunities raised by the
internationalisation of R&D should take into account national policy objectives as well as
the specific features of science and innovation systems. However, some general policy
conclusions can be drawn:
● First, if countries want to attract foreign R&D, it is essential to look at the economic
fundamentals. Inward R&D investment is closely related to policies that influence
attractiveness for FDI in general. Factors such as political stability, public infrastructure,
market size and development, tax rates and labour market conditions are decisive in
decisions to locate R&D. Policy should provide and secure a “healthy business environment”.
● Second, an adequate R&D policy for facing the challenge of internationalisation of R&D
should not be designed in isolation from other policies. An effective R&D policy implies
co-ordination among various policy makers, linking R&D with other policy areas,
particularly research and technology development (RTD), innovation, education, economic
affairs and foreign affairs. Close co-operation among decision-making instances or even
integration should be explored to guide prioritisation processes and to better exploit
synergies in order to optimise the national innovation system (OECD, 2005c).
● Third, measures to build an innovation-friendly environment and increase a country’s
scientific and technological capacities also help to attract foreign R&D. A strong and
vibrant academic and industrial research base, effective protection of intellectual
property rights and a well-trained workforce are major determinants of MNE investment
in R&D but also promote the growth of domestic enterprises. Hence, these policy
measures should be aimed simultaneously at domestic and foreign-owned or domiciled
enterprises and should not discriminate against foreign firms.
● Fourth, the creation of a framework of local conditions that foster R&D is crucial.
Increasing the local R&D force can create the necessary absorptive capacity to profit
from the presence of FDI in R&D, to attract FDI in R&D and to foster international
networking. The provision of a strong local infrastructure for business in general and for
R&D in particular is very important. Prior building of technological capabilities within a
country’s firms is crucial for their ability to interact and absorb knowledge made
available by inward and outward FDI. Technological upgrading can be ensured by setting
up a local infrastructure for industrial research, technological development and
innovation through science parks, business incubators and technology transfer centres.
OECD SCIENCE, TECHNOLOGY AND INDUSTRY OUTLOOK 2006 – ISBN 92-64-02848-X – © OECD 2006144

4. THE INTERNATIONALISATION OF R&D
Box 4.3. Policy practices
Ireland: an integrative approach
In contrast to other European countries, Ireland’s rapid economic development has been stronglybased on industrial policy and substantial investments in innovation measures. Although businessexpenditure on R&D remains low, 80% is accounted for by foreign-owned MNEs. Ireland is thereforecommonly regarded as a success in terms of inward investment owing to its proactive stance.Headed by the Industrial Development Authority (IDA), it has gained an international reputationfor its emphasis on policy independence, continuity and consistency (Tekes, 2004).
With regard to the framework for taking decisions, grant concessions were tied to well-definedobjectives (employment, R&D), and repayment was required in case of an MNE’s failure to comply.Additionally, policy implementation was always on a project-company basis, and explicit sectoraltargeting was a defining feature of Irish policy. In fact, MNEs were not attracted to sectors in whichIreland traditionally had an advantage but to high-technology industries; FDI therefore had atangible impact on Irish industry, as it motivated a structural shift in sectoral and regional terms.As a result, Ireland had significant growth in FDI inflows over the last decade with the greatest partaccounted for by greenfield investment or expansions rather than mergers and acquisitions(Molero and Alvarez, 2004; Tavares, 2004).
In order to attract new investments, Ireland has used from the end of the 1990s a very bold andexpensive set of instruments, upgrading the physical infrastructure of the universities and makingmassive investments in strategic research in biotechnology and ICT. The Science Foundation Ireland(SFI), an agency of the industry ministry, offers very large grants to foreign-based researchers willingto move to Ireland and establish research groups, followed by smaller grants, open to nationals aswell as those abroad. Other incentives include inward mobility schemes for individual researchersand those with key skills, and reduced fees for non-EU postgraduate students. Furthermore, there isan innovation support programme aimed especially at strengthening the capabilities of Irish plant,and corporation taxes are still low (Tavares, 2004; Tekes, 2004).
Finland: the role of Tekes
In the 1980s Tekes’ technology programmes were mainly focused on accessing and managingrapidly developing technologies for industrial purposes. In the 1990s, the scope of technologyprogrammes broadened to address issues such as changes in the competitive environment ofenterprises and regulatory issues. Today Tekes’ technology programmes have a much wider scope,providing opportunities to participate in networking and to gain from spillovers from other projects.
Over half of Tekes’ R&D funding for large enterprises is now directed through technologyprogrammes with a strategy for the internationalisation of R&D based on four elements: selectiveproject funding, national technology programmes, promotion of innovative activity anddevelopment of innovation environments. Tekes’ technology programmes are in principle targetedor mission-oriented and are open to participation by foreign companies in four ways:
● Joint projects based on a common objective, shared resources and tasks. Each party covers its owncosts and uses the results as agreed among the participants;
● Subcontracting gives participants the possibility to purchase services from a foreign entity tocomplement the project, provided no domestic source is available;
● Technology transfer enables project participants to purchase licensed or existing technology froma foreign entity to complement R&D project work.
● Collaboration for marketing and distributing the project results allows project participants tocollaborate with foreign enterprises to bring products to the market.
In 2001, 36% of all technology programmes financed by Tekes involved internationalco-operation. Expenditures for these projects represented about 45% of the total volume of fundingprovided by Tekes; 56% of the foreign participants came from Europe, 28% from the United Statesand 5% from Japan (Tekes, 2004).
OECD SCIENCE, TECHNOLOGY AND INDUSTRY OUTLOOK 2006 – ISBN 92-64-02848-X – © OECD 2006 145

4. THE INTERNATIONALISATION OF R&D
Policy should try to attract and support R&D by providing a consistent (location- and not
ownership-based) grants and tax regime, adequate IP protection (e.g. the cost to patent
in the EU is still far higher than in the United States).
● Fifth, human capital is a cornerstone of R&D. Provision of human resources is the
primary task of universities but is also a task for firms. Therefore, inter-firm
co-operation or co-operation between firms, universities and public research
organisations focused on learning by local staff should be encouraged. An important
element here is the mobility of highly skilled labour. Although policy has less influence
on cultural and structural barriers, it can focus on reducing political and technical
barriers such as immigration legislation, red tape, taxation and S&T-related legislation.
This would allow firms to make use of foreign talent and thus import important
knowledge. Policies for attracting and retaining foreign highly skilled labour are a most
important area of governmental policy with respect to the internationalisation of R&D.
Policy and legislation do not drive the mobility of highly skilled labour but can facilitate
or hinder it. Measures to be taken include grants, immigration legislation and tax issues.
Box 4.3. Policy practices (cont.)
Austria: the Kplus programme
To face the challenge of improving the effectiveness and efficiency of its innovation system,Austria has chosen to create new structures for science-industry co-operation. To build upscientific capacities operating in thematically relevant and technological fields, temporaryresearch institutions called Kplus Centres have been established. Kplus Centres are generallyfounded through formal partnerships between universities and enterprises, are focused on thecreation of a new culture of collaboration and are based on the principle of non-discrimination. Tosupport interdisciplinary and complementary co-operation in specific scientific fields, foreign-owned firms are encouraged to participate.
Today there are 18 active Kplus Centres that carry out R&D on an internationally competitivebasis in networks with about 270 partners from industry and 150 from science and technology. Theshare of foreign companies participating is high; in 2003, 10% of total expenditures came fromforeign-domiciled companies, i.e. companies which have not settled in Austria but participate in itsCompetence Centre Programme. According to the programme guidelines the cumulative share offoreign-domiciled companies must be less than 25% of the total volume of each competencecentre. Furthermore, 13% of all participating companies are foreign-domiciled; a percentage thatreaches 34% in individual Kplus Centres, e.g. in the Austrian Centre of Competence for Tribology(ACT). The percentage of foreign PhDs is 50% in centres such as the Competence Centre of AppliedElectrochemistry (ECHEM).
The Netherlands: twinning centres
Since the Netherlands is the home base of a number of significant MNEs, there have for some timebeen concerns that corporate R&D might migrate out of the country. Accordingly, a major policychallenge is to improve the climate for innovation and therefore enhance international networking.One approach that helps to make the Dutch economy more dynamic is the establishment of thetwinning centres, a sophisticated cluster approach that combines a local competence centre and anincubator model with strategic networking with global lead markets. For this purpose, networks oflocal companies have been activated, and leading foreign companies and universities are integratedinto these networks. Public incentives encourage an increase in new companies, especially in the ICTsector, through funding, coaching and networking (Edler and Mayer-Krahmer, 2003).
OECD SCIENCE, TECHNOLOGY AND INDUSTRY OUTLOOK 2006 – ISBN 92-64-02848-X – © OECD 2006146

4. THE INTERNATIONALISATION OF R&D
The presence of a critical mass in excellent research centres is vital for attracting
experienced researchers. Ongoing work at the OECD is aimed at development of good
policy practices in this context.
Conclusions
This chapter has argued that an important change is under way in the international
dimensions of R&D performance. Increasing cross-border flows of R&D are a major trend and
feature of the world economy. Gross flows are rising, and in many OECD economies
significant shares of domestic R&D are performed by affiliates of foreign firms. The converse
is that firms headquartered in particular OECD countries are performing increasing amounts
of R&D outside their home base. The transition is not just in the changing scale of the
internationalisation of R&D but also in its drivers. In the past, firms undertaking FDI tended
to keep their major technology-creation activities in or close to their home bases. Now R&D
is accompanying FDI, and firms appear to be relocating R&D to benefit from knowledge
capabilities that are distributed across countries, either in partner companies or in public-
sector knowledge infrastructures. This reflects the growing complexity of industrial and
service sector knowledge bases which requires firms to build global strategies to access
relevant R&D results and knowledge capabilities. It is well-known that MNEs are invariably
multi-technology companies, but the sources of MNE technologies are now also more widely
distributed geographically and require worldwide location strategies.
This development raises complex policy issues. For most OECD countries, S&T policies
remain predominately national in scope, and few countries have fully recognised the
implications of the current internationalisation of R&D. In part this is because the full
implications are not yet clear, and this is certainly an area in which further research and
analysis is required. The increasing mobility of R&D is accompanied by the increasing
mobility of highly skilled scientists and engineers. This has implications not only for
education and infrastructure policies, but also for a wide range of policy arenas – tax
policies, regulatory frameworks and standards setting, among others. This suggests that
measures that influence MNEs’ location decisions are of increasing importance for policy
makers who wish to maximise spillover and other benefits from R&D.
An important emerging dimension of these trends is a change in North-South relations
in global R&D. R&D and innovation activity are moving to a number of rapidly developing
economies where R&D, and particularly FDI-related R&D, is growing rapidly. The situation of
the BRICS (Brazil, Russia, India, China and South Africa) is covered in other chapters of this
volume, but it should be noted that their innovation capabilities are growing, and that these
countries are increasingly considered as locations for R&D facilities by MNEs.
Bibliography
Archibugi, D. and J. Michie (1995), “The Globalization of Technology – a New Taxonomy”, CambridgeJournal of Economics 19(1), 121-140.
Archibugi, D. and J. Michie (eds.) (1997), Technology, Globalisation and Economic Performance, CambridgeUniversity Press, Cambridge.
BAH (2005), “The Booz Allen Hamilton Global Innovation 1000: Money Isn’t Everything”,Strategy+Business, Issue 41, Winter 2005.
Bartlett, C; and S. Ghoshal, (1997), “Managing Innovation in the Transnational Corporation”, inTushman, M. and P. Anderson (eds.), Managing Strategic Innovation and Change, Oxford UniversityPress, 452-476.
OECD SCIENCE, TECHNOLOGY AND INDUSTRY OUTLOOK 2006 – ISBN 92-64-02848-X – © OECD 2006 147

4. THE INTERNATIONALISATION OF R&D
Cantwell, J. (1997), “The Globalisation of Technology: What Remains of the Product Cycle Model?”,pp. 215-240 in D. Archibugi and J. Michie (eds.), Technology, Globalisation and Economic Performance,Cambridge University Press, Cambridge.
Criscuolo, P. and P. Patel (2003), “Large firms and internationalisation of R&D: hollowing out of nationaltechnological capacity?”, Paper presented at the SETI workshop, Rome.
Dunning, J. and R. Narula (1995), “The R&D activities of foreign firms in the US”, International Studies ofManagement and Organisation, 25, 39-73.
Edler, J. and F. Mayer-Krahmer (2003), “How International are National (and European) Science andTechnology Policies?”, Karlsruhe and Strasbourg (mimeo)
Griffith, R., R. Harrison and J. van Reenen (2004), “How special is the special relationship? Using theimpact of R&D spillovers on UK firms as a test of technology sourcing”, Centre for EconomicPerformance Discussion Paper 659.
Hagedoorn, J. (2002), “Inter-firm R&D partnership: an overview of major trends and patternssince 1960”, Research Policy, 31 (4), 477-492.]
Kuemmerle, W. (1997), “Building effective R&D capabilities abroad”, Harvard Business Review, 61-70.
McKinsey Global Institute (2005), “Addressing China’s Looming Talent Shortage”.
Molero, J. and I. Alvarez (2004), “Multinational enterprises and national systems of innovation:Background and new insights”, paper presented at the EIBA conference, Ljubljana.
Moris, F. (2005), “Foreign Direct Investment, R&D and Innovation: Concepts and Data”, BackgroundNote Prepared for UNCTAD, mimeo
OECD (2005a), Handbook on Economic Globalisation Indicators, OECD, Paris.
OECD (2005b), Compendium of Patent Statistics, OECD,Paris.
OECD (2005c), Governance of Innovation Systems, OECD, Paris.
OECD and Belgian Science Policy (2005), “Internationalisation of R&D: Trends, Issues and Implicationsfor S&T Policies: a Review of the Literature”, Background Report for the Forum on theInternationalisation of R&D, Brussels 29-30 March.
Pavitt, K. and P. Patel (1999), “Global Corporations and National Systems of Innovation: WhoDominates Whom?”, Chapter 6) in D. Archibugi, J. Howells and J. Michie (eds.), Innovation Policy in aGlobal Economy, Cambridge University Press, Cambridge.
Pearce, R. and S. Singh (1992), “Internationalisation of R&D among the world’s leading enterprises:survey analysis of organisation and motivation”, pp. 137-162 in O. Grandstrand, L. Hakanson, S.Sjolander (eds.), Technology Management and International Business, Wiley and Sons.
Rugman, A. and T. Poynter (1982), “World Product Mandate: how will MNEs respond?”, BusinessQuarterly.
Schaaper, M. (2005), “An Emerging Knowledge-based Economy in China? Indicators from OECDDatabases”, STI Working Paper, 2004/4, OECD.
Schwaag, S. (2006), “China: From shop floor to knowledge factory?”, pp. 227-266 in M. Karlsson (ed.),The Internationalization of Corporate R&D, Swedish Institute For Growth Policy Studies, Sweden.
Tavares, A.T. (2004), “Public policy, FDI attraction, and Multinational Subsidiary Evolution: Thecontrasting cases of Ireland and Portugal”, paper presented at the EIBA conference, Ljubljana.
Tekes (2004), “Competitiveness through internationalisation: Evaluation of means and mechanisms intechnology programmes”, No. 10, Helsinki.
Thursby J.G. and M.C. Thursby (2006), Here or There? A Survey on the Factors in Multinational R&DLocation and IP Protection, Marion Ewing Kauffman Foundation, Washington, DC.
UNCTAD (2005), World Investment Report, Transantional Corporations and the Internationalisation of R&D,New York and Geneva.
Westney, E. (1997), “Multinational Enterprises and cross-border knowledge creation”, Sloan WorkingPaper 159-97.
OECD SCIENCE, TECHNOLOGY AND INDUSTRY OUTLOOK 2006 – ISBN 92-64-02848-X – © OECD 2006148

ISBN 92-64-02848-X
OECD Science, Technology and Industry Outlook 2006
© OECD 2006
Chapter 5
Patent Licensing Marketsand Innovation*
This chapter reviews recent evidence on the development of technology markets andanalyses the current status of valuation and exploitation of patents, with the aim ofinforming policy makers. It examines the broadening set of channels through whichfirms aim to exploit their intellectual property and reviews various approaches topatent valuation. It also reviews the range of policy initiatives that have beenundertaken by governments of OECD countries to foster and improve the valuationand the exploitation of patents.
* This chapter draws on materials presented at the EPO-OECD-BMWA International Conference onIntellectual Property as an Economic Asset: Key Issues in Valuation and Exploitation, held in Berlin on30 June-1 July 2005, including the background and issues paper and the summary report (OECD, 2005a,2005b), both available at www.oecd.org/sti/ipr.
149

5. PATENT LICENSING MARKETS AND INNOVATION
IntroductionIn knowledge-based economies, intellectual assets – intellectual property (IP), human
capital and organisational capabilities – play a crucial role in business performance and
economic growth. An increasing share of the market value of firms appears to derive from
these assets, which firms are managing more actively to enhance their contribution to
value creation. This is particularly evident for intellectual property, and especially patents.
Firms seeking to improve their competitive advantage are investing more in the creation
and acquisition of knowledge and are patenting more inventions. While patenting gives
them greater control over the use of their inventions, it also opens channels for technology
transfer through inter-firm licensing.
As firms shift to more open innovation models based on collaboration and external
sourcing of knowledge, they exploit their patents not only by incorporating protected
inventions in new products, processes and services, but also by licensing them out to other
firms to generate additional revenues, by licensing them in from public- or private-sector
organisations to access complementary technology, and by using them as bargaining chips
in negotiations with other firms. These developments raise the importance of efficient
technology licensing markets, which can in turn improve the efficiency of innovation
processes by facilitating the exchange of patented inventions (via sale or licensing) among
private- and public-sector actors, putting inventions in the hands of those most able to
commercialise them, and allowing firms to assemble the inventions they need to introduce
a new product or service.
While the private sector has a primary role in driving the expansion of technology
markets, governments can play an enabling and supporting role. This chapter looks at how
patent licensing/technology markets contribute to innovative performance. It explores the
ways in which patent holders, especially in the private sector, manage their intellectual
property, with a focus on their use of technology markets to support their innovative
capability. It reviews available indicators on the size of these markets in the main OECD
regions and identifies policy measures that governments can implement to support and
stimulate the development of technology licensing markets.
Managing and exploiting IPPatent licensing involves an agreement by a patent’s owner (licensor) to allow another
party (licensee) to make, sell and use the patented invention on an exclusive or non-
exclusive basis, without transferring ownership of the patent. In a typical unilateral
licence, the patent holder receives a financial reward in exchange for the licence, typically
as royalty payments. For cross-licensing, however, a patent holder may agree to allow
another firm to utilise its patented invention in return for the right to use the other firm’s
patented invention without any fear of infringement. Often no direct financial exchange
takes place.
OECD SCIENCE, TECHNOLOGY AND INDUSTRY OUTLOOK 2006 – ISBN 92-64-02848-X – © OECD 2006150

5. PATENT LICENSING MARKETS AND INNOVATION
Licensing can be a suitable mechanism for transferring technology between licensors
who want to leverage their technological assets and licensees who want to complement
their internal technological capabilities. However, the advantages and disadvantages of
inward and outward licensing vary (Table 5.1). In some cases, a patent licence is not
enough to allow a licensee to bring a new product or service to the market because of the
need for additional know-how in the form of documentation, software, samples, training
and education, and consulting services. This can lead to further interaction between firms,
which can also encourage the transfer of technology.
Patent licensing plays an increasingly important role in enhancing firms’
competitiveness and their innovative capabilities. While patents continue to play a role in
protecting firms’ inventions from imitation, they are also being exploited more actively to
generate revenue and improve access to financing. One of the more comprehensive surveys
of business patenting and innovation patterns (Cohen et al., 2002) found that US and
Japanese firms cited defensive reasons for patenting product innovations most frequently: to
prevent copying, to prevent other firms from patenting (i.e. blocking) and to prevent lawsuits.
A smaller, but still significant share of firms indicated that patenting was important for
strategic reasons as well: for use in negotiations (e.g. cross-licensing), to enhance reputation,
to generate licensing revenue and to measure performance (Table 5.2).1
Table 5.1. Some advantages and disadvantages of patent licensing
Inward licensing
Advantages • Licence payments tend to be less costly than in-house R&D.• Payment can be used to control risks if the payment scheme is designed prudently.• The time required for R&D and bringing new products to market is shorter.• Risks are lower for an invention that has already been commercialised.
Disadvantages • Some restrictions in licensing agreements may raise antitrust concerns.
Outward licensing
Advantages • High profitability, although revenue streams are uncertain.• Allows multiple licensees at the same time.• Lower risk than foreign direct investment (FDI).• Simplicity if licensee does not need technical advice or know-how.• Especially for SMEs, reduces risk associated with commercialisation by negating need to develop downstream
production facilities.
Disadvantages • Potentially creates rivals in downstream markets that could erode future profits.• Total profit usually smaller than with successful internal development.• Returns depend largely on the capabilities of licensees to develop and market the invention.
Table 5.2. Reason for patenting product innovation% of respondents and ordinal rank
United States Japan
Prevent copying 98.9 (1) 95.5 (1)
Patent blocking 80.3 (2) 92.6 (2)
Prevent lawsuits 72.3 (3) 90.0 (3)
Use for negotiations 55.2 (4) 85.8 (4)
Enhance reputation 38.8 (5) 57.9 (7)
Licensing revenue 29.5 (6) 66.7 (5)
Measure performance 7.8 (7) 60.1 (6)
Source: Cohen et al., 2002.
OECD SCIENCE, TECHNOLOGY AND INDUSTRY OUTLOOK 2006 – ISBN 92-64-02848-X – © OECD 2006 151

5. PATENT LICENSING MARKETS AND INNOVATION
Recent trends suggest that an increasing share of companies use patents, and
especially licensing, strategically to create firm value. An OECD survey of businesses, for
example, found that approximately 60% of responding firms had seen an increase in both
inward and outward patent licensing over the previous decade (Sheehan et al., 2004).2
Growth was reported more frequently by firms in the Asia-Pacific region and in North
America than in Europe. There would appear to be room for development of licensing
markets in Europe through measures to help reduce transaction costs, including search
costs for finding partners, fear of opportunism in negotiation, etc. (Gambardella, 2005). A
recent survey of European firms also found that licensing was the most common use of
patents for generating income (88% of respondents), followed by an alliance or partnership
(61%), joint venture (56%) and sale (38%). However, this is not because licensing is seen as
the most promising strategy for generating income. In fact, many firms assign a low
probability of success to efforts to commercialise an invention via licensing. They tend to
view franchising as the most successful method, even though it is used much less
frequently (DLA, 2004). The main reasons for the lack of successful commercialisation via
licensing may include weak performance by licensees and dissatisfaction with licence
agreements owing to a lack of negotiating skills.
Many researchers and business executives report that the use of patents has evolved
over time, from a focus on defensive applications (e.g. preventing competitors from
entering markets, enforcing patents against infringers) to exploitation as part of business
and management strategy (e.g. licensing, building a patent portfolio) to exploitation as a
financial asset (i.e. attracting external sources of finance). These stages are cumulative, and
firms today deploy patents for a broad range of purposes. Each stage has different
implications for valuation (Figure 5.1).
Intellectual asset management and new models of innovation
Patent licensing has received a significant boost from the development of more
comprehensive approaches to intellectual asset management (IAM). The basic goal of IAM
is to increase the business value obtained from intellectual assets via more comprehensive
valuation and management. A firm uses IAM to evaluate its patent portfolio and identify
Figure 5.1. An illustration of the evolution of IP exploitation and demand for valuation
Source: Otsuyama, 2003.
2. IP exploitation for securing superiority
1. IP exploitation for defence
3. IP exploitation as business strategy
4. IP exploitation as management strategy
5. IP exploitation as financial asset
- Expansion of alternative product designs- Enforcement against infringer
- Prevention of operation of other firms- Defence against attack from other firms
- Realisation of patents as legal “weapon”- Use as “source of profits”
- Securing ideal patent portfolio- Use actively as business assets
- Financing method for IP holding firms- Investing assets for financial institutions
Need for IPvaluation is low
Value of IP graduallybecomes important
Value of IP isrecognised
independently
IP valuationbecomes important
IP valuationbecomes essential
Creation and maintenance of IP
Evolution of IPexploitation and
value
OECD SCIENCE, TECHNOLOGY AND INDUSTRY OUTLOOK 2006 – ISBN 92-64-02848-X – © OECD 2006152

5. PATENT LICENSING MARKETS AND INNOVATION
patents that are not used for internal development but can to be licensed to others without
risking the firm’s own profitability. Firms also look for ways to generate cost savings or tax
benefits by abandoning or donating to non-profit organisations patents they do not plan to
commercialise themselves. They also defend their patent portfolios more aggressively.
Patent licensing is closely linked to a shift towards more open models of innovation in
which firms increasingly rely on external sources of knowledge and technology to
complement their internal innovation capabilities (Chesbrough, 2003; OECD, 2002). Such a
model of innovation management entails more collaborative research and greater in-
sourcing of technology from other innovating organisations, often through technology
licences or the acquisition of firms. The open innovation model is perhaps most evident in
the information and communications technology (ICT) sector, where it enables firms to
cope with accelerating innovation cycles, intensifying global competition, increasingly
complex products and services that incorporate multiple technologies, and the difficulty of
controlling all the intellectual assets and qualified people needed for innovation
(Hirosaki, 2005). Yet, open innovation is also found in industries such as pharmaceuticals,
with active technology in-sourcing from biotechnology start-ups. While large
pharmaceutical firms maintain significant in-house research capabilities, they rely
increasingly on externally sourced compounds to widen their product lines. In 2001, about
30% of the revenues of large pharmaceutical firms came from in-licensed drugs (Kalamas
et al., 2002); in recent years competition has become fiercer owing to the limited number of
available compounds, which gives licensors stronger bargaining power (Rogers, 1999).
Deals for late-stage drugs are on the rise.3 In 1990, large pharmaceutical firms paid about
USD 24 million for late-stage compounds to smaller biotech firms and in 2000 they paid an
average of USD 76 million for them (Picone, 2002).4
Unlocking latent economic value
Interest in licensing is also motivated by a growing appreciation of the extent to which
patents are systematically underutilised. There has been a worldwide surge in patenting:
more than 850 000 patent applications were filed in Europe, Japan and the United States
in 2002, compared to about 600 000 in 1992 (OECD, 2004a). By the end of 2002, there were
about 5 million patents in force worldwide (EPO et al., 2004). However, several recent
surveys indicate that most do not directly generate revenue for patent owners via
incorporation into products, processes and services or through licensing revenues:
● A survey by the British Technology Group of 150 technology-intensive firms and research
universities in the United States, western Europe and Japan found that 24% had more
than 100 unutilised patents, 12% had more than 1 000 and only 15% reported having
none. Approximately 30% of Japanese firms reported having more than 2 000 unused
patents (BTG, 1998).
● A 2003 survey of EPO patent applicants (about 700 responses) showed that licensed
patents in respondents’ patent portfolios averaged 8% among Japanese firms, 11%
among European firms and 15% among US firms (Roland Berger, 2005).
● A large-scale comprehensive survey conducted by the Japan Patent Office (JPO) (about
6 700 responses) found that only 30% of Japanese patents were being exploited
internally, less than 10% were being licensed out to other parties, and more than 60%
were unused (JPO, 2004).5
OECD SCIENCE, TECHNOLOGY AND INDUSTRY OUTLOOK 2006 – ISBN 92-64-02848-X – © OECD 2006 153

5. PATENT LICENSING MARKETS AND INNOVATION
There are many legitimate reasons for patent holders to refrain from exploiting their
patented inventions. Changes in business policies or product market conditions may affect
a firm’s ability to introduce related products or services, and the advent of new
technologies can make existing inventions obsolete. Alternatively, the decision not to
exploit an invention may reflect sound business judgement, balancing the costs of filing,
maintaining and protecting patents against the projected benefits of exploitation.
Nevertheless, patent licensing provides an alternative channel for unlocking the economic
value of unused patents by making the rights available to organisations that may have a
greater interest in – or ability to – exploit the invention. Recent research indicates that
licensing typically involves more valuable patents. Two European surveys (EPO and PatVal)
used different approaches, but found similar results regarding the distribution of patent
values. Distributions ranged from zero to more than EUR 300 million, with the median
value of licensed patents estimated at about EUR 760 000 in the PatVal survey and
EUR 500 000 in the EPO survey. The median value of all patents (licensed and unlicensed) in
the PatVal survey was about EUR 475 000.6 Work by Japan shows changes over time in the
value of licensed patents. The value of inward-licensed patents remained at around
JPY 30 to 40 million, but the value of outward-licensed patents increased from about
JPY 40 million in 1999 to JPY 80 million in 2002 (Motohashi, 2005). A study of US patents
also found that the average present value of a traded patent one year after grant was
USD 130 155, whereas it was USD 42 426 for non-traded patents (Serrano, 2005). The study
also found that patents that had previously been traded were more likely to be renewed
and more likely to be traded or sold again. Patents that received more citations (suggesting
quality) were also more likely to be traded.7
Generating licensing revenue
Patent licensing can generate significant financial benefits for patent holders. Dow
Chemical, for example, increased its IP licensing revenue from USD 25 million to
USD 125 million a year through patent licensing, and by better management of its patent
portfolio saved USD 50 million in intellectual property costs.8 These results were achieved
by exploiting 55% of the firm’s patents (as of 2002): 21% in practice, 9% used defensively,
and 25% licensed (Hillery, 2004). IBM Corp., which started to manage its IPR more actively
in the late 1990s and averaged more than 3 000 US patent grants a year between 2000
and 2004, received more than USD 1 billion in annual revenues from licensing royalties and
sales of IPR; about half of these revenues came from licensing.9 Other technology-intensive
firms such as DuPont, Merck and Amgen also report significant amounts from patent
licensing (Table 5.3). Texas Instruments reported USD 391 million in licensing revenue
in 1992 and was thought to have earned around USD 800 million a year by the end of the
decade (Rivette and Kline, 2000). Microsoft Corp. changed its IP management approach to
reduce its reliance on copyrights and secrecy in favour of greater reliance on patents, owing
to the emergence of the Internet and the need for greater openness and transparency in
software. Its new intellectual property policy, announced in 2004, is more open to outward
licensing, which should offset somewhat the costs of inward licensing, which stands at
around USD 1 billion.10
Japanese and European firms also profit from licensing, especially in the ICT sector. In
recent years, Sony Corp. and Canon Inc. earned roughly JPY 29 billion and JPY 20 billion a
year, respectively, from their patent licensing activities, and NEC earns more than
JPY 10 billion (Baba, 2003) To increase its licensing activity, NEC launched in 2003 a
OECD SCIENCE, TECHNOLOGY AND INDUSTRY OUTLOOK 2006 – ISBN 92-64-02848-X – © OECD 2006154

5. PATENT LICENSING MARKETS AND INNOVATION
searchable database listing patents available for licensing to third parties as part of its open
innovation strategy.11 Among European firms, Thomson increased its licensing revenue
from EUR 278 million in 1999 to EUR 462 million in 2003, which accounted for 5.5% of total
net sales in that year. Thomson has approximately 40 900 patents and pending
applications and 750 licensing agreements relating to a diversified mix of video products
and services. Thomson’s top ten licensees account for approximately 72% of its total
licensing revenues (Thomson, 2004).
There are, of course, limits to firms’ ability to profit from the licensing of patented
inventions. Some are reluctant to do so for fear of losing their competitive advantage and
therefore limit licensing to firms that operate outside their fields of business (Peters, 2005).
For example, Hitachi, which was one of Japan’s top licensors and was reported to have
earned licensing revenues of JPY 43 billion in FY 2002, changed its licensing policy in 2003
from one of openness to third party licensing to a more closed approach to preserve its
competitive advantage through greater control of inventions (Takahashi, 2005). This
strategic change resulted, in part, from the rapid improvement in the technology of Korean
and Chinese competitors. Though it is not clear that such shifts will be widespread among
firms that currently pursue an open licensing strategy, holding strong patents seems to be
a key success factor.
At the same time, firms can also benefit financially from their patents in indirect
ways. Some firms put patents into the public domain or offer non-exclusive, royalty-free
licences in order to encourage the development of a field of business in which they hope to
operate. This approach can also be used to establish an industry standard that may benefit
the patent holder.12 Such strategies do not result in royalty income, but may lead, for
example, to the rapid establishment of a de facto standard and enhance the reputation of
the patent holder. Similarly, many firms view the expenses associated with inward
licensing of patents not as a cost (or loss of revenue) per se, but as a means of preventing
patent infringement and costly litigation. Some firms are monitoring potential
infringements of their patents in order to generate future licences or cross-licenses. In a
recent survey of patent licensing, for example, Japanese firms (especially large ones)
reported that warnings of infringement were the most frequent stimulus to licensing,
ahead even of publication of patent documents (JTM, 2000).
Engaging small firms in innovation networks
Licensing can also improve the ability of small firms to participate in innovation
networks and economic value chains. In many industries, small firms lack the scale, scope
or market power to fully extract value from their patented inventions. While they can
Table 5.3. Reported licensing revenuesMillions of USD
Firm (industry) 2000 2001 2002 2003 2004% of net income(latest available)
DuPont (chemicals) 160 155 128 141 151 8
Merck (pharmaceuticals) 153 126 75 87 114 2
Amgen (biotechnology) 181 253 332 383 n.a. 17
IBM (computing) 528 465 351 338 393 5
Source: Corporate reports.StatLink: http://dx.doi.org/10.1787/277483782644
OECD SCIENCE, TECHNOLOGY AND INDUSTRY OUTLOOK 2006 – ISBN 92-64-02848-X – © OECD 2006 155
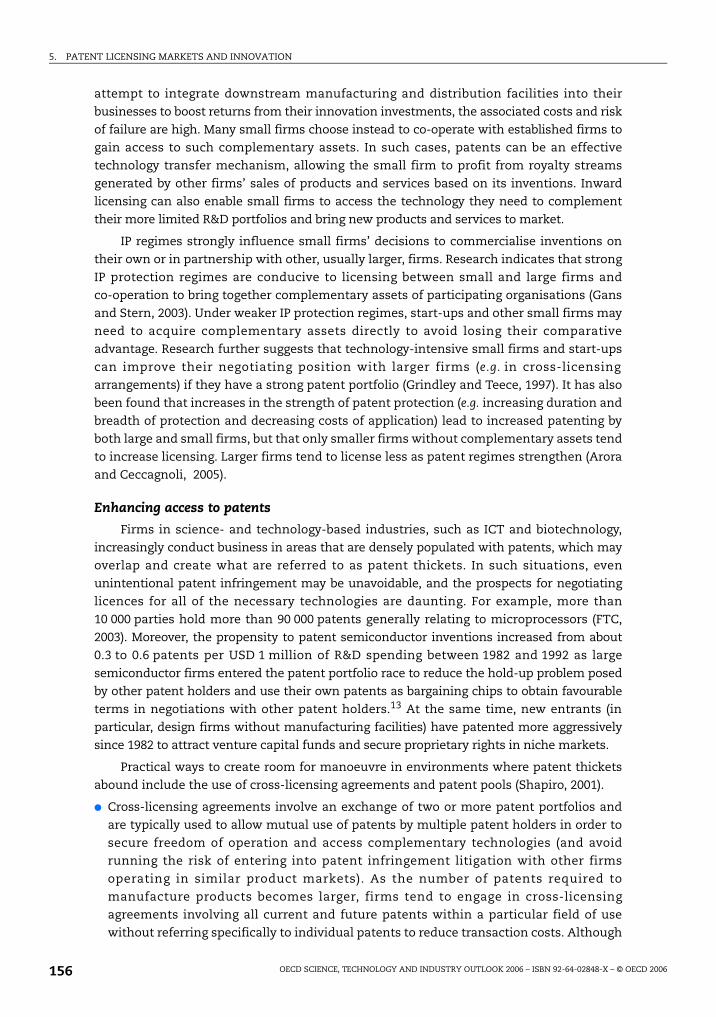
5. PATENT LICENSING MARKETS AND INNOVATION
attempt to integrate downstream manufacturing and distribution facilities into their
businesses to boost returns from their innovation investments, the associated costs and risk
of failure are high. Many small firms choose instead to co-operate with established firms to
gain access to such complementary assets. In such cases, patents can be an effective
technology transfer mechanism, allowing the small firm to profit from royalty streams
generated by other firms’ sales of products and services based on its inventions. Inward
licensing can also enable small firms to access the technology they need to complement
their more limited R&D portfolios and bring new products and services to market.
IP regimes strongly influence small firms’ decisions to commercialise inventions on
their own or in partnership with other, usually larger, firms. Research indicates that strong
IP protection regimes are conducive to licensing between small and large firms and
co-operation to bring together complementary assets of participating organisations (Gans
and Stern, 2003). Under weaker IP protection regimes, start-ups and other small firms may
need to acquire complementary assets directly to avoid losing their comparative
advantage. Research further suggests that technology-intensive small firms and start-ups
can improve their negotiating position with larger firms (e.g. in cross-licensing
arrangements) if they have a strong patent portfolio (Grindley and Teece, 1997). It has also
been found that increases in the strength of patent protection (e.g. increasing duration and
breadth of protection and decreasing costs of application) lead to increased patenting by
both large and small firms, but that only smaller firms without complementary assets tend
to increase licensing. Larger firms tend to license less as patent regimes strengthen (Arora
and Ceccagnoli, 2005).
Enhancing access to patents
Firms in science- and technology-based industries, such as ICT and biotechnology,
increasingly conduct business in areas that are densely populated with patents, which may
overlap and create what are referred to as patent thickets. In such situations, even
unintentional patent infringement may be unavoidable, and the prospects for negotiating
licences for all of the necessary technologies are daunting. For example, more than
10 000 parties hold more than 90 000 patents generally relating to microprocessors (FTC,
2003). Moreover, the propensity to patent semiconductor inventions increased from about
0.3 to 0.6 patents per USD 1 million of R&D spending between 1982 and 1992 as large
semiconductor firms entered the patent portfolio race to reduce the hold-up problem posed
by other patent holders and use their own patents as bargaining chips to obtain favourable
terms in negotiations with other patent holders.13 At the same time, new entrants (in
particular, design firms without manufacturing facilities) have patented more aggressively
since 1982 to attract venture capital funds and secure proprietary rights in niche markets.
Practical ways to create room for manoeuvre in environments where patent thickets
abound include the use of cross-licensing agreements and patent pools (Shapiro, 2001).
● Cross-licensing agreements involve an exchange of two or more patent portfolios and
are typically used to allow mutual use of patents by multiple patent holders in order to
secure freedom of operation and access complementary technologies (and avoid
running the risk of entering into patent infringement litigation with other firms
operating in similar product markets). As the number of patents required to
manufacture products becomes larger, firms tend to engage in cross-licensing
agreements involving all current and future patents within a particular field of use
without referring specifically to individual patents to reduce transaction costs. Although
OECD SCIENCE, TECHNOLOGY AND INDUSTRY OUTLOOK 2006 – ISBN 92-64-02848-X – © OECD 2006156

5. PATENT LICENSING MARKETS AND INNOVATION
a primary purpose of cross-licensing is to secure freedom of operation, establishing a
balancing royalty payment scheme from the owner of the weaker patent portfolio to that
of the stronger portfolio may be an important source of revenue. This requires valuing
the patents involved in the deal, which may substantially increase transaction costs
(Grindley and Teece, 1997).
● Patent pools typically consist of the collection of patents required to offer a product or
service. From the licensee’s perspective, an advantage of patent pools is to establish a one-
stop shop for the set of pooled patents, as this can help reduce the costs associated with
royalties and negotiation. To maximise the benefits of a patent pool, it is important to
collect as many of the required patents as possible while keeping total royalty payments
commercially reasonable. The design of the incentive scheme for encouraging patent
holders to join a patent pool is important, especially as regards patent holders that might
wish to remain outside the pool and demand high royalties for their patents. Kato (2003)
considers two possible approaches to this problem. In a differentiated royalty approach,
different royalties apply to different patents according to their value. An antitrust
approach may be applied if a royalty demanded by an outsider is extraordinarily high
compared to royalties demanded for patents within the pool, as this may indicate an
abuse of patent rights; the threat of an antitrust suit and related transaction costs may
lead the outsider to lower its royalties and join the patent pool.
A number of patent pools associated with technological standards are found in the ICT
sector, which requires many essential patents. An illustrative example is the MPEG-
2 patent pool which collects patents covering the MPEG-2 standard. The pool obtained de
facto approval from regulatory authorities by including only essential, complementary
patents – not substitute patents – which is one of the major determinants of approval for
patent pools. However, when the pool was formed, disagreements regarding the licensing
rate occurred. Some patent holders wished to profit from the MPEG-2 by selling products
based on the standard rather than by licensing their patents and hence wanted low royalty
rates. Others wanted higher licensing revenues and hence a higher royalty rate. Firms that
believed that they held critical patents attempted not to join the pool in order to charge a
separate, higher royalty rate (Lerner et al., 2003). In the end, a lower rate was adopted, but
not all firms joined the patent pool. MPEG-2 patents were widely licensed and the pool is
recognised as one of the most successful patent pools. In the biotechnology industry, there
are also concerns that as the number of patented research tools needed for drug
development increases, R&D may be impeded because of the difficulty of assembling the
necessary patents and the formidable costs that might be involved.14 Patent pools have
been suggested as a possible solution to this problem (USPTO, 2000; JPO, 2002).15
The magnitude of the effect of patenting on access to inventions for research is not
clear. A recent survey on biomedical researchers in universities, government and non-profit
institutions (Walsh et al., 2005) yields findings similar to those of an earlier study (Walsh
et al., 2003) that showed little evidence of R&D being terminated owing to difficulties in
obtaining licenses from multiple IP owners. Out of the 32 respondents who were aware of
relevant third-party IP, four reported a change in their research plans and five reported
delays, but none reported abandoning the research. Another recent survey by the American
Association for the Advancement of Science (AAAS), however, found that 40% of the
179 respondents – 76% in the biosciences industry – reported that their research was affected
by difficulties in accessing patented technologies: 58% reported delays, 50% reported
changes in their research plans, and 28% abandoned their research. Overly complex
OECD SCIENCE, TECHNOLOGY AND INDUSTRY OUTLOOK 2006 – ISBN 92-64-02848-X – © OECD 2006 157

5. PATENT LICENSING MARKETS AND INNOVATION
licensing negotiations (58%) were the most common reason for changing or abandoning
research, followed by high individual royalties (49%) (Hansen et al., 2005). As innovation
becomes more science-based and multidisciplinary research draws together researchers and
innovators from different fields with different practices for protecting IP, limitations on
research access may become more widespread.16 Governments will need to monitor the
situation to determine if additional steps need to be taken to facilitate research access.
Measuring technology marketsThe size and evolution of technology licensing markets are difficult to measure at the
national or regional level, because of a lack of robust statistics. Most patent licensing is
based on private contracts that are subject to confidentiality agreements, so that
comprehensive time-series data on patent licensing are not available.17 Accounting rules
do not require firms to disclose patent licensing revenues as a separate item in corporate
reports, and while most OECD countries have regulatory requirements for reporting
licensing contracts, these are mostly related to cross-border transactions, and data are
published only at aggregate level. As a result, disclosure of patent licensing activity
depends largely on firm policy, and although disclosure of information on licensing
revenues has been shown to have a positive effect on investors (Gu and Lev, 2004), most
firms elect not to make such information public.18 Hence, available data on patent
licensing are limited, scattered and lacking in uniformity despite demand for systematic
data, especially from academic researchers, which could help better evidence-based policy
making. Nevertheless, some general observations can be made.
Global patterns of patent licensing
Available information suggests that markets for technology are large and growing. In
the United States, it has been estimated that patent licensing revenues rose from
USD 15 billion in 1990 to more than USD 100 billion in 1998, and experts estimate that
revenue could top USD 500 billion annually by the middle of next decade (Rivette and Kline,
2000). A recent Japanese survey indicates that inward licensing revenues increased from
JPY 230 billion in 1994 to JPY 360 billion in 2001, while outward licensing jumped from
JPY 170 billion in 1994 to JPY 420 billion in 2002 (Motohashi, 2005). Another conservative
estimate indicates that total worldwide licensing transactions (domestic and international)
averaged more than USD 36 billion a year between 1990 and 1997 – considerably higher
than the estimated average of USD 5.6 billion in the 1980s. The estimate includes the value
of licensing and royalty payments, equity investments and R&D funding provided in return
for licensing rights (Arora et al., 2001).
Regional differences in the development of technology licensing markets can also be
observed through royalty payments and receipts of the three main OECD regions. A survey
conducted by the European Patent Office in 2004 found that spending on inward licensing was
equivalent to 5.6% of spending on R&D for US firms, 22.0% for Japanese firms and 0.8% for
European firms; royalty receipts amount to 6.0%, 5.7% and 3.1% of R&D spending in the United
States, Japan and Europe, respectively. These findings are generally consistent with results of
an earlier survey by BTG, which found that spending on inward licensing during the 1990s was
equivalent to 12% of R&D spending in the United States, 10% in Japan and 5% in Europe
(Gambardella, 2005). A more recent study, however, found that total inward licensing in Japan
remained at about 3% to 4% of R&D spending between 1994 and 2002, and outward licensing
expenditures increased from 0.06% to 0.14% of total sales revenues (Motohashi, 2005).
OECD SCIENCE, TECHNOLOGY AND INDUSTRY OUTLOOK 2006 – ISBN 92-64-02848-X – © OECD 2006158

5. PATENT LICENSING MARKETS AND INNOVATION
Sectoral differences
Patent licensing practices also differ from one industry sector to another, reflecting
differences in the dynamics of innovation and the role of patenting in innovation
processes. Anand and Khanna (2000) attempt to identify industry differences with respect
to patent licensing based on information from the SDC strategic alliances database. They
examine licensing contracts involving US participants between 1990 and 1993. Their main
findings include:
● Licensing is concentrated in selected industries. About 80% of licensing deals occur in three
industries: 46% in the chemical industry, including drugs; 22% in the electronic and
electrical equipment industry, including semiconductors; and 12% in the industrial
machinery and equipment industry, including computers.
● Prior relationship is important for engaging in licensing contracts. About 30% of licensing deals
are signed between parties having a prior relationship. This tendency is stronger in
computer and electronics firms than in chemicals.
● Exclusivity and restriction clauses are more common in chemical firms. More than half of the
deals in chemicals involve some exclusivity clauses, which are less common in
computers (18%) and electronics (16%). Restrictions such as field of use, geographical
domain and contract length are more common in chemicals (40%) than computers and
electronics (30%).
● Cross-licensing is frequent in electronics. Cross-licensing is more common in electronics
(20%) than in other industries (10%). It is more common for transfers of technology that
has not yet been developed than for ex post transfers.19
Similar sectoral differences have been reported in more recent surveys as well. In the
OECD survey, respondents from the ICT sector were the most likely to report increases in
outward licensing (about 80% of respondents), suggesting that licensing out has become
important as a source of revenue for ICT firms. In contrast, respondents from the
pharmaceutical industry were most likely to report increases in inward licensing (about
80% of respondents), reflecting the trend of licensing in from small biotechnology firms.
Across all sectors, around 70% of respondents expected the importance of inward and
outward patent licensing to rise in the next five years (Sheehan et al., 2004). A recent study
in Japan found similar results, with the pharmaceutical and ICT industries the two
dominant sectors for the share of inward and outward licensing between 1994 and 2002,
and with smaller and younger firms using licensing more frequently than larger,
established firms (Motohashi, 2005).
Another study, also based on information from the SDC database on strategic alliances
but using more recent data (1985-2002) finds similar results and identifies several factors
that affect firms’ propensity to engage in licensing agreements positively (Vonortas and
Kim, 2004). Companies will tend to engage in licensing agreements: the closer their
technological profiles; the closer their market profiles; the more familiar they are with each
other through prior agreements; the higher their prior independent experience with
licensing; and the stronger the intellectual property protection in the licensor’s primary
line of business. All these factors affect licensing transaction costs and indicate that
reducing transaction costs may be more important when licensing occurs across sectors,
whereas strategic and competition-related factors may be more important when licensing
occurs between firms in the same industry.
OECD SCIENCE, TECHNOLOGY AND INDUSTRY OUTLOOK 2006 – ISBN 92-64-02848-X – © OECD 2006 159

5. PATENT LICENSING MARKETS AND INNOVATION
International licensing
International licensing also appears to be on the rise and accounts for a significant
share of total patent licensing. Receipts from international licensing worldwide appear to
have grown steadily since the mid-1980s; this is consistent with growth in the number of
US patent applications per unit of R&D (Arora, 2005). International receipts for intellectual
property (including patents, copyrights, trademarks, etc.) increased from USD 10 billion
in 1985 to approximately USD 110 billion in 2004, with more than 90% of the receipts going
to the three major OECD regions: the European Union, Japan and the United States
(Figure 5.2). Total payments showed a similar trend, climbing to approximately
USD 120 billion in 2004, up from USD 8.3 billion in 1985.20 While receipts remain
considerably higher in the United States than in the EU or Japan, growth rates in the latter
have been equal or faster over the past 20-year period.
At the national level, indicators of technology licensing also show significant
increases. For European countries, OECD data on receipts from international licensing and
transfers of patents show steep increases in France and Germany during the 1990s
(Figure 5.3). In France, receipts increased by more than a factor of seven between 1990
and 2003 from EUR 330 million to EUR 2.4 billion (ignoring inflation), while in Germany
they doubled from EUR 1.3 billion to EUR 2.7 billion. In contrast, receipts remained
relatively flat in Italy at roughly EUR 200 million to EUR 300 million a year. In Japan, patent
licensing revenue from foreign parties totalled JPY 340 billion in fiscal year 2002, and
Japanese firms spent approximately JPY 210 billion on foreign licences, yielding a surplus
of JPY 130 billion (Figure 5.4). Other work indicates that international licensing has
increased significantly in Japan since 1994 and accounts for most of the increase in total
licensing activity (Motohashi, 2005).
Much international licensing reflects transactions among affiliated businesses. In
Japan, for example, transactions among affiliated firms accounted for approximately 60%
of international royalty receipts and 14% of royalty payments in 2002 (Figure 5.4). If
Figure 5.2. Receipts from international licensing in major OECD regionsBillions of USD
Source: OECD based on World Bank, World Development Indicators Database, June 2006.StatLink: http://dx.doi.org/10.1787/324047030044
0
20
40
60
80
100
120
1980
1981
1982
1983
1984
1985
1986
1987
1988
1989
1990
1991
1992
1993
1994
1995
1996
1997
1998
1999
2000
2001
2002
2003
2004
European Union Japan United States World
OECD SCIENCE, TECHNOLOGY AND INDUSTRY OUTLOOK 2006 – ISBN 92-64-02848-X – © OECD 2006160

5. PATENT LICENSING MARKETS AND INNOVATION
business transactions within affiliated firms are excluded, Japan’s technology licensing
trade surplus (of JPY 130 billion) becomes a deficit of JPY 45 billion (JPO, 2004).
Nevertheless, there are indications that the share of transactions among unaffiliated firms
is growing. In the United States, the share of transactions among unaffiliated firms in the
international trade balance of intellectual property (royalties and fees) almost doubled
from about 20% in 1996 to more than 40% in 2001.21 The share of German trade income
from international intellectual property transactions with unaffiliated foreign firms
doubled from about 5% in 2002 to 10% in 2003 (Wurzer, 2005).
Figure 5.3. Receipts from international patent licences and sales in EuropeMillions of EUR
Source: OECD Technology Balance of Payments Database.StatLink: http://dx.doi.org/10.1787/808603842486
Figure 5.4. International balance of payments for patent licences in Japan,total and within group, FY2002
Billions of JPY
Note: Data are estimated based on responses from a sample of firms.
Source: JPO, 2004.StatLink: http://dx.doi.org/10.1787/468364016187
0
1 000
2 000
3 000
4 000
1990 1991 1992 1993 1994 1995 1996 1997 1998 1999 2000 2001 2002 2003
Germany France Italy
-300
-200
-100
0
100
200
300
400
Payments
Receipts
United States Europe Asia Others Cross-border total
Group
OECD SCIENCE, TECHNOLOGY AND INDUSTRY OUTLOOK 2006 – ISBN 92-64-02848-X – © OECD 2006 161

5. PATENT LICENSING MARKETS AND INNOVATION
Public policy plays a role in international technology transfers. The strength of IPR
regimes affects international transfers of technology between parents and affiliates. A recent
study found that US multinationals respond to changes in foreign IPR systems (changes that
strengthen IPR in foreign countries) by increasing technology transfers to those countries
(Branstetter et al., 2004).22 Affiliates also respond to increasing technology transfers by
increasing their R&D expenditure to modify their parent firm’s technology to meet local
market needs. Similarly, an examination of licensing transactions between the late 1980s
and the early 2000s shows that strong IPR regimes generally provide incentives for
international licensing activities, such as joint ventures and strategic alliances, between
firms in developed countries (licensors) and firms in developing countries (licensees). The
correlation between the strengthening of patent rights and the level of attractiveness for
licensing appears to vary from one industry to another (Park and Lippoldt, 2004).
Encouraging patent licensing: the role of public institutionsVarious efforts have been made by national and regional governments and
international organisations to foster and promote patent licensing and to encourage firms
to make better use of patents to improve firms’ competitiveness and national economic
performance. These public efforts recognise that developing an intellectual property rights
regime that is conducive to innovation entails consideration of more than the relative
strength of patent regimes and should include specific efforts to facilitate the diffusion of
knowledge. To this end, public organisations have taken a number of steps, from improving
patent quality, to convening workshops and seminars, to formulating guidelines and
revising relevant legislation, and to establishing databases of licensable patents.
National efforts in the area of IP valuation and exploitation reflect different views of the
role of government in this respect. The Japanese government, for example, has taken a
proactive approach to stimulating value creation from IP: its Intellectual Property Policy
Outline of 2002 aims to revitalise the Japanese economy through intellectual property, and
its 2006 Intellectual Property Strategic Programme includes about 370 action items, up from
270 in 2003.23 In Germany, the government plays a more limited role centred around reducing
administrative burdens for the business community, improving coherence between policies at
the national, European and international levels, and ensuring the efficient operation of the
patenting system (Niemeier, 2005). The United States takes a more decentralised approach,
with different public bodies addressing specific bottlenecks in the system. In spite of these
differences, there are certain commonalities in countries’ basic approaches, as outlined below.
Improved patent administrationA prerequisite for improving the exploitation of the economic value of patents and
facilitating licensing markets is an efficient and effective patenting system. High-quality
patents that are issued in a timely fashion and enforceable in the marketplace can withstand
judicial challenges and provide innovators and investors with greater confidence in the
validity – and value – of a patent. Ensuring quality of granted patents can also help reduce
the number of less valuable patents in the system. Achieving this goal implies:
● Proper screening of applications to ensure that patents meet the patent law criteria of
utility, novelty and non-obviousness.
● Short processing times. The time between the filing of an application and the grant
decision is a time of legal uncertainty, which deters licensing and reduces value,
especially for inventions in rapidly evolving sectors.
OECD SCIENCE, TECHNOLOGY AND INDUSTRY OUTLOOK 2006 – ISBN 92-64-02848-X – © OECD 2006162

5. PATENT LICENSING MARKETS AND INNOVATION
● Affordable patentingcosts to ensure that filing and maintenance costs do not deter
inventors from using the patent system and thereby reducing opportunities for
subsequent exploitation such as licensing or attraction of external capital. This does not
necessarily imply low patenting fees – indeed too low a fee can encourage patenting of
trivial inventions – but matching fee structures to the financial resources of different
types of inventors (e.g. individuals, start-up firms, large multinationals).
● Guarantee of clarity and transparency in the patenting process. As published documents serve
as the basis for licensing deals and valuation, they should set out the essence of the
invention in clear terms and include its assessment by the patent examiner.
Most major patent offices, such as the trilateral patent offices (the EPO, the JPO and the
USPTO), have the relevant processes in place already, but continuing efforts are valuable for
responding to changing circumstances and improving performance. For example, the
trilateral offices are attempting to increase the number of patent examiners in order to
speed up examination and improve the quality of granted patents. The number of
examiners in the EPO and USPTO have risen to roughly 3 500 from about 2 000 in the mid-
1990s and further increases are intended. In Japan, in addition to recruiting regular patent
examiners, the JPO has arranged to employ specialists as fixed-term examiners, adding
about 100 a year between 2004 and 2008. As of 2005, there are about 1 400 patent
examiners in the JPO (1 162 regular and 196 fixed-term examiners).
Additional steps can be taken to improve patent quality. In 2003, the UK Patent Office,
for example, became the world’s first patent office to receive ISO 9001:2000 certification
(the international standard for quality management system). To secure certification of its
examination process, various operations in the UKPO underwent external assessment,
including training, quality assurance procedures, ICT systems, workflow management and
customer relations. Consistent with the standard and to ensure search and examination
quality, quality assurance reviews are conducted on samples of recent searches and
examinations. The assessment criteria for the check sample include appropriateness of
the search strategy, objections to applicants and timeliness.24
International co-operation can also help meet these objectives. Currently, the trilateral
patent offices are exploring the possibility of sharing prior-art searches and examination
results to speed up their examinations. Comparative studies of examination practices
(industrial applicability, novelty, non-obviousness, etc.) for important and emerging
technologies such as biotechnology and business-method-related inventions have been
conducted to improve comparability of examination practices across patent offices and
improve the quality of issued patents.25 In addition to its internal quality assurance efforts,
the UKPO proposed in 2002 a common quality framework for the international phase of
Patent Convention Treat (PCT) applications (i.e. for search and preliminary examination);
the framework was incorporated into draft PCT guidelines in 2003.26
Improving disclosure of patent and licence information
Public authorities also have a role to play in ensuring timely disclosure of information
regarding patents and, in some cases, patent licences. ICT developments, notably the
Internet, have brought dramatic changes in patenting procedures, including systems for
disseminating patent information. Currently, many patent offices in developed countries
provide free access to searchable databases with information on patent applications and
grants.27 The information provided by such databases is fundamental for acquiring
OECD SCIENCE, TECHNOLOGY AND INDUSTRY OUTLOOK 2006 – ISBN 92-64-02848-X – © OECD 2006 163
5. PATENT LICENSING MARKETS AND INNOVATION
information on state-of-the-art technology and for avoiding unexpected infringement of
third party rights and overlapping R&D investments and patent applications.
In addition, efforts have been made to improve provision of information about
inventions that are available for licence. The European Commission created the Community
Research and Development Information Service (CORDIS) which provides information about
EU R&D programmes and transferable technologies.28 Germany’s Federal Ministry of
Education and Research (BMBF) provides partial funding for the INSTI network, which
comprises 39 private and public regional institutions for the stimulation of innovation,
exploitation of inventions and promotion of the patent system in general.29 INSTI runs the
Internet-based service called Innovation Market to link buyers and sellers of technology.30
The USPTO publishes an official gazette which includes information on licensable patents,
which it believes is used more by small than by large firms.31
Taking over from the JPO in 2001, Japan’s National Centre for Industrial Property
Information and Training (NCIPI), an independent administrative institution, has been in
charge of a licensing promotion programme. The programme includes the creation of a
patent licensing database, which is accessible via the Internet free of charge and lists
licensable patents from firms, public research organisations (PROs) such as universities
and other inventors. As of March 2006, more than 58 000 licensable patents had been
registered. In addition to a description of the technology, the licence information provides
the terms of the licence, applicable products, etc.32
Matchmaking services
Beyond providing information to markets about patents and licences, a number of
governments have taken steps to facilitate matchmaking more actively between buyers
and sellers of technology. In some cases, such programmes are embedded in outreach and
education programmes. As indicated by two recent surveys, a 2003 survey by the Japan
Institute of Invention and Innovation (JIII) conducted in Japan (JIII, 2003)33 and the
Licensing Executives Society International (LESI) survey in the United States and Canada
(Razgaitis, 2004),34 identifying potential licensees seems to be one of the major
impediments to successful licensing. Government efforts in this area are varied, but aim to
complement the capabilities of private-sector intermediaries, which are growing in
number and scope in OECD countries (Box 5.1).35
The European Commission (EC), for example, established a network of 70 Innovation
Relay Centres (IRCs) in 1995. Services include help in matching buyers and sellers of
technology, including through the Internet-based system in collaboration with the CORDIS
Technology Market Place, and provision of advice on innovation, intellectual property,
licensing and negotiation. These services are mainly targeted at technology-based SMEs. To
date, the IRCs have facilitated about 1 000 technology transfer agreements, including signed
agreements for the sale, licensing, distribution or joint development of new technologies.36
In the United States, the National Technology Transfer Center (NTTC), established by
Congress in 1989, provides access to federally funded technology and market assessment
services, technology marketing, and assistance in finding strategic partners. Technologies
such as those developed by NASA are searchable via the Internet.37 In FY 2002,
20 commercialisation deals were facilitated and about 850 people participated in training
courses.
OECD SCIENCE, TECHNOLOGY AND INDUSTRY OUTLOOK 2006 – ISBN 92-64-02848-X – © OECD 2006164

5. PATENT LICENSING MARKETS AND INNOVATION
Box 5.1. IP and technology intermediaries
Intermediaries play an important role in the valuation and exploitation of IP. Asinnovation processes have become more open and firms have begun to source more oftheir technology needs from external sources, markets for technology have expanded, ashas the role of intermediaries. Intermediaries provide value added along four dimensions(Stern, 2005):
● Connectivity: They have access to key gatekeepers and relationships with venturecapitalists and SMEs. Furthermore, they tend to have cross-industry and cross-geography experience and knowledge.
● Confidentiality: They provide a good opportunity for screening and for initial discussions.At that stage, they guarantee that the client’s name and the technology application isprotected.
● Expertise: They have experience in major evaluation and communication methods aswell as market and buy-side knowledge. Furthermore, they have business formationand commercialisation skills.
● External perspective: They provide an external perspective by giving unbiased evaluationsand offering critical thinking which may be absolutely essential to successfully leveragetechnology assets.
Intermediaries take several forms and set different customer targets (e.g. multinationalenterprises, SMEs and universities) and services. They include:
● Technology licensing offices deal mainly with patents arising from university and otherPROs; these institutions have responsibility for identifying potential licensees andnegotiating licences.1 The number of such organisations has grown as PROs have begunto more actively manage their IP, often with encouragement or support from theirgovernments.
● Patent transaction intermediation systems, including various web-based platforms on whichpatent holders post licensable inventions and technology-seeking parties post theirneeds. In recent years, a number of such websites have failed and a series of mergersand acquisitions has consolidated the number of remaining intermediaries.2
● Comprehensive service providers assist clients in acquisition, commercialisation andinvestment in technologies, patent protection and assertion, with the aim to levy royaltyincome; they also monitor patent infringement.3
● Specialists in particular technology fields, such as biotechnology and ICT, provide a range ofIP services to organisations in their field of expertise.4
In general, large firms organise internally the commercialisation of core technologiesrelated to their primary markets, but they may seek the help of intermediaries forcommercialising their core technologies in other markets and commercialising non-coretechnologies. Intermediaries also provide services for SMEs to find large companies forcollaborative development and distribution purposes. Technology licensing by SMEs canresult in strategic alliances and cross-licensing to other SMEs. For universities andresearch institutes, intermediaries can assist in the creation of spin-out companies as wellas with the management and licensing of patents.
1. For more information on PROs patenting and licensing and TLOs, see OECD (2003).2. See, for example, Yet2.com, www.yet2.com/app/about/about/aboutus. In 2002, Scipher plc, a parent of QED
Intellectual Property Ltd., acquired Yet2.com. QED was acquired by Innovation Development Ltd. in 2004.See www.qed-p.com/pr/2003_jan_15.htm, www.qed-ip.com/pr/2004_May_14.htm.
3. See, for example, BTG, www.btgplc.com.4. See, for example, ThinkFire Services, www.thinkfire.com.
OECD SCIENCE, TECHNOLOGY AND INDUSTRY OUTLOOK 2006 – ISBN 92-64-02848-X – © OECD 2006 165

5. PATENT LICENSING MARKETS AND INNOVATION
The JPO and Japan’s NCIPI, in addition to providing a database of licensable patents,
also offer matchmaking services that aim to link buyers and sellers of patented inventions
through mechanisms such as licensing fairs and patent licensing advisors.
Patent licensing fairs (JPO): These fairs provide a meeting place for parties providing and
seeking technology. In FY 2004, fairs were held in eight cities, more than 600 firms
participated and more than 170 000 people attended (Yonetsu, 2005).
Patent licensing advisors (NCIPI): A patent licensing advisor is an expert in technology
transfer. As of March 2006, more than 100 advisors were dispatched to prefectural
governments, technology licensing offices (TLOs), etc. Their activities include: i) collection
of technological needs and licensable seeds by visiting firms and PROs; ii) matching firms;
and iii) support for a contract. Consultations and advice are free of charge. The economic
impact has been estimated at more than JPY 200 billion between 1997 and 2005; the
programme is attributed with creating about 7 000 technology transfer contracts during the
period and more than 1 000 new jobs between 1997 and 2003.38
Support for patenting and licensing in public research organisations
Most OECD government officials recognise the need to support patenting and
licensing efforts in public research organisations, both universities and government
research laboratories in order to increase the economic and social benefits from public
investments in R&D by facilitating the commercialisation of inventions. To this end, a first
step is to enact the legal reforms necessary to allow public research institutions to retain
the rights to IP resulting from government-funded research and, in some cases, to require
them to seek opportunities to commercialise inventions. In the United States, the Bayh-
Dole Act of 1980 allows small businesses and non-profit organisations, including
universities, to elect to retain title to inventions derived from federally funded R&D. In
Japan, two laws were enacted in the late 1990s to support the exploitation of patents in
universities. One supports the establishment of TLOs; the second is the Japanese version of
Bayh-Dole Act. Many other OECD countries have taken similar steps.39
Most OECD countries also recognise that, even with an accommodating regulatory
framework, promotion of patenting and patent exploitation by public research institutions
requires specific support and incentives. Efforts are needed to develop the human
resources for effective IP management and the requisite financial and management
systems. According to leading technology transfer officials, effective TLOs require staff that
combine broad business experience with technological depth. They need sufficient
financial resources to maintain operations so as to avoid the temptation to focus on
generating revenue from licensing instead of transfer of technology. They also need ways
to solicit advice from IP and legal experts and a clear mission that can be used in
performance assessment (Secher, 2005).40
Japan’s regulatory regime provides public research organisations and technology
licensing offices with an exemption or reduction of 50% of the annual fees for patents and
the fees for requesting examinations. In addition, since 2002, the JPO has dispatched
private-sector IP managers as IP management advisors to universities to establish IP
management units. Regional Bureaus of Economy, Trade and Industry organise seminars
for researchers in PROs to explain the significance of social exploitation of research results
via patenting and how to draw up patent specifications. As of March 2005, these efforts had
OECD SCIENCE, TECHNOLOGY AND INDUSTRY OUTLOOK 2006 – ISBN 92-64-02848-X – © OECD 2006166

5. PATENT LICENSING MARKETS AND INNOVATION
been credited with producing a six-fold increase in the number of patent applications from
PROs since 1999, a seven-fold increase in universities’ royalty income and 1 100 new spin-
offs from universities (Arai, 2005).41
In Europe, national governments have also taken steps to support patent management
in PROs. The BMBF in Germany, for example, provides support to universities for
establishing regional patent exploitation agencies, such as the Patent Centre for German
Research of the Fraunhofer Gesellschaft which manages inventions from universities.42 In
Finland, Tekes (the National Research Agency) periodically provides training courses for
researchers to enhance their awareness of IP, including how to patent. These efforts seem
to have contributed to the increase since 2001 in patent applications from universities and
small and medium-sized enterprises (SMEs). Tekes also covers the patenting costs arising
from academic and SME research projects (Heikinheimo, 2005).43
In the United Kingdom, the Lambert Review, an independent review of business-
university collaboration, concluded in 2003 that technology transfers via business-
university collaborations needed to be improved in order to enhance the United Kingdom’s
innovation performance. The review also noted that major practical difficulties
encountered in setting up contractual agreements often lead to the abandonment of
collaboration projects. To improve this situation, the UKPO launched a programme to
produce a set of five model contracts for research collaboration to facilitate business-
university negotiations, to be used on a voluntary basis. This so-called Lambert Model
Toolkit addresses key issues related to IP ownership, use of research results, the financial
contribution of businesses and publication criteria for universities (Cullen, 2005).44
Training, education and outreach to small firms
Some governments in OECD countries also have initiated programmes of IP-related
training and education to help patent holders better recognise the value of their patents,
make better use of the patent system and engage more actively in licensing activities. A
number of these efforts specifically target small firms, which are perceived to have more
limited understanding of the patent system and less capability for engaging in technology
licensing. Support programmes for patenting and patent exploitation in small firms take
forms similar to those for universities, such as information seminars for human resources
and financial support. However, in some cases, policy makers may need to account of their
different roles in society, when formulating support programmes.
Germany’s BMBF has set up an SME patent action fund (KMU-Patentaktion) that offers
financial support to small firms for expenses ranging from patent application to
exploitation. The USPTO holds an annual conference for independent investors which
includes licensing and marketing experts and focuses on the needs of small entities.
Assistance and education activities of the US Small Business Administration include
elements related to IPR management such as how to protect inventions via the patent
system (Santamauro, 2005). Under US patent law, applications and maintenances fees have
also been reduced (by 50%) for SMEs, independent inventors and non-profit
organisations.45
To assist in the decision to request examination, a private organisation under contract
to Japan’s JPO has conducted prior-art searches free of charge for small firms since 2004. In
addition to PROs and TLOs, small firms and new ventures can also benefit from reduced
fees (50%) for the annual patent fees and the fees to request examinations. Some support
OECD SCIENCE, TECHNOLOGY AND INDUSTRY OUTLOOK 2006 – ISBN 92-64-02848-X – © OECD 2006 167

5. PATENT LICENSING MARKETS AND INNOVATION
is also available to private-sector intermediaries that assist firms in the patenting and
licensing process. To foster the development of a more mature private-sector IP
intermediary business, a nationwide directory of intermediaries has been created (as of
August 2005, 66 intermediaries were registered), and a number of seminars have been
organised to provide opportunities for intermediaries to exchange information.
Efforts are also under way at the international level. Initiatives of the Small and
Medium-Sized Enterprises Division of the World Intellectual Property Organisation (WIPO)
include organising seminars and workshops across the globe and providing web-based
information (articles, case studies, etc.) for IP licensing, valuation and financing. A training
manual, “Exchanging Value – Negotiating Technology Licensing Agreements”, which
addresses practical issues related to negotiating technology licensing agreements, was
released in co-operation with the International Trade Centre (ITC) in 2005.46
Valuation tools
Efficient patent licensing markets demand improved and reliable patent valuation
methods and tools (Box 5.2). These have been developed mainly by the private and
academic sectors. However, in some countries, governments have developed analytical
tools to help firms value and exploit their patents. The idea is to promulgate use of a
common set of well-defined tools that enables patent holders to more easily and
accurately value their patent holdings and provide some assurance of the validity of the
valuation.
One of the best-known efforts is that of the Danish Patent and Trademark Office
(DKPTO), which released a report in 2000 on “Management and Evaluation of Patents and
Trademarks”, The report included two evaluation models (qualitative method) for patents
and trademarks, similar to the patent evaluation indexes promulgated by the JPO (Ernst
and Young and Ementor Management Consulting, 2000). In 2001, the DKPTO released a
basic model of an IP management software tool named IPscore® as an aid in the evaluation
and strategic management of patents and development projects. The software provides
qualitative assessment of a patented technology by evaluating five categories (legal status,
technology, market conditions, finance and strategy). It also enables the calculation of
quantitative financial forecasts of the value of a patented technology based on information
on development costs, development time, market conditions and product conditions
(Nielsen, 2004).47 The EPO has decided to acquire the rights to IPscore® from the DKPTO
and to make the programme available to patent offices across member states and to their
patent libraries. The tool is intended for preliminary screening of the value of a patent
portfolio and to provide information that can be used by patent attorneys and capital
investors (Pompidou, 2005).
Regulations and guidelines for patent licensing
To promote patent or technology licensing, steps have been taken to clarify regulations
and guidelines that can affect firm behaviour. For example, Japan’s Fair Trade Commission
prepared guidelines to clarify competition policy issues related to patent pools affecting
technology standards.48 In addition, in 2005 Japan introduced the New Bankruptcy Law,
which strengthens the protection of IP licensees when licensors face bankruptcy. At the
international level, the OECD Council has adopted Guidelines for the Licensing of Genetic
Inventions which outline principles and best practices for the licensing of genetic
inventions used for purposes of human health care.49 At the European Union level, a new
OECD SCIENCE, TECHNOLOGY AND INDUSTRY OUTLOOK 2006 – ISBN 92-64-02848-X – © OECD 2006168
5. PATENT LICENSING MARKETS AND INNOVATION
technology transfer block exemption regulation, with a safe harbour rule governing patent
licensing, know-how and software copyright, entered into force in May 2004 as part of a
broader set of reforms to competition law that are expected to reduce bureaucracy and
increase legal certainty.50 It is too early to know the effect of these reforms on licensing
practices.
Box 5.2. Methods for patent valuation
Improved valuation can facilitate not only technology transfer, but also a full range ofchannels for exploiting IP. Firm managers, for example, must value patents when decidingwhether or not to file a patent application or renew a patent, when calculating royalties forpatent licensing contracts, when estimating the value of a possible merger or acquisition,and when estimating their own corporate value. Financial institutions need to calculatethe value of patents when they are used as collateral for bank loans; and investors andfinancial analysts value patents to assess the value of firms as a basis for investmentdecisions and recommendations. Various approaches to valuing patents have beenproposed by experts and several have been put into practice. Each has strengths andweaknesses, and it is very important to choose the most appropriate method available foreach case. Methods used for business purposes can be generally divided into two groups,qualitative and quantitative valuation methods. Several attempts have also been made touse econometric methods to measure the economic value of patents.
Qualitative patent valuation methods
Qualitative valuation methods attempt to rate and score patents on the basis of factorssuch as the strength and breadth of patent rights and their legal certainty. These methodshave been often used for internal patent management, owing to their relative simplicitycompared to quantitative valuation methods.
Quantitative patent valuation methods
The cost approach is based on the cost of obtaining a patented invention by either internaldevelopment or external acquisition. It relies on calculation of the reproduction orreplacement cost of the patented invention. In spite of its potential for application in othersettings, the cost approach is not widely used for patent valuation because it does notreflect the future economic value of the patent.
The market approach uses comparable patent transactions in the market as a basis forobtaining the value of the patent. However, small numbers and lack of transparency abouttheir characteristics make this approach less reliable and useful than others.
The income approach attempts to calculate the present value of the projected futureincome flow arising from the patent during its economic life. The discounted cash flowmethod allows an estimated future income flow to be converted to a present value bydiscounting the estimated future income flow with a discount rate. One of the mostdifficult challenges in this approach is to set the discount rate.
Econometric approaches to patent valuation
A variety of econometric approaches based on citation data, renewal data and patentholder’s estimation of value have been studied. For example, Hall et al. (2000) employedcitation-weighted US patent stocks to build an indicator of patent quality and showed thatoften cited patents (forward citations) are highly valued by markets. Firms with suchpatents (more than 20 citations per patent) showed a 50% increase in value relative tofirms with the same level of R&D and patent stocks, but with a median citation intensity.
OECD SCIENCE, TECHNOLOGY AND INDUSTRY OUTLOOK 2006 – ISBN 92-64-02848-X – © OECD 2006 169

5. PATENT LICENSING MARKETS AND INNOVATION
Financial incentives for patent licensing
Some countries have also introduced specific financial incentives for patent licensing.
The patent offices of Germany, France and the United Kingdom have introduced a system
of licences-of-right that offer patent holders a discount on renewal fees (of 40% to 50%) in
exchange for their agreement to offer non-exclusive licences to any party requesting
them.51 A number of firms have taken advantage of licences-of-right, with large electronics
firms appearing to be the most frequent users. Further evaluation of this mechanism is
needed to better understand its impact on licensing behaviour and the types of patents
that are introduced into the system.
In addition, a number of countries use their tax systems to encourage patenting and
licensing. One way to do this is by offering tax reductions on royalties generated by patent
licences. In general, countries in Europe, North America and East Asia treat patent royalties
similarly in their tax codes: royalties received are treated as taxable income, which is taxed
at the prevailing corporate income tax rates; expenses related to patenting, purchase of
patents and payment of patent royalties are deductible from taxable business income and
not taxed. However, some countries provide special incentives for patenting income. The
Irish government offers a full tax exemption for royalty income generated by the licensing
of patents that result from R&D conducted in Ireland. Switzerland, Hungary and Korea
offer a partial deduction, typically 50%, in income tax. France offers reductions in capital
gains tax under certain conditions (Warda, 2006).
Tax codes can also promote technology transfer via the donation of patents to non-
profit organisations. The US Internal Revenue Service (IRS) confirmed as long ago as 1958
that patent holders could receive tax benefits for donations of intellectual property to non-
profit organisations (Layton and Bloch, 2004).52 Firms that donate patents can avoid the
administrative costs associated with their maintenance and renewal, as well as the costs
of internal management, but the aim of donation provisions in tax codes is to generate
societal benefits by giving an unexploited invention a chance to be developed and put into
practice (Marcinkowski, 2001). Of course, such donations can have other benefits, too, such
as enhancing the donor’s reputation as an industry leader and good corporate citizen, and
establishing valuable relationships with recipients that may lead to future joint ventures.
In practice, the benefits of such donations are unclear. Interviews with more than
80 US firms, universities, IP appraisers and the IRS confirmed only non-quantifiable
benefits for donors and recipients of IP, owing in part to their reluctance to provide
financial information related to donated patents.53 Moreover, scepticism about the
seemingly high values assigned to the donated patents has mounted, resulting in
increased IRS scrutiny of such donations (Layton and Bloch, 2004). While firms have always
been required to retain independent appraisers to value donations, implementation of new
legislative provisions would require tax deductions for patent donations to be based on the
realised economic benefits derived from the donated patents.54
ConclusionThis chapter suggests that firms extract value from their patents not only by using
patent protection to establish a dominant position in the market place, but also by gaining
additional revenue and access to complementary technology via licensing or by using the
patents as bargaining chips in negotiations with other firms (e.g. cross-licensing). Improved
exploitation demands greater efficiency in technology licensing markets.
OECD SCIENCE, TECHNOLOGY AND INDUSTRY OUTLOOK 2006 – ISBN 92-64-02848-X – © OECD 2006170

5. PATENT LICENSING MARKETS AND INNOVATION
While the main players for developing technology markets and related valuation
techniques will come from the private sector, some government efforts are also required.
These vary from country to country and organisation to organisation. There is a general
consensus about the need for governments to ensure the efficient operation of patent
systems, to provide information on patent applications and grants, and to put in place
regulatory environments that encourage patent management in PROs. Most governments
have also taken steps to support education and training programmes for particular
populations of patent holders (e.g. PROs, SMEs), and some have begun to complement or
support industry efforts to develop valuation models. Co-operation among stakeholders and
co-operation among governments can help facilitate such efforts and develop good practice.
International efforts are required in many fields, including collection of data related to
technology markets, in order to develop improved indicators and ensure more reliable policy
analysis. International organisations can play a significant role in meeting these needs.
Notes
1. A recent German survey found that use for negotiation ranked fourth behind protection, blockingand reputation building. Use for negotiation was found to be especially important for smallcompanies with fewer than 50 employees (BMBF, 2004).
2. Total responses, 105. For the sectoral breakdown: Chemicals (excluding pharmaceuticals) (21),Pharmaceuticals (22), Information and communications (13), Machinery (33) and others (16). Forthe geographical breakdown: Asia-Pacific (17), Europe (68) and North America (20).
3. Late-stage compounds are attractive as a means of reducing risks for drug development andmaking more immediate revenue streams (Picone, 2002; Rogers, 1999). This is true even thoughlate-stage drugs are ten times more expensive than early-stage drugs and about one-third of alllicensing deals occur at an early stage (Kalamas et al., 2002).
4. Established pharmaceutical firms are less active in outward than in inward licensing.Between 1995 and 1998, the top ten US drug firms signed only about 50 outward licensing deals butmore than 200 inward deals. Possible explanations for top pharmaceutical firms’ reluctance toengage in outward licensing include the desire to keep their intellectual property, fear that smallfirms (licensees) may not be able to develop and market end products successfully, and low prioritygiven to out-licensing by management (Rogers, 1999).
5. Since 2002, the JPO has carried out an annual survey of IP-related activity. Respondents are askedabout: i) their use of their IPR; ii) the status of their exploited IPRs; iii) the licensing revenue balanceresulting from IPR; iv) operations implemented at IP divisions; and v) IPR infringement suits.
6. The EPO survey calculated the value of licensed patents from the average royalties received by apatent holder (firm) divided by the number of licensed patents of patent holders (conductedin 2004). The PatVal survey reviewed about 9 000 patents in France, Germany, Italy, Netherlands,Spain and the United Kingdom during 1993-97 and asked applicants the minimum price at whichthey would sell the patent if asked.
7. The study also showed that a patent’s value declines with age. The estimated mean value of apatent one year after grant was USD 57 900; those in the 99.8 percentile had a value ofUSD 1 185 477. Patents four years old had a mean value of USD 43 350, but those in the99.8 percentile had a value of USD 1 226 341. A patent with only one citation after eight years wasfound to have an estimated probability of being traded of 0.0177; patents with 60 citations had aprobability of being traded of 0.038; those with 100 citations, a probability of 0.063.
8. See www.ipambestpractices.com/Info/GordonP%20bio.pdf.
9. IBM has received more US patents than any other private-sector organisation for the past 12 years.See www.uspto.gov/web/offices/com/speeches/05-03.htm. Reported licensing and sale revenues fromIP were USD 1.4 billion in 2000, USD 1.2 billion in 2001, USD 0.86 billion in 2002, USD 0.9 billionin 2003 and USD 0.86 billion in 2004. Data from annual corporate reports.
10. Summary of remarks by David Kaefer, Director of Business Development, Microsoft Corporation atthe OECD Forum on Business Performance and Intellectual Assets, 6 October 2004. Seewww.oecd.org/dataoecd/51/13/33848750.pdf.
11. For further details see www.ipr-nec.com/en/.
OECD SCIENCE, TECHNOLOGY AND INDUSTRY OUTLOOK 2006 – ISBN 92-64-02848-X – © OECD 2006 171

5. PATENT LICENSING MARKETS AND INNOVATION
12. For example, in 2005 IBM announced open access to 500 IBM software patents to individuals andgroups working on open source software and proposed developing a patent commons to spurinnovation in this area. Subsequent announcements made available sets of patents related tohealth and education uses of ICT. See www1.ibm.com/businesscenter/venturedevelopment/us/en/featurearticle/gcl_xmlid/26770/nav_id/inthenews.
13. Patent intensity declined in the pharmaceutical industry between 1982 and 1992, from about 0.2 to0.1 patent per million USD of R&D. Hall and Ziedonis (2001) attribute the high propensity to patentin the semiconductor industry to a series of pro-patent changes during those years, such as theestablishment in 1982 of the US Court of Appeals for the Federal Circuit (which hears IPR-relatedcases), Polaroid’s successful patent infringement suit against Kodak and the successful assertionof patents in courts by firms such as Texas Instruments.
14. This situation is commonly referred to as “the tragedy of the anti-commons”, the antithesis of “thetragedy of the commons”, which arises when people tend to overuse resources when resources areowned in common. The tragedy of the anti-commons occurs instead when resources areprivatised by multiple owners and people tend to underuse resources owing to difficulties innegotiating permission to use resources with owners (Heller and Eisenberg, 1998).
15. Pooling patents related to DNA chips has been suggested in Japan (JPO, 2002). A white paper of theUnited States Patent and Trademark Office discusses the benefits of pooling biotechnology patents(USPTO, 2000).
16. This was one of the conclusions of a conference on Research Use of Patented Inventions organisedby the OECD, the Spanish Research Council and the Spanish Patent and Trademark Office inMay 2006.
17. Some patent-related laws stipulate registration of licences; however, most licensing contracts arenot registered.
18. Based on their survey, Gu and Lev (2004) estimate that roughly half of the firms conducting patentlicensing do not disclose their royalty income.
19. This trend is also observed in Japan. Indeed, the ratio of cross-licensing to outward licensing isabout 90% in the electronics industry, while it is less than 20% in the chemicals industry (JPO, 2004).
20. The definition of payments and receipts from licensing used by the World Development Indicators(WDI) of the World Bank is as follows: “Royalty and license fees are payments and receipts betweenresidents and nonresidents for the authorized use of intangible, nonproduced, nonfinancial assetsand proprietary rights (such as patents, copyrights, trademarks, industrial processes, andfranchises) and for the use, through licensing agreements, of produced originals of prototypes(such as films and manuscripts).”
21. The royalties and license fees accounts cover transactions with non-residents that involvepatented and unpatented techniques, processes, formulas and other intangible proprietary rightsused in the production of goods; transactions involving trademarks, copyrights, franchises,broadcast rights and other intangible rights; and the rights to distribute, use and reproducegeneral-use computer software. See US Bureau of Economic Analysis, Survey of Current Businessin 2002 at www.bea.gov/bea/ARTICLES/2002/10October/1002InServ.pdf.
22. This study examined royalty payments from US multinational affiliates located in 12 foreigncountries that underwent IPR reform.
23. The strategic program is annually revised. Major achievements of the strategic program includes:i) establishment of an IP high court; ii) creation of university IP headquarters; iii) measures againstcounterfeit and pirated copies; iv) increase of patent examiners; v) promotion of media contentbusiness; and vi) enactment of 18 (more than 25 as of June 2006) IP-related laws (Arai, 2005). Forthe 2006 version, see www.kantei.go.jp/jp/singi/titeki2/kettei/060609keikaku.pdf (in Japanese).
24. For details, see www.patent.gov.uk/patent/quality/index.htm.
25. See www.jpo.go.jp/torikumi_e/kokusai_e/tws/new.htm.
26. See www.wipo.int/pct/reform/qualityframework/en/.
27. Links to Industrial Property Digital Library (IPDL) are provided by several patent offices atwww.ipdl.ncipi.go.jp/links_e.htm and the IPDL in Japan at www.ipdl.ncipi.go.jp/homepg_e.ipdl.
28. See www.cordis.lu/en/home.html.
29. See www.insti.de (in German).
30. See www.innovation-market.de (in German). Furthermore the BMBF has set up a nationwide networkof Inventors Clubs for individual inventors, students, apprentices and pupils.
OECD SCIENCE, TECHNOLOGY AND INDUSTRY OUTLOOK 2006 – ISBN 92-64-02848-X – © OECD 2006172

5. PATENT LICENSING MARKETS AND INNOVATION
31. See www.uspto.gov/web/offices/com/sol/og/2005/week06/patlics.htm.
32. Access to the database, www.ryutu.ncipi.go.jp/en/db/index.html.
33. Respondents (695 firms, universities and technology licensing offices) were asked aboutimpediments to successful licensing negotiations. Shortage of information about possiblelicensees (28.1%) is the second major impediment following difficulty with the validity of patentvaluations (67.3%).
34. Out of a total of 229 respondents, 26% of potential licensees were identified for licensableintellectual assets and 27% of negotiations were started after identifying the potential licensees.
35. Intermediaries should not be confused with so-called patent trolls that acquire unexploitedpatents cheaply – such as from bankrupt firms – and attempt to raise money from damage awardsor licensing fees by suing or threatening other firms with infringement suits. Recent legislationintroduced to the US Congress, Patent Act of 2005, contains provisions that would limit (directly orindirectly) the activities of patent trolls.
36. See http://irc.cordis.lu/.
37. See www.nttc.edu/default.asp.
38. See www.ryutu.ncipi.go.jp/about/seika_i.html (Japanese) and www.ryutu.ncipi.go.jp/en/pdf/guide-e.pdf.
39. See OECD (2003) and OECD (2004b) for a review of these efforts.
40. According to licensing experts, the number of spin-offs from a public-sector technology transferoffice does not constitute an adequate performance measurement. Rather, the assessment has tobe linked to the mission of the office, which may be oriented more towards income generation ormore towards the transfer and diffusion of new technological knowledge (Secher, 2005).
41. According to the 2006 Japanese IP Strategic Programme, the number of university spin-offs wasabout 1 500 by end March 2006.
42. This agency is also involved in the exploitation of inventions of SMEs and individual inventors.
43. Tekes’ primary mission is to sponsor research projects performed by universities, SMEs and largefirms to promote the competitiveness of Finnish industry and service sectors, by sustaining thedevelopment of high-value technological application (Heikinheimo, 2005).
44. For further information and the Internet version of the toolkit, see www.innovation.gov.uk/lambertagreements/. A CD-ROM version is also available from the UKPO, see www.patent.gov.uk/about/ippd/knowledge/lambert.htm.
45. 35 USC. 41
46. See www.wipo.int/sme/en/documents/guides/technology_licensing.htm.
47. See www.dkpto.dk/int/patents/ipscore.htm.
48. See www.jftc.go.jp/pressrelease/05.june/05062902.pdf (Japanese).
49. See www.oecd.org/sti/biotechnology/licensing.
50. See press release (ref.IP/04/470) at http://europa.eu.int/rapid/pressReleasesAction.do?reference=IP/04/470&format=HTML&aged=0&language=EN&guiLanguage=en.
51. For more information about the system in the United Kingdom, see www.patent.gov.uk/patent/indetail/lofright.htm. The German Patent and Trade Mark Office provides a searchable database oflicences-of-right in the patent register at https://dpinfo.dpma.de.
52. The use of patent donations for tax deductions did not gain much attention until the late 1990s.In 1996, Dow Chemical donated patents to Case Western Reserve University, setting a precedentfor patent donations by other large firms with significant R&D, such as Procter and Gamble, Boeing,Caterpillar and Eastman Chemical (Layton and Bloch, 2004).
53. Securing the financial benefits of patent donations appears to be a more serious issue for non-profit organisations than corporate donors because recipients must pay maintenance fees afterreceiving donated patents. For example, the University of Virginia received patents valued at morethan USD 7 million via donation, but was unable to successfully commercialise them. Theuniversity eventually put them in public domain in order to stop paying maintenance fees. Seewww.m-cam.com/downloads/20030108_donation-whitepaper.pdf.
54. The American Job Creation Act, passed by in Congress in late 2004, changes the basis of calculatingthe tax deduction resulting from patent donations. Under the new rule, the donor can deductportions (10-100%) of the income from the exploitation of underlying patents in limitedsubsequent years following the donation (Warda, 2006).
OECD SCIENCE, TECHNOLOGY AND INDUSTRY OUTLOOK 2006 – ISBN 92-64-02848-X – © OECD 2006 173

5. PATENT LICENSING MARKETS AND INNOVATION
Bibliography
Anand, B.N. and T. Khanna (2000), “The Structure of Licensing Contracts”, The Journal of IndustrialEconomics, 48(1), 103-135.
Arai, H. (2005), “Strategy in Japan on IP Valuation and Exploitation”, presentation at EPO-OECD-BMWAInternational Conference on Intellectual Property as an Economic Assets: Key Issues in Valuationand Exploitation, 30 June-1 July 2005, Berlin, www.oecd.org/sti/ipr.
Arora, A. (2005), “Patents: Who Uses Them, for What and What Are They Worth?”, presentation at EPO-OECD-BMWA International Conference on Intellectual Property as an Economic Assets: Key Issuesin Valuation and Exploitation, 30 June-1 July 2005, Berlin, www.oecd.org/sti/ipr.
Arora, A. and M. Ceccagnoli (2005), “Patent Protection, Complementary Assets, and Firms’ Incentivesfor Technology Licensing”, forthcoming Management Science.
Arora, A., A. Fosfuri and A. Gambardella (2001), Markets for Technology: The Economics of Innovation andCorporate Strategy, MIT Press, Cambridge, Mass.
Baba, R. (2003), “Are Patent Strategies of Japanese Companies OK?” Introductory Chapter, in Samejima,M., ed., Patent Strategy Handbook, Chuokeizai-sha, Tokyo.
Federal Ministry of Education and Research, Germany (BMBF) (2004), Technologie und Qualifikation fürneue Märkte,www.technologische-leistungsfaehigkeit.de/de/1869.php.
Branstetter, L.G., R. Fisman and C.F. Foley (2004), “Do Stronger Intellectual Property Rights IncreaseInternational Technology Transfer? Empirical Evidence from US Firm-Level Panel Data”, WorldBank Research Working Paper, No 3305.
British Technology Group (BTG) (1998), IPR Benchmark Study.
Chesbrough, H. (2003), Open Innovation: The New Imperative for Creating and Profiting from Technology,Harvard Business School Press, Boston, Mass.
Cohen, W.M., A. Goto, A. Nagata, R.R. Nelson and J. P. Walsh (2002), “R&D Spillovers, Patents and theIncentives to Innovate in Japan and the United States”, Research Policy, 31, 1349-1367.
Cullen, L. (2005), “Exploitation through Collaboration: Saving Time and Cost Negotiating IP Rights”,presentation at EPO-OECD-BMWA International Conference on Intellectual Property as anEconomic Assets: Key Issues in Valuation and Exploitation, 30 June-1 July 2005, Berlin,www.oecd.org/sti/ipr.
DLA (2004), European Intellectual Property Survey.
Ernst and Young and Ementor Management Consulting (2000), Management and Evaluation of Patents andTrademarks , Consultants’ Analysis Report for Danish Patent and Trademark Office,www.innovationskraft .dk/publ ications/reports/analysis_patent_trademark/management_and_evaluation_of_patents_and_trademarks.pdf.
European Patent Office (EPO), Japan Patent Office (JPO) and United States Patent and Trademark Office(USPTO) (2004), Trilateral Statistical Report 2003 Edition,www.jpo.go.jp/torikumi_e/kokusai_e/tws/tsr2003/ch2.pdf.
Federal Trade Commission (FTC) (2003), To Promote Innovation: The Proper Balance of Competition and PatentLaw and Policy, www.ftc.gov/os/2003/10/innovationrpt.pdf.
Gambardella, A. (2005), “Assessing the Market for Technology in Europe”, presentation at EPO-OECD-BMWA International Conference on Intellectual Property as an Economic Assets: Key Issues inValuation and Exploitation, 30 June-1 July 2005, Berlin, www.oecd.org/sti/ipr.
Gans, J.S. and S. Stern (2003), “The Product Market and the Market for ‘Ideas’: CommercializationStrategies for Technology Entrepreneurs”, Research Policy 32, 333-350.
Grindley, P.C. and D.J. Teece (1997), “Managing Intellectual Capital: Licensing and Cross-licensing inSemiconductors and Electronics”, California Management Review 39(2), 8-41.
Gu, F. and B. Lev (2004), “The Information Content of Royalty Income”, Accounting Horizons, 18(1), 1-12.
Hall, B.H., A. Jaffe and M. Trajtenberg (2000), “Market Value and Patent Citations: A First Look”, NBERWorking Paper 7741.
Hall, B.H. and R.H. Ziedonis (2001), “The Patent Paradox Revisited: An Empirical Study of Patenting inthe US Semiconductor Industry, 1979-1995”, RAND Journal of Economics, 32(1), 101-128.
OECD SCIENCE, TECHNOLOGY AND INDUSTRY OUTLOOK 2006 – ISBN 92-64-02848-X – © OECD 2006174

5. PATENT LICENSING MARKETS AND INNOVATION
Hansen, S., A. Brewster and J. Asher (2005), Intellectual Property in the AAAS Scientific Community: ADescriptive Analysis of the Results of a Pilot Survey on the Effects of Patenting on Science, http://sippi.aaas.org/survey/.
Heikinheimo, R. (2005), “Valuation of Intellectual Property in Tekes Decision Making”, presentation atEPO-OECD-BMWA International Conference on Intellectual Property as an Economic Assets: KeyIssues in Valuation and Exploitation, 30 June-1 July 2005, Berlin, www.oecd.org/sti/ipr.
Heller, M.A. and R.S. Eisenberg (1998), “Can Patents Deter Innovation? The Anticommons in BiomedicalResearch”, Science, 280, 698-701.
Hillery, J.S. (2004), Securitization of Intellectual Property: Recent Trends from the United States, www.iip.or.jp/summary/pdf/WCORE2004s.pdf.
Hirosaki, B. (2005), “Intellectual Asset Strategy at NEC: Integration of Business Strategy and OpenInnovation”, presentation at EPO-OECD-BMWA International Conference on Intellectual Propertyas an Economic Assets: Key Issues in Valuation and Exploitation, 30 June-1 July 2005, Berlin,www.oecd.org/sti/ipr.
Japan Institute of Invention and Innovation (JIII) (2003), Survey on Patent Valuation System in PatentLicensing Market, JIII, Tokyo.
Japan Patent Office (JPO) (2002), Survey on Technology Trend of Patent Application: Post Genome RelatedTechnology, JPO, Tokyo.
JPO (2004), Results of the Survey on Intellectual Property-Related Activities, 2003, JPO, Tokyo.
Japan Technomart Foundation (JTM) (2000), Report on Follow-up Survey on Patent Licensing PromotionPolicy, JTM, Tokyo.
Kalamas, J., G.S. Pinkus and K. Sachs (2002), “The New Math for Drug Licensing”, The McKinsey Quarterly, 4.
Kato, H. (2003), “Technical Standards and Patent Pools: Actual Conditions and Problems”, in Trends ofLicensing Agreements in the Industrial Sector and Subsequent Economic Problems, Institute of IntellectualProperty, Tokyo.
Layton, R. and P. Bloch (2004), IP Donations: A Policy Review, International Intellectual Property Institute,Washington, DC, www.iipi.org/reports/IP_Donations_Policy_Review.pdf.
Lerner, J., J. Tirole and M. Strojwas (2003), “Cooperative Marketing Agreements between Competitors:Evidence from Patent Pools”, NBER Working Paper 9680.
Marcinkowski, M. (2001), “Donating Intellectual Assets”, re: Business, PricewaterhouseCoopers.
Motohashi, K. (2005), “Understanding Technology Market: Quantitative Analysis of Licensing Activitiesin Japan”, presentation at EPO-OECD-BMWA International Conference on Intellectual Property asan Economic Assets: Key Issues in Valuation and Exploitation, 30 June-1 July 2005, Berlin,www.oecd.org/sti/ipr.
Nielsen, P.E. (2004), “Evaluating Patent Portfolios – A Danish Initiative”, World Patent Information 26,143- 148.
Niemeier, W. (2005), Speech at EPO-OECD-BMWA International Conference on Intellectual Property asan Economic Assets: Key Issues in Valuation and Exploitation, 30 June-1 July 2005, Berlin,www.oecd.org/sti/ipr.
OECD (2002), Science, Technology and Industry Outlook 2002, OECD, Paris.
OECD (2003), Turning Science into Business: Patenting and Licensing at Public Research Organisations, OECD,Paris.
OECD (2004a), Patents and Innovation: Trends and Policy Challenges, OECD, Paris.
OECD (2004b), Science, Technology and Industry Outlook 2004, OECD, Paris.
OECD (2005a), Intellectual Property as an Economic Asset: Key Issues in Valuation and Exploitation. Background andIssues, EPO-OECD-BMWA International Conference 30 June-1 July 2005, Berlin, www.oecd.org/sti/ipr.
OECD (2005b), Intellectual Property as an Economic Asset: Key Issues in Valuation and Exploitation. SummaryReport, EPO-OECD-BMWA International Conference 30 June-1 July 2005, Berlin, www.oecd.org/sti/ipr.
Otsuyama, H. (2003), “Patent Valuation and Intellectual Assets Management”, Chapter 5, in Samejima,M., ed., Patent Strategy Handbook, Chuokeizai-sha, Tokyo.
Park, W. and D. Lippoldt (2004), “International Licensing and the Strengthening of Intellectual PropertyRights in Developing Countries”, OECD Trade Policy Working Papers 10, OECD, Paris.
OECD SCIENCE, TECHNOLOGY AND INDUSTRY OUTLOOK 2006 – ISBN 92-64-02848-X – © OECD 2006 175

5. PATENT LICENSING MARKETS AND INNOVATION
Peters, R. (2005), “The Role of IP in the Global Economy”, presentation at EPO-OECD-BMWAInternational Conference on Intellectual Property as an Economic Assets: Key Issues in Valuationand Exploitation, 30 June-1 July 2005, Berlin.
Picone, T.A. (2002), “Pharmaceutical Licensing during the Revolution”, Chapter 10, in Goldscheider, R.,ed., The LESI Guide to Licensing Best Practices, John Wiley and Sons, New York.
Pompidou, A. (2005), Speech at EPO-OECD-BMWA International Conference on Intellectual Property asan Economic Assets: Key Issues in Valuation and Exploitation, 30 June-1 July 2005, Berlin,www.oecd.org/sti/ipr.
Razgaitis, R. (2004), “US/Canadian Licensing in 2003: Survey Results”, Les Nouvelles, Journal of theLicensing Executives Society, 39(4), 139-151.
Rivette, K.G. and D. Kline (2000), Rembrandts in the Attic: Unlocking the Hidden Value of Patents, HarvardBusiness School Press, Boston, Mass.
Rogers, R.S. (1999), “Battling for Blockbusters”, Chemical and Engineering News, February.
Roland Berger (2005), Applicant Panel Survey 2004 of Intentions for Filing Patent Applications at the EuropeanPatent Office and Other Offices.
Santamauro, J.P. (2005), “Patent Valuation, Exploitation and the Public Sector”, presentation at EPO-OECD-BMWA International Conference on Intellectual Property as an Economic Assets: Key Issuesin Valuation and Exploitation, 30 June-1 July 2005, Berlin, www.oecd.org/sti/ipr.
Secher, D. (2005), “What Makes a Good University Technology Transfer Office?”, presentation at EPO-OECD-BMWA International Conference on Intellectual Property as an Economic Assets: Key Issuesin Valuation and Exploitation, 30 June-1 July 2005, Berlin, www.oecd.org/sti/ipr.
Serrano, C.J. (2005), “The Market for Intellectual Property: Evidence from the Transfer of Patents”,www.researchoninnovation.org.
Shapiro, C. (2001), “Navigating the Patent Thicket: Cross Licenses, Patent Pools, and Standard-Setting”,in Jaffe, A. et al. eds., NBER Innovation Policy and the Economy, 119- 150, MIT Press, Cambridge, Mass.
Sheehan, J., C. Martinez and D. Guellec (2004), “Understanding Business Patenting and Licensing:Results of a Survey”, Chapter 4, in Patents, Innovation and Economic Performance, Proceedings of anOECD Conference, OECD, Paris.
Stern, P.B. (2005), “The Role of Intermediaries in Technology Transfer”, presentation at EPO-OECD-BMWA International Conference on Intellectual Property as an Economic Assets: Key Issues inValuation and Exploitation, 30 June-1 July 2005, Berlin, www.oecd.org/sti/ipr.
Takahashi, T. (2005), Intellectual Assets Strategy and Corporate Accounting, Koubundou Publishers, Tokyo.
Thomson (2004), 2003 Form 20F, www.thomson.net/EN/Home/Investor/AnnualReports.htm.
United States Patent and Trademark Office (USPTO) (2000), Patent Pools: A Solution to the Problem of Accessin Biotechnology Patents?, www.uspto.gov/web/offices/pac/dapp/opla/patentpool.pdf.
Vonortas, N.S. and Y.J. Kim (2004), “Technology Licensing”, Chapter 10, in Patents, Innovation andEconomic Performance, Proceedings of an OECD Conference, OECD, Paris.
Walsh, J.P., A. Arora and W.M. Cohen (2003), “Effects of Research Tool Patents and Licensing onBiomedical Innovation”, in Cohen, W.M. et al., eds., Patents in the Knowledge-Based Economy, TheNational Academies Press, Washington, DC.
Walsh, J.P., C. Cho and W.M. Cohen (2005), “View from the Bench: Patents and Material Transfers”,Science, 309, 2002-2003.
Warda, J. (2006), “Tax Treatment of Business Investments in Intellectual Assets, An InternationalComparison”, OECD STI Working Paper 2006/4, OECD, Paris, www.oecd.org/dataoecd/53/4/36764076.pdf.
Wurzer, A. (2005), “IP and Technology Intermediaries”, presentation at EPO-OECD-BMWA InternationalConference on Intellectual Property as an Economic Assets: Key Issues in Valuation andExploitation, 30 June-1 July 2005, Berlin, www.oecd.org/sti/ipr.
Yonetsu, K. (2005), “Activities of the JPO and NCIPI”, presentation at EPO-OECD-BMWA InternationalConference on Intellectual Property as an Economic Assets: Key Issues in Valuation andExploitation, 30 June-1 July 2005, Berlin, www.oecd.org/sti/ipr.
OECD SCIENCE, TECHNOLOGY AND INDUSTRY OUTLOOK 2006 – ISBN 92-64-02848-X – © OECD 2006176

ISBN 92-64-02848-X
OECD Science, Technology and Industry Outlook 2006
© OECD 2006
Chapter 6
Evaluation of Publicly Funded Research: Recent Trends and Perspectives
Recognition of innovation’s importance to economic well-being has made evaluationa central feature of the effective management and governance of publicly fundedresearch. Evaluation can aid in better understanding the effectiveness of differenttypes of policy instruments and inform decision making with respect to thecontinuation of innovation policy instruments. Today, evaluation is needed toaddress a more complex set of questions in a more complex innovation system.Consequently evaluation tools are evolving to keep pace with changing needs. Thischapter examines recent trends in innovation policy evaluation measures in OECDcountries. It reviews various approaches to evaluation – methodology, institutionalsetting and links to policy making – and different targets of evaluation.
177

6. EVALUATION OF PUBLICLY FUNDED RESEARCH: RECENT TRENDS AND PERSPECTIVES
IntroductionEvaluation has become a central part of the management and governance of publicly
funded research.1 A combination of factors has led to an increased emphasis on the need to
evaluate R&D policy. First, it is recognised that in a knowledge-driven economy science and
technology are key drivers both of economic competitiveness and of better quality of life for
citizens. Publicly funded research programmes are now typically conceived with such aims
in mind, even for basic science. Because governments want to ensure that their investment
in research is sensibly allocated and is yielding the expected return, they use evaluation to
learn about the scale, nature and determinants of that return. More generally, evaluation
helps policy makers better ascertain the intended and unintended effects of policies and
programmes, to learn from past successes and failures, and to inform decisions to continue
or to discontinue existing support measures or to introduce new ones.
Evaluation has its own historical context and dynamics and has co-evolved with the
research system. New approaches are developed to deal with emerging policy instruments
and concerns, and in return they help in the design and development of these instruments.
Four major trends have underpinned recent changes in evaluation practices:
● Tighter public governance. As part of a broader movement towards improved public
management, research funding has become far more conditional upon performance
against specified targets in the context of more systematic “contractualisation” of the
relationship between researchers and those to whom they are accountable.
● Research as competition. Research has always had an element of competition,
e.g. regarding the publication of new findings or access to resources. Recently, other
forms of competitive pressures, such as international ratings and rankings of research
groups and institutions, have gained in importance and are transforming the perception
of research excellence.
● Increasing focus on interfaces between research fields and between research and the economy
and society. This has called in particular for renewed efforts to properly evaluate
multidisciplinary research and industry-science relationships.
● Technical maturity and greater political acceptance. Evaluation methodologies and tools have
reached a degree of maturity. Policy makers have more confidence in evaluation and use
its results more and more in resource allocation and system-shaping decisions.
Greater policy demand for evaluation increases the need to determine, on the basis of
international experience, the conditions under which evaluation can best help improve the
efficiency of public spending on R&D. This is challenging since evaluation is not only a
technical but also a social process and involves the use of various tools to disentangle a
complex web of causal relationships at different levels of the research system (Box 6.1).
This chapter reviews different approaches to evaluation, including methodology,
institutional setting and links to policy making. It is structured according to the object of
evaluation and distinguishes four levels: i) the institutes and groups that constitute the basic
OECD SCIENCE, TECHNOLOGY AND INDUSTRY OUTLOOK 2006 – ISBN 92-64-02848-X – © OECD 2006178

6. EVALUATION OF PUBLICLY FUNDED RESEARCH: RECENT TRENDS AND PERSPECTIVES
units of production in the research sector and maybe research groups, departments, teams
or laboratories; ii) institutions and operators, such as the large research-performing
institutions and funding agencies or research councils; iii) programmes and procedures,
including public interventions focused on a single issue or theme and managed by a
dedicated entity, as well as measures that address a specific constituency in a generic way
without targeting specific problems, topics or sectors; and iv) systems consisting of the
whole or subsets (e.g. public policies) of research and/or innovation systems.
Box 6.1. The need for a broad perspective on evaluation
The search for best practices should not be restricted to the selection of appropriateevaluation methodologies stricto sensu, i.e. techniques to be used to collect and analyserelevant data. It requires a broader perspective that takes into account the importance ofthe institutional positioning of evaluation and evaluators, recognising both the difficultiesinvolved in assessing the direct and indirect impacts of research activities and the need tocombine several analytical tools to overcome them.
What to measure, when to measure, and how to interpret the results depend upon theactors’ underlying model of innovation and their vested interests. The responses ofinterviewees or survey respondents are based on some implicit assumptions about thenature of research processes and their perception of the consequences that particularoutcomes of the evaluation might have on their own future.
Four basic problems arise when assessing the impact of research activities: i) timing: theeffects of research often emerge long after the research has been completed; ii) attribution:a given innovation may draw upon many research projects and a given research projectmay affect many innovations; iii) appropriability: because the beneficiaries of research maynot be the people or organisations that perform the research, it may not be obvious whereto look for effects; and iv) inequality: in a given project portfolio the distribution of impactsis typically highly skewed, as a small number of “blockbuster” projects may account formost effects, while around half often only advance knowledge in a general way.
Table 6.1 shows some key methods for assessing impacts. The methods are not simplysubstitutes as there is ample evidence that fruitful evaluations of complex researchinstitutions or processes require combining several tools (Georghiou and Roessner, 2000).In addition, the choice of the mix of tools, the sequence in which these are deployed andthe way in which results derived by the different tools are merged in the overall analysisare far more important to the evaluation’s success than the degree of sophistication in theuse of any individual tool.
Another challenge, which is particularly important in evaluating programmes, arisesfrom the “project fallacy”, whereby policy makers expect that their contract with acompany will result in a uniquely attributable set of outputs and effects that may becompared with inputs. In practice, from the point of view of the sponsored organisation,the contracted work is often a contribution towards a larger and lengthier project that mayeventually produce an innovation. Hence the sponsored body may be tempted either toover-attribute effects to the public input or to identify artificially a set of deliverables andoutcomes to satisfy the sponsor. The implication for evaluators is that a project focus is notsufficient; a broader picture of the role of the public contribution in the organisation’sstrategy is needed.
OECD SCIENCE, TECHNOLOGY AND INDUSTRY OUTLOOK 2006 – ISBN 92-64-02848-X – © OECD 2006 179

6. EVALUATION OF PUBLICLY FUNDED RESEARCH: RECENT TRENDS AND PERSPECTIVES
Evaluation of research institutes and groupsResearch groups and institutes are defined as organised entities within existing
institutions. There are two types of research groups: i) those belonging to specialised
research institutions concerned with basic science, such as the French CNRS or the German
Max Planck Gesellschaft, or mission-oriented, such as many agriculture or health research
institutions; and ii) university research groups, the number of which has increased markedly
with the generalisation of the split between teaching and research entities.2
Evaluation of research groups in specialised research institutions has a long history.
The lessons learned from that experience apply directly to universities that receive block
grants and are responsible for allocating these funds to research projects and teams.
However, core grants to university research are sometimes channelled directly to
individual research groups, as under the United Kingdom’s Research Assessment Exercise
(RAE). Evaluation of research groups follows two main models:
● The one-off model is exemplified by the Max Planck Gesellschaft’s method of creating new
institutes. The future director is selected by a committee of peers and is entrusted with
establishing a group that continues until his or her retirement. Riken in Japan also
follows this model.
● The periodic model is exemplified by French research institutions such as INSERM, the
French organisation for health research. Bottom-up proposals from research groups are
selected and periodically reviewed. This model usually operates within a stable
institutional arrangement that is characterised by an overall scientific committee and
disciplinary sections. This type of evaluation fosters structural change in long-lasting
entities, which are only exceptionally closed. INSERM groups have a lifetime of 12 years
and open yearly calls help to encourage renewal.3
There has been a trend to switch from the “one-off” to the “periodic” model, which has
evolved in two directions:
● Embedding evaluation within overall strategic exercises. As at INSERM, the Spanish national
research agency CSIC (Consejo Superior de Investigaciones Científicas) develops elaborate
bottom-up strategic plans, following a common format. Thematic panels are established
to review the plans, hold hearings with their promoters and formulate recommendations.
The latter are forwarded to institutes to allow them to adjust their plan. Final decisions are
Table 6.1. Categories of methods
Those providing a framework for evaluation Before/after comparison“Control group” approachesCounterfactualLogical frameworks
Those concerned with data collection InterviewsSurveysEthnographyStatistics/documents
Those concerned with data analysis Case studiesEconometric modellingConsumer surplusConstruction of indicatorsCost-benefit analysis
Source: Georghiou and Krahmer (1992).
OECD SCIENCE, TECHNOLOGY AND INDUSTRY OUTLOOK 2006 – ISBN 92-64-02848-X – © OECD 2006180

6. EVALUATION OF PUBLICLY FUNDED RESEARCH: RECENT TRENDS AND PERSPECTIVES
taken by CSIC’s eight section commissions. What is new is the extensive use of
international advice. CSIC has asked European bodies, such as the European Science
Foundation and European Molecular Biology Organisation (EMBO), to staff its panels.
● Taking a transversal approach to the allocation of core grants. The Helmholtz Association (HGF)
of Germany4 has introduced a competitive process based on programme-oriented funding.
Interdisciplinary programmes are evaluated by review panels of eight to ten members
which meet for a few days to study the written proposals. The Senate Commission of the
HGF then makes a comparative assessment of programmes. Programmes are monitored
continuously by the Senate and periodic reviews similar to the selection process are
undertaken. The first round was completed in 2005. This programme-based approach
leads to the creation of a flexible and periodically renewed management layer that is in
charge not of disciplines or regions but of a bundle of activities.
These developments lead to tighter steering and closer articulation between the strategy
of individual research entities and the overall strategy of the institution to which they belong.
This is congruent with the trend, observed in a number of countries, towards gathering under
the same umbrella a set of previously autonomous institutes. For example, some years ago
most independent Norwegian institutes were brought together under the Norwegian Research
Council, and Japan’s industrial research institutes were merged into the Institute of Advanced
Industrial Science and Technology (AIST). In AIST, evaluation plays a key role in organising the
relations between institutes and government. Institutes are independent and managed as
“private organisations”. Their obligations vis-à-vis government are formulated in terms of
medium-term objectives and accountability is ensured through evaluation by a third party.
Another example is the Leibniz Association in Germany which has recently taken over
from the Wissenschaftsrat responsibility for evaluating its 80 constituent institutes, which
are co-funded by the federal and Länder (federal state) governments. The evaluation
process has two phases. In the first, a scientific assessment is carried out by a peer group
on the basis of answers to a questionnaire and site visits. The reports feed into the second
phase in which the overall evaluation committee undertakes a comparative assessment of
institutes. Evaluation has had a significant impact on research priorities and portfolios. For
instance, the 2001 evaluation led to the discontinuation of shared funding in five cases,
while nine new affiliations were formed.
These new approaches to evaluation of their permanent research units by large
institutions have four elements in common:
● They focus on changing core funding allocation mechanisms.
● Peer review mechanisms increasingly involve foreign experts.
● Though reviewers work on documentary evidence, site visits are crucial in determining
the outcomes of evaluation.
● The links between evaluation and decision making are strengthened.
Evaluation by national or sub-national governments of university research and
research institutes has been also undergoing major changes of two main types:
● One concerns improved allocation of core grants at the national level. The archetype is
the United Kingdom’s Research Assessment Exercise (RAE) (Box 6.2). The RAE has
inspired other models based on similar principles in Hong Kong (China) and New
Zealand. It is also influential in debates about institute or university evaluation. For
instance, a senior adviser to the Higher Education Funding Council for England was
OECD SCIENCE, TECHNOLOGY AND INDUSTRY OUTLOOK 2006 – ISBN 92-64-02848-X – © OECD 2006 181

6. EVALUATION OF PUBLICLY FUNDED RESEARCH: RECENT TRENDS AND PERSPECTIVES
selected as the chair of the Australian Expert Advisory Group for designing a national
research quality framework (RQF). Regions have also become interested in this approach
because they believe that it can help raise the quality and national and international
visibility of research universities.
Box 6.2. The United Kingdom’s Research Assessment Exercise
The RAE provides a quality rating for past exercises and a quality profile for theforthcoming exercise, which is used by the Higher Education Funding Councils todistribute the university block grant for research. The procedures have evolved throughfive cycles.
The RAE is basically a disciplinary peer review exercise. In 2001 it was carried out by69 subject panels of 6-10 members, nearly all of whom were UK academics. The 2008exercise introduces the clustering of panels under supervisory main panels, and thereplacement of ratings with profiles. Information collected as the basis for judgement hasfour central outputs (normally publications) produced in the period 2001-07 for eachindividual entered. Panels also receive quantitative data on staff, research assistants,research students and research income. Descriptions of the research environment aregiven and esteem indicators for individuals and groups are listed. A new element is theopportunity to add comments to help to explain the significance of indicators. This isparticularly important for applied research.
The scoring system is complex. Up to 2001 the Unit of Assessment received a singlerating based on the share of research outputs that were of international or national quality.The rating scale went from 0 to 5 plus 5*. However, this system motivated game playingand began to lose its effectiveness through grade inflation. The game playing resulted fromthe effect that a small number of individuals could have on the overall classification. Gradeinflation was reflected in the fact that 31% of the staff entered were in the 5 and 5*categories in 1996 and 55% in 2001. In response, the 2008 exercise will profile researchoutputs on a five-point scale. The top score of “four star” is intended to mean world leaderalthough it may apply to around 10% of submissions. Three star and two star are alsointernational quality, one star is national and below that work is unclassified. The finalprofile is then adjusted on the basis of two further scores. The one for the researchenvironment refers to the infrastructure and academic vitality of the unit as a whole anddraws on data on research students and income as well as descriptions of researchstructures, support and strategy. The third element is for esteem, defined in terms ofhonours, awards, keynote addresses and prestigious advisory roles. The final profile iscalculated as a weighted aggregate of the three (The typical weighting of second and thirdelement is 20% and 10%, respectively.
Historically the RAE may be seen to have had positive effects in terms of directing fundsselectively to the most highly rated, raising the profile of research and stimulating thedevelopment of supporting infrastructure, and consequently improving the quality ofresearch. On the other hand, negative effects have included: unintended and inappropriateuses made of results as a guide to undergraduate education; reducing the status ofteaching among academics; raising concerns about inhibiting industry and communitylinks; concerns about the treatment of applied and interdisciplinary research; concernsabout treatment of women and new entrants to the profession; the emergence of a transfermarket for academics as universities seek to buy in leading researchers to enhance theirprofiles; and hostility to the exercise from industry and other users who see it drawingresearch away from their interests and towards purely academic issues.
OECD SCIENCE, TECHNOLOGY AND INDUSTRY OUTLOOK 2006 – ISBN 92-64-02848-X – © OECD 2006182

6. EVALUATION OF PUBLICLY FUNDED RESEARCH: RECENT TRENDS AND PERSPECTIVES
● The second concerns the search for critical mass and excellence, with public funding
increasingly concentrated in a limited number of institutes or centres. The precursor
was the National Science Foundation (NSF) Engineering Research Centers, launched in
the 1980s, which were followed by the competitions promoted in the late 1980s and
early 1990s by the United Kingdom’s research councils. Similar initiatives were taken in
other countries in the mid-1990s, including Canada’s Networks of Centres of Excellence,
Australia’s Co-operative Research Centres, and Sweden’s competence centres. Newer
initiatives for centres of excellence include the Dutch Top Technology Institutes and the
Austrian K-centres. Such centres have a complex remit which includes articulating
excellent research with economic and social objectives, research support over a lengthy
time period and the critical role of evaluation in ensuring continuity in incentives and
performance. Evaluations of competence centres show that this approach has succeeded
in coping with the “project fallacy” problem by focusing not on projects but on the
various dimensions of research partnerships: evolving actor configurations, networks,
clusters and communities; changes in qualifications and mobility of personnel;
development of sustainable and attractive institutions; and the evolving performance of
partners in their respective universes. Most evaluations have taken a long-term
perspective. They have combined network and institutional analyses and longitudinal
studies to assess the centres’ role in developing human capabilities, influencing the
location of private R&D and stimulating the modernisation of universities.
Evaluation of research institutions and operatorsResearch institutions can be differentiated according to their research focus, whether
general basic research (Germany’s Max Planck Gesellschaft, Japan’s Riken, Spain’s CSIC or
Italy’s national research council, CNR) or specific research fields, such as agriculture, health,
transport, construction or manufacturing. Among the latter some deal with “strategic” or
“applied” research linked to the manufacturing sector – the Dutch TNO (Netherlands
Organisation for Applied Scientific Research), the Finnish VTT (Technical Research Centre of
Finland) or the German Fraunhofer Gesellschaft), while others, like the French technical
centres, focus on a particular sector, (e.g. CETIM for the mechanical industries).
Funding agencies and research councils generally do not have an operational role (the
British Research Councils, the US NSF, the German DFG, the Dutch NOW, the Norwegian
Research Council, or the Finnish Academy of Sciences). However, there are exceptions
since some institutions both fund and perform research (e.g. the US National Institutes of
Health, NIH).
For a long time evaluations mainly concerned autonomous research institutions. They
were generally one-off events, following the distinguished scientist model, according to
which one or several scientists are given, by political decision, responsibility for evaluating
a given institution on the basis of information gathered by the institution complemented
by interviews. The ensuing reports contain a large proportion of authoritative judgements.
Their impact depends not only on the robustness of the diagnostic, but also on the moral
authority of the scientists involved. This model is still used but the nature of the
recommendations is changing, as in the recent evaluation of the Finnish Academy.5
Systematic and periodic evaluations of all research and higher education institutions
in a given national system remain an exception. The French experience with what is called
the “guarantor model” was quite successful in identifying issues but not in translating
OECD SCIENCE, TECHNOLOGY AND INDUSTRY OUTLOOK 2006 – ISBN 92-64-02848-X – © OECD 2006 183

6. EVALUATION OF PUBLICLY FUNDED RESEARCH: RECENT TRENDS AND PERSPECTIVES
them into practical recommendations. It demonstrated once again the importance of the
institutional positioning of the evaluation process. Broadly speaking, depending on its
positioning, evaluation can either produce private expertise for the “prince” or promote
“open strategy making” by all key stakeholders. In the former case the evaluation
recommends a single set of solutions, in the latter its feeds public debate about possible
scenarios and responses.
Evaluations of research councils were exceptional for a long time, and they have yet to
be undertaken in most large OECD countries where the main effort has been to reinforce
yearly reporting requirements, such as the Government Performance and Results Act
(GPRA) in the United States (see below). However, there have been recent bold initiatives,
with large in-depth assessments of funding agencies in smaller countries, such as
Norway’s evaluation of the Research Council of Norway and Austria’s evaluation of its
research and innovation agencies – FWF and FFF. These evaluations exhibit novel features:
● They are “one-off” but do not serve a specific stakeholder. They feed an ongoing political
debate concerning the overall architecture of the research system. In one case the issue
was the wisdom of channelling almost a quarter of all public funds for research through
one institution. In the other, it was whether the existing institutional arrangements
effectively increase connectivity in the national system.
● They promote the “professionalisation” of both the management of research councils
and of policy making at government level. Regarding the latter, the evaluations
challenged the coherence of policies, in particular the compatibility of objectives and
financial means and their consistency over time.
● Their implementation procedures are innovative. They mobilise international expertise,
including professional evaluators and academics. They mix methods, including reviews
by expert panels. They are well connected with ongoing debates on similar issues in
other areas.
University “research rating” is attracting growing interest and reflects the increasing
recognition of universities’ central place in the public research landscape. There is
surprisingly little experience with systematic, comprehensive reviews of universities, in
particular of their governance and strategic choices. Several countries have of course
established national evaluation procedures to assess university research entities, such as
the United Kingdom’s RAE (see Box 6.2 above), and a number of others have developed
labelling and accreditation processes for teaching curricula. However, these do not address
universities as such. An exception is the institutional evaluation programme, launched by
the European University Association which, since 1994, has evaluated more than
150 volunteer universities.6
There is growing interest in developing monitoring systems, based on quantitative
indicators. For example, the Dutch Ministry of Education, Culture and Science performs an
annual comparative analysis of the research performance of Dutch universities, and the
German DFG produces a ranking as part of a report on the distribution of funds by the DFG
to universities. An Australian initiative shows how important these systems might become
in the future. In connection with the seven-year policy plan for science and innovation, a
research quality framework (RQF) is being established to assess the quality and impact of
Australian research. In March 2005, an expert group was commissioned to draft an issues
paper as part of a formal consultation process to define and implement the RFQ. Although
the report covers all types of institutions and programmes, there is a clear focus on
OECD SCIENCE, TECHNOLOGY AND INDUSTRY OUTLOOK 2006 – ISBN 92-64-02848-X – © OECD 2006184
6. EVALUATION OF PUBLICLY FUNDED RESEARCH: RECENT TRENDS AND PERSPECTIVES
universities. The report identifies four principles for making an RFQ productive:
i) transparency to government stakeholders and taxpayers; ii) acceptability to the
organisations and agencies to which it is applied as well as meeting the needs of
government; iii) effectiveness; and iv) encouragement of positive behaviour. One objective
is to develop a new annual reporting format for universities, another is to aggregate a
variety of indicators into one synthetic metric, and a third is to develop an RAE-like
assessment exercise.
Universities are still too often considered as an abstract aggregate when analysing
research systems, rather than as proactive institutions with autonomous strategic
capabilities. Moreover, the idea that there is a single model of what a university should be
and do is still too prevalent. A simplistic model, which may be applicable to only a few top
US or British universities, does not provide a sound basis for coping with the variety of
universities’ missions, functions and activities. There is thus an urgent need to develop a
typology that can help characterise the relative positioning of universities as research and
teaching institutions. This is a prerequisite for developing effective and policy-relevant
evaluations of universities.
Evaluation of research programmes and proceduresThere is a tendency to label as programmes most government actions to promote the
technological competitiveness of firms. In looking at recent developments in the
evaluation of these interventions, this section distinguishes between programmes and
procedures.
Collaborative programmes
These public interventions usually focus on a single issue, theme or topic and are
managed by a dedicated entity, which may be a part of the overall central administration
of research, and either an agency in charge of programmes across a broad range (Sweden’s
NUTEK) or a single mission agency (the French ADEME for non-nuclear energy). Some large
programmes are a legacy of the post-World War II period and their evaluation has given
rise to numerous quantitative methods, especially through work done by National
Aeronautics and Space Administration (NASA) and the European Space Agency (ESA) to
estimate the impact of space programmes. Cost-benefit models and related frameworks, as
well as models for measuring indirect effects were developed during these first attempts to
assess public investment in large programmes. The 1980s saw the emergence of another
set of programmes corresponding to a renewed vision of technology dynamics and
innovation processes. The UK Alvey programme on information technology, and European
programmes such as ESPRIT (for IT), BRITE (for new materials and new industrial
technologies) or RACE (for communications) are commonly cited examples of this new
approach to supporting collaborative research, as well as landmarks in the evolution of
evaluation practices. Such programmes have three characteristics: i) limited duration in
time; ii) the aim of helping an existing network of actors to gain a competitive edge in the
international marketplace; and iii) a focus on the knowledge bases, technologies, standards
and skills that the actors collectively find to be critical for the future.
Their widespread adoption has given rise to a parallel increase in the political demand
for evaluation of their performance. Most evaluation methodologies in use today, such as
surveys of recipients and logic chart approaches, were developed in response to such
demand,7 whereas new models of public management, such as the UK Department of
OECD SCIENCE, TECHNOLOGY AND INDUSTRY OUTLOOK 2006 – ISBN 92-64-02848-X – © OECD 2006 185

6. EVALUATION OF PUBLICLY FUNDED RESEARCH: RECENT TRENDS AND PERSPECTIVES
Trade and Industry’s ROAME,8 arose as a by-product of programme evaluation. At the
European level, toolkits for evaluating socioeconomic impacts9 were subsequently created,
and research networks, such as the MAP network (Multi Actors and Multi Measures
Programmes), were formed to identify and diffuse best practice.10 Practitioners have also
joined the European RTD (research, technology and demonstration) evaluation network,
which is now complemented by an international network that emerged from the
Washington Research Evaluation Network (WREN).
The biggest challenge today is to capitalise on the progress made in the evaluation of
individual programmes to develop efficient approaches to the evaluation of portfolios of
programmes. An exemplary experiment is the evaluation of the EU Framework Programme
(FP), which consists of a number of sub-programmes and different types of actions. It
highlights a number of largely unresolved issues: How to cope with the complexity of a
process which involves several levels of evaluation and a massive amount of background
information? How to translate the outcomes of such complex processes into practical
policy proposals? How to ensure that these policy proposals are seriously considered in
actual policy design?
Programmes based on “procedures”
These programmes play an important role in research and innovation policies of all
OECD countries and address a specific constituency in a generic way. They do not target
specific problems, topics or sectors but support all actors that fulfil certain criteria. They
are of two types depending on the nature of decision making for allocating support:
i)“automatic” programmes which require only an ex post checking by the public authorities;
and ii) programmes operated by a dedicated administrative entity which plays a more
active role in allocating support. The first type is exemplified by research tax credits and
allowances. Many assessments of the effects of tax credits have been carried out (for a
review see OECD, 2002; Warda, 2001; Hall et al., 2000; and Lhuillery, 2005).
The other type is exemplified by the French ANVAR’s “Aide à l’innovation” (Box 6.3), a
programme that was initiated in the 1960s. It underwent a thorough evaluation in 2001.
This evaluation brought to the fore three important issues:
● How to assess the efficiency of programme management when only a few objective
benchmarks exist? One may have to accept that some aspects of evaluation depend
heavily on the accumulated experience of evaluators.
● How to generate, without duplication of effort, the information needed for international
benchmarking? The multi-country organisation of the evaluator firm helped in this
respect.
● How to assess the “macro” impacts of a programme based on information gathered at
the “micro” level? This question leads to others: Should the impact analysis be limited to
direct exploitation of the results of questionnaires or should these results mainly be
inputs into more aggregate quantitative models? How to derive policy implications from
the analysis? In particular, are a few very successful firms enough to justify the
programme? Is it more important to have a high rate of success even if the impact at the
individual firm level is limited?
Like “Aide à l’innovation”, programmes based on “procedures” generally have a very
long life. The intergovernmental EUREKA initiative, launched in 1985, demonstrates that
a lengthy duration can require rethinking the articulation between monitoring and
OECD SCIENCE, TECHNOLOGY AND INDUSTRY OUTLOOK 2006 – ISBN 92-64-02848-X – © OECD 2006186
6. EVALUATION OF PUBLICLY FUNDED RESEARCH: RECENT TRENDS AND PERSPECTIVES
evaluation. Box 6.4 describes the Continuous and Systematic Evaluation (CSE) that has
been in operation for a decade. Given the skewed distribution of returns to most
programmes, this is a two-step approach in which “high impact” projects receive a more
in-depth analysis. This continuous monitoring makes it possible to build solid knowledge
about the socioeconomic effects of the supported projects. However, it does not address
broader questions that are raised in periodic evaluations, such as those highlighted by the
ANVAR evaluation, or those tackled by the EU FP evaluation.
The US Advanced Technology Program can be seen in many ways as a hybrid between
a programme and a procedure (see Box 6.5). Though relatively small, certainly by US
standards, it is significant for its role in the development of evaluation and indeed has
accounted for much of the methodological development in the United States over the past
decade. In their review of the evaluation of technology programmes, Georghiou and
Roessner (2000) note that much of this effort has been directed towards the need to
demonstrate to political critics that the programme satisfies the theoretical criteria for
intervention by operating in the margin where private returns alone do not justify the R&D
investment without the additional consideration of social returns. Why such sophisticated
evaluation has failed to connect to its primary target audience is an interesting question
for those who believe in rationalistic models of policy making.
The limitations of approaches focused on the direct effects of funded projects are
obvious. The method developed by the Bureau d’Économie Théorique et Appliquée (BETA) of
Louis Pasteur University to assess indirect effects or the more recent “iceberg model”
implemented in the framework of the last evaluation of EUREKA are attempts to overcome
these limitations. The concept of behavioural additionality emphasises that programmes
Box 6.3. The evaluation of ANVAR, the French Innovation Agency
ANVAR is an independent, government-owned agency in charge of supportinginnovation in SMEs (up to 2 000 employees) through various mechanisms, the first and byfar the largest a soft loan scheme. This scheme is operated by regional offices that have forpractical purposes full autonomy in targeting companies, reviewing projects in three areasof expertise (technical, commercial and financial support) and decision making.Between 1993 and 1999 it mobilised more than EUR 1 billion for 7 000 innovation projectsin around 5 600 companies, 60% of them less than ten years old.
The evaluation was commissioned by the responsible ministries and addressed thethree standard issues of efficiency, effectiveness and relevance. It was considered bycommissioning ministries as a starting point for rethinking the national portfolio ofprogrammes for supporting innovation. After a call, the evaluation was entrusted toTechnopolis France.
It combined multiple approaches: an analysis of management procedures, a large postalsurvey, a set of in-depth case analyses, including site visits, and internationalbenchmarking. Overall, the report found that the programme had a positive impact on thedevelopment of new products, the expansion of customer bases and job creation. Ithighlighted the role of the non-financial aspects of support and the large differencesamong companies depending on their age, size and growth pattern, and location. Itrecommended maintaining the procedure as a key feature of the French portfolio ofprogrammes supporting innovation.
Source: de Laat et al., 2001.
OECD SCIENCE, TECHNOLOGY AND INDUSTRY OUTLOOK 2006 – ISBN 92-64-02848-X – © OECD 2006 187

6. EVALUATION OF PUBLICLY FUNDED RESEARCH: RECENT TRENDS AND PERSPECTIVES
ann-
ivent
ric ino ahe
inortareFory.
ionfuling an ofngheld
onhersyed
ishis isrty asehe ofheer
velic
llynd
Box 6.4. Evaluation of EUREKA
Launched as an intergovernmental initiative in 1985, EUREKA aims to enhance Europecompetitiveness through its support to businesses, research centres and universities that carry out paEuropean projects to develop innovative products, processes and services. EUREKA supports “innovatprojects”, nowadays predominantly by SMEs, and clusters. These are long-term, strategically significaindustrial initiatives, usually with a large number of participants, which aim to develop genetechnologies of key importance for European competitiveness, primarily in ICT and, more recently,energy and biotechnology. EUREKA has been evaluated several times since 1991 and was also subject tstrategic review in 1999. However, its basic evaluation system for innovative projects, known as tContinuous and Systematic Evaluation (CSE), began in 1996.
The CSE replaced long and technical final project reports with a questionnaire focused on maachievements and socioeconomic impacts. For projects showing such impacts, follow-up shquestionnaires on market impact are sent after one, three and in principle five years. The results interpreted by a panel, which also performs some interviews, and published in an annual impact report. many years this system operated effectively but recent response rates have fallen, reducing its reliabilit
In the current year a new approach was adopted. While efforts are being made to improve the operatof the data collection system, an expert panel has focused on detailed case studies of the most successprojects in terms of their socioeconomic impact. These are identified using survey returns and by querymembers of the EUREKA network in each country. The principle behind this “high impact” approach isearlier observation about EUREKA’s effects (Georghiou, 1999) that 8% of participations accounted for 70%economic effects, a pattern typical of R&D portfolios. Using this information, a purposive sampliapproach can be used to identify projects in the top decile on which resources are concentrated for tdetailed case studies that would be too expensive to carry out for the whole population. The results shounonetheless give an indication of the total effect of the initiative.
Box 6.5. US Advanced Technology Program
Since 1990 the US Advanced Technology Program has been the subject of political controversy ideological grounds, with some challenging the need for public intervention and others arguing that tgap between the laboratory and the market is a major area for market failure. As a result of this controveATP has been one of the most evaluated programmes for its size. Much of the evidence has been producby ATP’s own Economic Assessment Office.
After the selection and monitoring processes, effects are assessed in a variety of ways. A core activitythe business reporting system, which tracks progress towards future applications of the technologies. Tmakes it possible to perform an empirical analysis of the portfolio of projects. The reporting systemstandardised to facilitate statistical analysis, and it is electronically administered. In addition, third-pasurveys are commissioned to collect information and views from the participating companies. To gaindetailed understanding of the effects of the ATP at the firm level, the ATP also carries out project castudies. Those conducted at an early stage of a project may focus narrowly on changes experienced by tparticipating company or companies as a result of the ATP project. Other case studies explore the rateadoption of the technology and attempt to measure spillover benefits and costs that accrue to users of ttechnology beyond the participating companies. Studies to increase the understanding of spillovmechanisms are also being carried out. A potential approach to projecting impacts from the firm leacross the entire economy is to apply large-scale macroeconomic models paired with microeconomproject analysis. The ATP is exploring additional approaches to measuring impact, and periodicaconvenes working sessions with the nation’s leading economists to discuss evaluation models, results, aopportunities (Ruegg and Feller, 2003).
OECD SCIENCE, TECHNOLOGY AND INDUSTRY OUTLOOK 2006 – ISBN 92-64-02848-X – © OECD 2006188

6. EVALUATION OF PUBLICLY FUNDED RESEARCH: RECENT TRENDS AND PERSPECTIVES
have wider and more sustained effects than those that are most obvious to measure and
that persistence of effects is of high value. Behavioural additionality concerns itself less
with inputs and outputs and more with sustained changes in the behaviour of recipients,
induced by contact with any stage of a programme (see Box 6.6).
Box 6.6. The recent OECD study on behavioural additionality
The concept of “additionality” has drawn the attention of OECD countries as a way toaddress the issue of whether public support results in new activity or substitutes forprivate support that would have occurred in the absence of the government’s intervention.
This concept has been applied to the evaluation of innovation-promoting programmes interms of i) input additionality (whether the funding the government provides to a firmsupplements the firm’s own expenditures or substitutes for them); and ii) outputadditionality (the proportion of outputs that would not have been made without publicsupport). While traditional evaluation activities focus on input/output additionality byestimating additional R&D expenditure and comparing the performance of firms thatreceive and do not receive public support, “behavioural additionality” is a new concept formeasuring changes in how firms conduct R&D as a result of government policy. It is definedas the difference in firm behaviour resulting from a government intervention. The typicalbehavioural additionality questions are: Do recipient firms pursue different types of R&D?Do they collaborate more with other institutions? Do they improve their R&D managementcapabilities or introduce enduring changes in their R&D strategy and performance? Sincemeasuring changes in how firms conduct R&D as a result of government policy is relativelyunderdeveloped, the OECD recently conducted a study on measuring behaviouraladditionality with 12 OECD countries/regions that presented and shared their efforts.
A range of methodologies is used to measure behavioural additionality in the countriesstudied, each of which has strengths and weaknesses. Firm surveys allow for collectinginformation from a large set of firms but must often be complemented by more in-depthinterviews to identify the range of behavioural changes that can be induced by a particulargovernment programme. Methodologies also need to be adapted to different types oftarget firms; the study in Belgium found that government R&D support played differentroles in the innovation processes of different types of firms, i.e. large versus small and R&D-intensive versus more traditional. Since each methodology has advantages anddisadvantages, a robust approach should combine methodologies.
A variety of behavioural additionality effects can be induced by government funding.Several country studies (e.g. Finland and Japan) showed that government funding not onlyallowed firms to accelerate completion of R&D projects (enabling them to introduce newproducts or services into the market sooner), but also encouraged them to launch projectsentailing greater technological challenges that they might otherwise have attempted.Government funding can encourage firms to engage in more collaboration in R&D projectsas indicated, for instance, in the German study: existing partnerships were intensified andnew ones initiated as a result of government funding. In this way, the behaviouraladditionality concept offers policy makers a useful concept for explaining the effects ofpolicy interventions on firms and differentiating among types of effects (e.g. changes inlevel of effort versus changes in company behaviour). Such distinctions can help indesigning effective policy instruments and selecting among various approaches tofinancing business R&D.
Source: OECD, (2006a), Government R&D Funding and Company Behaviour – Measuring BehaviouralAdditionality, OECD, Paris.
OECD SCIENCE, TECHNOLOGY AND INDUSTRY OUTLOOK 2006 – ISBN 92-64-02848-X – © OECD 2006 189
6. EVALUATION OF PUBLICLY FUNDED RESEARCH: RECENT TRENDS AND PERSPECTIVES
Evaluation of research systemsOne recent trend has been the application of the more detailed tools of evaluation at
the level of the whole research and/or innovation system to answer a particular policy
question. Another is the emergence of a new type of country review of national innovation
systems or policies that takes due account of the role of innovation in economic
performance and thus of the increased role of innovation policy in overall economic policy.
This trend can be illustrated by four examples. The first is a review of the Finnish
innovation support system (Georghiou et al., 2003).11 It followed an earlier study of the
impact of a 25% increase in research expenditure on the Finnish economy which had in
effect assessed the system as a whole in the late 1990s, using hearings with key stakeholders
and players, as well as econometric and other studies. The more recent study, commissioned
by the Finnish Ministry of Trade and Industry (MTI) in June 2002, had a narrower focus, less
on the performance of the system than on its ability to meet firms’ needs for innovation
support. Although the Finnish innovation system is generally recognised as one of the
world’s best, it was still possible to find room for improvement and policy makers willing to
make those improvements. The evidence base was unusually good, with results from large-
scale industrial surveys well attuned to the needs of the evaluation panel. Boundary
conditions are always a problem in this type of exercise. It was not surprising that this
evaluation had to go beyond the institutions sponsored by the ministry to deal with issues of
education policy, fiscal policy and public procurement. The report was unusual in that
around one-third of the report dealt with policy rationales. However it was important to be
able to move from issues of policy rationale to demonstrations of how policy works in
practice. Simply asking operators about the market and system failures they address
produces routine responses.
The second example is the evaluation (comprehensive review) of Japan’s First and
Second Basic Plans which also looks at the system, but in the context of a specific policy
framework.12 It contrasts with a large programme evaluation such as that of the Fifth
Framework Programme because the range of actions is addressed at the level of the
infrastructure and the system. The focus is on the presentation of information and
analysis, and a key author noted that although a comprehensive review is an almost
impossible task, it does help to understand the issues relevant to a national S&T system
owing to the emphasis on data, facts and perception (Kondo, 2005).
Some of the methodological issues encountered are common to systemic evaluations.
Problems arise in terms of timing and attribution. Because it will take some years to
concretise many of the aims of the Basic Plans, it is difficult to connect actions to their
ultimate impact. The evaluation has in common with the Finnish evaluations the
important role played by supporting studies. In some sense, the Japanese evaluation began
and ended with a well-designed linking of supporting studies while in Finland these
studies were designed by the panel which commissioned the work it felt was needed.
The third example is the United Kingdom’s indicators for the government’s ten-year
investment framework for science and technology.13 The indicators are intended to
measure the six key attributes which are considered to define the success of the research
system in terms of the S&T framework’s objectives. Relevance is a keyword, as science is
now a focus of economic policy. It is therefore treated similarly to other areas of public
spending in terms of targets and institutional reviews. Science has engaged in a bargain
OECD SCIENCE, TECHNOLOGY AND INDUSTRY OUTLOOK 2006 – ISBN 92-64-02848-X – © OECD 2006190

6. EVALUATION OF PUBLICLY FUNDED RESEARCH: RECENT TRENDS AND PERSPECTIVES
with the state: increased resources in return for a substantial impact on key economic
indicators of productivity. An evaluation will determine whether the state considers that
the bargain has been respected.
In both the UK and the Japanese cases, those responsible for communicating the
results to policy makers felt that indicators alone were not enough to demonstrate the
results achieved. Both resorted to the colour and detail that case studies can provide to
complete the picture and communicate to those outside the science system.
A common feature of all three examples is the desire to adopt an international frame
of reference. As the international standing of a country’s research becomes a key issue,
benchmarking becomes an integral part of evaluation. This of course raises questions
about how to identify appropriate comparators and indicators, for example whether to use
absolute shares or population- or budget-adjusted productivity ratios.
A clear example of the application of a government-wide performance framework is
the US Government Performance and Results Act (GPRA) and Programme Assessment
Rating Tool (PART). The 1993 GPRA required for the first time each part of government to set
goals and measure progress towards them as part of the budget process. The requirement
applied as much to research agencies as to any other part of government. The process has
three main parts, the first of which involves preparation of a strategic plan covering a
period of at least five years. This in turn provides the basis for a performance plan built
around performance goals and submitted to Congress as part of the annual budget
submission. At the end of each fiscal year, agencies are required to submit a performance
report based on the extent to which the goals have been reached. PART is based upon a
series of questions designed to provide a consistent approach to rating programmes across
the federal government. It is a diagnostic tool that relies on objective data to inform
evidence-based judgements and assess and evaluate programmes across a wide range of
issues related to performance.
It is difficult to express scientific outcomes in quantitative terms. One key missing
factor is the element of international comparison. The United States operates in what is
essentially a self-referential framework. An issue which comes across strongly for both the
GPRA and PART is that what science has in common with other public sector activity,
notably the management and budgetary elements, can fairly easily be reconciled with such
approaches. It is much harder to get at the core activities of scientific achievement and any
resulting economic or social outcomes. The frameworks do not replace evaluation but they
rely upon it to operate effectively.
These developments highlight two major phenomena. At the country or system level,
evaluation is a judgemental exercise delegated to a small group of recognised and credible
individuals, yet the performance and utility of an evaluation relies heavily on the relevance
of existing information on the overall situation and the effects of government policy. Over
time, the implementation of these aspects of evaluation has evolved and a third element
has been added which involves changing policy making processes. The concluding
paragraphs of this section reflect on this changing landscape and the new requirements it
creates for evaluation practice and direction.
By and large the expert group model has remained the universal standard for
conducting such aggregate reviews. The examples presented above show the importance
of the credibility of the chosen experts and their articulation with the target audience. The
OECD SCIENCE, TECHNOLOGY AND INDUSTRY OUTLOOK 2006 – ISBN 92-64-02848-X – © OECD 2006 191

6. EVALUATION OF PUBLICLY FUNDED RESEARCH: RECENT TRENDS AND PERSPECTIVES
traditional reliance on well-known scientists seems to have lost ground as compared to
specialists in the field or experts with similar experience in what are viewed as successful
countries.
This shift is complemented by the rising importance of comparing the performance of
the country or system to that of other countries or a system considered more successful.
Benchmarking is a growing concern, although there has been little discussion of the basics
of benchmarking. Can similar assumptions be made for countries as for firms (for instance
in terms of competition and survival)? Should one assume that countries follow similar
objectives, so that instruments valid in one can be transferred to another? Is path
dependency less important than analysts of innovation suppose? The fact that questions
abound does not mean that the approach should be discarded; rather it highlights the need
for further research on the mobilisation of foreign comparisons and practices in policy
shaping and making.
This shift also highlights the changing nature of the information required. The
examples show the extent and variety of sources mobilised and of studies undertaken. As
with institutions and programmes, there is a two-step process in which the different
components of the system under review are also subject to evaluation or other types of
periodic review. There is also a changing focus in terms of the quantitative data and
indicator sets. The new emphasis on socioeconomic effects poses important challenges to
standard S&T statistics and indicators, as the recent frameworks developed in the United
States and the United Kingdom show. The role of actors, with their capabilities and
strategies, has also been rediscovered as a unit of analysis. Overall performance involves
not only the relations between the university system and industry, taken as a whole, but
also individual actors’ capabilities and strategies and the specific networks they develop.
These play a critical role in terms both of success and of the aggregation of capabilities.
Specialists speak of “positioning indicators” to characterise this new approach to
indicators, which keeps actors’ strategies visible.
While this entails important changes to the evaluation process as such, there is
another critical, change in the policy process itself. As the knowledge-based society
evolves, stakeholders and interested parties have multiplied, and forecasting exercises to
support priority setting have turned into major foresight programmes whose outputs
count less than the outcomes of the process itself: the direct and indirect alignment of
actors’ visions and network or community building. These are now important conditions
for setting policy priorities and the subject of ongoing political discussions in a number of
countries. For instance, a French law of 2006 is the result of over two years of intensive
debate in many forms, including what might be termed an “institutional foresight
programme” (the FUTURIS programme). However, as Box 6.7 on the evaluation of foresight
programmes indicates, an articulated effort for reviewing these policy-supporting
processes is clearly lacking.
ConclusionsThis concluding section first summarises the main findings about each level of
evaluation and then discusses five emerging cross-cutting issues, before suggesting
priority topics for future work on evaluation.
Institutes are the main research performers. They constitute the “basic units of
production”, the “enterprises” of the research sector. In the vast majority of cases they are
OECD SCIENCE, TECHNOLOGY AND INDUSTRY OUTLOOK 2006 – ISBN 92-64-02848-X – © OECD 2006192

6. EVALUATION OF PUBLICLY FUNDED RESEARCH: RECENT TRENDS AND PERSPECTIVES
not legal entities but convenient frameworks for organising research work. They are thus
very flexible and reactive to external incentives. Evaluation is crucial because it is generally
directly associated with allocation of resources. It should be understood in a broad sense,
including selection of directions for policy intervention and periodic monitoring. It was
commonly thought in the 1980s and 1990s that the accumulated body of knowledge was
enough and that the focus should be on implementation and good practice. The discussion
shows that important changes are being experimented with and new approaches
designed, either in dedicated research institutions or in university funding systems. It also
shows a high degree of convergence with “large” project evaluation and a clear trend
Box 6.7. Evaluation of foresight programmes
The tested instruments for support of R&D have in recent years been supplemented bymore systemic tools in support of research and innovation policy. This is illustrated by theemergence of national foresight programmes. Motivated by a variety of goals, includingpriority setting, building action networks and applying scientific advice and/or thinking todeep-rooted policy problems, the foresight phenomenon has begun to undergo evaluation.
Evaluation of foresight has mainly been confined to fairly small-scale panel or survey-based efforts. The long timescales involved mean that the accuracy of future visions israrely an issue. This has only been explored in the unusual circumstances of the Japanese30-year technology forecasts and in particular the Delphi survey which has been carriedout in more or less the same format at regular intervals since 1971. The results (overall 28%of the topics bore fruit and a further 36% partly did so) showed mixed success; predictionswere more accurate in areas such as information technology and less so in energy, naturalresources and “soft science”. Accuracy may not necessarily imply relevance or utility.
Relatively light panel-based reviews have been carried out twice for the German Futurprogramme with a mainly process orientation (Cuhls and Georghiou, 2004) and for theHungarian Technology Foresight Programme (TEP).* An individual expert review of thesecond Swedish programme was carried out (Arnold et al., 2005). In terms of method thesedid not go beyond soliciting the views of participants and key stakeholders throughhearings, interviews and surveys. Also interview-based is a recent, more extensiveevaluation of the United Kingdom’s Third Cycle of Foresight which has yet to be published.The latter explicitly used a logic chart approach as one of the key issues explored was thepositioning of the exercise in relation to the goals of the ministry in which it is located andthe relation between public policy and industry-oriented issues.
A substantial proportion of the discourse in foresight evaluations is concerned with therelation of activities to the environment in which they are implemented. For a soft policyinstrument there is an issue of delineation. While it is usually clear when a foresightactivity begins it is often far from clear when it ends. In particular, responsibility formaintaining the action networks created is an issue. A further problem emerges from theanticipatory nature of some work. Results may be available before the issue is ripe foraction or debate and an early evaluation may underestimate their significance. The TEPevaluation indicated a “reservoir model” of knowledge transfer in which reports wereinitially largely ignored but after some years substantially influenced policy formation asthe need emerged to take positions on the issues addressed. The other implementationissue brought out by evaluations is the prerequisite of high-level commitment and theembedment of foresight to achieve impact.
* See www.nkth.gov.hu/main.php?folderID=159&articleID=3826&ctag=articlelist&iid=1.
OECD SCIENCE, TECHNOLOGY AND INDUSTRY OUTLOOK 2006 – ISBN 92-64-02848-X – © OECD 2006 193

6. EVALUATION OF PUBLICLY FUNDED RESEARCH: RECENT TRENDS AND PERSPECTIVES
towards the use of “internationalised peer review”. There is thus room for exchange of
experience between the organisers of such evaluations and a need for further reflection on
the changing management paradigms that are embedded in these evolving settings.
Besides direct performers of research, research operators are discussed by looking at
two complementary and partly overlapping sets of operators: institutions and
programmes. When considering evaluation issues, each set needs to be separated into two
sub-groups: research-performing institutions and funding agencies, on one side, thematic
and procedural programmes, on the other. From the 1980s, thematic programmes largely
focused on pre-competitive collaborative programmes, and the outputs were not
immediately appreciated by policy makers. There has recently been more focused
attention on procedural programmes (like the US ATP, the European EUREKA initiative or
the French “Aide à l’innovation”). They have developed strong methodologies to assess
effects and benefits at the project level, but they have had more difficulty with the broader
question of the rationale for public intervention and the implementation structures
adopted. There is a second development related to the appropriateness of existing
institutional arrangements and the trend towards two-step evaluations, moving from
individual programmes to the portfolio of programmes in a wider setting. This is
exemplified in the evaluation of the EU Framework Programmes. In turn, this is linked to
an interest that was seldom addressed before, the evaluation of funding agencies or
research councils. The examples of Norway and Austria reveal a new positioning of
evaluation: these are one-off events which take place when an issue is becoming “hot”,
that is, when there is a growing debate on institutional renewal. Evaluation is then
conceived as feeding the debate, both as a source of robust evidence and as an overall
judgement paving the way for formulating options. Countries are beginning to address
these changes and learn about recent developments, the conditions under which they can
be productive, and options for their deployment, especially since they have very different
operational settings. These are questions that should be addressed at the international
level. A last important lesson deals with the very limited experience with the evaluation of
universities “as a whole”. Most experience has been with RAE-like approaches (considering
not the university as such but its research entities individually) or developing monitoring
systems to inform and support macroeconomic policies. This is clearly a major issue for
policy evaluation.
Finally, some recent developments at the system level were described. Experience
from Finland and Japan demonstrates that both the conditions under which high-level
reviews or assessments are performed and the type of information required have vastly
changed. In particular, countries are faced with growing reporting requirements (see the
US and UK examples) which entail many new developments in indicators, which are no
longer based on large statistical aggregations but on markers of the strategies of individual
actors and their linkages. International rankings of universities or firms are important
markers and highlight the need for positioning indicators.
Another change is highlighted by system-level evaluations and the importance given
to processes that support policy making, leading some analysts to speak of evaluation
systems. Anticipation and actors’ alignment through shared visions is another: foresight
programmes have multiplied in the last decade, but there have been only limited efforts to
reflect on their dynamics and role. Some scholars consider in fact that the world is
progressively moving towards a more technically oriented democracy in which public
debate is becoming central to the shaping and formulation of policy. Evaluation research
OECD SCIENCE, TECHNOLOGY AND INDUSTRY OUTLOOK 2006 – ISBN 92-64-02848-X – © OECD 2006194

6. EVALUATION OF PUBLICLY FUNDED RESEARCH: RECENT TRENDS AND PERSPECTIVES
needs to anticipate this trend or at least be in a position to offer policy makers the
wherewithal for reflection, as when new thematic collaborative programmes were
developed in the 1980s.
The analysis of changes in evaluation practices at different levels of research systems
points to five transversal issues.
Indicators, benchmarking and evaluation
There is a need to clarify the relationship between indicators, benchmarking and
evaluation. The first represents an input to the other two, the second is an exercise for
finding and implementing good practice by comparing an organisation’s performance with
that of others, while the third seeks to ascertain the value or worth of an activity according
to criteria that usually derive from accountability or the need for legitimation. Examples
have shown that moving from one level to another is common and sometimes problematic.
They have also demonstrated the need for such interaction, and especially the need to
address the questions it raises. In many cases, evaluators were asked to “compare” and
“benchmark” the evaluated body with a generally high standard. Both comparison and
benchmarking have important implications for the development of indicators and the
underlying monitoring schemes that are attached to such developments.
Internationalised peer review
A further issue in terms of international comparison is the growing tendency to use
peers from other countries. Internationalised peer review is seen as a “clean hands”
activity that is relatively free from the biases that might exist in a community competing
for resources. Paradoxically, internationalisation of research means that the international
peer community is now likely to be closely connected to members of a given national
community – one has only to look at the steady rise of international co-publication. This
may lead to a rapid de facto homogeneisation of criteria, whatever the official remit,
especially since it is sometimes difficult for peers to grasp in the limited time available the
specificity of the local setting. There are thus issues of operational design and
implementation for the use of internationalised peer review. There is also an issue of
adequate positioning – when and for what to use international peers – so that the activity
remains both attractive for peers and credible for its users.
Situating the object of evaluation in its proper context
The project fallacy is a well-known phenomenon in evaluation. It arises from a
confusion of timing and scope between the unit of research, as perceived by the research
performer, and the contractual entity, the aspect of the research that is funded by the public
agency. While the agency may see its contractual entity as a project with deliverables that
form the basis of evaluation, in reality the project as seen by the research performer may
have started earlier, finish later and involve resources and objectives that are somewhat
broader in scale and scope. For example, research impacts are often cumulative over a
succession of projects. Also, the effects of research policies typically result from interaction
between the measure and the strategy of the research performer. This is well illustrated by
the evaluation of competence centres in several countries, which has shown that evaluation
needs to take the actors and the constellation as the units of analysis.
This lesson at the programme or institute level also applies at greater levels of
aggregation. Evaluations of research councils had to develop a systemic view of the country
OECD SCIENCE, TECHNOLOGY AND INDUSTRY OUTLOOK 2006 – ISBN 92-64-02848-X – © OECD 2006 195

6. EVALUATION OF PUBLICLY FUNDED RESEARCH: RECENT TRENDS AND PERSPECTIVES
in order to locate the councils and identify key questions. System-level evaluations have
spent much effort on the overall rationale and on articulation with other policies [fiscal,
procurement, competition, legal (especially for discussing IPR), and regulatory].
Evaluation and the implementation environment
Evaluation competes and combines with other sources of advice on policy and
management and it is important to understand how its influence can be made to act upon a
research body or system. The different cases presented here provide evidence that the impact
is moderated by its degree of alignment with the environment in which it is implemented.
There are two main environments. On the one hand, evaluation is institutionalised
and inserted into a regular policy process. Evaluation impacts then mostly concern
operational issues and/or research performers. On the other hand, evaluation is ad hoc,
even exceptional, and addresses the institutional setting per se. This is particularly visible
in recent evaluations of research councils, which have had major impacts on the relevant
country’s research system. It is thus important to study factors that may be instrumental
in generating such results. In the first instance, four points emerge.
● Context matters. Alignment of key stakeholders’ interests and evaluation goals was found
to be instrumental in Austria in ensuring substantial influence even when this was not
expected or supported by historical precedent.
● Operating below the purely political level is normally a more useful position for evaluation. While
assessment of impacts is a part of democratic accountability, it seems that an
intermediary layer able to absorb results and formulate possible actions provides a better
environment than one in which evaluation feeds directly into political debate where a
rational model of policy making may not prevail. The difficulty faced by the US Advanced
Technology Program in getting a large body of rigorous evaluation work accepted at this
level is a case in point.
● Timing of the evaluation, and in particular matching the decision cycle, is an important factor for
implementation. As a rule of thumb, the more far-reaching the recommendation, the
longer the time between decisions and hence between evaluations. Put another way, few
countries or agencies would wish to evaluate and/or reform their research structures
more often than every few years.
● Relevance, robustness and credibility of evaluation. Relevance here means that evaluation must
manage the relation between initial objectives and present policy questions. On the one
hand, it is necessary to be fair to researchers and managers and judge them at least in part
against their original objectives. On the other hand, the agenda for evaluation is set by
present and future questions which may challenge the validity of those objectives. Another
dimension of relevance is the need to fit the policy purpose. The context, style, method and
performance of evaluation differ markedly according to the questions being asked, the
context of the evaluation and the broader administrative culture in which it is set.
Robustness and credibility are the other key factors affecting take-up. They are made up of
a number of characteristics including quality, transparency, neutrality and standing of the
evaluators. These attributes are necessary to resist unfair criticisms of an evaluation.
Evaluation and unintended consequences
One central criterion of the success of evaluations is that they are taken up and
generate effects. Some effects are intended, and others appear, when looked at after the
OECD SCIENCE, TECHNOLOGY AND INDUSTRY OUTLOOK 2006 – ISBN 92-64-02848-X – © OECD 2006196

6. EVALUATION OF PUBLICLY FUNDED RESEARCH: RECENT TRENDS AND PERSPECTIVES
fact, surprising. These are often viewed as unintended effects, but they may well be an
intrinsic dimension of such processes, as for innovation. Two interpretations may be given
under this heading: evaluation of the unintended consequences of public intervention; and
the unintended consequences of evaluation.
Sensitivity to the first of these is a mark of good evaluation practice. Unintended
consequences may often be of greater importance than the achievement of formal
objectives. This is easy to see in economically oriented research where the indirect effects
of acquired technological capabilities may be exploited to greater effect in other aspects of
a firm’s business than in the originally targeted application. Negative consequences may
also flow from research and its exploitation. Sometimes the unintended consequences are
absorbed into a new rationale for the activity. An example comes from foresight
programmes, where many early exercises were justified on the basis of their ability to set
priorities. When these effects were somewhat limited but evaluations showed success in
building networks around new technological and market opportunities, such networks
became a key element of the rationale, with some post hoc rationalisation. Seen more
positively, such rationalisation shows that evaluation can both test and develop rationales
for public activities.
Among the unintended consequences of evaluation, two dangers are worth noting.
One is perverse incentives. The research community is very intelligent and can respond
quickly to indicators and incentives when these are linked to resources. However, the
incentives may not fully result in the behaviour sought by policy makers and lead to
overemphasis on certain activities at the expense of others. For example, a system that
rewards research performance but not links with industry is likely to shift the balance of a
university’s activities, particularly if the incentive affects individuals’ advancement in
terms of their career. A second danger is that third parties may use evaluation data
generated for one purpose to support another for which it may not be appropriate. Using
research ratings as an indicator of where to send first degree students may be an example.
The possibility of such effects should not be a reason not to undertake evaluation. Rather,
policy makers must accept that evaluation is like medicine: its positive effects have to be
weighed possible side effects before deciding to take a particular approach. Such adverse
effects are generally formalised in the next round of evaluations. Analysis of evaluations to
identify such consequences and learn from them may be useful.
Priority topics for international co-operation on evaluation
International co-operation is needed to further improve evaluation approaches and
tools. Three areas for such co-ordinated efforts that appear to be of particular importance
can be identified.
First, there is a need to foster wider and more in-depth exchanges among
administrators who promote or are in charge of evaluation. Exchanges and comparisons
require sustained efforts, a broader audience and an appropriate approach to more in-
depth discussion of interesting cases; this therefore calls for a forum of evaluation
practitioners which should be linked with ongoing developments. One outcome should be
a better delineation of the different levels of evaluation and the development of principles,
guidelines and methods adapted to each while recognising that evaluations must always
be designed ad hoc to fit their purpose.
OECD SCIENCE, TECHNOLOGY AND INDUSTRY OUTLOOK 2006 – ISBN 92-64-02848-X – © OECD 2006 197

6. EVALUATION OF PUBLICLY FUNDED RESEARCH: RECENT TRENDS AND PERSPECTIVES
There is also a need for more systematic comparative analysis of innovative approaches
to the evaluation of research policy, including of research councils or funding agencies. A
model of such co-operative work is the OECD project on behavioural additionality which
created sufficient bottom-up harmonisation of activity and exchange of experience to help
seriously advance the formulation of this concept. The OECD also provided a forum which
allowed these conceptual developments to feed very quickly back into the policy cycle.
Finally, there is the important task of improving practices and methodologies for a
new type of review of national innovation systems and policies. In recent years, innovation
is increasingly recognised as a key driver of economic growth. Consequently, most
countries have made innovation policy an integral part of their economic policy agenda.
These developments have increased the demand for assessments and reviews of national
innovation systems and policies that take into account the relationship between
innovation and economic performance.
Notes
1. This chapter is based on a report prepared by Luke Georghiou (PREST, Manchester Business School,University of Manchester) and Philippe Laredo (ENPC, Laboratoire Territoires, Techniques, Sociétésand PREST), in co-operation with the OECD, on the results of the International Workshop on theEvaluation of Publicly Funded Research co-organised by the OECD and Germany’s Federal Ministryof Education and Research (BMBF) in Berlin in September 2005.
2. In countries such as France, the distinction is less clear, as some research groups, the so-called“mixed research units”, are co-owned by research institutions and universities.
3. Selection is done through an annual open call. The units selected are established for four years andare usually renewed twice, each time for four years, subject to the results of the periodicevaluation. Less than one unit in five is closed before the end of this period. After 12 years units areofficially closed and must respond to the open yearly call if they wish to enter a second round.
4. The HGF covers 15 research centres, 250 institutes, 24 000 employees and 8 500 scientists andengineers. Its mission is to research systems of great complexity, provide access to large scientificinfrastructure and support technology development for innovative applications. In 2000, a“fundamental reform process” was undertaken with a view to concentrating on core competencesin its six major areas, increasing visibility and attractiveness, strengthening excellence andincreasing management efficiency.
5. The evaluation concludes with recommendations about the role of the Academy in the overallsystem. It also addresses the internal functioning of the council at both the strategic and theoperational levels.
6. See www.eua.be.
7. In Europe, a review of approaches and methods for evaluating programmes was performed in themid-1990s (Callon et al., 1997); a similar review was performed in the United States for theAdvanced Technology Program (ATP) (Ruegg and Feller, 2003).
8. ROAME is an acronym for Rationale, Objectives, Appraisal, Monitoring and Evaluation, a system forensuring that programmes have clear rationales and objectives and that an evaluation plan was inplace prior to approval to proceed with the programme.
9. See www.evalsed.info.
10. See www.map-network.net.
11. The aim of the evaluation was to draw conclusions from wide but scattered knowledge about theFinnish innovation system. The focus was on structural issues, especially the policyimplementation infrastructure. Hence it looked at agencies and their networks and the policyinstruments applied by those agents.
12. Since the 1995 Basic Law for Science and Technology was passed with the intention of doubling R&Dinvestment, there have been two Basic Plans. The first ran from 1996 to 2000 and focused on buildinginfrastructure and human resources for R&D, while the second (2001-05) was defined in terms of
OECD SCIENCE, TECHNOLOGY AND INDUSTRY OUTLOOK 2006 – ISBN 92-64-02848-X – © OECD 2006198

6. EVALUATION OF PUBLICLY FUNDED RESEARCH: RECENT TRENDS AND PERSPECTIVES
creating and using new knowledge for competitiveness, sustainable development and quality of life.Before embarking upon the Third Basic Plan it was decided to carry out a comprehensive review,which was entrusted to the National Institute for Science and Technology Policy (NISTEP), supportedby other organisations and under the supervision of a dedicated committee.
13. As part of its spending review (public spending plan for three years) the UK government publisheda ten-year investment framework for science and innovation, covering the period from 2004to 2014. It sets out the government’s ambition for UK science and innovation over next decade,emphasising its role in contributing to economic growth and public services and defining theattributes and funding arrangements of a research system that is capable of fulfilling thisambition. The framework commits the government to an annual average increase of 5.8% in S&Tfunding, but it also has a built-in evaluation framework.
Bibliography
Arnold, E., S. Faugert, A. Eriksson and V. Charlet (2005), “From Foresight to Consensus? An Evaluationof the Second Round of Swedish Technology Foresight”, Teknisk Framsyn, 2002-2004 June 2005.
Callon, M., P. Laredo and P. Mustar (1997), “The Strategic Management of Research and Technology,Evaluation of Programmes”, Economica International, Paris.
Cuhls, K. and L. Georghiou (2004), “Evaluating a Participative Foresight Process: ‘Futur – the GermanResearch Dialogue’”, Research Evaluation, Vol. 13 , No. 3, pp. 143-153.
Georghiou, L and F.M. Krahmer (1992), “Evaluation of Socio-economic Effects of Community R&DProgrammes – Lessons for concepts, methods and issues”, Research Evaluation, April.
Georghiou L. (1999), “Socio-economic Effects of Collaborative R&D – European Experiences”, Journal ofTechnology Transfer 24, pp. 69-79.
Georghiou, L. and D. Roessner (2000), “Evaluating Technology Programs: Tools and Methods”, ResearchPolicy 29 (2000), pp. 657-678.
Georghiou, L., K. Smith, O. Toivanen and P. Ylä Anttila (2003), “Evaluation of the Finnish InnovationSupport System”, Ministry of Trade and Industry, Finland.
Hall, B. et al. (2000), “How Effective are Fiscal Incentives for R&D: A New Review of the Evidence”,Research Policy 29, pp. 449-469.
Kondo, M. (2005), “Evaluation – Connecting Research and Innovation”, Manchester, European ResearchEvaluation Network Conference and the RTDN Meeting, 17-18 November.
de Laat, B., K. Warta and K. Williams (2001), Evaluation of ANVAR’s “Procédure d’aide au projetd’innovation”, 1993-1999, paper presented at the OECD, Paris, 4 November 2001.
Lhuillery, S. (2005), “Un panorama des mécanismes nationaux d’aides fiscales à la recherche et àl’innovation”, Note de recherche 2005-02, www.education.gouv/stateval.
OECD (2003), “Tax Incentives for Research and Development, Trends and Issues”. STI paper available atwww.oecd.org/dataoecd/12/27/2498389.pdf.
OECD, (2006a), Government R&D Funding and Company Behaviour – Measuring Behavioural Additionality,OECD, Paris.
Ruegg, R. and I. Feller (2003), “A Toolkit for Evaluating Public R&D Investment, Lessons from theAdvanced Technology Program”, NIST GCR 03-857, July 2003.
Warda, J. (2001), “Measuring the Value of R&D Tax Treatment in OECD Countries”, STI Review 27,pp. 185-211.
OECD SCIENCE, TECHNOLOGY AND INDUSTRY OUTLOOK 2006 – ISBN 92-64-02848-X – © OECD 2006 199


ISBN 92-64-02848-X
OECD Science, Technology and Industry Outlook 2006
© OECD 2006
STATISTICAL ANNEX
Main OECD Databases Used
Databases maintained by the Directorate for Science, Technologyand Industry (DSTI)
Industrial structure and performance
STAN: The database for Industrial Analysis includes annual measures of output, labour
input, investment and international trade which allow users to construct a wide range of
indicators focused on areas such as productivity growth, competitiveness and general
structural change. The industry list based on the the International Standard Industrial
Classification (ISIC) Rev. 3, provides sufficient details to enable users to highlight high-
technology sectors and is compatible with those lists used in related OECD databases. STAN-
Industry is primarily based on member countries’ annual National Accounts by activity
tables and uses data from other sources, such as national industrial surveys/censuses, to
estimate any missing detail. Since many of the data points in STAN are estimated, they do
not represent the official member country submissions. See www.oecd.org/sti/stan.
Publication: STAN-industry is available on line via SourceOECD (www.sourceoecd.org)
where it is regularly updated (new tables are posted as soon as they are ready). A
’’snapshot’’ of STAN-industry is also available on CD-ROM together with the latest version
of STAN – R&D (ANBERD), STAN – bilateral Trade and a set of derived STAN Indicators. See
www.oecd.org/sti/stan/indicators.
Science and technology
R&D and TBP: The R&D database contains the full results of the OECD surveys on R&Dexpenditure and personnel. The TBP database presents information on the technologybalance of payments. These databases serve, inter alia, as the raw material for both the
ANBERD and MSTI databases.
Publication: OECD (2005), Research and Development Statistics: 2004 Edition (formerly Basic
Science and Technology Statistics). Updated annually on CD-ROM as OECD Science and
Technology Statistics (a printed edition is also available every two years).
MSTI: The Main Science and Technology Indicators database provides a selection of
the most frequently used annual data on the scientific and technological performance of
OECD member countries and nine non-member economies (Argentina, China, Israel,
Romania, Russian Federation, Singapore, Slovenia, South Africa, Chinese Taipei). The
indicators, expressed in the form of ratios, percentages, growth rates, cover resources
201

STATISTICAL ANNEX
devoted to R&D, patent families, technology balance of payments and international trade
in highly R&D-intensive industries.
Publication: OECD (2006), Main Science and Technology Indicators 2006/1. Biannual. Also
available on CD-ROM as OECD Science and Technology Statistics.
ANBERD: The Analytical Business Enterprise Research and Development database is
an estimated database constructed with a view to creating a consistent data set that
overcomes the problems of international comparability and time discontinuity associated
with the official business enterprise R&D data provided to the OECD by its member
countries. ANBERD contains R&D expenditures for the period 1987-2004, by industry (ISIC
Rev. 3), for 19 OECD countries. See www.oecd.org/sti/anberd.
Publication: OECD (2004), Research and Development Expenditure in Industry 2004. Annual.
ANBERD is also available on line via SourceOECD (under the STAN heading) as well as on
the STAN family CD-ROM.
Patent database: This database contains patents filed at the largest national patent
offices – European Patent Office (EPO); US Patent and Trademark Office (USPTO); Japanese
Patent Office (JPO) – and other national or regional offices. Each patent is referenced by:
patent numbers and dates (publication, application and priority); names and countries of
residence of the applicants and of the inventors; and technological categories, using the
national patent classification as well as the International Patent Classification (IPC). The
compiled indicators mainly refer to single patent counts in a selected patent office, as well
as counts of “triadic” patent families (patents filed at the EPO, the USPTO and the JPO to
protect a single invention). See www.oecd.org/sti/ipr-statistics.
The series are published on a regular basis in OECD, Main Science and Technology
Indicators.
Globalisation and international trade
AFA: The Activities of Foreign Affiliates database presents detailed data on the
performance of foreign affiliates in the manufacturing industry of OECD countries (inward
and outward investment). The data indicate the increasing importance of foreign affiliates
in the economies of host countries, particularly in production, employment, value added,
research and development, exports, wages and salaries. AFA contains 18 variables broken
down by country of origin and by industrial sector (based on ISIC Rev. 3) for 23 OECD
countries.
Publication: OECD, Measuring Globalisation: The Role of Multinationals in OECD Economies,
2001 Edition. Vol. I: Manufacturing. Biennial. Also available annually online on
SourceOECD. See www.sourceoecd.org.
FATS: This database gives detailed data on the activities of foreign affiliates in the
service sector of OECD countries (inward and outward investment). The data indicate the
increasing importance of foreign affiliates in the economies of host countries and of
affiliates of national firms implanted abroad. FATS contains five variables (production,
employment, value added, imports and exports) broken down by country of origin (inward
investments) or implantation (outward investments) and by industrial sector (based on
ISIC Rev. 3) for 21 OECD countries.
Publication: OECD, Measuring Globalisation: The Role of Multinationals in OECD Economies,
2001 Edition. Vol. II: Services. Biennial. Soon available on line.
OECD SCIENCE, TECHNOLOGY AND INDUSTRY OUTLOOK 2006 – ISBN 92-64-02848-X – © OECD 2006202

STATISTICAL ANNEX
Bilateral Trade (BTD): This database for industrial analysis includes detailed trade
flows by manufacturing industry between a set of OECD declaring countries and a selection
of partner countries and geographical regions. Data are presented in thousands of USD at
current prices, and the edition 2006 of BTD covers the period 1988-2003. The data have
been derived from the OECD database International Trade by Commodities Statistics (ITCS –
formerly Foreign Trade Statistics or FTS). Imports and exports are grouped according to the
country of origin and the country of destination of the goods. The data have been
converted from product classification schemes to an activity classification scheme based
on ISIC Rev.3, compatible with the OED’s STAN-industry, Input-Output tables and ANBERD
databases. See www.oecd.org/sti/btd.
Publication: OECD, (2006) Bilateral Trade Database, 2006. BTD is available online via
SourceOECD (under the STAN heading) as well as on the STAN family CD-ROM.
Information and communication technology (ICT)
Telecommunications: This database is produced in association with the biennial
Communications Outlook. It provides time-series data covering all OECD countries, where
available, for the period 1980-2004. It contains both telecommunication and economic
indicators.
Publication: OECD (2005), OECD Telecommunications and Internet Statistics 2005. The
database is available online via SourceOECD as well as on CD-ROM.
Publication: OECD (2004), Research and Development Expenditure in Industry 2004. The
2005/2006 edition of this title is also available.
ICT: Work is under way to develop a database on ICT supply and ICT usage statistics.
Statistics on employment, value added, production, wages and salaries, number of
enterprises, R&D, imports and exports for the ICT sector are been collected following the
OECD ICT sector definition.
OECD SCIENCE, TECHNOLOGY AND INDUSTRY OUTLOOK 2006 – ISBN 92-64-02848-X – © OECD 2006 203
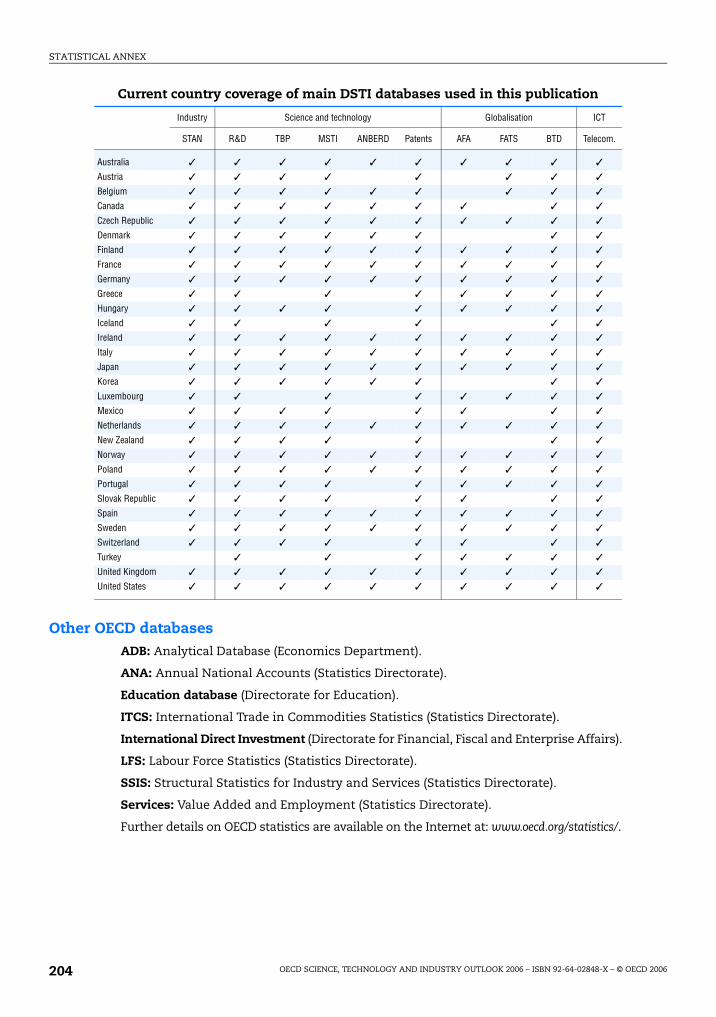
STATISTICAL ANNEX
Other OECD databasesADB: Analytical Database (Economics Department).
ANA: Annual National Accounts (Statistics Directorate).
Education database (Directorate for Education).
ITCS: International Trade in Commodities Statistics (Statistics Directorate).
International Direct Investment (Directorate for Financial, Fiscal and Enterprise Affairs).
LFS: Labour Force Statistics (Statistics Directorate).
SSIS: Structural Statistics for Industry and Services (Statistics Directorate).
Services: Value Added and Employment (Statistics Directorate).
Further details on OECD statistics are available on the Internet at: www.oecd.org/statistics/.
Current country coverage of main DSTI databases used in this publication
Industry Science and technology Globalisation ICT
STAN R&D TBP MSTI ANBERD Patents AFA FATS BTD Telecom.
Australia ✓ ✓ ✓ ✓ ✓ ✓ ✓ ✓ ✓ ✓
Austria ✓ ✓ ✓ ✓ ✓ ✓ ✓ ✓
Belgium ✓ ✓ ✓ ✓ ✓ ✓ ✓ ✓ ✓
Canada ✓ ✓ ✓ ✓ ✓ ✓ ✓ ✓ ✓
Czech Republic ✓ ✓ ✓ ✓ ✓ ✓ ✓ ✓ ✓ ✓
Denmark ✓ ✓ ✓ ✓ ✓ ✓ ✓ ✓
Finland ✓ ✓ ✓ ✓ ✓ ✓ ✓ ✓ ✓ ✓
France ✓ ✓ ✓ ✓ ✓ ✓ ✓ ✓ ✓ ✓
Germany ✓ ✓ ✓ ✓ ✓ ✓ ✓ ✓ ✓ ✓
Greece ✓ ✓ ✓ ✓ ✓ ✓ ✓ ✓
Hungary ✓ ✓ ✓ ✓ ✓ ✓ ✓ ✓ ✓
Iceland ✓ ✓ ✓ ✓ ✓ ✓
Ireland ✓ ✓ ✓ ✓ ✓ ✓ ✓ ✓ ✓ ✓
Italy ✓ ✓ ✓ ✓ ✓ ✓ ✓ ✓ ✓ ✓
Japan ✓ ✓ ✓ ✓ ✓ ✓ ✓ ✓ ✓ ✓
Korea ✓ ✓ ✓ ✓ ✓ ✓ ✓ ✓
Luxembourg ✓ ✓ ✓ ✓ ✓ ✓ ✓ ✓
Mexico ✓ ✓ ✓ ✓ ✓ ✓ ✓ ✓
Netherlands ✓ ✓ ✓ ✓ ✓ ✓ ✓ ✓ ✓ ✓
New Zealand ✓ ✓ ✓ ✓ ✓ ✓ ✓
Norway ✓ ✓ ✓ ✓ ✓ ✓ ✓ ✓ ✓ ✓
Poland ✓ ✓ ✓ ✓ ✓ ✓ ✓ ✓ ✓ ✓
Portugal ✓ ✓ ✓ ✓ ✓ ✓ ✓ ✓ ✓
Slovak Republic ✓ ✓ ✓ ✓ ✓ ✓ ✓ ✓
Spain ✓ ✓ ✓ ✓ ✓ ✓ ✓ ✓ ✓ ✓
Sweden ✓ ✓ ✓ ✓ ✓ ✓ ✓ ✓ ✓ ✓
Switzerland ✓ ✓ ✓ ✓ ✓ ✓ ✓ ✓
Turkey ✓ ✓ ✓ ✓ ✓ ✓ ✓
United Kingdom ✓ ✓ ✓ ✓ ✓ ✓ ✓ ✓ ✓ ✓
United States ✓ ✓ ✓ ✓ ✓ ✓ ✓ ✓ ✓ ✓
OECD SCIENCE, TECHNOLOGY AND INDUSTRY OUTLOOK 2006 – ISBN 92-64-02848-X – © OECD 2006204

STATISTICAL ANNEX
Standard Statistical Notes Used in the Annex Tables
a) Break in series with previous year for which data is available.
b) Secretariat estimate or projection based on national sources.
c) National estimate or projection.
d) Defence excluded (all or mostly).
e) National results adjusted by the Secretariat.
f) Including R&D in the social sciences and humanities.
g) Excluding R&D in the social sciences and humanities.
h) Federal or central government only.
i) Excludes data for the R&D content of general payment to the higher education sector
for combined education and research (public GUF).
j) Excludes most or all capital expenditure.
k) Total intramural R&D expenditure instead of current intramural R&D expenditure.
l) Overestimated or based on overestimated data.
m) Underestimated or based on underestimated data.
n) Included elsewhere.
o) Includes other classes.
p) Provisional.
q) At current exchange rate and not at current purchasing power parities.
r) (Note not currently in use).
s) Unrevised breakdown not adding to the revised total.
t) Do not correspond exactly to Frascati Manual norms.
u) University graduates instead of researchers.
v) The sum of the breakdown does not add to the total.
w) Including extramural R&D expenditure.
x) Confidential.
OECD SCIENCE, TECHNOLOGY AND INDUSTRY OUTLOOK 2006 – ISBN 92-64-02848-X – © OECD 2006 205

STATISTICAL ANNEX
Standard Industry Agreggation by Technology Level(based on ISIC Revision 3)
The high-technology industries (HT) are defined as the sum of:
● Pharmaceuticals (2423),
● Office and computing machinery (30),
● Radio, TV and communication equipment (32),
● Medical, precision and optical equipment (33),
● Aircraft and spacecraft (353).
The medium-high-technology industries (MHT) are defined as the sum of:
● Chemicals excluding pharmaceuticals (24 excl. 2423),
● Machinery and equipment (29),
● Electrical machinery and apparatus (31),
● Motor vehicles and trailers (34),
● Railroad and transport equipment (352+359).
The medium-low-technology industries (MLT) are defined as the sum of:
● Coke, refined petroleum products and nuclear fuel (23),
● Rubber and plastic products (25),
● Other non-metallic mineral products (26),
● Basic metals (27),
● Fabricated metal products except machinery and equipment (28),
● Building and repairing of ships and boats (351).
The low-technology industries (LT) are defined as the sum of:
● Food products, beverages and tobacco (15-16),
● Textiles, textile products, leather and footwear (17-19),
● Wood, pulp, paper, paper products, printing and publishing (20-22),
● Manufacturing n.e.c. and recycling (36-37).
OECD SCIENCE, TECHNOLOGY AND INDUSTRY OUTLOOK 2006 – ISBN 92-64-02848-X – © OECD 2006206

STATISTICAL ANNEX
Annex Tables
OECD SCIENCE, TECHNOLOGY AND INDUSTRY OUTLOOK 2006 – ISBN 92-64-02848-X – © OECD 2006 207

STATISTICAL ANNEX
0041
nt
367253
Australia 9 608.6 48.8 42.4 51.2 26.7 19.3 73 344
Austria 6 522.3 c 45.7 c 36.4 c 66.8 27.0 5.7 24 124
Belgium 6 203.1 p 60.3 23.5 68.6 p 22.6 p 7.6 p 31 880 p
Canada 21 047.6 p 47.1 p 34.1 c,p 52.7 p 37.5 p 9.5 p 112 624 c,p
Czech Republic 2 412.0 52.8 41.9 63.7 14.8 21.2 16 300
Denmark 4 334.3 p 59.9 27.1 68.0 p 24.4 p 6.9 p 26 167
Finland 5 462.3 69.3 26.3 70.1 19.8 9.5 41 004 a
France 38 985.0 p 50.8 39.0 62.9 p 19.1 p 16.7 p 192 790
Germany 59 115.0 c 67.1 c 30.4 70.4 c 16.3 c 13.2 c,o 268 942
Greece 1 392.1 30.7 47.4 30.1 48.1 20.9 15 390
Hungary 1 433.3 d 37.1 d,v 51.8 d,v 41.1 d,v 24.6 d,v 29.5 d,v 14 904 d
Iceland 255.1 43.9 40.1 51.8 21.3 24.8 1 917
Ireland 1 767.9 c,p 57.2 c,p 32.2 c 64.6 c,p 27.6 c,p 7.8 c,p 10 910 c,p
Italy 17 505.5 43.0 50.8 47.3 33.9 17.5 70 332
Japan 118 026.3 74.8 18.1 e 75.2 13.4 9.5 677 206
Korea 28 288.3 g 75.0 g 23.1 g 76.7 g 9.9 g 12.1 g 156 220 g
Luxembourg 476.7 p 80.4 11.2 87.8 p 1.2 p 10.9 p 2 149 p
Mexico 4 276.0 34.7 56.1 34.6 37.9 26.2 33 484
Netherlands 9 583.0 p 51.1 36.2 57.8 p 27.9 p 14.4 p 37 282
New Zealand 1 088.5 38.5 45.1 42.5 28.5 28.9 15 568
Norway 3 015.9 49.2 41.9 54.8 29.7 15.5 20 989
Poland 2 764.2 26.9 65.2 28.7 32.0 39.0 60 944
Portugal 1 437.0 31.7 60.1 33.2 38.4 16.9 20 242
Slovak Republic 388.9 38.3 57.1 m 49.2 20.1 30.5 d 10 718
Spain 11 801.9 48.0 41.0 54.4 29.5 16.0 100 994
Sweden 10 440.9 m 65.0 23.5 74.1 22.0 l 3.5 h 47 836
Switzerland 7 630.2 69.7 22.7 73.7 22.9 1.1 h 25 400
Turkey 3 014.5 41.3 50.6 28.7 64.3 7.0 23 995
United Kingdom 33 231.2 43.8 31.4 65.7 21.4 9.7 157 662
United States 312 535.4 j,p 63.7 j,o,p 31.0 j,p 70.1 j,p 13.6 j,p 12.2 h,p 1 334 628 b
EU-25 210 167.9 b 53.7 b 35.0 b 63.3 b 22.1 b 13.4 b 1 178 116 b
Total OECD 729 430.8 b,p 61.9 b 30.2 b 67.9 b,p 17.1 b,p 12.5 b,p 3 559 133 b
Non-member economies
Argentina 2 234.4 30.7 64.5 33.0 25.0 39.7 29 471
China 93 992.0 a 65.7 a,v 26.6 a,v 66.8 a 10.2 a 23.0 a 926 252 a
Israel 8 714.1 b,d,p 64.4 d 23.3 d 76.5 d,p 15.3 d,g,p 4.5 d,p ..
Romania 715.8 44.0 49.0 55.3 10.1 34.1 21 257
Russian Federation 16 669.7 31.4 60.6 69.1 5.5 25.3 477 647
Singapore 2 678.3 54.2 36.6 63.8 25.4 10.9 21 359
Slovenia 608.3 58.5 30.0 67.0 12.9 19.8 4 030
South Africa 4 029.7 54.8 34.0 55.5 f 20.5 21.9 14 131
Chinese Taipei 14 951.0 64.4 33.9 64.4 11.6 23.4 72 720 m
1. Or latest year.
Source: OECD, Main Science and Technology Indicators, June 2006.
Higher education Government
Gross domestic expenditure on R&D, 20041
Table 1. Key figures on research and development
Total researchers, 2
Million current PPP USD
% financed by % performed by
Full-time equivale
Industry Government Industry
StatLink: http://dx.doi.org/10.1787/427771
OECD SCIENCE, TECHNOLOGY AND INDUSTRY OUTLOOK 2006 – ISBN 92-64-02848-X – © OECD 2006208

STATISTICAL ANNEX
5
..
3 c
..
6 p
..
..
..
..
..
..
..
..
..
..
..
..
..
..
..
..
..
..
..
..
..
..
..
..
..
..
..
..
..
..
1 b,d,p
..
..
..
..
..
..
822554
1995 2000 2001 2002 2003 2004 200
Australia .. 7 931.3 .. 9 608.6 .. ..
Austria 2 845.8 c 4 403.9 c 4 775.0 c 5 137.7 5 505.0 c 5 964.2 c 6 522.
Belgium 3 763.4 5 383.1 5 978.4 5 890.4 5 885.6 6 203.1 p
Canada 11 313.5 16 723.5 19 045.0 19 026.4 19 285.5 20 210.5 p 21 047.
Czech Republic 1 268.9 a 1 842.5 1 940.3 2 070.5 2 224.7 2 412.0
Denmark 2 160.0 .. 3 817.0 4 086.8 4 254.9 4 334.3 p
Finland 2 218.8 4 514.1 4 731.2 4 997.0 5 140.6 5 462.3
France 28 477.9 33 800.0 a 36 542.2 38 360.0 38 238.5 38 985.0 p
Germany 39 436.1 c 51 543.2 53 279.2 55 673.5 57 455.4 59 115.0 c
Greece 671.6 a .. 1 226.4 .. 1 392.1 ..
Hungary 695.2 d 981.0 d 1 276.7 d 1 494.7 d 1 442.7 d 1 433.3 d
Iceland 92.6 219.1 c 256.4 261.4 c 255.1 ..
Ireland 821.5 c 1 232.4 c 1 303.5 c 1 433.0 c 1 576.0 c 1 767.9 c,p
Italy 11 898.9 15 411.5 16 572.1 17 698.6 17 505.5 ..
Japan 82 104.1 l 98 804.0 104 112.0 108 248.1 112 935.4 118 026.3
Korea 13 681.3 g 18 386.5 g 21 156.5 g 22 246.6 g 24 321.3 g 28 288.3 g
Luxembourg .. 368.0 .. .. 444.5 476.7 p
Mexico 1 941.9 3 347.7 3 623.1 4 151.6 4 276.0 ..
Netherlands 6 654.1 8 241.2 8 785.7 8 708.3 9 069.6 9 583.0 p
New Zealand 608.8 .. 960.5 a .. 1 088.5 ..
Norway 1 765.9 a .. 2 680.6 2 782.7 2 943.4 3 015.9
Poland 1 883.8 a 2 633.3 2 627.5 2 477.5 2 474.7 2 764.2
Portugal 751.7 1 423.5 c 1 577.9 1 563.1 c 1 437.0 ..
Slovak Republic 411.9 d 378.5 396.9 390.8 412.1 388.9
Spain 5 012.7 7 699.7 8 301.6 9 684.4 10 966.6 11 801.9
Sweden 6 297.6 a,m .. 10 412.4 m .. 10 440.9 m ..
Switzerland .. 5 622.1 .. .. .. 7 630.2
Turkey 1 305.7 2 944.3 3 045.9 3 014.5 .. ..
United Kingdom 22 511.8 27 990.9 29 849.3 32 481.4 33 231.2 ..
United States 184 077.0 j 267 767.5 j 277 820.2 j 276 260.2 j 292 437.4 j,p 312 535.4 j,p
EU-25 138 416.2 b 182 566.8 b 194 758.8 b 205 263.2 b 210 167.9 b ..
Total OECD 440 112.9 a,b 606 778.1 b 641 441.3 b 657 397.1 b 687 320.3 b 729 430.8 b,p
Argentina .. 1 971.1 1 867.7 1 626.9 1 877.8 2 234.4
China 17 400.0 m 44 777.1 a 52 417.6 65 154.2 76 890.8 93 992.0 a
Israel 2 977.3 d 6 996.2 d 7 457.7 d 7 563.4 d 7 205.4 d,p 7 666.0 d,p 8 714.
Romania 1 022.1 a 470.7 551.8 580.6 640.7 715.8
Russian Federation 7 373.1 10 898.6 12 988.0 14 742.9 16 759.4 16 669.7
Singapore 725.3 1 810.4 2 006.9 2 201.5 2 254.8 2 678.3
Slovenia 390.3 l 472.8 545.4 564.6 509.4 608.3
South Africa .. .. 3 344.4 .. 4 029.7 ..
Chinese Taipei 6 183.2 d 10 181.9 d 10 749.1 d 12 084.9 a 13 493.6 14 951.0
Source: OECD, Main Science and Technology Indicators, June 2006.
Table 2. Gross domestic expenditure on R&D (GERD)
Million current PPP USD
StatLink: http://dx.doi.org/10.1787/142876
OECD SCIENCE, TECHNOLOGY AND INDUSTRY OUTLOOK 2006 – ISBN 92-64-02848-X – © OECD 2006 209

STATISTICAL ANNEX
.c
.b,p
.
.
.
.
.
.
.
.
.
.
.
.
.
.
.
.
.
.
.
.
.
.
.
.
.
.
.
.
.
.d,p
.
.
.
.
.
.
437543
1995 2000 2001 2002 2003 2004 2005
Australia .. 1.51 .. 1.64 .. .. .
Austria 1.54 c 1.91 c 2.03 c 2.12 2.20 c 2.24 c 2.35
Belgium 1.67 1.97 2.08 1.94 1.89 1.90 p .
Canada 1.72 1.94 2.13 2.06 2.00 1.99 p 1.96
Czech Republic 0.95 a 1.23 1.22 1.22 1.26 1.27 .
Denmark 1.82 .. 2.39 2.51 2.56 2.48 p .
Finland 2.26 3.38 3.38 3.43 3.48 3.51 .
France 2.29 2.15 a 2.20 2.23 2.18 2.16 p .
Germany 2.19 c 2.45 2.46 2.49 2.52 2.49 c .
Greece 0.49 a .. 0.65 .. 0.62 .. .
Hungary 0.73 d 0.79 d 0.94 d 1.01 d 0.94 d 0.89 d .
Iceland 1.56 2.73 c 3.04 3.08 c 2.92 .. .
Ireland 1.26 c 1.13 c 1.10 c 1.10 c 1.16 c 1.20 c,p .
Italy 0.97 1.05 1.09 1.13 1.11 .. .
Japan 2.90 l 2.99 3.07 3.12 3.15 3.13 .
Korea 2.37 g 2.39 g 2.59 g 2.53 g 2.63 g 2.85 g .
Luxembourg .. 1.71 .. .. 1.78 1.75 p .
Mexico 0.31 0.37 0.39 0.44 0.43 .. .
Netherlands 1.91 1.82 1.80 1.72 1.76 1.78 p .
New Zealand 0.95 .. 1.13 a .. 1.14 .. .
Norway 1.70 a .. 1.60 1.67 1.73 1.61 .
Poland 0.65 a 0.66 0.64 0.58 0.56 0.58 .
Portugal 0.57 0.80 c 0.85 0.80 c 0.78 .. .
Slovak Republic 0.93 d 0.65 0.64 0.58 0.58 0.53 .
Spain 0.79 0.91 0.92 0.99 1.05 1.07 .
Sweden 3.32 a,m .. 4.25 m .. 3.95 m .. .
Switzerland .. 2.57 .. .. .. 2.94 .
Turkey 0.38 0.64 0.72 0.66 .. .. .
United Kingdom 1.95 1.86 1.87 1.89 1.88 .. .
United States 2.51 j 2.74 j 2.76 j 2.65 j 2.68 j,p 2.68 j,p .
EU-25 1.69 b 1.77 b 1.80 b 1.81 b 1.81 b .. .
Total OECD 2.07 a,b 2.23 b 2.27 b 2.24 b 2.25 b 2.26 b,p .
Argentina .. 0.44 0.42 0.39 0.41 0.44 .
China 0.57 m 0.90 a 0.95 1.07 1.13 1.23 a .
Israel 2.61 d 4.45 d 4.75 d 4.82 d 4.46 d,p 4.42 d,p 4.69
Romania 0.80 a 0.37 0.39 0.38 0.39 0.39 .
Russian Federation 0.85 1.05 1.18 1.25 1.28 1.15 .
Singapore 1.15 1.89 2.10 2.15 2.13 2.25 .
Slovenia 1.57 l 1.43 1.55 1.52 1.32 1.45 .
South Africa .. .. 0.73 .. 0.80 .. .
Chinese Taipei 1.78 d 2.06 d 2.17 d 2.31 a 2.45 2.56 .
Source: OECD, Main Science and Technology Indicators, June 2006.
Table 3. GERD intensity
As a percentage of GDP
StatLink: http://dx.doi.org/10.1787/140706
OECD SCIENCE, TECHNOLOGY AND INDUSTRY OUTLOOK 2006 – ISBN 92-64-02848-X – © OECD 2006210

STATISTICAL ANNEX
608723
1995 2000 2001 2002 2003 2004 2005
Australia .. 7 931.3 .. 9 225.5 .. .. ..
Austria 3 062.9 c 4 403.9 c 4 719.1 c 4 969.7 5 227.9 c 5 456.5 c 5 817.6 c
Belgium 3 994.0 5 383.1 5 725.7 5 442.3 5 328.0 5 498.7 p ..
Canada 12 089.9 16 723.5 18 597.0 18 553.9 18 431.5 18 821.7 p 19 079.9 p
Czech Republic 1 326.7 a 1 842.5 1 878.9 1 906.8 2 028.8 2 133.9 ..
Denmark 2 429.5 .. 3 696.7 3 902.3 4 010.4 3 964.4 p ..
Finland 2 403.9 4 514.1 4 567.1 4 729.4 4 916.7 5 136.2 ..
France 31 189.0 33 800.0 a 35 282.1 36 250.0 35 739.8 36 263.9 p ..
Germany 41 621.0 c 51 543.2 52 322.9 52 926.9 53 531.4 53 669.4 c ..
Greece 729.0 a .. 1 200.9 .. 1 244.8 .. ..
Hungary 739.2 d 981.0 d 1 209.0 d 1 356.4 d 1 303.9 d 1 287.5 d ..
Iceland 98.4 219.1 c 252.3 252.5 c 248.3 .. ..
Ireland 870.4 c 1 232.4 c 1 273.8 c 1 355.9 c 1 487.6 c 1 611.8 c,p ..
Italy 13 054.4 15 411.5 16 300.0 16 961.0 16 648.5 .. ..
Japan 89 892.5 l 98 804.0 101 663.1 103 031.2 105 348.5 107 282.3 ..
Korea 14 679.4 g 18 386.5 g 20 658.9 g 21 606.7 g 23 150.5 g 26 238.2 g ..
Luxembourg .. 368.0 .. .. 409.6 422.2 p ..
Mexico 2 129.7 3 347.7 3 537.9 3 944.8 3 979.7 .. ..
Netherlands 7 192.2 8 241.2 8 293.2 7 932.3 8 081.0 8 342.8 p ..
New Zealand 672.5 .. 941.2 a .. 1 029.3 .. ..
Norway 2 015.0 a .. 2 621.4 2 685.2 2 811.5 2 801.7 c ..
Poland 2 003.4 a 2 633.3 2 564.4 2 356.2 2 364.1 2 597.6 ..
Portugal 836.3 1 423.5 c 1 529.9 1 452.4 c 1 400.2 .. ..
Slovak Republic 452.0 d 378.5 386.1 363.6 384.9 365.3 ..
Spain 5 508.5 7 699.7 8 047.9 8 902.0 9 777.3 10 234.8 ..
Sweden 6 819.1 a,m .. 10 356.4 m .. 9 976.7 m .. ..
Switzerland .. 5 622.1 .. .. .. 6 632.0 ..
Turkey 1 439.2 2 944.3 3 077.3 3 046.3 .. .. ..
United Kingdom 25 096.5 27 990.9 28 772.3 29 688.5 30 347.6 .. ..
United States 199 884.1 j 267 767.5 j 271 285.5 j 265 122.4 j 275 049.5 j,p 286 436.4 j,p ..
EU-25 150 013.5 b 182 566.8 b 189 460.1 b 193 242.8 b 195 220.7 b .. ..
Total OECD 478 069.7 a,b 606 778.1 b 625 926.4 b 626 805.3 b 643 663.4 b 666 975.0 b,p ..
Argentina .. 1 971.1 1 823.1 1 487.7 1 707.7 1 987.1 ..
China 17 833.7 m 44 777.1 a 50 628.8 62 229.8 72 679.9 87 209.9 a ..
Israel 3 310.4 d 6 996.2 d 7 429.9 d 7 444.3 d 6 998.1 d,p 7 266.2 d,p 8 125.4 d,p
Romania 1 088.7 a 470.7 531.3 538.3 575.9 625.3 ..
Russian Federation 7 731.4 10 898.6 12 840.2 14 261.5 15 734.1 15 386.0 ..
Singapore 808.0 1 810.4 1 978.9 2 087.5 2 094.7 2 400.8 ..
Slovenia 418.0 l 472.8 526.5 534.5 475.4 545.4 ..
South Africa .. .. 3 240.5 .. 3 779.7 .. ..
Chinese Taipei 6 715.0 d 10 181.9 d 10 505.5 d 11 603.0 a 12 723.4 14 051.9 ..
Source: OECD, Main Science and Technology Indicators, June 2006.
Table 4. Gross R&D expenditures
Million 2000 USD, constant prices and PPP
StatLink: http://dx.doi.org/10.1787/725773
OECD SCIENCE, TECHNOLOGY AND INDUSTRY OUTLOOK 2006 – ISBN 92-64-02848-X – © OECD 2006 211

STATISTICAL ANNEX
5
.
.
.
.
.
.
.
.
.
.
.
.
.
.
.
.
.
.
.
.
.
.
.
.
.
.
.
.
.
.
.
.d,k,p
.
.
.
.
.
.
654518
1995 2000 2001 2002 2003 2004 200
Australia .. 0.39 k .. 0.41 k .. .. .
Austria .. .. .. 0.37 k,m .. .. .
Belgium .. .. .. .. .. .. .
Canada .. .. .. .. .. .. .
Czech Republic 0.16 k 0.29 c,k 0.31 c,k 0.30 c,k 0.32 k 0.33 k .
Denmark .. .. .. .. 0.43 .. .
Finland .. .. .. .. .. .. .
France 0.51 k 0.51 a,k 0.51 k 0.52 k 0.53 k .. .
Germany .. .. .. .. .. .. .
Greece .. .. .. .. .. .. .
Hungary 0.18 0.19 0.24 0.25 0.25 0.26 p .
Iceland 0.38 k .. 0.46 k 0.46 c,k 0.47 k .. .
Ireland .. .. .. 0.17 c,k 0.23 k 0.27 c,k,p .
Italy 0.22 k .. .. .. .. .. .
Japan 0.41 k,l 0.37 k 0.37 k 0.39 k 0.40 k 0.37 k .
Korea 0.30 g,k 0.30 g,k 0.33 g,k 0.35 g,k 0.38 g,k 0.44 g,k .
Luxembourg .. .. .. .. .. .. .
Mexico 0.09 0.11 0.12 .. 0.09 .. .
Netherlands 0.18 k .. .. .. .. .. .
New Zealand .. .. 0.52 a,k .. 0.38 k .. .
Norway 0.25 .. 0.24 .. 0.28 .. .
Poland 0.20 a,o 0.21 0.19 0.19 0.19 0.18 .
Portugal 0.14 k 0.18 c 0.19 0.19 c 0.19 .. .
Slovak Republic 0.20 d 0.15 0.15 0.15 0.19 0.21 .
Spain 0.17 0.15 c 0.15 0.15 0.21 0.20 .
Sweden .. .. .. .. .. .. .
Switzerland .. 0.72 k .. .. .. 0.85 h,k .
Turkey .. .. .. .. .. .. .
United Kingdom .. .. .. .. .. .. .
United States 0.40 0.44 0.47 0.49 0.50 p 0.50 p .
Argentina .. 0.12 k 0.12 k 0.10 k 0.11 k 0.11 k .
China 0.03 k,m 0.05 a,k 0.05 k 0.06 k 0.06 k 0.07 k .
Israel .. 0.76 d,k 0.80 d,k 0.96 d,k 0.86 d,k,p 0.81 d,k,p 0.80
Romania 0.10 0.06 0.07 0.07 0.09 0.08 .
Russian Federation 0.13 0.14 0.16 0.17 0.18 0.16 .
Singapore 0.17 k 0.22 k 0.32 k 0.33 k 0.37 k 0.42 k .
Slovenia 0.41 0.31 0.33 0.31 0.14 0.15 .
South Africa .. .. 0.20 .. 0.19 .. .
Chinese Taipei .. 0.21 d,k 0.23 d,k 0.25 a,k 0.29 k 0.29 k .
Source: OECD, Main Science and Technology Indicators, June 2006.
Table 5. Basic research expenditure
As a percentage of GDP
StatLink: http://dx.doi.org/10.1787/222122
OECD SCIENCE, TECHNOLOGY AND INDUSTRY OUTLOOK 2006 – ISBN 92-64-02848-X – © OECD 2006212

STATISTICAL ANNEX
4
..
..
0 p
..
0
7
4 a
..
..
..
4 d
..
0 c,p
..
6
0 g
9 p
..
..
..
..
4
..
8
4
..
0
..
..
..
..
..
1
2 a
..
7
7
9
0
..
0 m
225628
1995 1999 2000 2001 2002 2003 200
Australia .. .. 66 001 .. 73 344 ..
Austria .. .. .. .. 24 124 ..
Belgium 23 309 29 732 30 540 32 237 30 668 30 917 31 88
Canada 87 380 98 813 108 492 114 957 c,p 112 624 c,p ..
Czech Republic 11 936 a 13 535 13 852 14 987 14 974 15 809 16 30
Denmark 15 954 u 18 945 u .. 19 453 u 25 546 a 24 882 26 16
Finland 16 863 u 32 676 u 34 847 u 36 889 ,u 38 632 ,u 41 724 u 41 00
France 151 249 160 424 172 070 a 177 372 186 420 192 790
Germany 231 128 254 691 257 874 c 264 385 265 812 c 268 942
Greece 9 705 a 14 748 .. 14 371 .. 15 390
Hungary 10 499 d 12 579 d 14 406 d 14 666 d 14 965 d 15 180 d 14 90
Iceland 1 076 1 578 .. 1 859 .. 1 917
Ireland 5 764 c 7 877 c 8 516 c 8 949 9 376 c 10 039 10 91
Italy 75 536 65 098 66 110 66 702 71 242 70 332
Japan 673 421 l 658 910 647 572 675 898 646 547 a 675 330 677 20
Korea 100 456 g 100 210 g 108 370 g 136 337 g 141 917 g 151 254 g 156 22
Luxembourg .. .. 1 646 .. .. 1 949 2 14
Mexico 19 434 21 879 c .. .. .. 33 484
Netherlands 34 640 40 390 42 088 45 517 38 159 a 37 282
New Zealand 6 104 8 768 .. 13 133 a .. 15 568
Norway 15 931 a,u 18 295 u .. 20 048 .. 20 989
Poland 50 425 56 433 55 174 56 148 56 725 58 595 60 94
Portugal 11 599 u 15 752 16 738 c 17 725 18 984 c 20 242
Slovak Republic 9 711 d 9 204 9 955 9 585 9 181 9 627 10 71
Spain 47 342 61 568 76 670 80 081 83 318 92 523 100 99
Sweden 33 665 39 921 .. 45 995 .. 47 836
Switzerland .. .. 26 105 .. .. .. 25 40
Turkey 15 854 20 065 23 083 22 702 23 995 ..
United Kingdom 145 673 .. .. .. .. ..
United States 1 035 995 1 260 920 1 289 262 b 1 320 096 b 1 334 628 b ..
EU-25 917 145 b 1 036 117 b 1 079 016 b 1 118 164 b 1 153 405 b 1 178 116 b
Total OECD 2 814 606 a,b 3 296 364 b 3 383 485 b 3 524 549 b 3 559 133 b ..
Argentina .. 26 004 26 420 25 656 26 083 27 367 29 47
China 522 000 m 531 100 m 695 062 a 742 726 810 525 862 108 926 25
Israel .. .. .. .. .. ..
Romania 32 780 23 473 20 476 19 726 20 286 20 965 21 25
Russian Federation 610 357 497 030 506 420 505 778 491 944 487 477 477 64
Singapore 7 695 12 598 16 633 16 740 18 120 20 024 21 35
Slovenia 4 897 4 427 4 336 4 498 4 642 3 775 4 03
South Africa .. .. .. 14 182 .. 14 131
Chinese Taipei .. 54 844 d,m 55 460 d,m 59 656 d,m 64 171 a,m 67 599 m 72 72
Source: OECD, Main Science and Technology Indicators, June 2006.
Table 6. Total researchers
Full-time equivalent (FTE)
StatLink: http://dx.doi.org/10.1787/830146
OECD SCIENCE, TECHNOLOGY AND INDUSTRY OUTLOOK 2006 – ISBN 92-64-02848-X – © OECD 2006 213

STATISTICAL ANNEX
p
a
d
c,p
g
p
a
m
315388
1995 1999 2000 2001 2002 2003 2004
Australia .. .. 7.3 .. 7.8 .. ..
Austria .. .. .. .. 5.8 .. ..
Belgium 6.0 7.4 7.5 7.8 7.4 7.5 7.7
Canada 6.4 6.7 7.1 7.5 c,p 7.2 c,p .. ..
Czech Republic 2.3 2.8 2.9 3.1 3.0 3.3 3.4
Denmark 6.1 u 6.9 u .. 7.0 u 9.2 a 9.0 9.5
Finland 8.2 u 14.5 u 15.1 u 15.8 u 16.4 u 17.7 u 17.3
France 6.7 6.8 7.1 a 7.2 7.5 7.7 ..
Germany 6.1 6.6 6.6 c 6.7 6.8 c 6.9 ..
Greece 2.5 a 3.7 .. 3.7 .. 3.9 ..
Hungary 2.9 d 3.3 d 3.7 d 3.8 d 3.9 d 3.9 d 3.8
Iceland .. .. .. .. .. .. ..
Ireland 4.5 c 4.9 c 5.0 c 5.1 5.3 c 5.5 5.8
Italy 3.5 2.9 2.9 2.9 3.0 2.9 ..
Japan 10.1 l 9.9 9.7 10.2 9.9 a 10.4 10.4
Korea 4.9 g 4.9 g 5.1 g 6.3 g 6.4 g 6.8 g 6.9
Luxembourg .. .. 6.2 .. .. 6.6 7.1
Mexico 0.6 0.6 c .. .. .. 0.8 ..
Netherlands 4.9 5.1 5.2 5.5 4.6 a 4.5 ..
New Zealand 4.7 6.2 .. 9.1 a .. 10.2 ..
Norway 7.5 a,u 8.0 u .. 8.7 .. 9.2 ..
Poland 3.2 3.6 3.5 3.7 3.8 4.5 4.6
Portugal 2.6 u 3.3 3.4 c 3.5 3.8 c 4.0 ..
Slovak Republic 4.6 d 4.5 4.9 4.7 4.5 4.7 5.2
Spain 3.5 3.9 4.7 4.7 4.8 5.2 5.5
Sweden 8.2 9.6 .. 10.6 .. 11.0 ..
Switzerland .. .. 6.4 .. .. .. 6.1
Turkey 0.8 0.9 1.1 1.1 1.1 .. ..
United Kingdom 5.3 .. .. .. .. .. ..
United States 8.1 9.3 9.3 b 9.5 b 9.6 b .. ..
EU-25 4.9 b 5.3 b 5.4 b 5.6 b 5.7 b 5.9 b ..
Total OECD 5.8 a,b 6.5 b 6.6 b 6.8 b 6.9 b .. ..
Argentina .. 2.2 2.3 2.3 2.2 2.2 2.2
China 0.8 m 0.7 m 1.0 a 1.0 1.1 1.2 1.2
Israel .. .. .. .. .. .. ..
Romania 2.9 2.1 1.9 1.8 2.1 2.2 2.3
Russian Federation 9.2 7.8 7.8 7.9 7.5 7.4 7.1
Singapore 4.5 6.7 7.9 8.2 9.0 9.9 10.3
Slovenia 5.6 5.0 4.9 4.9 5.0 4.2 4.3
South Africa .. .. .. 1.3 .. 1.2 ..
Chinese Taipei .. 5.8 d,m 5.8 d,m 6.4 d,m 6.8 a,m 7.1 m 7.4
Source: OECD, Main Science and Technology Indicators, June 2006.
Table 7. Total researchers
Per thousand total employment
StatLink: http://dx.doi.org/10.1787/063643
OECD SCIENCE, TECHNOLOGY AND INDUSTRY OUTLOOK 2006 – ISBN 92-64-02848-X – © OECD 2006214

STATISTICAL ANNEX
c
b,p
851688
1995 2000 2001 2002 2003 2004 2005
Australia .. 0.70 .. 0.80 .. .. ..
Austria 0.70 c 0.80 c 0.85 c 0.95 1.00 c 1.03 c 1.07
Belgium 1.12 1.23 1.32 1.15 1.14 .. ..
Canada 0.79 0.87 1.07 1.05 0.99 0.95 p 0.92
Czech Republic 0.60 0.63 0.64 0.66 0.65 0.67 ..
Denmark 0.82 .. 1.47 .. 1.53 .. ..
Finland 1.34 2.37 2.40 2.38 2.44 2.43 ..
France 1.10 1.13 a 1.19 1.16 1.11 .. ..
Germany 1.31 1.62 c 1.62 1.63 c 1.67 1.67 c ..
Greece 0.12 .. 0.21 .. 0.19 .. ..
Hungary 0.28 v 0.30 v 0.33 v 0.30 v 0.29 v 0.33 v ..
Iceland 0.54 .. 1.40 .. 1.28 .. ..
Ireland 0.85 c,s 0.74 c 0.73 c 0.70 c 0.69 c 0.69 c,p ..
Italy 0.41 .. .. .. .. .. ..
Japan 1.95 l 2.17 2.24 2.31 2.35 2.34 ..
Korea 1.81 g 1.73 g 1.88 g 1.83 g 1.95 g 2.14 g ..
Luxembourg .. 1.55 .. .. 1.43 .. ..
Mexico 0.05 0.11 0.12 0.15 0.15 .. ..
Netherlands 0.88 0.93 0.94 0.86 0.90 .. ..
New Zealand 0.32 .. 0.43 a,o .. 0.44 .. ..
Norway 0.85 a .. 0.83 .. 0.85 .. ..
Poland 0.23 0.20 0.18 0.14 0.15 0.16 ..
Portugal 0.11 0.22 c 0.27 0.25 c 0.25 .. ..
Slovak Republic 0.56 0.35 0.36 0.31 0.26 0.20 ..
Spain 0.35 0.45 0.43 0.48 0.51 0.51 ..
Sweden 2.17 m .. 3.04 m .. 2.56 m .. ..
Switzerland .. 1.77 .. .. .. 2.05 ..
Turkey 0.12 0.28 0.32 0.27 .. .. ..
United Kingdom 0.94 0.90 0.88 0.87 0.83 .. ..
United States 1.51 j,o 1.91 j,o 1.87 j,o 1.73 j,o 1.71 j,o,p 1.70 j,o,p ..
EU-25 0.88 b 0.98 b 1.00 b 0.98 b 0.97 b .. ..
Total OECD 1.23 a,b 1.43 b 1.45 b 1.40 b 1.40 b 1.40 b,p ..
Argentina .. 0.10 c 0.09 c 0.09 0.11 0.13 ..
China .. 0.52 v .. .. 0.68 v 0.81 v ..
Israel 1.24 d 3.12 d 3.16 d 3.10 d .. .. ..
Romania 0.31 a 0.18 0.19 0.16 0.18 0.17 ..
Russian Federation 0.29 0.35 0.40 0.41 0.39 0.36 ..
Singapore 0.67 1.04 1.14 1.07 1.10 1.22 ..
Slovenia 0.72 0.76 0.85 0.91 0.69 0.85 ..
South Africa .. .. 0.41 .. 0.44 .. ..
Chinese Taipei .. 1.34 1.41 1.46 1.54 1.65 ..
Source: OECD, Main Science and Technology Indicators, June 2006.
Table 8. Industry-financed GERD
As a percentage of GDP
StatLink: http://dx.doi.org/10.1787//687847
OECD SCIENCE, TECHNOLOGY AND INDUSTRY OUTLOOK 2006 – ISBN 92-64-02848-X – © OECD 2006 215

STATISTICAL ANNEX
5
..
5 c
..
7 b,p
..
..
..
..
..
..
..
..
..
..
..
..
..
..
..
..
..
..
..
..
..
..
..
..
..
..
..
..
..
..
..
..
..
..
..
..
..
446138
1995 2000 2001 2002 2003 2004 200
Australia .. 0.69 .. 0.69 .. ..
Austria 0.72 c 0.73 c 0.78 c 0.71 0.76 c 0.79 c 0.8
Belgium 0.39 0.45 0.46 0.45 0.44 ..
Canada 0.62 c 0.57 c 0.62 c 0.65 c 0.65 c 0.67 c,p 0.6
Czech Republic 0.31 a,m 0.55 0.53 0.51 0.53 0.53
Denmark 0.72 .. 0.67 .. 0.69 ..
Finland 0.79 0.89 0.86 0.90 0.90 0.92
France 0.96 0.83 a 0.81 0.85 0.85 ..
Germany 0.83 0.77 c 0.77 0.79 c 0.79 0.76 c
Greece 0.26 a .. 0.30 .. 0.29 ..
Hungary 0.39 d,v 0.39 d,v 0.50 d,v 0.59 d,v 0.55 d,v 0.46 d,v
Iceland 0.90 .. 1.03 .. 1.17 ..
Ireland 0.28 c,s 0.26 c 0.28 c 0.31 c 0.35 c 0.39 c,p
Italy 0.52 .. .. .. .. ..
Japan 0.66 e,l 0.59 e 0.58 e 0.57 e 0.57 e 0.57 e
Korea 0.45 g 0.57 g 0.65 g 0.64 g 0.63 g 0.66 g
Luxembourg .. 0.13 .. .. 0.20 ..
Mexico 0.20 0.24 0.23 0.24 0.24 ..
Netherlands 0.80 0.62 0.65 0.64 0.64 ..
New Zealand 0.50 .. 0.53 a,o .. 0.52 ..
Norway 0.75 .. 0.64 .. 0.73 ..
Poland 0.39 a 0.44 0.43 0.39 0.37 0.38
Portugal 0.37 a 0.52 c 0.52 0.48 c 0.47 ..
Slovak Republic 0.35 d 0.28 m 0.26 m 0.25 m 0.30 m 0.30 m
Spain 0.35 a 0.35 0.37 0.39 0.42 0.44
Sweden 0.96 a,m .. 0.90 m .. 0.93 m ..
Switzerland .. 0.60 .. .. .. 0.67
Turkey 0.24 0.32 0.35 0.34 .. ..
United Kingdom 0.64 0.56 0.54 0.53 0.59 ..
United States 0.89 j 0.71 j 0.75 j 0.77 j 0.82 j,p 0.83 j,p
EU-25 0.67 b 0.62 b 0.63 b 0.63 b 0.63 b ..
Total OECD 0.70 a,b 0.63 b 0.65 b 0.66 b 0.68 b ..
Argentina .. 0.31 c 0.32 c 0.27 0.28 0.28
China .. 0.30 v .. .. 0.34 v 0.33 v
Israel 0.94 d 1.09 d 1.06 d 1.12 d .. ..
Romania 0.46 a 0.15 0.17 0.18 0.18 0.19
Russian Federation 0.52 0.58 0.67 0.73 0.76 0.70
Singapore 0.37 0.76 0.80 0.90 0.88 0.82
Slovenia 0.64 0.57 0.57 0.54 0.49 0.44
South Africa .. .. 0.27 .. 0.27 ..
Chinese Taipei .. 0.69 d 0.72 d 0.81 a 0.87 0.87
Source: OECD, Main Science and Technology Indicators, June 2006.
Table 9. Government-financed GERD
As a percentage of GDP
StatLink: http://dx.doi.org/10.1787/840052
OECD SCIENCE, TECHNOLOGY AND INDUSTRY OUTLOOK 2006 – ISBN 92-64-02848-X – © OECD 2006216
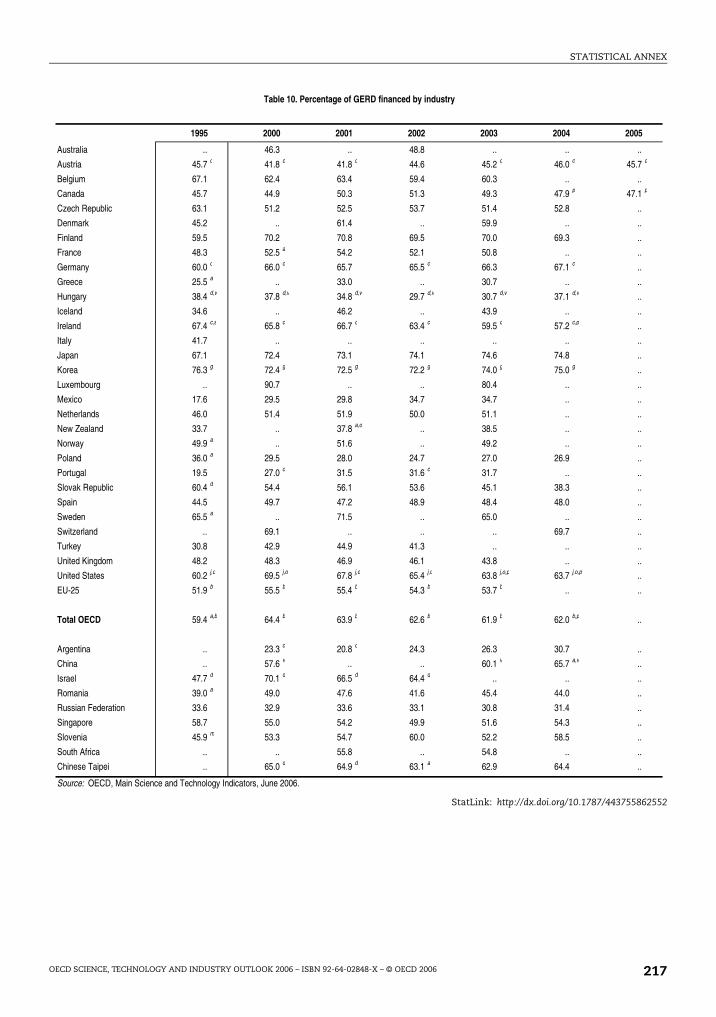
STATISTICAL ANNEX
5
..
.7 c
..
.1 p
..
..
..
..
..
..
..
..
..
..
..
..
..
..
..
..
..
..
..
..
..
..
..
..
..
..
..
..
..
..
..
..
..
..
..
..
..
862552
1995 2000 2001 2002 2003 2004 200
Australia .. 46.3 .. 48.8 .. ..
Austria 45.7 c 41.8 c 41.8 c 44.6 45.2 c 46.0 c 45
Belgium 67.1 62.4 63.4 59.4 60.3 ..
Canada 45.7 44.9 50.3 51.3 49.3 47.9 p 47
Czech Republic 63.1 51.2 52.5 53.7 51.4 52.8
Denmark 45.2 .. 61.4 .. 59.9 ..
Finland 59.5 70.2 70.8 69.5 70.0 69.3
France 48.3 52.5 a 54.2 52.1 50.8 ..
Germany 60.0 c 66.0 c 65.7 65.5 c 66.3 67.1 c
Greece 25.5 a .. 33.0 .. 30.7 ..
Hungary 38.4 d,v 37.8 d,v 34.8 d,v 29.7 d,v 30.7 d,v 37.1 d,v
Iceland 34.6 .. 46.2 .. 43.9 ..
Ireland 67.4 c,s 65.8 c 66.7 c 63.4 c 59.5 c 57.2 c,p
Italy 41.7 .. .. .. .. ..
Japan 67.1 72.4 73.1 74.1 74.6 74.8
Korea 76.3 g 72.4 g 72.5 g 72.2 g 74.0 g 75.0 g
Luxembourg .. 90.7 .. .. 80.4 ..
Mexico 17.6 29.5 29.8 34.7 34.7 ..
Netherlands 46.0 51.4 51.9 50.0 51.1 ..
New Zealand 33.7 .. 37.8 a,o .. 38.5 ..
Norway 49.9 a .. 51.6 .. 49.2 ..
Poland 36.0 a 29.5 28.0 24.7 27.0 26.9
Portugal 19.5 27.0 c 31.5 31.6 c 31.7 ..
Slovak Republic 60.4 d 54.4 56.1 53.6 45.1 38.3
Spain 44.5 49.7 47.2 48.9 48.4 48.0
Sweden 65.5 a .. 71.5 .. 65.0 ..
Switzerland .. 69.1 .. .. .. 69.7
Turkey 30.8 42.9 44.9 41.3 .. ..
United Kingdom 48.2 48.3 46.9 46.1 43.8 ..
United States 60.2 j,o 69.5 j,o 67.8 j,o 65.4 j,o 63.8 j,o,p 63.7 j,o,p
EU-25 51.9 b 55.5 b 55.4 b 54.3 b 53.7 b ..
Total OECD 59.4 a,b 64.4 b 63.9 b 62.6 b 61.9 b 62.0 b,p
Argentina .. 23.3 c 20.8 c 24.3 26.3 30.7
China .. 57.6 v .. .. 60.1 v 65.7 a,v
Israel 47.7 d 70.1 d 66.5 d 64.4 d .. ..
Romania 39.0 a 49.0 47.6 41.6 45.4 44.0
Russian Federation 33.6 32.9 33.6 33.1 30.8 31.4
Singapore 58.7 55.0 54.2 49.9 51.6 54.3
Slovenia 45.9 m 53.3 54.7 60.0 52.2 58.5
South Africa .. .. 55.8 .. 54.8 ..
Chinese Taipei .. 65.0 d 64.9 d 63.1 a 62.9 64.4
Source: OECD, Main Science and Technology Indicators, June 2006.
Table 10. Percentage of GERD financed by industry
StatLink: http://dx.doi.org/10.1787/443755
OECD SCIENCE, TECHNOLOGY AND INDUSTRY OUTLOOK 2006 – ISBN 92-64-02848-X – © OECD 2006 217

STATISTICAL ANNEX
5
..
.4 c
..
.1 c,p
..
..
..
..
..
..
..
..
..
..
..
..
..
..
..
..
..
..
..
..
..
..
..
..
..
..
..
..
..
..
..
..
..
..
..
..
..
626553
1995 2000 2001 2002 2003 2004 200
Australia .. 45.5 .. 42.4 .. ..
Austria 46.9 c 38.0 c 38.3 c 33.6 34.6 c 35.3 c 36
Belgium 23.1 22.9 22.0 23.2 23.5 ..
Canada 35.9 c 29.3 c 29.2 c 31.8 c 32.4 c 33.6 c,p 34
Czech Republic 32.3 m 44.5 43.6 42.1 41.8 41.9
Denmark 39.6 .. 28.2 .. 27.1 ..
Finland 35.1 26.2 25.5 26.1 25.7 26.3
France 41.9 38.7 a 36.9 38.3 39.0 ..
Germany 37.9 c 31.4 c 31.4 31.6 c 31.2 30.4 c
Greece 54.0 a .. 46.6 .. 47.4 ..
Hungary 53.1 d,v 49.5 d,v 53.6 d,v 58.5 d,v 58.0 d,v 51.8 d,v
Iceland 57.3 .. 34.0 .. 40.1 ..
Ireland 22.5 c,s 23.4 c 25.6 c 28.0 c 30.4 c 32.2 c,p
Italy 53.0 .. .. .. .. ..
Japan 22.8 e 19.6 e 19.0 e 18.4 e 18.0 e 18.1 e
Korea 19.0 g 23.9 g 25.0 g 25.4 g 23.9 g 23.1 g
Luxembourg .. 7.7 .. .. 11.2 ..
Mexico 66.2 63.0 59.1 55.5 56.1 ..
Netherlands 42.2 34.2 35.8 37.1 36.2 ..
New Zealand 52.3 .. 47.1 a,o .. 45.1 ..
Norway 44.0 a .. 39.8 .. 41.9 ..
Poland 60.2 a 66.5 67.5 67.3 66.0 65.2
Portugal 65.3 a 64.8 c 61.0 60.5 c 60.1 ..
Slovak Republic 37.8 d 42.6 m 41.3 m 44.1 m 50.8 m 57.1 m
Spain 43.6 a 38.6 39.9 39.1 40.1 41.0
Sweden 28.8 a .. 21.3 .. 23.5 ..
Switzerland .. 23.2 .. .. .. 22.7
Turkey 62.4 50.6 48.0 50.6 .. ..
United Kingdom 32.8 30.2 29.1 27.8 31.4 ..
United States 35.4 j 25.8 j 27.3 j 29.2 j 30.8 j,p 31.0 j,p
EU-25 39.5 b 35.2 b 34.8 b 34.9 b 35.0 b ..
Total OECD 34.0 a,b 28.3 b 28.7 b 29.6 b 30.2 b ..
Argentina .. 70.7 c 74.3 c 70.2 68.9 64.5
China .. 33.4 v .. .. 29.9 v 26.6 a,v
Israel 35.9 d 24.4 d 22.4 d 23.3 d .. ..
Romania 57.4 a 40.8 43.0 48.4 47.6 49.0
Russian Federation 61.5 54.8 57.2 58.4 59.6 60.6
Singapore 32.5 40.3 38.1 41.8 41.6 36.6
Slovenia 40.6 m 40.0 37.1 35.6 37.5 30.0
South Africa .. .. 36.4 .. 34.1 ..
Chinese Taipei .. 33.4 d 33.3 d 35.2 a 35.5 33.9
Source: OECD, Main Science and Technology Indicators, June 2006.
Table 11. Percentage of GERD financed by government
StatLink: http://dx.doi.org/10.1787/567674
OECD SCIENCE, TECHNOLOGY AND INDUSTRY OUTLOOK 2006 – ISBN 92-64-02848-X – © OECD 2006218

STATISTICAL ANNEX
5
..
3 c
..
7 c,p
..
..
..
..
..
..
..
..
..
..
..
..
..
..
..
..
..
..
..
..
..
..
..
..
..
..
..
..
..
..
..
..
..
..
..
..
..
242862
1995 2000 2001 2002 2003 2004 200
Australia .. 4.7 .. 4.7 .. ..
Austria 0.4 c 0.3 c 0.3 c 0.4 0.4 c 0.4 c 0.
Belgium 2.3 2.4 2.5 3.1 3.2 ..
Canada 6.9 c 8.4 c 7.9 c 8.8 c 9.7 c 10.1 c,p 10.
Czech Republic 1.3 l 1.1 1.7 1.5 2.2 1.6
Denmark 4.2 .. 2.6 .. 2.7 ..
Finland 1.0 0.9 1.2 1.2 1.1 1.2
France 1.7 1.6 a 1.7 1.6 1.8 ..
Germany 0.3 c 0.4 c 0.4 0.5 c 0.3 0.3 c
Greece 2.5 a .. 2.0 .. 3.8 ..
Hungary 0.5 d,v 0.3 d,v 0.4 d,v 0.3 d,v 0.4 d,v 0.6 d,v
Iceland 3.7 .. 1.6 .. 1.5 ..
Ireland 1.9 c,s 1.9 c 1.7 c 1.5 c 1.6 c 1.7 c,p
Italy .. .. .. .. .. ..
Japan 9.9 e 7.6 e 7.5 a,e 7.2 e 7.0 e 6.8 e
Korea 4.7 g 3.6 g 2.1 g 2.0 g 1.7 g 1.4 g
Luxembourg .. .. .. .. 0.2 ..
Mexico 9.5 6.5 9.8 9.1 8.4 ..
Netherlands 2.6 2.8 1.3 a 1.3 1.4 ..
New Zealand 10.1 .. 10.0 a,o .. 9.6 ..
Norway 1.2 a .. 1.4 .. 1.5 ..
Poland 2.1 a 2.1 2.0 3.2 2.4 2.7
Portugal 3.3 3.0 c 2.4 2.8 c 3.2 ..
Slovak Republic 0.1 d 0.7 0.8 0.3 0.7 0.3
Spain 5.2 a 6.8 5.3 5.2 5.8 4.8
Sweden 2.2 a .. 3.8 .. 4.3 ..
Switzerland .. 3.4 .. .. .. 2.3
Turkey 4.8 5.2 6.3 6.9 .. ..
United Kingdom 4.5 5.5 5.7 5.8 5.4 ..
United States 4.4 j 4.6 j 4.9 j 5.4 j 5.4 j,p 5.4 j,p
EU-25 1.8 b 2.2 b 2.2 b 2.2 b 2.4 b ..
Total OECD 4.0 a,b 4.5 b 4.5 b 4.7 b 4.7 b ..
Argentina .. 4.4 c 3.7 c 4.3 3.5 3.7
China .. .. .. .. .. ..
Israel 12.0 d 2.7 d 8.2 d 8.9 d .. ..
Romania 0.5 a 5.4 1.2 3.0 1.5 1.5
Russian Federation 0.3 0.4 0.5 0.4 0.6 0.4
Singapore 4.8 0.7 1.0 1.2 0.6 2.3
Slovenia 10.6 m 0.4 1.1 0.7 0.5 0.4
South Africa .. .. 1.7 .. 0.3 ..
Chinese Taipei .. 1.6 d 1.8 d 1.6 a 1.5 1.6
Source: OECD, Main Science and Technology Indicators, June 2006.
Table 12. Percentage of GERD financed by other national sources
StatLink: http://dx.doi.org/10.1787/432808
OECD SCIENCE, TECHNOLOGY AND INDUSTRY OUTLOOK 2006 – ISBN 92-64-02848-X – © OECD 2006 219
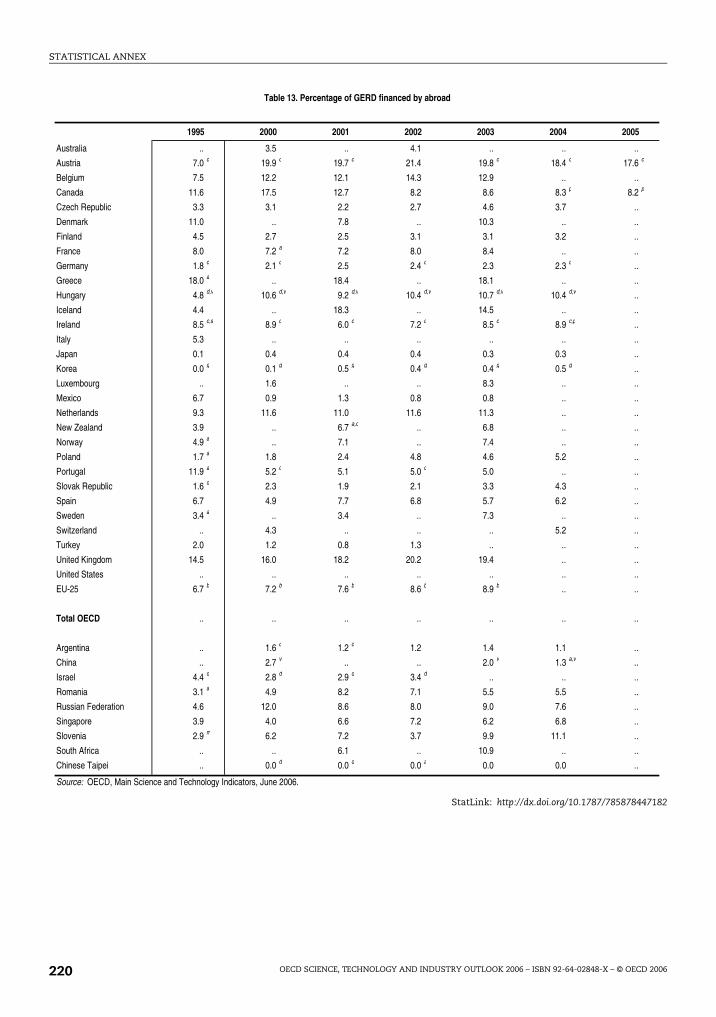
STATISTICAL ANNEX
5
.c
.p
.
.
.
.
.
.
.
.
.
.
.
.
.
.
.
.
.
.
.
.
.
.
.
.
.
.
.
.
.
.
.
.
.
.
.
.
.
447182
1995 2000 2001 2002 2003 2004 200
Australia .. 3.5 .. 4.1 .. .. .
Austria 7.0 c 19.9 c 19.7 c 21.4 19.8 c 18.4 c 17.6
Belgium 7.5 12.2 12.1 14.3 12.9 .. .
Canada 11.6 17.5 12.7 8.2 8.6 8.3 p 8.2
Czech Republic 3.3 3.1 2.2 2.7 4.6 3.7 .
Denmark 11.0 .. 7.8 .. 10.3 .. .
Finland 4.5 2.7 2.5 3.1 3.1 3.2 .
France 8.0 7.2 a 7.2 8.0 8.4 .. .
Germany 1.8 c 2.1 c 2.5 2.4 c 2.3 2.3 c .
Greece 18.0 a .. 18.4 .. 18.1 .. .
Hungary 4.8 d,v 10.6 d,v 9.2 d,v 10.4 d,v 10.7 d,v 10.4 d,v .
Iceland 4.4 .. 18.3 .. 14.5 .. .
Ireland 8.5 c,s 8.9 c 6.0 c 7.2 c 8.5 c 8.9 c,p .
Italy 5.3 .. .. .. .. .. .
Japan 0.1 0.4 0.4 0.4 0.3 0.3 .
Korea 0.0 g 0.1 g 0.5 g 0.4 g 0.4 g 0.5 g .
Luxembourg .. 1.6 .. .. 8.3 .. .
Mexico 6.7 0.9 1.3 0.8 0.8 .. .
Netherlands 9.3 11.6 11.0 11.6 11.3 .. .
New Zealand 3.9 .. 6.7 a,o .. 6.8 .. .
Norway 4.9 a .. 7.1 .. 7.4 .. .
Poland 1.7 a 1.8 2.4 4.8 4.6 5.2 .
Portugal 11.9 a 5.2 c 5.1 5.0 c 5.0 .. .
Slovak Republic 1.6 d 2.3 1.9 2.1 3.3 4.3 .
Spain 6.7 4.9 7.7 6.8 5.7 6.2 .
Sweden 3.4 a .. 3.4 .. 7.3 .. .
Switzerland .. 4.3 .. .. .. 5.2 .
Turkey 2.0 1.2 0.8 1.3 .. .. .
United Kingdom 14.5 16.0 18.2 20.2 19.4 .. .
United States .. .. .. .. .. .. .
EU-25 6.7 b 7.2 b 7.6 b 8.6 b 8.9 b .. .
Total OECD .. .. .. .. .. .. .
Argentina .. 1.6 c 1.2 c 1.2 1.4 1.1 .
China .. 2.7 v .. .. 2.0 v 1.3 a,v .
Israel 4.4 d 2.8 d 2.9 d 3.4 d .. .. .
Romania 3.1 a 4.9 8.2 7.1 5.5 5.5 .
Russian Federation 4.6 12.0 8.6 8.0 9.0 7.6 .
Singapore 3.9 4.0 6.6 7.2 6.2 6.8 .
Slovenia 2.9 m 6.2 7.2 3.7 9.9 11.1 .
South Africa .. .. 6.1 .. 10.9 .. .
Chinese Taipei .. 0.0 d 0.0 d 0.0 a 0.0 0.0 .
Source: OECD, Main Science and Technology Indicators, June 2006.
Table 13. Percentage of GERD financed by abroad
StatLink: http://dx.doi.org/10.1787/785878
OECD SCIENCE, TECHNOLOGY AND INDUSTRY OUTLOOK 2006 – ISBN 92-64-02848-X – © OECD 2006220
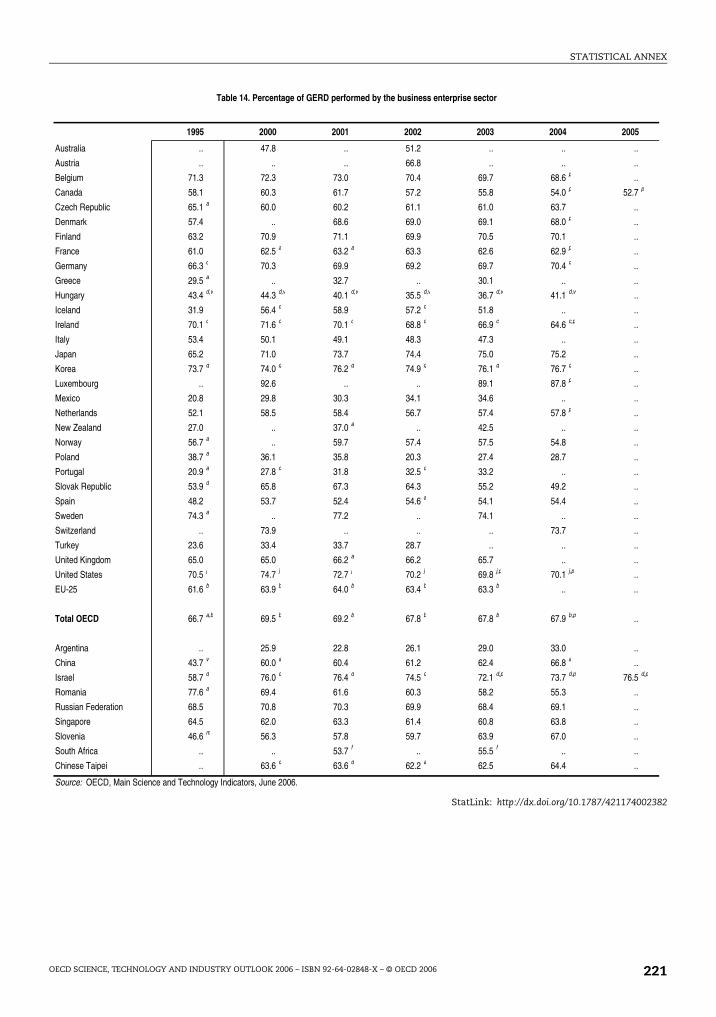
STATISTICAL ANNEX
5
.
.
.p
.
.
.
.
.
.
.
.
.
.
.
.
.
.
.
.
.
.
.
.
.
.
.
.
.
.
.
.
.
.d,p
.
.
.
.
.
.
002382
1995 2000 2001 2002 2003 2004 200
Australia .. 47.8 .. 51.2 .. .. .
Austria .. .. .. 66.8 .. .. .
Belgium 71.3 72.3 73.0 70.4 69.7 68.6 p .
Canada 58.1 60.3 61.7 57.2 55.8 54.0 p 52.7
Czech Republic 65.1 a 60.0 60.2 61.1 61.0 63.7 .
Denmark 57.4 .. 68.6 69.0 69.1 68.0 p .
Finland 63.2 70.9 71.1 69.9 70.5 70.1 .
France 61.0 62.5 a 63.2 a 63.3 62.6 62.9 p .
Germany 66.3 c 70.3 69.9 69.2 69.7 70.4 c .
Greece 29.5 a .. 32.7 .. 30.1 .. .
Hungary 43.4 d,v 44.3 d,v 40.1 d,v 35.5 d,v 36.7 d,v 41.1 d,v .
Iceland 31.9 56.4 c 58.9 57.2 c 51.8 .. .
Ireland 70.1 c 71.6 c 70.1 c 68.8 c 66.9 c 64.6 c,p .
Italy 53.4 50.1 49.1 48.3 47.3 .. .
Japan 65.2 71.0 73.7 74.4 75.0 75.2 .
Korea 73.7 g 74.0 g 76.2 g 74.9 g 76.1 g 76.7 g .
Luxembourg .. 92.6 .. .. 89.1 87.8 p .
Mexico 20.8 29.8 30.3 34.1 34.6 .. .
Netherlands 52.1 58.5 58.4 56.7 57.4 57.8 p .
New Zealand 27.0 .. 37.0 a .. 42.5 .. .
Norway 56.7 a .. 59.7 57.4 57.5 54.8 .
Poland 38.7 a 36.1 35.8 20.3 27.4 28.7 .
Portugal 20.9 a 27.8 c 31.8 32.5 c 33.2 .. .
Slovak Republic 53.9 d 65.8 67.3 64.3 55.2 49.2 .
Spain 48.2 53.7 52.4 54.6 a 54.1 54.4 .
Sweden 74.3 a .. 77.2 .. 74.1 .. .
Switzerland .. 73.9 .. .. .. 73.7 .
Turkey 23.6 33.4 33.7 28.7 .. .. .
United Kingdom 65.0 65.0 66.2 a 66.2 65.7 .. .
United States 70.5 j 74.7 j 72.7 j 70.2 j 69.8 j,p 70.1 j,p .
EU-25 61.6 b 63.9 b 64.0 b 63.4 b 63.3 b .. .
Total OECD 66.7 a,b 69.5 b 69.2 b 67.8 b 67.8 b 67.9 b,p .
Argentina .. 25.9 22.8 26.1 29.0 33.0 .
China 43.7 v 60.0 a 60.4 61.2 62.4 66.8 a .
Israel 58.7 d 76.0 d 76.4 d 74.5 d 72.1 d,p 73.7 d,p 76.5
Romania 77.6 a 69.4 61.6 60.3 58.2 55.3 .
Russian Federation 68.5 70.8 70.3 69.9 68.4 69.1 .
Singapore 64.5 62.0 63.3 61.4 60.8 63.8 .
Slovenia 46.6 m 56.3 57.8 59.7 63.9 67.0 .
South Africa .. .. 53.7 f .. 55.5 f .. .
Chinese Taipei .. 63.6 d 63.6 d 62.2 a 62.5 64.4 .
Source: OECD, Main Science and Technology Indicators, June 2006.
Table 14. Percentage of GERD performed by the business enterprise sector
StatLink: http://dx.doi.org/10.1787/421174
OECD SCIENCE, TECHNOLOGY AND INDUSTRY OUTLOOK 2006 – ISBN 92-64-02848-X – © OECD 2006 221

STATISTICAL ANNEX
5
..
..
..
.5 p
..
..
..
..
..
..
..
..
..
..
..
..
..
..
..
..
..
..
..
..
..
..
..
..
..
..
..
..
..
..
.4 d,g,p
..
..
..
..
..
..
347733
1995 2000 2001 2002 2003 2004 200
Australia .. 26.8 .. 26.7 .. ..
Austria .. .. .. 27.0 .. ..
Belgium 22.5 20.2 19.7 21.2 22.2 22.6 p
Canada 26.8 28.1 27.7 31.9 33.9 35.4 p 37
Czech Republic 8.5 a 14.2 15.7 15.6 15.3 14.8
Denmark 24.5 .. 18.9 23.1 a 23.2 24.4 p
Finland 19.5 17.8 18.1 19.2 19.2 19.8
France 16.7 18.8 a 18.9 18.9 19.4 19.1 p
Germany 18.2 c 16.1 16.4 17.0 16.9 16.3 c
Greece 44.3 a .. 44.9 .. 48.1 ..
Hungary 24.8 d,v 24.0 d,v 25.7 d,v 25.2 d,v 26.7 d,v 24.6 d,v
Iceland 27.5 16.2 c 18.8 16.1 c 21.3 ..
Ireland 20.4 c 20.2 c 21.8 c 22.4 c 25.2 c 27.6 c,p
Italy 25.5 31.0 32.6 32.8 33.9 ..
Japan 20.7 l 14.5 14.5 13.9 13.7 13.4
Korea 8.2 g 11.3 g 10.4 g 10.4 g 10.1 g 9.9 g
Luxembourg .. 0.2 .. .. 0.4 1.2 p
Mexico 45.8 28.3 30.4 39.5 37.9 ..
Netherlands 28.8 27.8 a 27.0 28.8 28.1 27.9 p
New Zealand 30.7 .. 30.8 a .. 28.5 ..
Norway 26.0 a .. 25.7 26.8 27.5 29.7
Poland 26.3 a 31.5 32.7 33.9 31.7 32.0
Portugal 37.0 a 37.5 c 36.7 37.5 c 38.4 ..
Slovak Republic 5.9 d 9.5 9.0 9.1 13.2 20.1
Spain 32.0 29.6 30.9 c 29.8 30.3 29.5
Sweden 21.9 a,j,l .. 19.8 l .. 22.0 l ..
Switzerland .. 22.9 .. .. .. 22.9
Turkey 69.0 60.4 58.9 64.3 .. ..
United Kingdom 19.2 20.6 21.7 22.3 21.4 ..
United States 12.3 j 11.5 j 12.1 j 13.5 j 13.7 j,p 13.6 j,p
EU-25 20.7 b 21.0 b 21.4 b 22.0 b 22.1 b ..
Total OECD 16.3 a,b 16.0 b 16.4 b 17.4 b 17.4 b 17.1 b,p
Argentina .. 33.5 35.0 33.9 27.4 25.0
China 12.1 l,v 8.6 a 9.8 10.1 10.5 10.2 a
Israel 25.6 d,g 15.0 d,g 14.7 d,g 16.3 d,g 18.0 d,g,p 16.8 d,g,p 15
Romania 2.6 a 11.8 11.3 15.6 9.4 10.1
Russian Federation 5.4 4.6 5.2 5.4 6.1 5.5
Singapore 27.4 a 23.9 23.6 25.4 26.5 25.4
Slovenia 27.6 16.6 16.3 15.6 13.7 12.9
South Africa .. .. 25.3 .. 20.5 ..
Chinese Taipei .. 12.2 d 12.5 d 12.3 a 12.0 11.6
Source: OECD, Main Science and Technology Indicators, June 2006.
Table 15. Percentage of GERD performed by the higher education sector
StatLink: http://dx.doi.org/10.1787/311440
OECD SCIENCE, TECHNOLOGY AND INDUSTRY OUTLOOK 2006 – ISBN 92-64-02848-X – © OECD 2006222

STATISTICAL ANNEX
005
..
..
..
9.5 p
..
..
..
..
..
..
..
..
..
..
..
..
..
..
..
..
..
..
..
..
..
..
..
..
..
..
..
..
..
..
4.5 d,p
..
..
..
..
..
..
718773
1995 2000 2001 2002 2003 2004 2
Australia .. 22.6 .. 19.3 .. ..
Austria .. .. .. 5.7 .. ..
Belgium 4.8 6.3 6.2 7.2 6.8 7.6 p
Canada 14.4 11.3 10.4 10.7 10.0 10.3 p
Czech Republic 26.4 a 25.3 23.7 23.0 23.3 21.2
Denmark 17.0 .. 11.8 7.4 a 7.0 6.9 p
Finland 16.6 10.6 10.2 10.4 9.7 9.5
France 21.0 17.3 a 16.5 16.5 16.7 16.7 p
Germany 15.5 c,o 13.6 o 13.7 o 13.7 o 13.4 o 13.2 c,o
Greece 25.5 a .. 22.1 .. 20.9 ..
Hungary 25.6 d,v 26.1 d,v 25.9 d,v 32.9 d,v 31.3 d,v 29.5 d,v
Iceland 37.4 25.5 c 20.1 24.5 c 24.8 ..
Ireland 9.0 c 8.1 c 8.1 c 8.7 c 7.9 c 7.8 c,p
Italy 21.1 18.9 18.4 17.6 17.5 ..
Japan 9.6 m 9.9 9.5 9.5 9.3 9.5
Korea 17.0 g 13.3 g 12.4 g 13.4 g 12.6 g 12.1 g
Luxembourg .. 7.1 .. .. 10.5 10.9 p
Mexico 33.0 41.7 39.1 25.1 26.2 ..
Netherlands 18.1 12.8 a 13.8 13.8 14.5 a 14.4 p
New Zealand 42.2 .. 32.2 a .. 28.9 ..
Norway 17.3 a .. 14.6 15.8 15.1 15.5
Poland 35.0 a 32.2 31.3 45.5 40.7 39.0
Portugal 27.0 23.9 c 20.8 18.8 c 16.9 ..
Slovak Republic 40.2 d 24.7 d 23.7 d 26.6 d 31.6 d 30.5 d
Spain 18.6 15.8 15.9 15.4 15.4 16.0
Sweden 3.7 a,h .. 2.8 h .. 3.5 h ..
Switzerland .. 1.3 a,h .. .. .. 1.1 h
Turkey 7.4 6.2 7.4 7.0 .. ..
United Kingdom 14.6 12.6 9.8 a 8.8 9.7 ..
United States 14.0 h 10.3 h 11.3 h 12.2 h 12.4 h,p 12.2 h,p
EU-25 16.8 b 14.2 b 13.6 b 13.5 b 13.4 b ..
Total OECD 14.5 a,b 11.8 b 11.9 b 12.2 b 12.2 b 12.5 b,p
Argentina .. 38.3 39.9 37.2 41.2 39.7
China 42.1 l,v 31.5 a 29.7 28.7 27.1 23.0 a
Israel 9.9 d 5.5 d 5.5 d 5.4 d 5.8 d,p 5.5 d,p
Romania 19.9 a 18.8 27.1 24.2 32.1 34.2
Russian Federation 26.1 24.4 24.3 24.5 25.3 25.3
Singapore 8.1 a 14.1 13.2 13.2 12.7 10.9
Slovenia 25.2 m 25.9 24.3 23.1 22.1 19.8
South Africa .. .. 20.0 .. 21.9 ..
Chinese Taipei .. 23.5 d 23.3 d 24.8 a 24.9 23.4
Source: OECD, Main Science and Technology Indicators, June 2006.
Table 16. Percentage of GERD performed by the government sector
StatLink: http://dx.doi.org/10.1787/631366
OECD SCIENCE, TECHNOLOGY AND INDUSTRY OUTLOOK 2006 – ISBN 92-64-02848-X – © OECD 2006 223
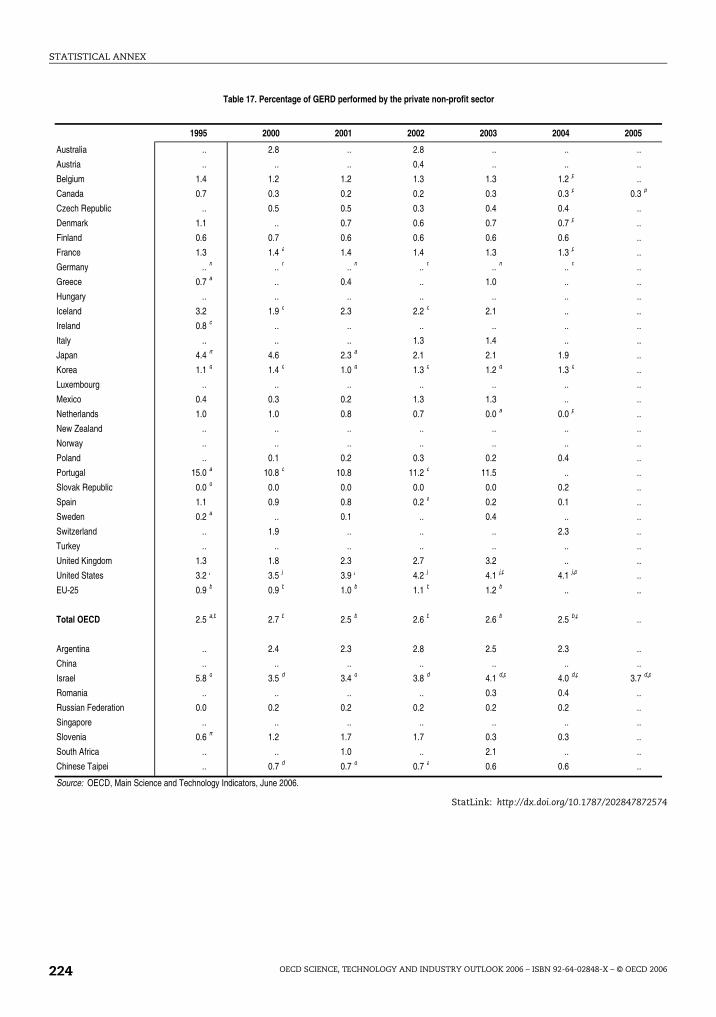
STATISTICAL ANNEX
5
..
..
..
.3 p
..
..
..
..
..
..
..
..
..
..
..
..
..
..
..
..
..
..
..
..
..
..
..
..
..
..
..
..
..
..
.7 d,p
..
..
..
..
..
..
872574
1995 2000 2001 2002 2003 2004 200
Australia .. 2.8 .. 2.8 .. ..
Austria .. .. .. 0.4 .. ..
Belgium 1.4 1.2 1.2 1.3 1.3 1.2 p
Canada 0.7 0.3 0.2 0.2 0.3 0.3 p 0
Czech Republic .. 0.5 0.5 0.3 0.4 0.4
Denmark 1.1 .. 0.7 0.6 0.7 0.7 p
Finland 0.6 0.7 0.6 0.6 0.6 0.6
France 1.3 1.4 a 1.4 1.4 1.3 1.3 p
Germany .. n .. n .. n .. n .. n .. n
Greece 0.7 a .. 0.4 .. 1.0 ..
Hungary .. .. .. .. .. ..
Iceland 3.2 1.9 c 2.3 2.2 c 2.1 ..
Ireland 0.8 c .. .. .. .. ..
Italy .. .. .. 1.3 1.4 ..
Japan 4.4 m 4.6 2.3 a 2.1 2.1 1.9
Korea 1.1 g 1.4 g 1.0 g 1.3 g 1.2 g 1.3 g
Luxembourg .. .. .. .. .. ..
Mexico 0.4 0.3 0.2 1.3 1.3 ..
Netherlands 1.0 1.0 0.8 0.7 0.0 a 0.0 p
New Zealand .. .. .. .. .. ..
Norway .. .. .. .. .. ..
Poland .. 0.1 0.2 0.3 0.2 0.4
Portugal 15.0 a 10.8 c 10.8 11.2 c 11.5 ..
Slovak Republic 0.0 d 0.0 0.0 0.0 0.0 0.2
Spain 1.1 0.9 0.8 0.2 a 0.2 0.1
Sweden 0.2 a .. 0.1 .. 0.4 ..
Switzerland .. 1.9 .. .. .. 2.3
Turkey .. .. .. .. .. ..
United Kingdom 1.3 1.8 2.3 2.7 3.2 ..
United States 3.2 j 3.5 j 3.9 j 4.2 j 4.1 j,p 4.1 j,p
EU-25 0.9 b 0.9 b 1.0 b 1.1 b 1.2 b ..
Total OECD 2.5 a,b 2.7 b 2.5 b 2.6 b 2.6 b 2.5 b,p
Argentina .. 2.4 2.3 2.8 2.5 2.3
China .. .. .. .. .. ..
Israel 5.8 d 3.5 d 3.4 d 3.8 d 4.1 d,p 4.0 d,p 3
Romania .. .. .. .. 0.3 0.4
Russian Federation 0.0 0.2 0.2 0.2 0.2 0.2
Singapore .. .. .. .. .. ..
Slovenia 0.6 m 1.2 1.7 1.7 0.3 0.3
South Africa .. .. 1.0 .. 2.1 ..
Chinese Taipei .. 0.7 d 0.7 d 0.7 a 0.6 0.6
Source: OECD, Main Science and Technology Indicators, June 2006.
Table 17. Percentage of GERD performed by the private non-profit sector
StatLink: http://dx.doi.org/10.1787/202847
OECD SCIENCE, TECHNOLOGY AND INDUSTRY OUTLOOK 2006 – ISBN 92-64-02848-X – © OECD 2006224
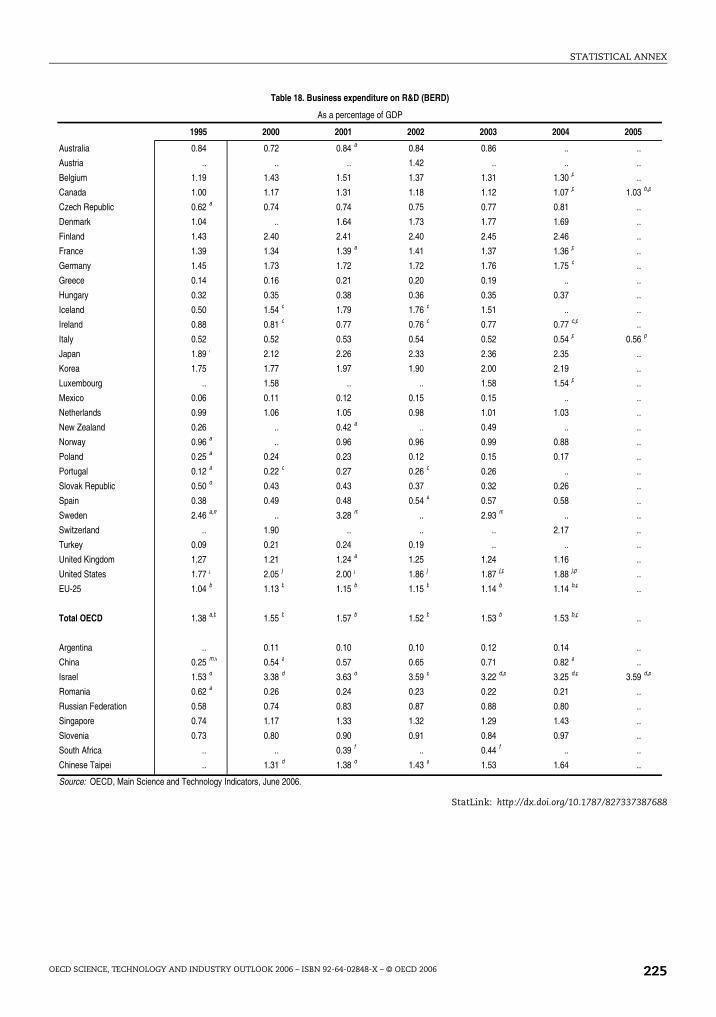
STATISTICAL ANNEX
5
..
..
..
3 b,p
..
..
..
..
..
..
..
..
..
6 p
..
..
..
..
..
..
..
..
..
..
..
..
..
..
..
..
..
..
..
..
9 d,p
..
..
..
..
..
..
387688
1995 2000 2001 2002 2003 2004 200
Australia 0.84 0.72 0.84 a 0.84 0.86 ..
Austria .. .. .. 1.42 .. ..
Belgium 1.19 1.43 1.51 1.37 1.31 1.30 p
Canada 1.00 1.17 1.31 1.18 1.12 1.07 p 1.0
Czech Republic 0.62 a 0.74 0.74 0.75 0.77 0.81
Denmark 1.04 .. 1.64 1.73 1.77 1.69
Finland 1.43 2.40 2.41 2.40 2.45 2.46
France 1.39 1.34 1.39 a 1.41 1.37 1.36 p
Germany 1.45 1.73 1.72 1.72 1.76 1.75 c
Greece 0.14 0.16 0.21 0.20 0.19 ..
Hungary 0.32 0.35 0.38 0.36 0.35 0.37
Iceland 0.50 1.54 c 1.79 1.76 c 1.51 ..
Ireland 0.88 0.81 c 0.77 0.76 c 0.77 0.77 c,p
Italy 0.52 0.52 0.53 0.54 0.52 0.54 p 0.5
Japan 1.89 l 2.12 2.26 2.33 2.36 2.35
Korea 1.75 1.77 1.97 1.90 2.00 2.19
Luxembourg .. 1.58 .. .. 1.58 1.54 p
Mexico 0.06 0.11 0.12 0.15 0.15 ..
Netherlands 0.99 1.06 1.05 0.98 1.01 1.03
New Zealand 0.26 .. 0.42 a .. 0.49 ..
Norway 0.96 a .. 0.96 0.96 0.99 0.88
Poland 0.25 a 0.24 0.23 0.12 0.15 0.17
Portugal 0.12 a 0.22 c 0.27 0.26 c 0.26 ..
Slovak Republic 0.50 d 0.43 0.43 0.37 0.32 0.26
Spain 0.38 0.49 0.48 0.54 a 0.57 0.58
Sweden 2.46 a,m .. 3.28 m .. 2.93 m ..
Switzerland .. 1.90 .. .. .. 2.17
Turkey 0.09 0.21 0.24 0.19 .. ..
United Kingdom 1.27 1.21 1.24 a 1.25 1.24 1.16
United States 1.77 j 2.05 j 2.00 j 1.86 j 1.87 j,p 1.88 j,p
EU-25 1.04 b 1.13 b 1.15 b 1.15 b 1.14 b 1.14 b,p
Total OECD 1.38 a,b 1.55 b 1.57 b 1.52 b 1.53 b 1.53 b,p
Argentina .. 0.11 0.10 0.10 0.12 0.14
China 0.25 m,v 0.54 a 0.57 0.65 0.71 0.82 a
Israel 1.53 d 3.38 d 3.63 d 3.59 d 3.22 d,p 3.25 d,p 3.5
Romania 0.62 a 0.26 0.24 0.23 0.22 0.21
Russian Federation 0.58 0.74 0.83 0.87 0.88 0.80
Singapore 0.74 1.17 1.33 1.32 1.29 1.43
Slovenia 0.73 0.80 0.90 0.91 0.84 0.97
South Africa .. .. 0.39 f .. 0.44 f ..
Chinese Taipei .. 1.31 d 1.38 d 1.43 a 1.53 1.64
Source: OECD, Main Science and Technology Indicators, June 2006.
Table 18. Business expenditure on R&D (BERD)
As a percentage of GDP
StatLink: http://dx.doi.org/10.1787/827337
OECD SCIENCE, TECHNOLOGY AND INDUSTRY OUTLOOK 2006 – ISBN 92-64-02848-X – © OECD 2006 225
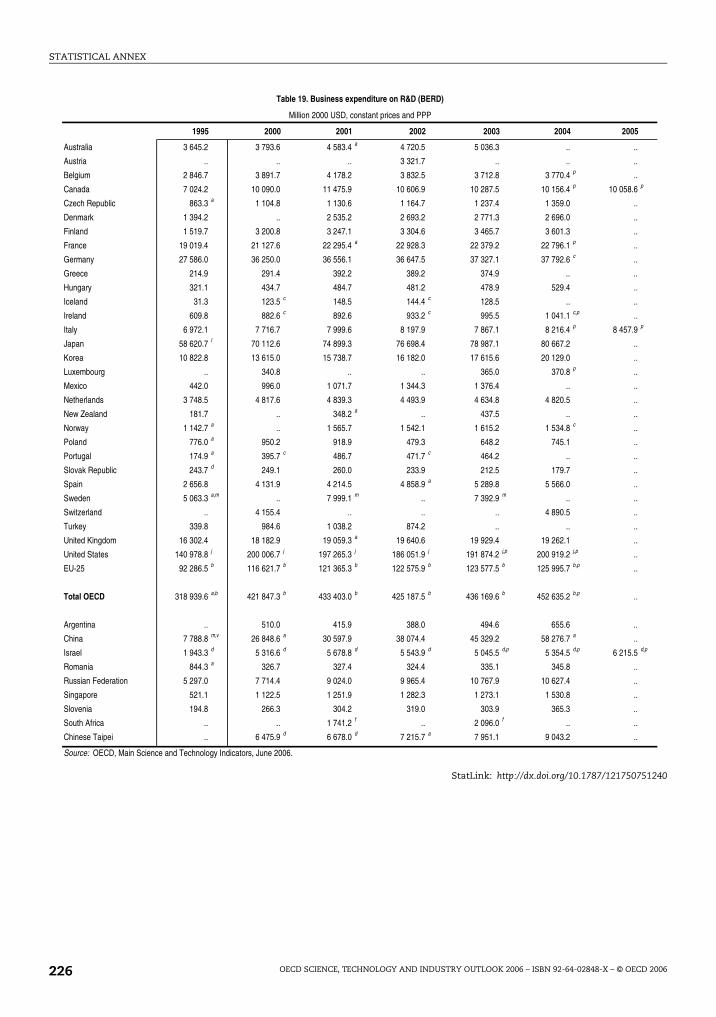
STATISTICAL ANNEX
.
.
.p
.
.
.
.
.
.
.
.
.p
.
.
.
.
.
.
.
.
.
.
.
.
.
.
.
.
.
.
.
.d,p
.
.
.
.
.
.
751240
1995 2000 2001 2002 2003 2004 2005
Australia 3 645.2 3 793.6 4 583.4 a 4 720.5 5 036.3 .. .
Austria .. .. .. 3 321.7 .. .. .
Belgium 2 846.7 3 891.7 4 178.2 3 832.5 3 712.8 3 770.4 p .
Canada 7 024.2 10 090.0 11 475.9 10 606.9 10 287.5 10 156.4 p 10 058.6
Czech Republic 863.3 a 1 104.8 1 130.6 1 164.7 1 237.4 1 359.0 .
Denmark 1 394.2 .. 2 535.2 2 693.2 2 771.3 2 696.0 .
Finland 1 519.7 3 200.8 3 247.1 3 304.6 3 465.7 3 601.3 .
France 19 019.4 21 127.6 22 295.4 a 22 928.3 22 379.2 22 796.1 p .
Germany 27 586.0 36 250.0 36 556.1 36 647.5 37 327.1 37 792.6 c .
Greece 214.9 291.4 392.2 389.2 374.9 .. .
Hungary 321.1 434.7 484.7 481.2 478.9 529.4 .
Iceland 31.3 123.5 c 148.5 144.4 c 128.5 .. .
Ireland 609.8 882.6 c 892.6 933.2 c 995.5 1 041.1 c,p .
Italy 6 972.1 7 716.7 7 999.6 8 197.9 7 867.1 8 216.4 p 8 457.9
Japan 58 620.7 l 70 112.6 74 899.3 76 698.4 78 987.1 80 667.2 .
Korea 10 822.8 13 615.0 15 738.7 16 182.0 17 615.6 20 129.0 .
Luxembourg .. 340.8 .. .. 365.0 370.8 p .
Mexico 442.0 996.0 1 071.7 1 344.3 1 376.4 .. .
Netherlands 3 748.5 4 817.6 4 839.3 4 493.9 4 634.8 4 820.5 .
New Zealand 181.7 .. 348.2 a .. 437.5 .. .
Norway 1 142.7 a .. 1 565.7 1 542.1 1 615.2 1 534.8 c .
Poland 776.0 a 950.2 918.9 479.3 648.2 745.1 .
Portugal 174.9 a 395.7 c 486.7 471.7 c 464.2 .. .
Slovak Republic 243.7 d 249.1 260.0 233.9 212.5 179.7 .
Spain 2 656.8 4 131.9 4 214.5 4 858.9 a 5 289.8 5 566.0 .
Sweden 5 063.3 a,m .. 7 999.1 m .. 7 392.9 m .. .
Switzerland .. 4 155.4 .. .. .. 4 890.5 .
Turkey 339.8 984.6 1 038.2 874.2 .. .. .
United Kingdom 16 302.4 18 182.9 19 059.3 a 19 640.6 19 929.4 19 262.1 .
United States 140 978.8 j 200 006.7 j 197 265.3 j 186 051.9 j 191 874.2 j,p 200 919.2 j,p .
EU-25 92 286.5 b 116 621.7 b 121 365.3 b 122 575.9 b 123 577.5 b 125 995.7 b,p .
Total OECD 318 939.6 a,b 421 847.3 b 433 403.0 b 425 187.5 b 436 169.6 b 452 635.2 b,p .
Argentina .. 510.0 415.9 388.0 494.6 655.6 .
China 7 788.8 m,v 26 848.6 a 30 597.9 38 074.4 45 329.2 58 276.7 a .
Israel 1 943.3 d 5 316.6 d 5 678.8 d 5 543.9 d 5 045.5 d,p 5 354.5 d,p 6 215.5
Romania 844.3 a 326.7 327.4 324.4 335.1 345.8 .
Russian Federation 5 297.0 7 714.4 9 024.0 9 965.4 10 767.9 10 627.4 .
Singapore 521.1 1 122.5 1 251.9 1 282.3 1 273.1 1 530.8 .
Slovenia 194.8 266.3 304.2 319.0 303.9 365.3 .
South Africa .. .. 1 741.2 f .. 2 096.0 f .. .
Chinese Taipei .. 6 475.9 d 6 678.0 d 7 215.7 a 7 951.1 9 043.2 .
Source: OECD, Main Science and Technology Indicators, June 2006.
Table 19. Business expenditure on R&D (BERD)
Million 2000 USD, constant prices and PPP
StatLink: http://dx.doi.org/10.1787/121750
OECD SCIENCE, TECHNOLOGY AND INDUSTRY OUTLOOK 2006 – ISBN 92-64-02848-X – © OECD 2006226
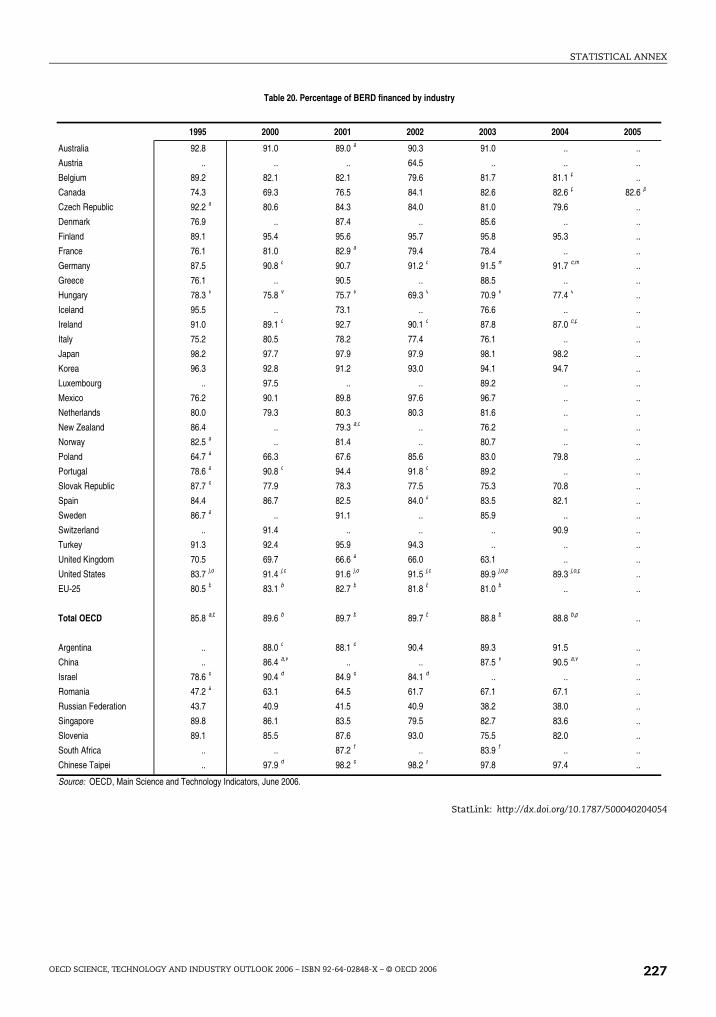
STATISTICAL ANNEX
5
..
..
..
6 p
..
..
..
..
..
..
..
..
..
..
..
..
..
..
..
..
..
..
..
..
..
..
..
..
..
..
..
..
..
..
..
..
..
..
..
..
..
204054
1995 2000 2001 2002 2003 2004 200
Australia 92.8 91.0 89.0 a 90.3 91.0 ..
Austria .. .. .. 64.5 .. ..
Belgium 89.2 82.1 82.1 79.6 81.7 81.1 p
Canada 74.3 69.3 76.5 84.1 82.6 82.6 p 82.
Czech Republic 92.2 a 80.6 84.3 84.0 81.0 79.6
Denmark 76.9 .. 87.4 .. 85.6 ..
Finland 89.1 95.4 95.6 95.7 95.8 95.3
France 76.1 81.0 82.9 a 79.4 78.4 ..
Germany 87.5 90.8 c 90.7 91.2 c 91.5 m 91.7 c,m
Greece 76.1 .. 90.5 .. 88.5 ..
Hungary 78.3 v 75.8 v 75.7 v 69.3 v 70.9 v 77.4 v
Iceland 95.5 .. 73.1 .. 76.6 ..
Ireland 91.0 89.1 c 92.7 90.1 c 87.8 87.0 c,p
Italy 75.2 80.5 78.2 77.4 76.1 ..
Japan 98.2 97.7 97.9 97.9 98.1 98.2
Korea 96.3 92.8 91.2 93.0 94.1 94.7
Luxembourg .. 97.5 .. .. 89.2 ..
Mexico 76.2 90.1 89.8 97.6 96.7 ..
Netherlands 80.0 79.3 80.3 80.3 81.6 ..
New Zealand 86.4 .. 79.3 a,o .. 76.2 ..
Norway 82.5 a .. 81.4 .. 80.7 ..
Poland 64.7 a 66.3 67.6 85.6 83.0 79.8
Portugal 78.6 a 90.8 c 94.4 91.8 c 89.2 ..
Slovak Republic 87.7 d 77.9 78.3 77.5 75.3 70.8
Spain 84.4 86.7 82.5 84.0 a 83.5 82.1
Sweden 86.7 a .. 91.1 .. 85.9 ..
Switzerland .. 91.4 .. .. .. 90.9
Turkey 91.3 92.4 95.9 94.3 .. ..
United Kingdom 70.5 69.7 66.6 a 66.0 63.1 ..
United States 83.7 j,o 91.4 j,o 91.6 j,o 91.5 j,o 89.9 j,o,p 89.3 j,o,p
EU-25 80.5 b 83.1 b 82.7 b 81.8 b 81.0 b ..
Total OECD 85.8 a,b 89.6 b 89.7 b 89.7 b 88.8 b 88.8 b,p
Argentina .. 88.0 c 88.1 c 90.4 89.3 91.5
China .. 86.4 a,v .. .. 87.5 v 90.5 a,v
Israel 78.6 d 90.4 d 84.9 d 84.1 d .. ..
Romania 47.2 a 63.1 64.5 61.7 67.1 67.1
Russian Federation 43.7 40.9 41.5 40.9 38.2 38.0
Singapore 89.8 86.1 83.5 79.5 82.7 83.6
Slovenia 89.1 85.5 87.6 93.0 75.5 82.0
South Africa .. .. 87.2 f .. 83.9 f ..
Chinese Taipei .. 97.9 d 98.2 d 98.2 a 97.8 97.4
Source: OECD, Main Science and Technology Indicators, June 2006.
Table 20. Percentage of BERD financed by industry
StatLink: http://dx.doi.org/10.1787/500040
OECD SCIENCE, TECHNOLOGY AND INDUSTRY OUTLOOK 2006 – ISBN 92-64-02848-X – © OECD 2006 227

STATISTICAL ANNEX
510333
1995 2000 2001 2002 2003 2004 2005
Australia 2.4 3.8 4.9 a 4.0 4.1 .. ..
Austria .. .. .. 5.6 .. .. ..
Belgium 4.3 5.8 5.9 5.4 5.4 5.8 p ..
Canada 6.2 2.3 3.6 2.4 2.5 2.5 p 2.5 p
Czech Republic 4.5 a 14.7 12.2 12.1 12.0 15.2 ..
Denmark 6.1 .. 3.1 .. 2.4 o .. ..
Finland 5.6 3.5 3.4 3.2 3.3 3.7 ..
France 12.7 9.9 8.4 a 10.3 11.1 .. ..
Germany 10.2 6.9 c 6.7 6.2 c 6.1 l 5.9 c,l ..
Greece 7.4 .. 1.2 .. 3.7 .. ..
Hungary 16.2 v 6.1 v 6.1 v 7.2 v 6.4 v 4.2 v ..
Iceland 3.3 .. 1.4 .. 3.9 .. ..
Ireland 4.9 3.3 c 2.8 2.9 c 3.0 3.0 c,p ..
Italy 16.7 11.0 14.9 12.2 14.1 .. ..
Japan 1.6 1.7 1.4 1.5 1.4 1.3 ..
Korea 3.6 7.0 8.1 6.4 5.3 4.7 ..
Luxembourg .. 1.6 .. .. 2.5 .. ..
Mexico 2.8 9.3 9.6 1.5 2.6 .. ..
Netherlands 6.6 5.2 5.2 4.3 3.4 .. ..
New Zealand 6.9 .. 9.0 a,o .. 10.0 .. ..
Norway 11.9 a .. 10.3 .. 10.4 .. ..
Poland 33.8 a 32.0 30.4 12.6 15.2 16.9 ..
Portugal 5.1 a 4.2 c 2.1 3.7 c 5.3 .. ..
Slovak Republic 10.8 d 20.6 20.6 21.1 22.1 27.0 ..
Spain 9.2 7.2 9.5 9.5 a 11.1 12.5 ..
Sweden 9.5 a .. 5.8 .. 5.9 .. ..
Switzerland .. 2.3 h .. .. .. 1.5 h ..
Turkey 1.7 4.3 3.3 2.9 .. .. ..
United Kingdom 10.5 8.8 8.9 a 6.7 10.9 .. ..
United States 16.3 8.6 8.4 8.5 10.1 p 10.7 p ..
EU-25 10.8 b 8.0 b 7.9 b 7.4 b 8.4 b .. ..
Total OECD 11.0 a,b 7.0 b 6.8 b 6.5 b 7.5 b 7.7 b,p ..
Argentina .. 8.7 c 8.7 c 6.4 8.4 6.9 ..
China .. 6.8 a,v .. .. 4.9 v 4.8 a,v ..
Israel 21.3 d 9.6 d 8.4 d 8.3 d .. .. ..
Romania 49.3 a 34.0 31.0 33.0 28.2 26.8 ..
Russian Federation 51.1 45.5 49.0 50.6 51.5 53.0 ..
Singapore 5.2 7.8 6.5 8.7 7.4 6.3 ..
Slovenia 8.0 7.0 5.0 5.1 12.8 4.5 ..
South Africa .. .. 9.6 f .. 6.4 f .. ..
Chinese Taipei .. 2.1 d 1.8 d 1.7 a 2.1 2.5 ..
Source: OECD, Main Science and Technology Indicators, June 2006.
Table 21. Percentage of BERD financed by government
StatLink: http://dx.doi.org/10.1787/152117
OECD SCIENCE, TECHNOLOGY AND INDUSTRY OUTLOOK 2006 – ISBN 92-64-02848-X – © OECD 2006228

STATISTICAL ANNEX
p
700087
1995 2000 2001 2002 2003 2004 2005
Australia 1.7 0.6 0.6 a 0.8 1.0 .. ..
Austria .. .. .. 0.0 .. .. ..
Belgium 0.4 0.0 0.0 0.0 0.0 0.0 p ..
Canada 0.0 0.0 0.0 0.0 0.0 0.0 p 0.0
Czech Republic 0.2 a 1.0 1.6 1.6 1.6 1.4 ..
Denmark 1.5 .. 0.3 .. 0.0 .. ..
Finland 0.0 0.1 0.3 0.1 0.1 0.0 ..
France 0.0 0.1 0.0 a 0.0 0.1 .. ..
Germany 0.1 0.2 c 0.2 0.2 c 0.1 0.1 c ..
Greece 0.0 .. 0.0 .. 0.1 .. ..
Hungary .. 0.0 v 0.1 v 0.1 v 0.3 v 0.1 v ..
Iceland 0.0 .. 0.2 .. 0.0 .. ..
Ireland 0.5 0.0 c 0.0 0.0 c 0.0 0.0 c,p ..
Italy .. 0.3 0.3 0.1 0.1 .. ..
Japan 0.1 0.1 0.2 a 0.1 0.1 0.1 ..
Korea 0.2 0.2 0.2 0.1 0.1 0.1 ..
Luxembourg .. .. .. .. .. .. ..
Mexico 0.4 0.1 0.0 0.4 0.6 .. ..
Netherlands 0.1 0.0 0.1 0.0 0.1 .. ..
New Zealand 1.0 .. 0.9 a,o .. 1.9 .. ..
Norway 0.1 a .. 0.0 .. 0.0 .. ..
Poland 0.2 a 0.1 0.2 0.4 0.3 0.1 ..
Portugal 0.3 a 0.0 c 0.0 0.0 c 0.0 .. ..
Slovak Republic 0.0 d 0.0 0.0 0.3 0.5 0.0 ..
Spain 0.1 2.3 0.3 0.5 a 0.2 0.3 ..
Sweden 0.1 a .. 0.1 .. 0.2 .. ..
Switzerland .. 0.5 .. .. .. 0.5 ..
Turkey 1.4 1.4 0.6 1.1 .. .. ..
United Kingdom 0.0 0.0 0.0 a 0.0 0.0 .. ..
United States .. n .. n .. n .. n .. n .. n ..
EU-25 0.1 b 0.2 b 0.2 b 0.1 b 0.1 b .. ..
Total OECD 0.1 a,b 0.1 b 0.1 b 0.1 b 0.1 b .. ..
Argentina .. 0.0 c 0.0 c 0.0 0.0 0.0 ..
China .. .. .. .. .. .. ..
Israel 0.1 d 0.0 d 6.7 d 7.6 d .. .. ..
Romania 0.1 a 0.6 0.5 0.4 0.3 0.2 ..
Russian Federation 0.0 0.1 0.3 0.1 0.2 0.1 ..
Singapore 0.0 0.1 0.1 0.5 0.1 1.7 ..
Slovenia 0.0 0.0 0.0 0.1 0.3 0.2 ..
South Africa .. .. 0.0 f .. 0.1 f .. ..
Chinese Taipei .. 0.1 d 0.0 d 0.0 a 0.1 0.0 ..
Source: OECD, Main Science and Technology Indicators, June 2006.
Table 22. Percentage of BERD financed by other national sources
StatLink: http://dx.doi.org/10.1787/656134
OECD SCIENCE, TECHNOLOGY AND INDUSTRY OUTLOOK 2006 – ISBN 92-64-02848-X – © OECD 2006 229

STATISTICAL ANNEX
p
880543
1995 2000 2001 2002 2003 2004 2005
Australia 3.0 4.7 5.5 a 4.9 3.9 .. ..
Austria .. .. .. 29.9 .. .. ..
Belgium 6.1 12.0 11.9 15.0 12.9 13.1 p ..
Canada 19.5 28.5 19.9 13.5 14.8 14.8 p 14.8
Czech Republic 3.1 a 3.6 1.9 2.3 5.5 3.8 ..
Denmark 15.5 .. 9.2 .. 12.0 .. ..
Finland 5.3 1.0 0.7 1.0 0.8 1.0 ..
France 11.1 9.0 8.7 a 10.2 10.4 .. ..
Germany 2.2 2.1 c 2.4 2.4 c 2.3 2.3 c ..
Greece 16.5 .. 8.3 .. 7.7 .. ..
Hungary 4.1 v 17.2 v 16.9 v 22.6 v 22.4 v 18.3 v ..
Iceland 1.2 .. 25.3 .. 19.5 .. ..
Ireland 3.8 7.6 c 4.6 7.1 c 9.2 10.0 c,p ..
Italy 8.1 8.2 6.6 10.3 9.6 .. ..
Japan 0.1 0.6 0.5 0.5 0.4 0.4 ..
Korea 0.0 0.0 0.6 0.5 0.5 0.5 ..
Luxembourg .. 0.9 .. .. 8.3 .. ..
Mexico 20.7 0.5 0.6 0.5 0.0 .. ..
Netherlands 13.2 15.4 14.4 15.4 15.0 .. ..
New Zealand 5.7 .. 11.8 a,o .. 11.9 .. ..
Norway 5.6 a .. 8.3 .. 8.9 .. ..
Poland 1.3 a 1.6 1.8 1.5 1.5 3.1 ..
Portugal 16.1 a 5.0 c 3.6 4.5 c 5.5 .. ..
Slovak Republic 1.6 d 1.6 1.1 1.2 2.1 2.1 ..
Spain 6.4 3.7 7.7 5.9 a 5.2 5.1 ..
Sweden 3.7 a,l .. 2.9 .. 8.1 .. ..
Switzerland .. 5.8 .. .. .. 7.1 ..
Turkey 5.6 1.9 0.2 1.6 .. .. ..
United Kingdom 19.1 21.5 24.4 a 27.2 26.0 .. ..
United States .. n .. n .. n .. n .. n .. n ..
EU-25 8.6 b 8.7 b 9.2 b 10.7 b 10.5 b .. ..
Total OECD .. .. .. .. .. .. ..
Argentina .. 3.3 c 3.3 c 3.2 2.3 1.6 ..
China .. 4.0 a,v .. .. 2.6 v 1.5 a,v ..
Israel 0.0 d 0.0 d .. .. .. .. ..
Romania 3.5 a 2.4 4.0 5.0 4.4 6.0 ..
Russian Federation 5.1 13.6 9.2 8.4 10.0 8.9 ..
Singapore 5.0 6.1 9.9 11.4 9.9 8.5 ..
Slovenia 2.8 7.5 7.4 1.8 11.4 13.2 ..
South Africa .. .. 3.2 f .. 9.6 f .. ..
Chinese Taipei .. 0.0 d 0.0 d 0.0 a 0.0 0.0 ..
Source: OECD, Main Science and Technology Indicators, June 2006.
Table 23. Percentage of BERD financed by abroad
StatLink: http://dx.doi.org/10.1787/141251
OECD SCIENCE, TECHNOLOGY AND INDUSTRY OUTLOOK 2006 – ISBN 92-64-02848-X – © OECD 2006230

STATISTICAL ANNEX
5
.
.
.b,p
.
.
.
.
.
.
.
.
.
.
.
.
.
.
.
.
.
.
.
.
.
.
.
.
.
.
.
.
.
.
g,p
.
.
.
.
.
.
181536
1995 2000 2001 2002 2003 2004 200
Australia 0.39 0.40 .. 0.44 .. .. .
Austria .. .. .. 0.57 .. .. .
Belgium 0.38 0.40 0.41 0.41 0.42 0.43 p .
Canada 0.46 0.55 0.59 0.66 0.68 0.70 p 0.73
Czech Republic 0.08 a 0.18 0.19 0.19 0.19 0.19 .
Denmark 0.45 0.45 0.45 0.58 a 0.59 0.61 .
Finland 0.44 0.60 0.61 0.66 0.67 0.69 .
France 0.38 0.40 a 0.42 0.42 0.42 0.41 p .
Germany 0.40 0.39 0.40 0.42 0.43 0.41 c .
Greece 0.22 a .. 0.29 .. 0.30 .. .
Hungary 0.18 0.19 0.24 0.26 0.25 0.22 .
Iceland 0.43 0.44 c 0.57 0.50 c 0.62 .. .
Ireland 0.26 c 0.23 0.24 c 0.25 0.29 c 0.33 .
Italy 0.25 0.32 0.35 0.37 0.37 .. .
Japan 0.60 l 0.43 0.44 0.43 0.43 0.42 .
Korea 0.19 g 0.27 g 0.27 g 0.26 g 0.27 g 0.28 g .
Luxembourg .. 0.00 0.01 .. 0.01 c 0.02 .
Mexico 0.14 0.11 0.12 0.17 0.16 .. .
Netherlands 0.55 0.51 a 0.49 0.50 0.49 0.50 p .
New Zealand 0.29 .. 0.35 .. 0.33 .. .
Norway 0.44 .. 0.41 0.45 0.48 0.48 .
Poland 0.17 0.21 0.21 0.20 0.18 0.19 .
Portugal 0.21 a 0.30 c 0.31 0.30 c 0.30 .. .
Slovak Republic 0.05 0.06 0.06 0.05 0.08 0.11 .
Spain 0.25 0.27 0.28 c 0.29 0.32 0.32 .
Sweden 0.73 a,j .. 0.84 .. 0.87 .. .
Switzerland .. 0.59 .. 0.64 .. 0.67 .
Turkey 0.26 0.39 0.43 0.43 .. .. .
United Kingdom 0.38 0.38 0.40 0.42 0.40 .. .
United States 0.31 j 0.31 j 0.33 j 0.36 j 0.37 j,p 0.36 j,p .
EU-25 0.35 b 0.37 b 0.39 b 0.40 b 0.40 b .. .
Total OECD 0.34 a,b 0.36 b 0.37 b 0.39 b 0.39 b 0.39 b,p .
Argentina .. 0.15 0.15 0.13 0.11 0.11 .
China 0.07 v 0.08 0.09 0.11 0.12 0.13 .
Israel 0.67 g 0.67 g 0.70 g 0.78 g 0.80 g,p 0.74 g,p 0.72
Romania 0.02 a 0.04 0.04 0.06 0.04 0.04 .
Russian Federation 0.05 0.05 0.06 0.07 0.08 0.06 .
Singapore 0.32 a 0.45 0.50 0.55 0.56 0.57 .
Slovenia 0.43 l 0.24 0.25 0.24 0.18 0.19 .
South Africa .. .. 0.19 .. 0.16 .. .
Chinese Taipei .. 0.25 0.27 0.28 0.29 0.30 .
Source: OECD, Main Science and Technology Indicators, June 2006.
Table 24. Higher education R&D (HERD)
As a percentage of GDP
StatLink: http://dx.doi.org/10.1787/825501
OECD SCIENCE, TECHNOLOGY AND INDUSTRY OUTLOOK 2006 – ISBN 92-64-02848-X – © OECD 2006 231

STATISTICAL ANNEX
5
..
..
..
4 p
..
..
..
..
..
..
..
..
..
..
..
..
..
..
..
..
..
..
..
..
..
..
..
..
..
..
..
..
..
..
..
..
..
..
..
..
..
075044
1995 2000 2001 2002 2003 2004 200
Australia 4.7 4.9 .. 5.1 .. ..
Austria .. .. .. 4.1 .. ..
Belgium 13.1 11.8 12.7 11.4 11.6 ..
Canada 8.0 9.5 9.4 8.6 8.3 8.4 p 8.
Czech Republic 2.0 a 1.1 0.7 0.9 1.0 0.6
Denmark 1.8 2.0 3.0 4.2 a 2.7 3.0
Finland 5.7 5.6 6.7 6.2 5.8 5.8
France 3.3 2.7 a 3.1 2.9 2.7 ..
Germany 8.2 11.6 12.2 11.8 12.6 12.8 c
Greece 5.6 a .. 6.8 .. 7.5 ..
Hungary 2.1 5.5 4.4 11.8 10.6 12.9
Iceland 5.4 .. 10.9 .. 9.5 ..
Ireland 6.9 c 5.3 4.4 c 3.7 3.0 c 2.6
Italy 4.7 .. .. .. .. ..
Japan 2.4 m 2.5 2.3 2.8 2.9 2.8
Korea 22.4 g 15.9 g 14.3 g 13.9 g 13.6 g 15.9 g
Luxembourg .. .. .. .. .. ..
Mexico 1.4 2.0 1.1 2.6 2.0 ..
Netherlands 4.0 7.0 a 7.1 6.7 6.8 ..
New Zealand 9.4 .. 5.3 .. 3.6 ..
Norway 5.3 .. 5.8 .. 5.0 ..
Poland 11.4 7.8 6.3 5.8 6.0 5.6
Portugal 0.9 a 1.0 c 0.8 1.2 c 1.5 ..
Slovak Republic 1.0 o 0.3 a 0.3 0.0 0.0 0.6
Spain 8.3 6.9 8.7 c 7.6 6.4 7.5
Sweden 4.6 a,j .. 5.5 .. 5.5 ..
Switzerland .. 5.1 .. 6.0 .. 8.7
Turkey 13.1 19.4 21.1 22.0 .. ..
United Kingdom 6.3 7.1 6.2 5.8 5.5 ..
United States 6.8 j 7.1 j 6.5 j 5.8 j 5.3 j,p 5.0 j,p
EU-25 5.9 b 6.6 b 6.7 b 6.6 b 6.5 b ..
Total OECD 6.2 a,b 6.6 b 6.4 b 6.2 b 6.1 b ..
Argentina .. 0.2 c 0.3 c 0.4 0.2 0.1
China .. 32.4 v .. .. 35.9 v 37.1 v
Israel 2.3 g 3.7 g 4.9 g 4.9 g .. ..
Romania 18.6 a 6.5 6.0 5.6 8.5 6.6
Russian Federation 27.5 27.3 26.5 27.2 27.9 32.6
Singapore 2.7 a 6.0 4.3 2.5 4.0 2.7
Slovenia 3.2 m 7.6 6.7 9.0 10.1 9.6
South Africa .. .. 21.1 .. 25.5 ..
Chinese Taipei .. 4.1 3.2 3.3 4.2 5.2
Source: OECD, Main Science and Technology Indicators, June 2006.
Table 25. Percentage of HERD financed by industry
StatLink: http://dx.doi.org/10.1787/252874
OECD SCIENCE, TECHNOLOGY AND INDUSTRY OUTLOOK 2006 – ISBN 92-64-02848-X – © OECD 2006232

STATISTICAL ANNEX
b,p
b,p
p
d,p
267858
1995 2000 2001 2002 2003 2004 2005
Australia .. 0.34 .. 0.32 .. .. ..
Austria .. .. .. 0.12 .. .. ..
Belgium 0.08 0.12 0.13 0.14 0.13 0.14 p ..
Canada 0.25 0.22 0.22 0.22 0.20 0.21 p 0.19
Czech Republic 0.25 a 0.31 0.29 0.28 0.29 0.27 ..
Denmark 0.31 0.28 0.28 0.18 a 0.18 0.17 ..
Finland 0.38 0.36 0.35 0.36 0.34 0.33 ..
France 0.48 0.37 a 0.36 0.37 0.36 0.36 p ..
Germany 0.34 o 0.33 o 0.34 o 0.34 o 0.34 o 0.33 c,o ..
Greece 0.12 .. 0.14 .. 0.13 .. ..
Hungary 0.19 d 0.21 d 0.24 d 0.33 d 0.30 d 0.26 d ..
Iceland 0.59 0.70 c 0.61 0.76 c 0.73 .. ..
Ireland 0.11 0.09 0.09 0.10 0.09 0.09 0.08
Italy 0.21 0.20 0.20 0.20 0.19 0.17 p 0.17
Japan 0.28 0.30 0.29 0.30 0.29 0.30 ..
Korea 0.40 g 0.32 g 0.32 g 0.34 g 0.33 g 0.34 g ..
Luxembourg .. 0.12 0.15 0.17 0.19 0.19 ..
Mexico 0.10 0.16 0.15 0.11 0.11 .. ..
Netherlands 0.34 0.23 a 0.25 0.24 0.25 a 0.26 ..
New Zealand 0.40 .. 0.37 .. 0.33 .. ..
Norway 0.29 .. 0.23 0.26 0.26 0.25 ..
Poland 0.23 a 0.21 0.20 0.26 0.23 0.23 ..
Portugal 0.15 0.19 c 0.18 0.15 c 0.13 .. ..
Slovak Republic 0.38 d 0.16 d 0.15 d 0.15 d 0.18 d 0.16 d ..
Spain 0.15 0.14 0.15 0.15 0.16 0.17 ..
Sweden 0.12 h .. 0.12 h .. 0.14 h .. ..
Switzerland .. 0.03 a,h .. 0.03 h .. 0.03 h ..
Turkey 0.03 0.04 0.05 0.05 .. .. ..
United Kingdom 0.28 0.23 0.18 a 0.17 0.18 .. ..
United States 0.35 h 0.28 h 0.31 h 0.32 h 0.33 h,p 0.33 h,p ..
EU-25 0.28 b 0.25 b 0.24 b 0.24 b 0.24 b .. ..
Total OECD 0.30 a,b 0.26 b 0.27 b 0.27 b 0.28 b 0.28 b,p ..
Argentina .. 0.17 0.17 0.14 0.17 0.17 ..
China 0.24 v 0.28 a 0.28 0.31 0.31 0.28 ..
Israel 0.26 d 0.25 d 0.26 d 0.26 d 0.26 d,p 0.24 d,p 0.21
Romania 0.16 a 0.07 0.11 0.09 0.12 0.13 ..
Russian Federation 0.22 0.26 0.29 0.30 0.32 0.29 ..
Singapore 0.09 a 0.27 0.28 0.28 0.27 0.24 ..
Slovenia 0.39 0.37 0.38 0.35 0.29 0.29 ..
South Africa .. .. 0.15 .. 0.18 .. ..
Chinese Taipei .. 0.48 d 0.51 d 0.57 a 0.61 0.60 ..
Source: OECD, Main Science and Technology Indicators, June 2006.
Table 26. Government expenditure on R&D (GOVERD)
As a percentage of GDP
StatLink: http://dx.doi.org/10.1787/612047
OECD SCIENCE, TECHNOLOGY AND INDUSTRY OUTLOOK 2006 – ISBN 92-64-02848-X – © OECD 2006 233

STATISTICAL ANNEX
,h,p
,p
,p
,p
,p
,p
,h,i,p
715278
1995 2001 2002 2003 2004 2005 2006
Australia 2 307.1 a,h 3 166.4 h 3 212.5 h 3 547.3 h 3 580.7 h,p 3 660.5 h,p ..
Austria 1 211.8 h 1 531.3 h 1 608.7 h 1 599.5 h 1 645.6 h 1 796.1 h,p 1 868.6 b
Belgium 1 154.0 1 685.6 1 818.8 1 913.4 1 944.9 1 959.7 p ..
Canada 3 815.0 a,h 5 350.1 h 5 568.3 h 5 812.5 h 6 063.4 c,h 6 334.8 c,h ..
Czech Republic .. .. 855.6 926.1 972.8 1 158.0 p ..
Denmark 782.8 c 1 195.8 a,c 1 188.9 c 1 213.5 1 243.7 1 325.8 1 408.0 b
Finland 950.3 a 1 385.3 1 436.6 1 492.1 1 596.2 1 688.6 1 785.2 b
France 13 760.5 16 487.7 17 218.3 17 886.3 18 403.2 p .. ..
Germany 15 767.4 16 864.4 17 461.3 18 015.3 18 177.8 18 707.2 p ..
Greece 397.4 599.8 600.4 668.3 754.6 792.6 p ..
Hungary .. .. .. .. .. 724.3 c,p ..
Iceland 62.8 114.2 122.2 136.5 138.9 154.8 p ..
Ireland 205.8 384.0 429.0 467.8 621.0 674.7 p ..
Italy 6 855.1 10 315.8 p .. .. .. 10 761.5 p ..
Japan 14 243.5 g,h 23 233.5 h 24 671.4 h 25 904.5 h 26 984.0 h 27 787.8 h,p ..
Korea .. 5 890.2 6 623.6 7 113.0 7 777.4 8 821.9 ..
Luxembourg .. 37.7 48.8 63.3 76.3 86.7 ..
Mexico 1 263.6 h 2 139.6 .. .. .. .. ..
Netherlands 2 874.0 3 677.9 3 724.5 3 815.8 3 950.0 4 000.0 p 4 031.9 b
New Zealand 308.5 452.4 c .. 490.5 c .. .. ..
Norway 838.7 1 158.6 1 268.4 1 324.1 1 431.5 1 413.7 p ..
Poland 1 187.0 1 630.0 .. .. 1 550.6 .. ..
Portugal 594.7 1 181.9 1 368.3 1 193.7 1 290.9 1 540.6 1 641.0 b
Slovak Republic 171.8 d 210.3 215.7 a 213.4 227.9 234.2 276.0 b
Spain 3 020.3 6 016.0 c 7 230.8 7 667.0 8 832.1 9 997.6 p ..
Sweden 2 079.3 c 2 048.4 2 275.4 2 500.1 2 508.5 2 624.9 2 747.9 b
Switzerland .. .. 1 640.4 .. 1 968.7 .. ..
Turkey .. .. .. .. .. .. ..
United Kingdom 9 050.6 10 857.4 a 13 242.7 13 414.1 13 145.4 p .. ..
United States 68 791.0 h,i,j 91 505.1 h,i 103 056.7 h,i 114 866.1 h,i 126 270.5 h,i 132 156.1 c,h,i 132 194.6 b
EU-25 62 701.0 m 79 773.8 a,m 86 015.9 a,m 86 908.6 m 91 065.2 m,p .. ..
Total OECD 155 703.1 a,m 213 847.4 m 231 894.9 m 247 611.0 m 264 974.6 m,p .. ..
Argentina .. 1 012.2 h 933.3 h 1 053.6 h 1 155.7 h 1 465.1 h ..
China .. .. .. .. .. .. ..
Israel 978.8 d 1 435.0 d 1 382.6 d 1 483.7 d,p 1 384.8 d,p .. ..
Romania 581.6 j 223.5 217.4 264.7 315.0 431.0 b ..
Russian Federation 5 425.8 6 068.1 7 257.9 9 334.2 9 146.9 .. ..
Singapore .. .. .. .. .. .. ..
Slovenia .. 184.4 203.3 218.5 257.2 268.6 b ..
South Africa .. .. .. .. .. .. ..
Chinese Taipei .. 3 982.7 a 4 256.7 4 770.0 5 184.9 5 208.6 ..
Source: OECD, Main Science and Technology Indicators, June 2006.
Table 27. Total government budget appropriations or outlays for R&D (GBAORD)
Million current PPP USD
StatLink: http://dx.doi.org/10.1787/403178
OECD SCIENCE, TECHNOLOGY AND INDUSTRY OUTLOOK 2006 – ISBN 92-64-02848-X – © OECD 2006234

STATISTICAL ANNEX
h,p
b,h,p
p
c
p
b,p
b,p
p
s
p
c,p
p
p
p
h
n
o
b,p
p
b,p
b,p
p
b,p
p
m
m
h
p
b
ity
507814
Australia1 1 096.2 h,p 828.4 h,p 0.3 h,p 260.0 h,p 1 230.8
Austria 374.6 b,h,p 220.2 b,h,p 14.6 b,h,p 260.7 b,h,p 990.6Belgium1
685.5 p 176.2 p 171.9 p 493.5 p 363.1Canada1
1 834.9 c,h 1 604.9 c,h 280.4 c,h 491.2 c,h 1 819.7Czech Republic1
265.5 p 193.1 p 10.2 p 297.2 p 262.0
Denmark 213.2 b,p 231.5 b,p 27.5 b,p 294.2 b,p 615.4
Finland 701.4 b,p 260.1 b,p 30.7 b,p 288.6 b,p 454.2France2
2 439.8 p 1 791.3 p 1 567.1 p 3 906.4 p 4 155.7Germany1
3 551.0 s 2 509.3 s 923.9 s 3 112.2 s 7 534.9Greece1
156.5 p 159.5 p 16.4 p 73.0 p 377.1Hungary1
362.1 c,p 261.6 c,p 16.7 c,p 34.6 c,p 46.7Iceland1
52.9 p 25.8 p .. 24.9 p 51.2Ireland1
173.7 p 81.9 p 11.5 p 6.8 p 400.8Italy1
2 259.3 p 2 006.2 p 901.9 p 635.5 p 4 542.8Japan2
8 548.5 h 1 968.4 h 1 812.7 h 4 215.9 h 9 051.1Korea1
4 044.4 1 514.9 260.3 1 826.1 o ..
Luxembourg .. .. .. .. ..Mexico3
717.3 268.4 0.0 .. n 1 153.9
Netherlands 907.9 b,p 330.4 b,p 97.7 b,p 426.0 b,p 1 971.0New Zealand4
172.2 114.3 .. 22.3 73.2Norway1
302.5 p 256.5 p 31.8 p 183.3 p 547.7Poland2
146.4 85.3 .. 1 009.1 ..
Portugal 520.9 b,p 266.1 b,p 3.4 b,p 170.9 b,p 614.3
Slovak Republic 46.2 b,p 11.3 b,p .. n 132.2 b,o,p 63.5Spain1
3 635.5 p 1 402.7 p 322.1 p 935.2 p 1 836.0
Sweden 426.8 b,p 225.0 b,p 24.9 b,p 364.9 b,p 1 242.5Switzerland2
151.4 h 81.5 h 78.6 h 192.2 h 1 159.1
Turkey .. .. .. .. ..United Kingdom2
1 341.0 p 2 744.1 p 205.7 p 2 013.3 p 2 596.1
United States 5 660.9 b,h,p 33 155.8 b,h,p 10 645.1 b,h,p 7 353.9 b,h,p ..European Commission2
1 514.8 p 1 322.3 p 0.0 p 0.0 p ..EU-252
18 031.6 m 13 411.7 m 4 276.1 m 13 940.7 m 27 264.4
Total OECD2 39 749.1 m 51 930.1 m 16 473.8 m 28 092.0 m 40 988.7
Argentina 672.4 h 278.0 h 60.4 h 242.5 h 134.9
China .. .. .. .. ..Israel2 660.1 p 93.3 p 0.6 p 41.5 p 589.4
Romania 83.1 b 34.3 b 10.4 b 176.2 b ..Russian Federation3
1 482.0 426.8 612.7 851.3 0.0
Singapore .. .. .. .. ..
Slovenia 72.8 b 22.0 b 0.0 b 160.3 b 0.0
South Africa .. .. .. .. ..
Chinese Taipei 1 713.4 1 026.9 164.8 1 279.1 470.1
1. 2005.2. 2004.3. 2001.4. 1999.
Source: OECD, Main Science and Technology Indicators, June 2006.
Economic development
Health and environment
Space programmes
Table 28. Civil GBAORD by socio-economic objectives, 2006
Million current PPP USD
Non-oriented researchGeneral univers
funds
StatLink: http://dx.doi.org/10.1787/762657
OECD SCIENCE, TECHNOLOGY AND INDUSTRY OUTLOOK 2006 – ISBN 92-64-02848-X – © OECD 2006 235

STATISTICAL ANNEX
4
..
..
6
9 p
..
..
4
..
..
..
..
..
..
..
..
..
..
..
..
..
..
..
..
..
..
..
..
..
6 p
..
071460
1998 1999 2000 2001 2002 2003 200
Australia .. 41.8 .. .. .. ..
Austria .. .. .. .. .. ..
Belgium .. .. .. .. .. 57.1 55.
Canada 33.2 32.0 29.3 29.6 33.7 34.9 34.
Czech Republic 30.7 27.4 36.9 45.3 43.4 46.6
Denmark .. .. .. .. .. ..
Finland 13.2 14.9 12.7 14.2 .. 14.0 16.
France 16.4 .. .. 21.5 19.4 22.6
Germany .. 17.8 .. 24.8 .. 26.7
Greece .. 4.5 .. .. .. ..
Hungary 78.5 .. .. .. .. ..
Iceland .. .. .. .. .. ..
Ireland .. 63.8 .. 64.6 .. 72.1
Italy .. .. .. 33.0 27.7 32.1
Japan 1.7 3.9 3.6 3.4 3.6 4.3
Korea .. .. .. .. .. ..
Luxembourg .. .. .. .. .. ..
Mexico .. .. .. .. .. ..
Netherlands 21.8 21.5 18.7 19.6 31.3 ..
New Zealand .. .. .. .. .. ..
Norway .. .. .. .. .. ..
Poland .. .. 12.1 4.6 10.0 9.3
Portugal .. 18.0 .. 30.8 .. 24.6
Slovak Republic .. .. 20.4 19.0 22.6 22.4
Spain .. 32.8 .. 31.0 .. 26.2
Sweden 17.5 34.1 34.0 38.2 34.4 ..
Switzerland .. .. .. .. .. ..
Turkey 8.4 7.3 10.6 .. 6.6 ..
United Kingdom 30.4 31.2 31.3 40.6 38.0 45.0 38.
United States 13.2 13.2 13.1 13.3 14.2 14.5 p
Source: OECD, Main Science and Technology Indicators, June 2006.
Table 29. R&D expenditure of foreign affiliates
As a percentage of R&D expenditures of enterprises
StatLink: http://dx.doi.org/10.1787/202152
OECD SCIENCE, TECHNOLOGY AND INDUSTRY OUTLOOK 2006 – ISBN 92-64-02848-X – © OECD 2006236

STATISTICAL ANNEX
3 b,p
1
6
4
0
5
0
4
6
1
9
3
8
9
4
4
7
9
6
9
3
3
1
6
2
5
9
5
7
4
2
0
4
9
7
5
2
6
2
..
8
8
247863
1997 1998 1999 b 2000 b 2001 b 2002 b 200
Australia 252 296 337 360 369 388 43
Austria 247 265 275 294 302 269 27
Belgium 408 418 422 430 449 447 45
Canada 543 532 595 643 661 685 71
Czech Republic 11 14 12 11 13 12 1
Denmark 208 217 229 239 222 215 20
Finland 424 449 494 538 580 606 63
France 2 105 2 274 2 303 2 372 2 368 2 352 2 35
Germany 5 463 5 901 6 389 7 144 7 275 7 244 7 11
Greece 9 8 11 6 5 7
Hungary 32 17 34 34 24 22 2
Iceland 4 5 6 8 6 7
Ireland 35 32 55 56 60 61 5
Italy 708 792 794 822 847 839 84
Japan 10 625 10 999 12 064 12 954 12 684 12 928 13 56
Korea 412 470 524 579 598 694 74
Luxembourg 14 18 18 17 22 21 1
Mexico 13 13 12 15 16 16 1
Netherlands 784 842 876 883 901 937 1 01
New Zealand 39 44 42 50 49 55 5
Norway 89 89 92 102 104 108 11
Poland 9 4 8 10 8 11 1
Portugal 6 4 5 7 7 5
Slovak Republic 3 2 3 4 2 1
Spain 98 111 115 122 122 112 11
Sweden 827 910 960 948 881 818 80
Switzerland 764 815 891 921 919 892 89
Turkey 3 7 4 5 6 7
United Kingdom 1 542 1 645 1 985 2 088 2 074 2 014 2 02
United States 14 431 14 868 16 296 17 554 18 064 18 954 19 22
EU-25 12 941 13 942 14 998 16 044 16 168 16 001 15 99
Total OECD 40 107 42 061 45 850 49 217 49 636 50 726 51 75
Argentina 6 9 7 11 8 9
China 40 41 72 87 128 144 17
Israel 273 251 325 363 352 331 35
Romania 2 2 2 1 3 2
Russian Federation 51 70 61 65 61 58 5
Singapore 27 44 67 78 84 80 8
Slovenia 4 12 6 9 4 6
South Africa 33 33 33 37 38 37 3
Chinese Taipei 53 92 80 77 92 98 10
Source: OECD, Main Science and Technology Indicators, June 2006.
Table 30. Number of triadic patent families
Priority year
StatLink: http://dx.doi.org/10.1787/164015
OECD SCIENCE, TECHNOLOGY AND INDUSTRY OUTLOOK 2006 – ISBN 92-64-02848-X – © OECD 2006 237

STATISTICAL ANNEX
b,p
157712
1997 1998 1999 b 2000 b 2001 b 2002 b 2003
Australia 0.63 0.70 0.73 0.73 0.74 0.77 0.83
Austria 0.61 0.63 0.60 0.60 0.61 0.53 0.53
Belgium 1.02 0.99 0.92 0.87 0.91 0.88 0.88
Canada 1.36 1.26 1.30 1.31 1.33 1.35 1.37
Czech Republic 0.03 0.03 0.03 0.02 0.03 0.02 0.03
Denmark 0.52 0.52 0.50 0.49 0.45 0.42 0.39
Finland 1.06 1.07 1.08 1.09 1.17 1.19 1.22
France 5.25 5.41 5.02 4.82 4.77 4.64 4.55
Germany 13.62 14.03 13.93 14.52 14.66 14.28 13.74
Greece 0.02 0.02 0.03 0.01 0.01 0.01 0.02
Hungary 0.08 0.04 0.07 0.07 0.05 0.04 0.05
Iceland 0.01 0.01 0.01 0.02 0.01 0.01 0.02
Ireland 0.09 0.08 0.12 0.11 0.12 0.12 0.11
Italy 1.77 1.88 1.73 1.67 1.71 1.65 1.63
Japan 26.49 26.15 26.31 26.32 25.55 25.49 26.21
Korea 1.03 1.12 1.14 1.18 1.20 1.37 1.44
Luxembourg 0.04 0.04 0.04 0.04 0.04 0.04 0.04
Mexico 0.03 0.03 0.03 0.03 0.03 0.03 0.03
Netherlands 1.96 2.00 1.91 1.79 1.82 1.85 1.97
New Zealand 0.10 0.11 0.09 0.10 0.10 0.11 0.10
Norway 0.22 0.21 0.20 0.21 0.21 0.21 0.22
Poland 0.02 0.01 0.02 0.02 0.02 0.02 0.02
Portugal 0.02 0.01 0.01 0.02 0.01 0.01 0.01
Slovak Republic 0.01 0.01 0.01 0.01 0.00 0.00 0.00
Spain 0.25 0.26 0.25 0.25 0.24 0.22 0.22
Sweden 2.06 2.16 2.09 1.93 1.77 1.61 1.56
Switzerland 1.90 1.94 1.94 1.87 1.85 1.76 1.73
Turkey 0.01 0.02 0.01 0.01 0.01 0.01 0.01
United Kingdom 3.85 3.91 4.33 4.24 4.18 3.97 3.91
United States 35.98 35.35 35.54 35.67 36.39 37.36 37.14
EU-25 32.27 33.15 32.71 32.60 32.57 31.54 30.90
Total OECD 100.00 100.00 100.00 100.00 100.00 100.00 100.00
Source: OECD, Main Science and Technology Indicators, June 2006.
Table 31. Share of countries in triadic patent families
Priority year
StatLink: http://dx.doi.org/10.1787/863608
OECD SCIENCE, TECHNOLOGY AND INDUSTRY OUTLOOK 2006 – ISBN 92-64-02848-X – © OECD 2006238

STATISTICAL ANNEX
4
..
..
.1 p
..
.6 p
..
.5 p
..
.9 p
..
..
..
..
.5 p
.4 p
..
.7 p
.8 p
..
..
.2 p
..
.9
..
..
..
.4 p
..
.8 p
.0 p
..
..
..
..
..
..
..
..
..
154817
1995 1999 2000 2001 2002 2003 200
Australia .. .. .. .. .. ..
Austria 1 906.8 2 281.6 2 429.7 .. .. ..
Belgium 3 760.3 a 5 494.2 5 572.1 5 701.1 4 970.1 5 862.1 6 731
Canada 1 283.1 1 993.6 2 613.9 2 092.6 1 428.6 p 1 721.6 p
Czech Republic .. 264.4 249.3 291.9 305.9 190.3 224
Denmark .. 1 657.3 .. .. .. ..
Finland 58.2 2 175.5 1 551.5 1 302.9 1 471.9 1 683.9 1 944
France 2 170.3 2 755.1 2 741.8 3 196.4 3 619.6 5 188.3
Germany 10 632.6 12 950.8 13 583.0 14 576.2 16 493.3 22 825.3 25 333
Greece .. .. .. .. .. ..
Hungary .. 216.1 .. .. .. ..
Iceland .. .. .. .. .. ..
Ireland .. .. .. .. .. ..
Italy 3 050.7 3 369.5 2 806.6 2 683.6 2 977.5 3 108.5 3 861
Japan 5 975.8 8 435.0 9 816.3 10 259.4 11 059.8 13 043.6 16 354
Korea .. .. .. 619.1 638.1 816.4
Luxembourg .. .. .. .. 695.5 1 627.5 2 767
Mexico 118.2 42.1 43.1 40.8 48.3 54.0 43
Netherlands .. .. .. .. .. ..
New Zealand 20.2 7.9 .. .. .. ..
Norway 496.3 1 482.5 1 813.5 1 678.1 1 367.0 1 545.4 1 973
Poland 230.9 129.1 136.0 176.8 246.3 ..
Portugal 139.0 273.7 294.8 258.7 346.1 401.0 538
Slovak Republic 9.4 t 15.6 t 23.5 t 30.4 t .. ..
Spain 79.4 .. .. .. .. ..
Sweden .. .. .. .. .. ..
Switzerland 2 778.1 2 769.4 2 869.4 3 233.0 4 334.0 4 559.5 6 429
Turkey .. .. .. .. .. ..
United Kingdom 4 218.3 17 885.1 16 330.0 18 023.3 19 665.1 23 686.0 28 195
United States 30 289.0 39 670.0 43 233.0 40 696.0 44 489.0 48 137.0 52 643
Argentina .. 20.0 14.0 21.0 17.8 18.3
China .. .. .. .. .. ..
Israel .. .. .. .. .. ..
Romania 1.0 m 9.1 m 7.2 m 20.0 m 15.0 m 10.2 m,p
Russian Federation .. 80.0 204.0 242.2 211.1 236.4
Singapore 582.7 m 611.6 m .. .. .. ..
Slovenia 10.3 12.4 12.1 .. .. ..
South Africa .. .. .. .. .. ..
Chinese Taipei 27.5 m 37.9 m 126.4 m .. 325.7 m 263.6 m
Source: OECD, Main Science and Technology Indicators, June 2006.
Table 32. Technology balance of payments: Receipts
Million current USD
StatLink: http://dx.doi.org/10.1787/011218
OECD SCIENCE, TECHNOLOGY AND INDUSTRY OUTLOOK 2006 – ISBN 92-64-02848-X – © OECD 2006 239
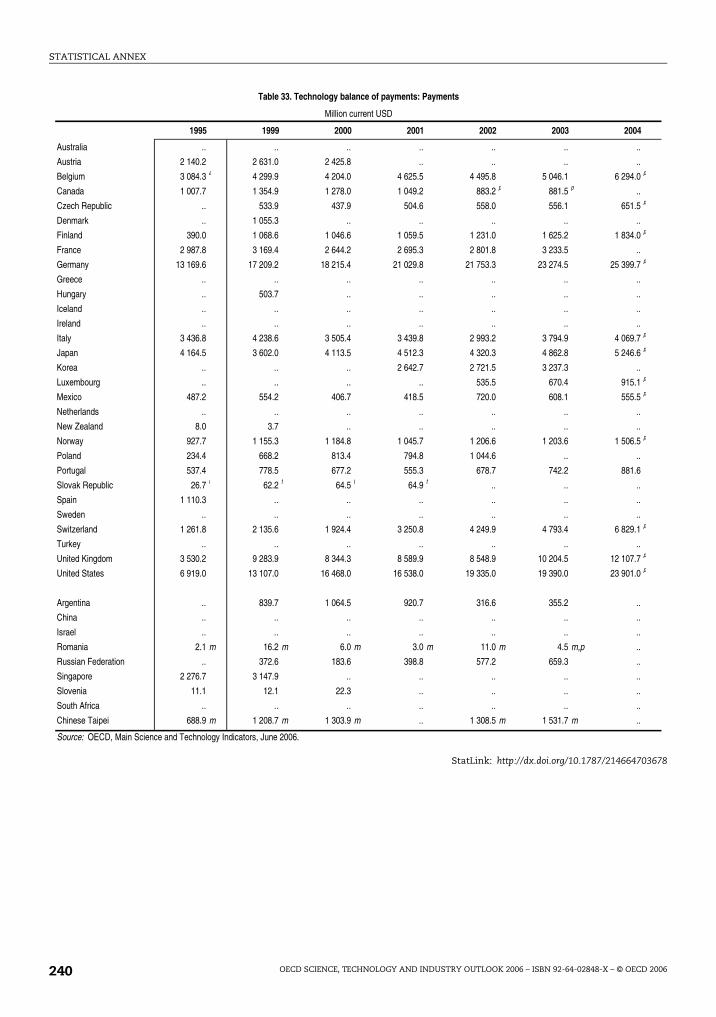
STATISTICAL ANNEX
4
..
..
0 p
..
5 p
..
0 p
..
7 p
..
..
..
..
7 p
6 p
..
1 p
5 p
..
..
5 p
..
6
..
..
..
1 p
..
7 p
0 p
..
..
..
..
..
..
..
..
..
703678
1995 1999 2000 2001 2002 2003 200
Australia .. .. .. .. .. ..
Austria 2 140.2 2 631.0 2 425.8 .. .. ..
Belgium 3 084.3 a 4 299.9 4 204.0 4 625.5 4 495.8 5 046.1 6 294.
Canada 1 007.7 1 354.9 1 278.0 1 049.2 883.2 p 881.5 p
Czech Republic .. 533.9 437.9 504.6 558.0 556.1 651.
Denmark .. 1 055.3 .. .. .. ..
Finland 390.0 1 068.6 1 046.6 1 059.5 1 231.0 1 625.2 1 834.
France 2 987.8 3 169.4 2 644.2 2 695.3 2 801.8 3 233.5
Germany 13 169.6 17 209.2 18 215.4 21 029.8 21 753.3 23 274.5 25 399.
Greece .. .. .. .. .. ..
Hungary .. 503.7 .. .. .. ..
Iceland .. .. .. .. .. ..
Ireland .. .. .. .. .. ..
Italy 3 436.8 4 238.6 3 505.4 3 439.8 2 993.2 3 794.9 4 069.
Japan 4 164.5 3 602.0 4 113.5 4 512.3 4 320.3 4 862.8 5 246.
Korea .. .. .. 2 642.7 2 721.5 3 237.3
Luxembourg .. .. .. .. 535.5 670.4 915.
Mexico 487.2 554.2 406.7 418.5 720.0 608.1 555.
Netherlands .. .. .. .. .. ..
New Zealand 8.0 3.7 .. .. .. ..
Norway 927.7 1 155.3 1 184.8 1 045.7 1 206.6 1 203.6 1 506.
Poland 234.4 668.2 813.4 794.8 1 044.6 ..
Portugal 537.4 778.5 677.2 555.3 678.7 742.2 881.
Slovak Republic 26.7 t 62.2 t 64.5 t 64.9 t .. ..
Spain 1 110.3 .. .. .. .. ..
Sweden .. .. .. .. .. ..
Switzerland 1 261.8 2 135.6 1 924.4 3 250.8 4 249.9 4 793.4 6 829.
Turkey .. .. .. .. .. ..
United Kingdom 3 530.2 9 283.9 8 344.3 8 589.9 8 548.9 10 204.5 12 107.
United States 6 919.0 13 107.0 16 468.0 16 538.0 19 335.0 19 390.0 23 901.
Argentina .. 839.7 1 064.5 920.7 316.6 355.2
China .. .. .. .. .. ..
Israel .. .. .. .. .. ..
Romania 2.1 m 16.2 m 6.0 m 3.0 m 11.0 m 4.5 m,p
Russian Federation .. 372.6 183.6 398.8 577.2 659.3
Singapore 2 276.7 3 147.9 .. .. .. ..
Slovenia 11.1 12.1 22.3 .. .. ..
South Africa .. .. .. .. .. ..
Chinese Taipei 688.9 m 1 208.7 m 1 303.9 m .. 1 308.5 m 1 531.7 m
Source: OECD, Main Science and Technology Indicators, June 2006.
Table 33. Technology balance of payments: Payments
Million current USD
StatLink: http://dx.doi.org/10.1787/214664
OECD SCIENCE, TECHNOLOGY AND INDUSTRY OUTLOOK 2006 – ISBN 92-64-02848-X – © OECD 2006240

STATISTICAL ANNEX
681480
1995 1999 2000 2001 2002 2003 2004
Australia .. .. .. .. .. .. ..
Austria 58.0 c 65.6 c 65.4 c .. .. .. ..
Belgium 65.0 a 87.4 91.9 96.2 91.9 86.4 92.8 p
Canada 10.1 11.4 9.2 7.1 6.2 p 5.4 p ..
Czech Republic .. 78.1 63.8 67.7 61.8 48.7 47.7 p
Denmark .. 27.9 .. .. .. .. ..
Finland 13.2 25.9 25.7 25.6 27.1 28.8 28.1 p
France 8.3 10.1 9.3 9.2 8.6 8.3 ..
Germany 23.9 c 33.5 39.1 45.2 43.3 37.8 37.1 p
Greece .. .. .. .. .. .. ..
Hungary .. 152.8 d .. .. .. .. ..
Iceland .. .. .. .. .. .. ..
Ireland .. .. .. .. .. .. ..
Italy 31.3 34.5 30.5 28.3 21.8 23.0 ..
Japan 2.7 m 2.7 2.9 3.5 3.5 3.6 3.6 p
Korea .. .. .. 21.2 19.7 20.2 ..
Luxembourg .. .. .. .. .. 139.5 164.5 p
Mexico 55.0 26.8 18.8 17.1 25.5 21.9 ..
Netherlands .. .. .. .. .. .. ..
New Zealand 1.4 0.6 .. .. .. .. ..
Norway 36.9 a 44.3 .. 38.5 37.9 31.2 36.7 p
Poland 26.7 a 57.7 73.7 67.0 94.2 .. ..
Portugal 88.1 89.7 79.3 c 59.8 70.1 64.5 ..
Slovak Republic 14.8 d,t 46.3 l,t 48.8 l,t 48.5 l,t .. .. ..
Spain 23.4 .. .. .. .. .. ..
Sweden .. .. .. .. .. .. ..
Switzerland .. .. 30.4 .. .. .. ..
Turkey .. .. .. .. .. .. ..
United Kingdom 15.9 33.9 31.1 32.0 28.8 30.0 ..
United States 3.8 j 5.3 j 6.2 j 6.0 j 7.0 j 6.6 j,p 7.6 j,p
Argentina .. 65.3 85.3 80.7 79.8 66.8 ..
China .. .. .. .. .. .. ..
Israel .. .. .. .. .. .. ..
Romania 0.8 a,m 11.3 m 4.4 m 1.9 m 6.3 m 2.0 m,p ..
Russian Federation .. 19.1 6.7 11.1 13.4 11.9 ..
Singapore 236.1 200.9 .. .. .. .. ..
Slovenia 3.5 m 4.0 8.1 .. .. .. ..
South Africa .. .. .. .. .. .. ..
Chinese Taipei 14.6 d,m 20.5 d,m 20.6 d,m .. 20.2 a,m 21.6 m ..
Source: OECD, Main Science and Technology Indicators, June 2006.
Table 34. Technology balance of payments: Payments as a percentage of GERD
StatLink: http://dx.doi.org/10.1787/038426
OECD SCIENCE, TECHNOLOGY AND INDUSTRY OUTLOOK 2006 – ISBN 92-64-02848-X – © OECD 2006 241

STATISTICAL ANNEX
rms.883.922.912.827.729.839.008.8111.03.015.838.012.951.023.8820.82.632.934.0230.99.793.717.559.0151.01.904.934
217544
SMEs Large firms1999 2001 2004 2006 1990 1995 1999 2001 2004 2006
SMEs Large fiAustralia 0.11 0.12 0.12 0.12 0.28 0.21 0.11 0.12 0.12 0.12 0.883 0Austria2 0.07 0.11 0.11 0.08 0.02 0.07 0.07 0.11 0.11 0.08 0.922 0Belgium3 -0.01 -0.01 -0.01 -0.01 -0.01 -0.01 -0.01 -0.01 -0.01 0.09 0.912 0Canada 0.32 0.32 0.32 0.32 0.17 0.17 0.17 0.17 0.17 0.17 0.678 0Czech Republic 4 - - - 0.27 - - - - - 0.27 0.729 0Denmark5 0.13 0.11 0.18 0.16 0.00 0.13 0.13 0.11 0.18 0.16 0.839 0Finland -0.01 -0.01 -0.01 -0.01 -0.02 -0.01 -0.01 -0.01 -0.01 -0.01 1.008 1France6 0.09 0.06 0.13 0.19 0.09 0.08 0.09 0.06 0.13 0.19 0.811 0Germany -0.04 -0.02 -0.02 -0.03 -0.05 -0.05 -0.04 -0.02 -0.02 -0.03 1.03Greece -0.01 -0.01 -0.01 -0.01 - - -0.01 -0.01 -0.01 -0.01 1.015 1Hungary7 - - 0.16 0.16 - - - - 0.16 0.16 0.838 0Iceland -0.03 -0.01 -0.01 -0.01 -0.03 -0.03 -0.03 -0.01 -0.01 -0.01 1.012 1Ireland 0.06 0.00 0.05 0.05 0.00 0.00 0.06 0.00 0.05 0.05 0.951 0Italy 0.45 0.44 0.45 0.43 -0.04 -0.05 -0.03 -0.03 -0.03 -0.02 0.575 1Japan8 0.06 0.12 0.19 0.16 -0.02 -0.01 0.02 0.01 0.14 0.12 0.838 0Korea 0.16 0.16 0.16 0.16 0.10 0.11 0.13 0.13 0.19 0.18 0.842Mexico 0.03 0.03 0.39 0.37 -0.02 -0.02 0.03 0.03 0.39 0.37 0.632 0Netherlands9 - 0.22 0.24 0.24 -0.02 0.05 0.05 0.06 0.07 0.07 0.761 0New Zealand -0.13 -0.02 -0.02 -0.02 - - -0.13 -0.02 -0.02 -0.02 1.023 1Norway -0.02 0.23 0.23 0.23 -0.04 -0.02 -0.02 -0.02 0.21 0.21 0.978Poland10 - - - 0.02 - - - - - 0.01 0.768 0Portugal11 0.15 0.30 -0.01 0.28 -0.02 -0.02 0.15 0.30 -0.01 0.28 0.717 0Spain 0.31 0.44 0.44 0.44 0.25 0.28 0.31 0.44 0.44 0.44 0.559 0Sweden -0.01 -0.01 -0.01 -0.01 -0.02 -0.02 -0.01 -0.01 -0.01 -0.01 1.015 1Switzerland -0.01 -0.01 -0.01 -0.01 -0.01 -0.02 -0.01 -0.01 -0.01 -0.01 1.01United Kingdom 0.11 0.11 0.11 0.11 0.00 0.00 0.00 0.10 0.10 0.10 0.894 0United States12 0.07 0.07 0.07 0.07 0.09 -0.02 0.07 0.07 0.07 0.07 0.934 0
expenditure by large firms results in before-tax 12 cents of tax relief.2. Austria's calculation of the 2006 tax subsidy incorporates an 8% alternative tax credit, which is moregenerous than the research allowance scheme under the new corporate income tax rate of 25%.3. Belgium's 2006 tax subsidy reflects a new incentive. In 2006, Belgium introduced a tax creditfor private-public R&D collaboration equal to 50% of the withholding tax payable.The tax is calculated on gross wages (total labour cost minus the employees and employers social security contribution).The tax subsidy for intramural R&D remains unchanged at -0.01, as in previous years.4. In 2005, the Czech Republic has introduced a double deduction of current R&D expenditures.5. The tax subsidy calculation for Denmark applies to the 150% allowance on collaborative research at universities or public research institutions. Without this incentive, the intramural R&D tax subsidy is -0.01.6. The 2006 tax subsidy of 0.19 reflects the changes introduced by France, including an increase in the volume component of the tax credit to 10% and a decrease in its incremental component to 40%. 7. The B-index for Hungary is based on double deduction for research and technology development(which also applies to subcontracted R&D if the partner is a public or non-profit research organisation). 8. The Japan's tax subsidy is calculated for large firms with a ratio of R&D to sales of less than 10%. The 2006 tax subsidy for large firms with a R&D-to-sales ratio above 10% is 0.15. As of 1 April 2006, Japan rolled back its temporal R&D tax credit rates for large firms to 8% and 10% (depending on R&D intensity) and to 12% for small firms.9. Calculations for the Netherlands were revised to reflect the full value of the WBSO tax credit received.10. Tax subsidies reflect two new incentives introduced by Poland: a tax credit for technology purchases at 30% and 50% for large and small companies, respectively, and a 100% write-off of technology in the year of acquisition.11. In 2004, Portugal temporarily suspended its R&D tax credit system.12. The 2006 B-index for the United States refers to the 20% incremental R&D tax credit that has expired. It is assumed that the credit will be reinstated this year. Without the credit, the US tax subsidy is -0.02.
Source : OECD, 2006.
B-Index2005-2006
1. Tax subsidies are calculated as 1 minus the B index. For example, in Australia in 2001, 1 dollar of R&D
Table 35. Tax treatment of R&D, 1990-2006Rate of tax subsidies for 1 USD of R&D1, large firms and SMEs
StatLink: http://dx.doi.org/10.1787/208465
OECD SCIENCE, TECHNOLOGY AND INDUSTRY OUTLOOK 2006 – ISBN 92-64-02848-X – © OECD 2006242
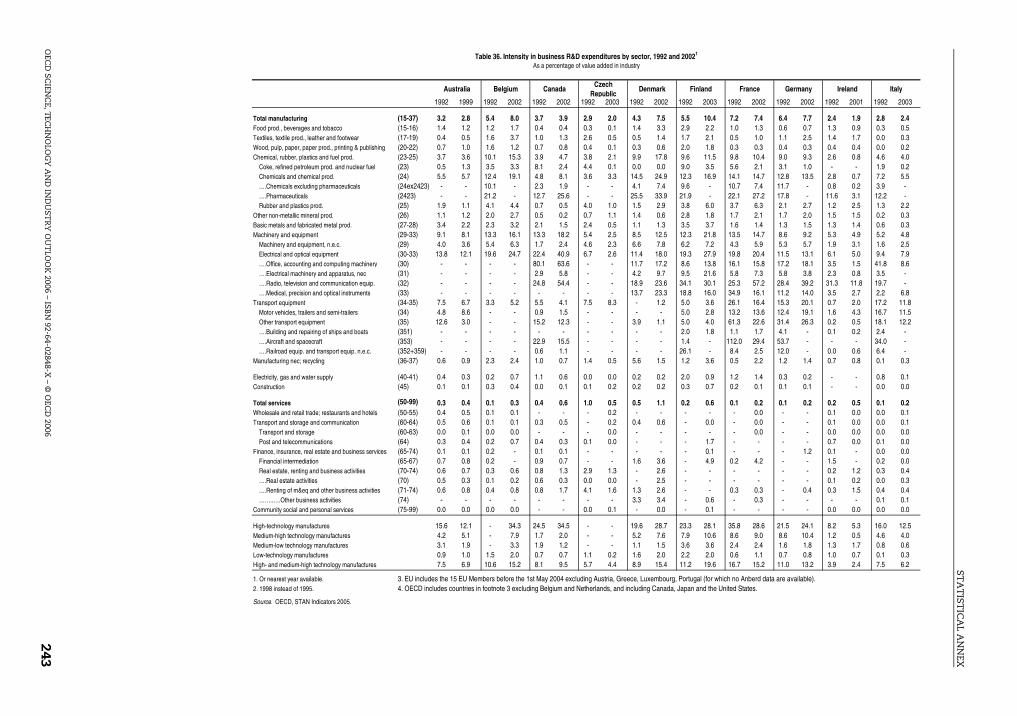
ST
AT
ISTIC
AL A
NN
EX
OEC
D S
C
Table 36. Intensity in business R&D expenditures by sector, 1992 and 20021
As a percentage of value added in industry
Denmark Finland France Germany Ireland Italy
92 2002 1992 2003 1992 2002 1992 2002 1992 2001 1992 2003
.3 7.5 5.5 10.4 7.2 7.4 6.4 7.7 2.4 1.9 2.8 2.4
.4 3.3 2.9 2.2 1.0 1.3 0.6 0.7 1.3 0.9 0.3 0.5
.5 1.4 1.7 2.1 0.5 1.0 1.1 2.5 1.4 1.7 0.0 0.3
.3 0.6 2.0 1.8 0.3 0.3 0.4 0.3 0.4 0.4 0.0 0.2
.9 17.8 9.6 11.5 9.8 10.4 9.0 9.3 2.6 0.8 4.6 4.0
.0 0.0 9.0 3.5 5.6 2.1 3.1 1.0 - - 1.9 0.2.5 24.9 12.3 16.9 14.1 14.7 12.8 13.5 2.8 0.7 7.2 5.5
.1 7.4 9.6 - 10.7 7.4 11.7 - 0.8 0.2 3.9 -.5 33.9 21.9 - 22.1 27.2 17.8 - 11.6 3.1 12.2 -
.5 2.9 3.8 6.0 3.7 6.3 2.1 2.7 1.2 2.5 1.3 2.2
.4 0.6 2.8 1.8 1.7 2.1 1.7 2.0 1.5 1.5 0.2 0.3
.1 1.3 3.5 3.7 1.6 1.4 1.3 1.5 1.3 1.4 0.6 0.3
.5 12.5 12.3 21.8 13.5 14.7 8.6 9.2 5.3 4.9 5.2 4.8
.6 7.8 6.2 7.2 4.3 5.9 5.3 5.7 1.9 3.1 1.6 2.5.4 18.0 19.3 27.9 19.8 20.4 11.5 13.1 6.1 5.0 9.4 7.9.7 17.2 8.6 13.8 16.1 15.8 17.2 18.1 3.5 1.5 41.8 8.6
.2 9.7 9.5 21.6 5.8 7.3 5.8 3.8 2.3 0.8 3.5 -.9 23.6 34.1 30.1 25.3 57.2 28.4 39.2 31.3 11.8 19.7 -.7 23.3 18.8 16.0 34.9 16.1 11.2 14.0 3.5 2.7 2.2 6.8
- 1.2 5.0 3.6 26.1 16.4 15.3 20.1 0.7 2.0 17.2 11.8- - 5.0 2.8 13.2 13.6 12.4 19.1 1.6 4.3 16.7 11.5.9 1.1 5.0 4.0 61.3 22.6 31.4 26.3 0.2 0.5 18.1 12.2- - 2.0 1.8 1.1 1.7 4.1 - 0.1 0.2 2.4 -- - 1.4 - 112.0 29.4 53.7 - - - 34.0 -- - 26.1 - 8.4 2.5 12.0 - 0.0 0.6 6.4 -.6 1.5 1.2 3.6 0.5 2.2 1.2 1.4 0.7 0.8 0.1 0.3
.2 0.2 2.0 0.9 1.2 1.4 0.3 0.2 - - 0.8 0.1
.2 0.2 0.3 0.7 0.2 0.1 0.1 0.1 - - 0.0 0.0
.5 1.1 0.2 0.6 0.1 0.2 0.1 0.2 0.2 0.5 0.1 0.2- - - - - 0.0 - - 0.1 0.0 0.0 0.1.4 0.6 - 0.0 - 0.0 - - 0.1 0.0 0.0 0.1- - - - - 0.0 - - 0.0 0.0 0.0 0.0- - - 1.7 - - - - 0.7 0.0 0.1 0.0- - - 0.1 - - - 1.2 0.1 - 0.0 0.0.6 3.6 - 4.9 0.2 4.2 - - 1.5 - 0.2 0.0- 2.6 - - - - - - 0.2 1.2 0.3 0.4- 2.5 - - - - - - 0.1 0.2 0.0 0.3.3 2.6 - - 0.3 0.3 - 0.4 0.3 1.5 0.4 0.4.3 3.4 - 0.6 - 0.3 - - - - 0.1 0.1- 0.0 - 0.1 - - - - 0.0 0.0 0.0 0.0
.6 28.7 23.3 28.1 35.8 28.6 21.5 24.1 8.2 5.3 16.0 12.5.2 7.6 7.9 10.6 8.6 9.0 8.6 10.4 1.2 0.5 4.6 4.0.1 1.5 3.6 3.6 2.4 2.4 1.6 1.8 1.3 1.7 0.8 0.6.6 2.0 2.2 2.0 0.6 1.1 0.7 0.8 1.0 0.7 0.1 0.3.9 15.4 11.2 19.6 16.7 15.2 11.0 13.2 3.9 2.4 7.5 6.2
, Luxembourg, Portugal (for which no Anberd data are available).uding Canada, Japan and the United States.
IENC
E, TECH
NO
LOG
Y A
ND
IND
UST
RY
OU
TLO
OK
2006 – ISBN
92-64-02848-X – ©
OEC
D 2006
243
Australia Belgium CanadaCzech
Republic1992 1999 1992 2002 1992 2002 1992 2003 19
Total manufacturing (15-37) 3.2 2.8 5.4 8.0 3.7 3.9 2.9 2.0 4Food prod., beverages and tobacco (15-16) 1.4 1.2 1.2 1.7 0.4 0.4 0.3 0.1 1Textiles, textile prod., leather and footwear (17-19) 0.4 0.5 1.6 3.7 1.0 1.3 2.6 0.5 0Wood, pulp, paper, paper prod., printing & publishing (20-22) 0.7 1.0 1.6 1.2 0.7 0.8 0.4 0.1 0Chemical, rubber, plastics and fuel prod. (23-25) 3.7 3.6 10.1 15.3 3.9 4.7 3.8 2.1 9
Coke, refined petroleum prod. and nuclear fuel (23) 0.5 1.3 3.5 3.3 8.1 2.4 4.4 0.1 0Chemicals and chemical prod. (24) 5.5 5.7 12.4 19.1 4.8 8.1 3.6 3.3 14….Chemicals excluding pharmaceuticals (24ex2423) - - 10.1 - 2.3 1.9 - - 4….Pharmaceuticals (2423) - - 21.2 - 12.7 25.6 - - 25Rubber and plastics prod. (25) 1.9 1.1 4.1 4.4 0.7 0.5 4.0 1.0 1
Other non-metallic mineral prod. (26) 1.1 1.2 2.0 2.7 0.5 0.2 0.7 1.1 1Basic metals and fabricated metal prod. (27-28) 3.4 2.2 2.3 3.2 2.1 1.5 2.4 0.5 1Machinery and equipment (29-33) 9.1 8.1 13.3 16.1 13.3 18.2 5.4 2.5 8
Machinery and equipment, n.e.c. (29) 4.0 3.6 5.4 6.3 1.7 2.4 4.6 2.3 6Electrical and optical equipment (30-33) 13.8 12.1 19.6 24.7 22.4 40.9 6.7 2.6 11….Office, accounting and computing machinery (30) - - - - 80.1 63.6 - - 11….Electrical machinery and apparatus, nec (31) - - - - 2.9 5.8 - - 4….Radio, television and communication equip. (32) - - - - 24.8 54.4 - - 18….Medical, precision and optical instruments (33) - - - - - - - - 13
Transport equipment (34-35) 7.5 6.7 3.3 5.2 5.5 4.1 7.5 8.3Motor vehicles, trailers and semi-trailers (34) 4.8 8.6 - - 0.9 1.5 - -Other transport equipment (35) 12.6 3.0 - - 15.2 12.3 - - 3….Building and repairing of ships and boats (351) - - - - - - - -….Aircraft and spacecraft (353) - - - - 22.9 15.5 - -….Railroad equip. and transport equip. n.e.c. (352+359) - - - - 0.6 1.1 - -
Manufacturing nec; recycling (36-37) 0.6 0.9 2.3 2.4 1.0 0.7 1.4 0.5 5
Electricity, gas and water supply (40-41) 0.4 0.3 0.2 0.7 1.1 0.6 0.0 0.0 0Construction (45) 0.1 0.1 0.3 0.4 0.0 0.1 0.1 0.2 0
Total services (50-99) 0.3 0.4 0.1 0.3 0.4 0.6 1.0 0.5 0Wholesale and retail trade; restaurants and hotels (50-55) 0.4 0.5 0.1 0.1 - - - 0.2Transport and storage and communication (60-64) 0.5 0.6 0.1 0.1 0.3 0.5 - 0.2 0
Transport and storage (60-63) 0.0 0.1 0.0 0.0 - - - 0.0Post and telecommunications (64) 0.3 0.4 0.2 0.7 0.4 0.3 0.1 0.0
Finance, insurance, real estate and business services (65-74) 0.1 0.1 0.2 - 0.1 0.1 - -Financial intermediation (65-67) 0.7 0.8 0.2 - 0.9 0.7 - - 1Real estate, renting and business activities (70-74) 0.6 0.7 0.3 0.6 0.8 1.3 2.9 1.3….Real estate activities (70) 0.5 0.3 0.1 0.2 0.6 0.3 0.0 0.0….Renting of m&eq and other business activities (71-74) 0.6 0.8 0.4 0.8 0.8 1.7 4.1 1.6 1……..….Other business activities (74) - - - - - - - - 3
Community social and personal services (75-99) 0.0 0.0 0.0 0.0 - - 0.0 0.1
High-technology manufactures 15.6 12.1 - 34.3 24.5 34.5 - - 19Medium-high technology manufactures 4.2 5.1 - 7.9 1.7 2.0 - - 5Medium-low technology manufactures 3.1 1.9 - 3.3 1.9 1.2 - - 1Low-technology manufactures 0.9 1.0 1.5 2.0 0.7 0.7 1.1 0.2 1High- and medium-high technology manufactures 7.5 6.9 10.6 15.2 8.1 9.5 5.7 4.4 8
1. Or nearest year available. 3. EU includes the 15 EU Members before the 1st May 2004 excluding Austria, Greece2. 1998 instead of 1995. 4. OECD includes countries in footnote 3 excluding Belgium and Netherlands, and incl
Source: OECD, STAN Indicators 2005.

STA
TIST
ICA
L AN
NEX
244 Table 36. Intensity in business R&D expenditures by sector, 1992 and 20021 (cont'd)As a percentage of value added in industry
n Sweden United Kingdom United States EU3 OECD4
002 1992 2002 1992 2002 1992 2002 1992 2001 1992 2001
2.4 10.9 15.2 5.7 6.9 8.6 7.8 5.3 6.0 6.9 7.70.7 1.6 1.0 1.3 1.4 1.2 1.3 0.9 1.1 1.1 1.20.8 1.0 1.2 0.3 0.3 0.5 0.5 0.4 0.8 0.7 0.90.3 1.8 1.7 0.3 0.2 0.9 1.4 0.4 0.4 0.7 1.04.3 17.2 22.2 11.6 15.9 10.7 9.0 8.6 9.2 9.8 9.01.3 2.9 5.8 9.6 10.5 9.9 4.8 4.3 2.5 5.1 1.97.1 22.7 27.7 17.1 24.0 13.8 12.4 12.5 13.1 13.4 13.12.9 7.5 6.5 8.3 5.9 9.3 6.5 8.8 6.9 9.6 8.517.3 39.4 38.4 35.9 52.4 25.4 21.1 22.0 25.6 22.6 20.80.9 3.8 2.4 0.4 0.8 3.1 2.3 1.9 2.8 3.4 4.10.6 1.3 1.5 1.2 0.9 1.9 1.0 1.1 1.2 2.1 2.10.9 2.6 2.8 1.0 0.7 1.4 1.2 1.3 1.2 1.8 1.64.7 22.6 32.5 9.0 9.6 17.4 20.1 9.1 10.3 12.8 17.33.2 9.2 9.0 5.5 6.4 4.7 6.6 4.6 5.4 4.9 6.36.4 40.7 70.0 11.4 11.9 24.2 27.6 13.1 14.8 18.2 24.924.1 33.7 26.0 11.6 5.9 57.7 32.8 - 19.1 34.9 37.03.4 8.9 9.3 12.1 9.2 8.6 5.5 - 4.8 9.0 10.616.2 88.1 553.0 14.3 23.6 20.3 25.4 - 32.7 20.0 30.96.4 16.0 22.9 7.7 8.3 25.3 49.1 - 12.3 18.9 27.96.4 19.5 26.9 14.5 16.2 20.9 14.2 - 15.2 - 14.44.3 21.9 28.4 10.3 10.9 13.8 13.4 - 14.4 - 14.212.7 15.0 21.2 20.1 22.3 29.4 15.5 - 17.6 26.7 14.96.3 4.6 3.1 2.2 8.6 - - - - - -26.1 24.3 34.9 26.2 23.8 34.6 18.5 - - - -5.8 4.7 8.4 3.8 30.5 11.6 15.3 - - - -0.8 1.4 1.5 0.7 0.8 - - - 1.0 - 1.3
0.4 1.5 0.6 1.3 0.7 0.2 0.1 - - - -0.1 - 0.2 0.1 0.1 - 0.0 - - - -
0.2 0.3 0.5 0.3 0.4 0.6 0.9 0.2 0.3 0.4 0.60.1 - 0.0 - - - - - - - -0.1 - 0.0 - - - 1.8 - 0.1 - 0.90.0 - 0.0 - - - - - - - -0.6 - 0.9 - - - - - - - -- - 0.0 - - - 0.1 - - - -- - 2.8 2.3 2.5 - - - - - -
0.5 - 1.2 - - - - - - - -0.3 - 1.1 - - - 0.2 - - - -0.5 - 1.2 0.8 0.8 - - - - - -- - 0.1 0.2 0.4 - - - - - -
0.0 - 0.1 0.0 0.0 - - - - - -
16.3 44.3 62.5 20.1 26.0 29.7 27.3 - 23.1 24.9 26.43.6 12.1 14.9 8.3 8.2 9.1 8.8 - 8.1 8.6 9.91.0 2.6 2.7 1.8 1.8 2.7 1.7 - 1.7 2.5 2.10.6 1.7 1.5 0.7 0.7 - 1.3 - 0.8 - 1.15.9 21.7 29.7 12.5 15.1 17.5 16.3 11.3 12.2 13.9 15.6
rg, Portugal (for which no Anberd data are available).ada, Japan and the United States.
StatLink: http://dx.doi.org/10.1787//673777776508
OEC
D SC
IENC
E, TEC
HN
OLO
GY
AN
D IN
DU
STR
Y O
UT
LOO
K 2006 – ISB
N 92-64-02848-X
– © O
ECD
2006
Korea Netherlands Norway Poland Spai
1995 2003 1992 2002 1992 2002 1994 2000 1992 2
Total manufacturing (15-37) 5.8 7.3 5.0 5.7 5.0 4.8 1.2 1.0 1.8Food prod., beverages and tobacco (15-16) 1.4 1.8 1.7 2.1 1.2 2.3 0.1 0.1 0.4Textiles, textile prod., leather and footwear (17-19) 0.7 1.1 0.7 0.9 1.1 3.1 0.5 0.4 0.2Wood, pulp, paper, paper prod., printing & publishing (20-22) 0.6 0.5 0.1 0.5 1.0 1.2 0.1 0.1 0.2Chemical, rubber, plastics and fuel prod. (23-25) 4.0 3.8 11.3 8.0 12.1 8.6 1.7 1.3 2.6
Coke, refined petroleum prod. and nuclear fuel (23) 2.7 1.9 6.6 0.6 - - 1.2 0.6 1.0Chemicals and chemical prod. (24) 4.8 5.3 14.9 11.0 - - 2.3 2.3 4.0….Chemicals excluding pharmaceuticals (24ex2423) 5.6 5.6 13.2 7.3 - - - 1.8 2.4….Pharmaceuticals (2423) 2.9 4.4 26.2 30.5 32.3 13.8 - 3.9 6.5Rubber and plastics prod. (25) 2.3 2.3 1.3 2.0 1.2 3.5 1.1 0.5 1.1
Other non-metallic mineral prod. (26) 1.4 1.4 0.5 1.1 1.8 1.3 0.2 0.2 0.5Basic metals and fabricated metal prod. (27-28) 1.8 1.6 1.5 2.3 4.7 2.8 0.7 0.5 0.5Machinery and equipment (29-33) 10.7 14.5 10.3 19.1 15.0 12.8 2.8 2.5 5.1
Machinery and equipment, n.e.c. (29) 4.6 5.3 2.1 9.9 7.2 6.6 2.6 2.5 2.4Electrical and optical equipment (30-33) 13.2 17.7 16.1 28.0 23.2 20.2 3.1 2.4 7.4….Office, accounting and computing machinery (30) 8.0 4.4 24.9 - 17.0 37.2 0.3 1.4 14.7….Electrical machinery and apparatus, nec (31) 4.6 3.3 37.2 - 6.2 8.9 2.7 2.1 1.5….Radio, television and communication equip. (32) 16.8 23.4 12.1 - 83.4 44.9 5.5 5.3 19.2….Medical, precision and optical instruments (33) 3.7 10.7 2.5 - 7.9 13.8 1.4 1.0 5.5
Transport equipment (34-35) 14.3 11.3 9.4 4.4 1.8 3.8 3.6 3.2 5.1Motor vehicles, trailers and semi-trailers (34) 16.5 13.8 20.8 6.6 3.3 13.4 2.5 2.7 3.6Other transport equipment (35) 7.3 5.7 3.4 1.9 1.7 2.3 4.5 3.8 10.6….Building and repairing of ships and boats (351) 4.1 - - 2.4 1.6 2.1 - 1.6 5.1….Aircraft and spacecraft (353) 52.6 - - 0.5 1.6 5.7 - 9.0 32.3….Railroad equip. and transport equip. n.e.c. (352+359) 3.2 - - 3.4 3.1 3.1 - 4.6 1.6
Manufacturing nec; recycling (36-37) 0.6 1.6 - 0.5 - 3.4 0.2 0.3 0.3
Electricity, gas and water supply (40-41) 1.9 0.9 0.1 0.3 0.7 0.9 0.1 0.2 0.4Construction (45) 1.1 1.0 0.1 0.1 0.2 0.6 0.2 0.1 0.0
Total services (50-99) 0.3 0.4 0.1 0.3 0.3 0.6 0.1 0.1 0.1Wholesale and retail trade; restaurants and hotels (50-55) 0.0 2 0.0 - - - 0.4 0.0 0.0 0.0Transport and storage and communication (60-64) 0.0 2 0.0 - 0.5 0.1 0.4 0.0 0.0 0.0
Transport and storage (60-63) 0.0 2 0.0 - - - 0.0 0.0 0.0 0.0Post and telecommunications (64) 1.5 2 0.9 - 0.1 0.3 0.5 0.2 0.3 0.2
Finance, insurance, real estate and business services (65-74) 0.0 2 0.0 - 0.1 0.1 0.1 - - 0.0Financial intermediation (65-67) 4.8 2 2.4 - 0.1 0.9 1.7 - - 0.5Real estate, renting and business activities (70-74) 0.5 2 0.6 - 0.6 0.8 1.5 0.2 0.1 0.4….Real estate activities (70) 0.0 2 0.0 - 0.2 0.2 0.7 0.0 0.1 0.0….Renting of m&eq and other business activities (71-74) 0.7 2 1.0 - 0.7 1.1 1.7 0.2 0.1 0.5……..….Other business activities (74) - 2 - - 0.4 2.1 2.0 - - -
Community social and personal services (75-99) 0.1 2 0.0 0.2 0.0 - 0.0 0.1 0.1 0.0
High-technology manufactures 13.1 18.2 12.1 28.9 32.5 21.3 - 3.5 11.6Medium-high technology manufactures 8.7 7.7 12.2 8.2 7.2 8.0 - 2.3 2.7Medium-low technology manufactures 2.1 2.0 1.8 1.8 3.4 2.4 - 0.5 0.8Low-technology manufactures 0.9 1.3 - 1.3 - 2.0 0.2 0.2 0.3High- and medium-high technology manufactures 10.2 12.0 11.9 14.0 - - 2.9 2.6 4.8
1. Or nearest year available. 3. EU includes the 15 EU Members before the 1 May 2004 excluding Austria, Greece, Luxembou2. 1998 instead of 1995. 4. OECD includes countries in footnote 3 excluding Belgium and Netherlands, and including Can
Source: OECD, STAN Indicators 2005.
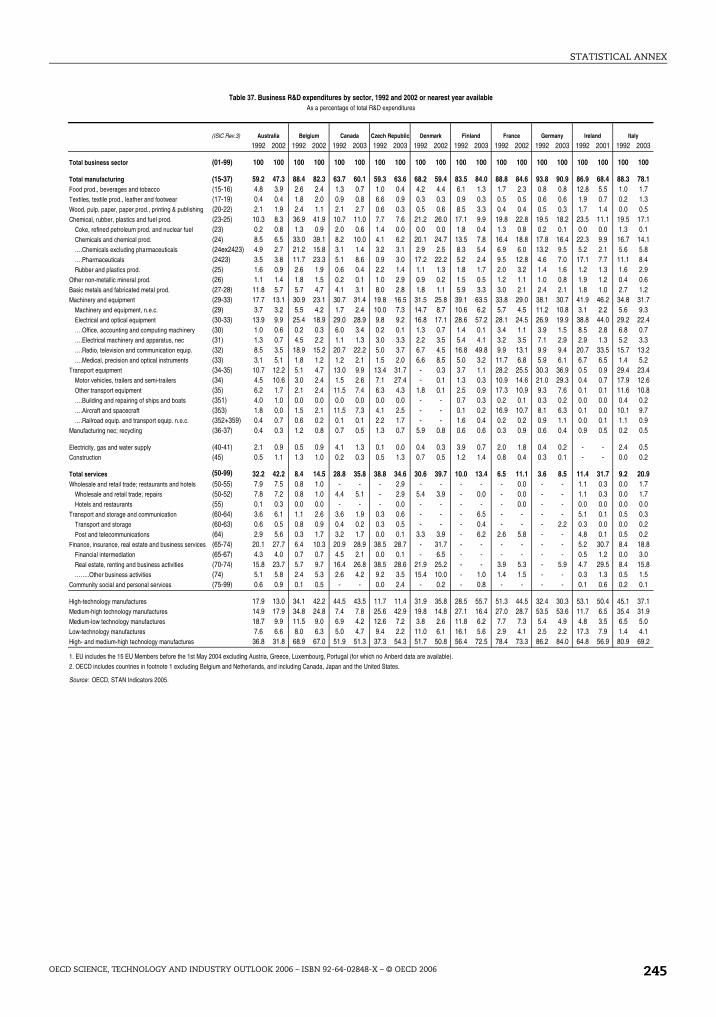
STATISTICAL ANNEX
y
2003
100
78.11.71.30.5
17.10.1
14.15.88.42.90.61.2
31.79.322.40.73.3
13.25.223.412.610.80.29.70.90.5
0.50.2
20.91.71.70.00.30.20.218.83.0
15.81.50.1
37.131.95.04.169.2
Table 37. Business R&D expenditures by sector, 1992 and 2002 or nearest year availableAs a percentage of total R&D expenditures
(ISIC Rev.3) Australia Belgium Canada Czech Republic Denmark Finland France Germany Ireland Ital
1992 2002 1992 2002 1992 2003 1992 2003 1992 2002 1992 2003 1992 2002 1992 2003 1992 2001 1992
Total business sector (01-99) 100 100 100 100 100 100 100 100 100 100 100 100 100 100 100 100 100 100 100
Total manufacturing (15-37) 59.2 47.3 88.4 82.3 63.7 60.1 59.3 63.6 68.2 59.4 83.5 84.0 88.8 84.6 93.8 90.9 86.9 68.4 88.3Food prod., beverages and tobacco (15-16) 4.8 3.9 2.6 2.4 1.3 0.7 1.0 0.4 4.2 4.4 6.1 1.3 1.7 2.3 0.8 0.8 12.8 5.5 1.0Textiles, textile prod., leather and footwear (17-19) 0.4 0.4 1.8 2.0 0.9 0.8 6.6 0.9 0.3 0.3 0.9 0.3 0.5 0.5 0.6 0.6 1.9 0.7 0.2Wood, pulp, paper, paper prod., printing & publishing (20-22) 2.1 1.9 2.4 1.1 2.1 2.7 0.6 0.3 0.5 0.6 8.5 3.3 0.4 0.4 0.5 0.3 1.7 1.4 0.0Chemical, rubber, plastics and fuel prod. (23-25) 10.3 8.3 36.9 41.9 10.7 11.0 7.7 7.6 21.2 26.0 17.1 9.9 19.8 22.8 19.5 18.2 23.5 11.1 19.5
Coke, refined petroleum prod. and nuclear fuel (23) 0.2 0.8 1.3 0.9 2.0 0.6 1.4 0.0 0.0 0.0 1.8 0.4 1.3 0.8 0.2 0.1 0.0 0.0 1.3Chemicals and chemical prod. (24) 8.5 6.5 33.0 39.1 8.2 10.0 4.1 6.2 20.1 24.7 13.5 7.8 16.4 18.8 17.8 16.4 22.3 9.9 16.7….Chemicals excluding pharmaceuticals (24ex2423) 4.9 2.7 21.2 15.8 3.1 1.4 3.2 3.1 2.9 2.5 8.3 5.4 6.9 6.0 13.2 9.5 5.2 2.1 5.6….Pharmaceuticals (2423) 3.5 3.8 11.7 23.3 5.1 8.6 0.9 3.0 17.2 22.2 5.2 2.4 9.5 12.8 4.6 7.0 17.1 7.7 11.1Rubber and plastics prod. (25) 1.6 0.9 2.6 1.9 0.6 0.4 2.2 1.4 1.1 1.3 1.8 1.7 2.0 3.2 1.4 1.6 1.2 1.3 1.6
Other non-metallic mineral prod. (26) 1.1 1.4 1.8 1.5 0.2 0.1 1.0 2.9 0.9 0.2 1.5 0.5 1.2 1.1 1.0 0.8 1.9 1.2 0.4Basic metals and fabricated metal prod. (27-28) 11.8 5.7 5.7 4.7 4.1 3.1 8.0 2.8 1.8 1.1 5.9 3.3 3.0 2.1 2.4 2.1 1.8 1.0 2.7Machinery and equipment (29-33) 17.7 13.1 30.9 23.1 30.7 31.4 19.8 16.5 31.5 25.8 39.1 63.5 33.8 29.0 38.1 30.7 41.9 46.2 34.8
Machinery and equipment, n.e.c. (29) 3.7 3.2 5.5 4.2 1.7 2.4 10.0 7.3 14.7 8.7 10.6 6.2 5.7 4.5 11.2 10.8 3.1 2.2 5.6Electrical and optical equipment (30-33) 13.9 9.9 25.4 18.9 29.0 28.9 9.8 9.2 16.8 17.1 28.6 57.2 28.1 24.5 26.9 19.9 38.8 44.0 29.2….Office, accounting and computing machinery (30) 1.0 0.6 0.2 0.3 6.0 3.4 0.2 0.1 1.3 0.7 1.4 0.1 3.4 1.1 3.9 1.5 8.5 2.8 6.8….Electrical machinery and apparatus, nec (31) 1.3 0.7 4.5 2.2 1.1 1.3 3.0 3.3 2.2 3.5 5.4 4.1 3.2 3.5 7.1 2.9 2.9 1.3 5.2….Radio, television and communication equip. (32) 8.5 3.5 18.9 15.2 20.7 22.2 5.0 3.7 6.7 4.5 16.8 49.8 9.9 13.1 9.9 9.4 20.7 33.5 15.7….Medical, precision and optical instruments (33) 3.1 5.1 1.8 1.2 1.2 2.1 1.5 2.0 6.6 8.5 5.0 3.2 11.7 6.8 5.9 6.1 6.7 6.5 1.4
Transport equipment (34-35) 10.7 12.2 5.1 4.7 13.0 9.9 13.4 31.7 - 0.3 3.7 1.1 28.2 25.5 30.3 36.9 0.5 0.9 29.4Motor vehicles, trailers and semi-trailers (34) 4.5 10.6 3.0 2.4 1.5 2.6 7.1 27.4 - 0.1 1.3 0.3 10.9 14.6 21.0 29.3 0.4 0.7 17.9Other transport equipment (35) 6.2 1.7 2.1 2.4 11.5 7.4 6.3 4.3 1.8 0.1 2.5 0.9 17.3 10.9 9.3 7.6 0.1 0.1 11.6….Building and repairing of ships and boats (351) 4.0 1.0 0.0 0.0 0.0 0.0 0.0 0.0 - - 0.7 0.3 0.2 0.1 0.3 0.2 0.0 0.0 0.4….Aircraft and spacecraft (353) 1.8 0.0 1.5 2.1 11.5 7.3 4.1 2.5 - - 0.1 0.2 16.9 10.7 8.1 6.3 0.1 0.0 10.1….Railroad equip. and transport equip. n.e.c. (352+359) 0.4 0.7 0.6 0.2 0.1 0.1 2.2 1.7 - - 1.6 0.4 0.2 0.2 0.9 1.1 0.0 0.1 1.1
Manufacturing nec; recycling (36-37) 0.4 0.3 1.2 0.8 0.7 0.5 1.3 0.7 5.9 0.8 0.6 0.6 0.3 0.9 0.6 0.4 0.9 0.5 0.2
Electricity, gas and water supply (40-41) 2.1 0.9 0.5 0.9 4.1 1.3 0.1 0.0 0.4 0.3 3.9 0.7 2.0 1.8 0.4 0.2 - - 2.4Construction (45) 0.5 1.1 1.3 1.0 0.2 0.3 0.5 1.3 0.7 0.5 1.2 1.4 0.8 0.4 0.3 0.1 - - 0.0
Total services (50-99) 32.2 42.2 8.4 14.5 28.8 35.8 38.8 34.6 30.6 39.7 10.0 13.4 6.5 11.1 3.6 8.5 11.4 31.7 9.2Wholesale and retail trade; restaurants and hotels (50-55) 7.9 7.5 0.8 1.0 - - - 2.9 - - - - - 0.0 - - 1.1 0.3 0.0
Wholesale and retail trade; repairs (50-52) 7.8 7.2 0.8 1.0 4.4 5.1 - 2.9 5.4 3.9 - 0.0 - 0.0 - - 1.1 0.3 0.0Hotels and restaurants (55) 0.1 0.3 0.0 0.0 - - - 0.0 - - - - - 0.0 - - 0.0 0.0 0.0
Transport and storage and communication (60-64) 3.6 6.1 1.1 2.6 3.6 1.9 0.3 0.6 - - - 6.5 - - - - 5.1 0.1 0.5Transport and storage (60-63) 0.6 0.5 0.8 0.9 0.4 0.2 0.3 0.5 - - - 0.4 - - - 2.2 0.3 0.0 0.0Post and telecommunications (64) 2.9 5.6 0.3 1.7 3.2 1.7 0.0 0.1 3.3 3.9 - 6.2 2.6 5.8 - - 4.8 0.1 0.5
Finance, insurance, real estate and business services (65-74) 20.1 27.7 6.4 10.3 20.9 28.9 38.5 28.7 - 31.7 - - - - - - 5.2 30.7 8.4Financial intermediation (65-67) 4.3 4.0 0.7 0.7 4.5 2.1 0.0 0.1 - 6.5 - - - - - - 0.5 1.2 0.0Real estate, renting and business activities (70-74) 15.8 23.7 5.7 9.7 16.4 26.8 38.5 28.6 21.9 25.2 - - 3.9 5.3 - 5.9 4.7 29.5 8.4……..Other business activities (74) 5.1 5.8 2.4 5.3 2.6 4.2 9.2 3.5 15.4 10.0 - 1.0 1.4 1.5 - - 0.3 1.3 0.5
Community social and personal services (75-99) 0.6 0.9 0.1 0.5 - - 0.0 2.4 - 0.2 - 0.8 - - - - 0.1 0.6 0.2
High-technology manufactures HTM 17.9 13.0 34.1 42.2 44.5 43.5 11.7 11.4 31.9 35.8 28.5 55.7 51.3 44.5 32.4 30.3 53.1 50.4 45.1Medium-high technology manufactures MHTM 14.9 17.9 34.8 24.8 7.4 7.8 25.6 42.9 19.8 14.8 27.1 16.4 27.0 28.7 53.5 53.6 11.7 6.5 35.4Medium-low technology manufactures MLTM 18.7 9.9 11.5 9.0 6.9 4.2 12.6 7.2 3.8 2.6 11.8 6.2 7.7 7.3 5.4 4.9 4.8 3.5 6.5Low-technology manufactures LTM 7.6 6.6 8.0 6.3 5.0 4.7 9.4 2.2 11.0 6.1 16.1 5.6 2.9 4.1 2.5 2.2 17.3 7.9 1.4High- and medium-high technology manufactures HMHTM 36.8 31.8 68.9 67.0 51.9 51.3 37.3 54.3 51.7 50.8 56.4 72.5 78.4 73.3 86.2 84.0 64.8 56.9 80.9
1. EU includes the 15 EU Members before the 1st May 2004 excluding Austria, Greece, Luxembourg, Portugal (for which no Anberd data are available).
2. OECD includes countries in footnote 1 excluding Belgium and Netherlands, and including Canada, Japan and the United States.
Source: OECD, STAN Indicators 2005.
OECD SCIENCE, TECHNOLOGY AND INDUSTRY OUTLOOK 2006 – ISBN 92-64-02848-X – © OECD 2006 245

STATISTICAL ANNEX
D2
2001
100
74.01.40.31.3
14.80.512.75.27.51.50.71.8
36.85.4
31.45.04.015.27.2
16.311.44.9---
0.6
--
24.0-
6.5---------
39.126.74.73.665.9
564574
Table 37. Business R&D expenditures by sector, 1992 and 2002 or nearest year available (cont'd)As a percentage of total R&D expenditures
(ISIC Rev.3) Korea Netherlands Norway Poland Spain SwedenUnited
Kingdom United States EU1 OEC
1995 2003 1992 2002 1992 2003 1994 2002 1992 2002 1992 2003 1992 2002 1992 2002 1992 2001 1992
Total business sector (01-99) 100 100 100 100 100 100 100 100 100 100 100 100 100 100 100 100 100 100 100
Total manufacturing (15-37) 83.3 85.6 89.4 76.0 61.8 50.5 71.9 81.1 77.3 68.4 86.5 87.9 80.3 77.3 75.7 59.2 88.2 83.4 83.2Food prod., beverages and tobacco (15-16) 1.4 1.5 5.6 6.2 2.9 5.7 1.5 1.8 3.0 2.9 1.3 0.6 2.8 2.3 1.2 1.1 1.8 1.8 1.6Textiles, textile prod., leather and footwear (17-19) 0.7 0.9 0.4 0.3 0.3 0.8 3.7 1.2 0.7 1.6 0.1 0.1 0.3 0.1 0.2 0.1 0.5 0.6 0.5Wood, pulp, paper, paper prod., printing & publishing (20-22) 0.5 0.5 0.3 0.9 2.4 3.2 0.7 0.7 0.7 0.9 3.0 2.1 0.5 0.3 1.3 1.8 0.7 0.6 1.1Chemical, rubber, plastics and fuel prod. (23-25) 10.6 9.0 38.5 19.8 17.0 7.5 16.2 32.9 17.6 20.5 16.9 21.8 29.9 32.1 15.9 12.1 22.4 22.1 18.3
Coke, refined petroleum prod. and nuclear fuel (23) 1.3 1.1 2.9 0.2 1.7 0.1 2.3 0.9 1.4 1.0 0.2 0.2 3.1 2.0 1.9 0.6 1.2 0.7 1.5Chemicals and chemical prod. (24) 8.1 7.0 34.8 18.8 15.0 6.6 11.0 28.3 14.3 18.1 15.9 21.1 26.5 29.6 12.9 10.7 19.7 19.6 15.3….Chemicals excluding pharmaceuticals (24ex2423) 6.7 5.1 26.8 10.4 7.8 3.8 8.8 10.0 5.2 5.2 2.7 1.6 8.8 4.4 6.2 3.3 10.1 7.0 7.8….Pharmaceuticals (2423) 1.4 2.0 8.0 8.4 7.2 2.8 2.3 18.3 9.1 13.0 13.1 19.5 17.7 25.2 6.7 7.3 9.6 12.6 7.5Rubber and plastics prod. (25) 1.3 0.9 0.9 0.9 0.4 0.8 2.9 3.7 1.9 1.3 0.8 0.4 0.3 0.5 1.1 0.8 1.4 1.7 1.5
Other non-metallic mineral prod. (26) 1.0 0.7 0.4 0.7 0.7 0.7 0.9 1.2 1.4 1.4 0.3 0.3 0.5 0.4 0.4 0.2 0.9 0.8 0.9Basic metals and fabricated metal prod. (27-28) 3.6 1.1 3.2 3.1 6.7 5.1 5.4 4.2 2.2 3.3 2.5 2.3 1.6 0.8 1.3 0.9 2.6 2.1 2.7Machinery and equipment (29-33) 41.1 54.9 33.3 41.7 28.8 20.8 26.4 25.2 28.5 18.2 42.7 37.7 25.2 21.2 31.8 28.6 34.1 31.5 35.7
Machinery and equipment, n.e.c. (29) 5.1 5.0 2.8 10.6 7.1 7.1 13.9 9.0 6.2 6.6 10.0 7.0 6.3 5.9 3.0 3.3 8.0 7.9 5.6Electrical and optical equipment (30-33) 36.0 49.9 30.5 31.1 21.7 13.7 12.5 16.2 22.3 11.6 32.7 30.7 18.9 15.3 28.8 25.3 26.1 23.7 30.1….Office, accounting and computing machinery (30) 1.8 1.2 4.2 26.7 0.8 0.1 0.0 0.1 4.3 1.1 2.7 1.0 3.1 1.1 9.6 4.0 3.7 2.3 7.6….Electrical machinery and apparatus, nec (31) 1.9 1.7 13.9 1.7 3.0 2.3 5.4 9.2 2.2 3.9 2.0 2.1 6.4 3.5 2.3 1.1 5.7 3.1 4.8….Radio, television and communication equip. (32) 31.6 45.7 11.4 0.2 16.2 5.4 5.8 4.8 12.8 4.4 24.5 22.1 5.9 7.3 8.9 9.8 10.9 12.9 11.3….Medical, precision and optical instruments (33) 0.7 1.3 1.0 2.6 1.6 5.8 1.3 2.0 3.1 2.2 3.4 5.5 3.5 3.4 8.0 10.3 5.8 5.3 6.4
Transport equipment (34-35) 24.1 16.5 7.8 2.9 2.9 5.3 16.6 12.6 22.5 18.6 19.3 22.7 19.2 19.8 23.1 13.5 - 23.3 -Motor vehicles, trailers and semi-trailers (34) 21.1 12.7 5.9 2.3 0.4 1.8 5.2 6.2 12.7 9.6 14.2 18.9 7.8 7.1 8.3 7.9 - 16.0 -Other transport equipment (35) 3.0 3.8 1.9 0.6 2.5 3.5 11.4 6.4 9.7 9.0 5.1 3.8 11.4 12.7 14.8 5.6 10.7 7.3 10.9….Building and repairing of ships and boats (351) 1.4 1.4 0.1 0.4 2.0 3.1 1.1 1.2 2.1 1.8 0.3 0.1 0.2 0.7 0.0 0.0 - - -….Aircraft and spacecraft (353) 1.5 1.8 1.7 0.0 0.2 0.3 4.4 4.5 7.2 6.1 4.4 3.2 11.0 10.3 14.4 5.0 - - -….Railroad equip. and transport equip. n.e.c. (352+359) 0.1 0.5 0.0 0.2 0.3 0.1 5.9 0.7 0.5 1.1 0.5 0.4 0.2 1.7 0.3 0.6 - - -
Manufacturing nec; recycling (36-37) 0.2 0.4 - 0.5 - 1.4 0.5 1.3 0.6 0.9 0.3 0.3 0.3 0.4 - 0.8 - 0.6 -
Electricity, gas and water supply (40-41) 2.0 1.1 0.2 0.5 2.2 2.1 0.6 1.1 3.0 1.5 2.2 0.7 2.3 0.9 0.2 0.1 - - -Construction (45) 6.7 4.2 0.5 0.7 0.8 2.2 4.2 0.4 0.7 1.1 - 0.2 0.2 0.3 - 0.1 - - -
Total services (50-99) 7.6 9.0 7.0 19.5 19.1 33.4 14.4 12.5 17.1 27.3 10.5 10.4 14.7 20.2 24.3 39.1 8.1 14.4 14.7Wholesale and retail trade; restaurants and hotels (50-55) - 0.1 - - - 2.8 0.3 0.0 0.2 2.2 - 0.0 - - - - - - -
Wholesale and retail trade; repairs (50-52) - 0.1 - 5.4 0.6 2.8 0.3 0.0 0.2 2.0 - 0.0 - - - 13.0 - 0.7 -Hotels and restaurants (55) - 0.0 - - - 0.0 0.0 0.0 0.0 0.2 - 0.0 - - - - - - -
Transport and storage and communication (60-64) - 2.0 - 0.6 2.7 4.6 4.1 5.3 2.4 8.1 - 1.7 - - - - - - -Transport and storage (60-63) - 0.0 - 0.3 0.5 1.4 1.3 0.2 0.1 0.8 - 0.1 - - - 0.2 - - -Post and telecommunications (64) - 2.0 - 0.3 2.3 3.3 2.7 5.1 2.4 7.3 - 1.5 4.7 5.7 - - - - -
Finance, insurance, real estate and business services (65-74) - 6.6 - 13.3 15.7 26.0 5.5 5.1 14.1 15.6 - 7.9 - - - - - - -Financial intermediation (65-67) - 0.0 - 0.9 1.2 2.8 0.0 0.1 0.0 2.6 - 1.3 - - - 1.0 - - -Real estate, renting and business activities (70-74) - 6.6 - 12.3 14.5 23.2 5.5 5.0 14.1 13.0 - 6.5 9.6 13.8 - - - - -……..Other business activities (74) 1.3 1.2 - 3.3 7.4 6.0 0.0 0.1 5.8 6.2 - 0.3 1.1 2.7 - - - 2.0 -
Community social and personal services (75-99) - 0.2 4.8 0.2 - 0.0 4.5 2.1 0.3 1.3 - 0.9 0.2 0.1 - - - - -
High-technology manufactures HTM 37.0 52.0 26.3 37.9 26.1 14.4 13.8 29.7 36.3 26.8 48.2 51.4 41.2 47.3 47.6 36.6 39.9 39.4 43.1Medium-high technology manufactures MHTM 34.9 25.0 49.4 25.1 18.7 15.1 39.1 35.1 26.8 26.4 29.5 30.0 29.6 22.6 20.2 16.3 38.3 34.7 29.6Medium-low technology manufactures MLTM 8.6 5.3 7.5 5.2 11.4 9.8 12.6 11.2 9.1 8.8 4.1 3.4 5.7 4.3 4.7 2.6 6.4 5.7 6.7Low-technology manufactures LTM 2.9 3.4 - 7.8 - 11.1 6.5 5.0 5.0 6.4 4.7 3.1 3.9 3.1 - 3.8 - 3.6 -High- and medium-high technology manufactures HMHTM 73.3 78.4 75.8 63.4 46.7 32.7 54.0 66.1 65.3 55.0 77.9 81.5 70.9 70.6 67.8 52.8 78.5 74.5 72.9
1. EU includes the 15 EU Members before the 1st May 2004 excluding Austria, Greece, Luxembourg, Portugal (for which no Anberd data are available).
2. OECD includes countries in footnote 1 excluding Belgium and Netherlands, and including Canada, Japan and the United States.
Source: OECD, STAN Indicators 2005.
StatLink: http://dx.doi.org/10.1787/328332
OECD SCIENCE, TECHNOLOGY AND INDUSTRY OUTLOOK 2006 – ISBN 92-64-02848-X – © OECD 2006246

STATISTICAL ANNEX
420643
1990 1995 2000 2001 2002 2003
Australia 621 736 762 757 745 791
Austria 350 437 532 563 545 604
Belgium 412 519 560 582 574 637
Canada 823 837 745 729 719 783
Czech Republic1 297 193 239 256 272 289
Denmark 723 843 923 931 882 982
Finland 616 809 942 983 937 998
France 394 493 510 513 487 517
Germany2 511 467 529 530 508 537
Greece 135 194 265 304 307 342
Hungary 166 177 224 243 227 247
Iceland 349 591 548 610 671 702
Ireland 257 336 420 431 420 440
Italy 230 315 369 392 390 429
Japan 312 379 437 451 432 471
Korea 27 84 200 233 247 287
Mexico 13 21 30 32 33 36
Netherlands 681 798 783 786 775 831
New Zealand 653 665 784 742 712 751
Norway 572 678 711 721 687 731
Poland 105 118 140 149 158 177
Portugal 59 99 177 208 210 251
Slovak Republic - 212 186 177 174 175
Spain 175 288 367 382 384 401
Sweden 955 1 052 1 106 1 159 1 101 1 143
Switzerland 868 1 040 1 173 1 113 1 055 1 154
Turkey 13 28 52 60 73 88
United Kingdom 683 793 840 806 763 811
United States 766 761 695 704 679 726
Total OECD - 463 477 484 470 505
EU-15 426 499 551 556 537 573
China3 5 8 14 16 18 22
Israel 1 066 1 068 1 004 1 007 976 1 038
Russian Federation4 - 135 126 110 110 110
1. Includes articles from the former Czechoslavakia before 1996.
2. Includes articles from the former East Germany before 1992.
3. Includes articles from the Hong Kong economy before 2000.
4. Includes articles from the former USSR.
Source: National Science Foundation (2006), Science and Engineering Indicators 2006, Appendix table 5-41 and population from OECD, MSTI database, July 2006.
Table 38. Science and engineering articles by country, 1990–2003
Per million inhabitants
StatLink: http://dx.doi.org/10.1787/721650
OECD SCIENCE, TECHNOLOGY AND INDUSTRY OUTLOOK 2006 – ISBN 92-64-02848-X – © OECD 2006 247

STA
TIST
ICA
L AN
NEX
248
2003 1996 2003 1996 2003 1996 2003 1996 20038.6 1.8 3.9 4.2 2.0 4.7 4.6 4.5 56.2 1.6 1.3 1.2 2.7 2.8 2.4 0.8 1.47.4 1.7 2.2 1.4 2.3 2.2 2.6 1.6 2.46.6 1.6 3.7 3.1 1.4 4.9 4.2 5 58.4 1.8 1.1 2.3 2.8 4.0 2.3 0.3 0.64.3 1.2 1.4 0.9 1.5 2.5 2.6 1.6 2.37.9 1.0 2.0 2.1 1.5 1.3 2.5 2.9 4.48.6 3.2 1.0 0.9 4.7 1.6 1.8 0.6 0.87.7 1.7 2.0 1.7 2.2 1.7 1.9 1 1.4
12.1 2.5 0.8 0.5 2.6 2.3 3.1 1.8 1.57.6 2.4 0.8 1.1 4.2 2.3 1.6 1.2 0.63.2 0.9 3.1 4.9 1.6 3.0 1.9 4.1 6.37.3 1.8 1.3 2.7 2.2 4.2 4.8 3.2 3.28.0 1.7 0.9 0.7 2.8 1.0 1.2 0.6 0.8
12.1 0.8 0.4 0.6 1.3 0.4 0.5 0.2 0.220.7 1.6 0.3 0.3 1.8 1.2 0.9 0.9 1.2
7.6 0.0 1.1 0.0 1.6 4.1 4.3 9 8.88.4 1.5 1.5 2.1 2.1 1.7 2.1 4.4 2.45.7 1.2 4.0 3.5 1.4 3.4 4.0 2.9 4.35.1 1.1 4.8 4.5 1.5 4.7 4.9 5.3 5.95.8 1.2 3.4 2.6 1.5 5.2 5.6 2.7 4.98.7 2.4 0.4 0.6 3.4 0.9 0.7 0.6 0.2
15.8 2.5 0.8 1.4 3.4 2.8 1.4 1.4 16.8 1.5 2.3 2.7 2.4 8.9 7.5 0.3 0.67.4 2.3 1.1 0.9 3.5 1.1 1.9 0.8 1.47.1 1.0 2.2 1.8 1.5 1.8 2.6 2.6 4.46.2 1.2 1.3 1.3 1.6 1.5 2.4 0.8 1.6
10.9 0.7 0.8 1.0 1.0 2.0 1.6 1.3 1.77.1 1.2 3.1 2.6 1.6 5.3 6.1 5.2 6.27.0 1.6 3.7 4.1 1.8 4.7 4.6 6.7 6.5
8.2 1.6 2.5 2.7 2.0 3.4 3.3 2.6 3.97.6 1.8 2.0 1.7 2.5 2.7 3.0 1.7 2.2
16.8 3.6 0.4 0.8 3.6 1.4 0.8 2.6 1.77.3 3.5 3.1 3.3 3.9 3.8 3.7 3.2 3.78.5 1.7 0.8 0.8 3.5 1.1 1.6 0.2 0.2
Other1
Table 39. Portfolio of S&E articles by field, 1996 and 2003As a percentage of total publications
Socialsciences
Psychologyering &ology
Mathematics
StatLink: http://dx.doi.org/10.1787/838551411821
OEC
D SC
IENC
E, TEC
HN
OLO
GY
AN
D IN
DU
STR
Y O
UT
LOO
K 2006 – ISB
N 92-64-02848-X
– © O
ECD
2006
1996 2003 1996 2003 1996 2003 1996 2003 1996 2003 1996 2003 1996 2003 1996Australia 24 583 24 803 27.1 29.0 14.8 14.6 11.6 9.9 8.7 8.0 7.7 7.3 7.5 6.9 7.6Austria 3 618 4 906 41.9 42.3 14.2 12.9 5.3 5.0 9.3 9.1 14.2 12.4 3.5 4.4 5.2Belgium 5 583 6 604 34.5 31.5 15.1 13.7 7.4 8.5 12.3 11.1 14.2 13.3 4.1 5.0 5.5Canada 13 911 15 809 29.7 30.2 12.6 12.3 14.6 14.9 8.0 7.3 8.1 6.8 7.0 7.5 5.3Czech Republic 2 249 2 950 11.1 16.1 14.4 16.3 7.3 8.5 31.6 22.8 15.3 15.9 6.1 5.3 5.9Denmark 4 477 5 291 40.5 36.5 17.8 17.5 8.5 11.7 6.5 7.0 10.9 9.1 6.4 6.1 3.3Finland 4 354 5 202 43.6 35.9 13.5 13.2 9.0 10.5 7.4 7.5 8.6 9.6 4.9 5.1 5.5France 29 755 31 971 28.4 26.4 16.7 14.3 5.6 5.9 14.0 12.9 16.7 16.9 6.4 6.8 6.0Germany 39 123 44 305 28.3 31.3 15.1 13.7 5.3 5.3 15.8 12.4 19.2 16.8 4.6 5.4 5.7Greece 2 265 3 770 28.6 32.4 8.5 8.0 7.8 8.8 14.6 12.3 13.5 12.3 8.2 6.2 11.7Hungary 1 839 2 503 18.9 26.4 13.0 14.4 5.1 5.4 29.2 20.0 17.3 16.0 4.6 3.0 5.0Iceland 149 203 43.8 34.1 9.0 14.6 12.9 10.0 4.0 6.1 5.4 5.4 10.6 13.8 1.3Ireland 1 269 1 758 34.9 30.7 17.6 14.6 8.3 11.6 9.5 10.5 8.9 10.0 4.3 3.9 4.7Italy 19 342 24 696 38.4 34.8 13.3 12.3 4.3 4.9 12.7 11.5 16.5 16.7 4.9 6.2 5.9Japan 50 392 60 067 29.8 27.2 14.0 13.3 6.3 6.3 15.6 14.7 20.4 20.8 2.3 3.1 9.6Korea 4 728 13 746 12.3 17.0 10.0 12.0 2.7 4.3 22.2 16.5 28.2 22.7 2.4 2.8 18.1Luxembourg 20 46 46.0 29.9 20.5 13.1 2.5 12.8 5.7 4.7 5.7 12.9 6.5 3.2 0.0Mexico 2 124 3 747 20.3 17.5 12.1 12.0 13.5 15.6 11.1 9.8 22.6 21.2 6.6 7.4 4.3Netherlands 12 438 13 475 37.3 38.6 15.2 13.3 7.1 6.8 9.4 7.9 10.4 8.8 5.3 5.2 4.4New Zealand 2 684 3 034 28.0 25.3 10.2 9.5 23.7 23.5 6.7 5.3 3.9 4.2 8.7 10.1 3.2Norway 2 950 3 339 36.2 32.8 11.5 12.0 10.9 14.3 8.4 5.2 5.6 4.5 9.4 10.0 6.2Poland 4 597 6 770 13.6 15.5 8.6 8.7 4.8 6.1 28.5 25.4 29.1 26.8 4.2 4.1 6.7Portugal 1 090 2 625 16.8 13.4 13.5 13.5 10.4 12.3 17.5 16.4 15.3 16.6 4.8 5.5 13.5Slovak Republic 1 175 943 14.7 13.1 16.7 16.7 3.3 6.0 29.4 19.9 14.2 21.4 4.0 3.3 4.3Spain 12 234 16 826 27.3 24.5 14.9 13.0 10.6 12.0 19.4 17.8 13.0 11.9 4.9 5.5 4.9Sweden 9 697 10 237 41.7 36.5 15.5 15.4 7.0 7.5 8.2 8.5 10.2 10.0 5.2 4.4 5.0Switzerland 7 489 8 542 34.2 31.8 17.7 16.0 4.6 5.6 12.2 12.5 17.5 14.5 4.8 6.6 4.2Turkey 2 206 6 224 41.6 44.6 6.7 7.2 4.5 7.6 16.6 11.2 8.7 8.9 5.7 4.6 11.2United Kingdom 47 904 48 288 33.5 32.1 15.0 14.2 6.3 6.2 9.3 8.2 10.1 9.3 5.3 6.0 6.1United States 201 798 211 233 31.2 31.2 16.8 16.3 6.1 6.6 7.5 7.5 9.4 8.8 5.5 5.9 6.4
Total OECD 516 043 583 913 31.0 30.2 15.4 14.4 6.8 7.1 10.9 10.3 12.6 12.3 5.2 5.6 6.5EU-15 193 172 220 002 32.9 31.6 15.1 13.7 6.3 6.8 12.4 11.1 14.0 13.3 5.2 5.7 5.7
China2 10 070 29 186 13.5 10.7 5.1 8.2 3.3 4.2 22.5 24.8 29.6 24.9 4.0 4.3 14.5Israel 5 815 6 941 33.0 32.3 12.2 13.0 7.0 6.9 6.8 7.4 16.3 14.9 3.1 3.2 7.3Russian Federation 18 464 15 782 4.4 3.5 14.5 7.6 5.2 3.5 23.9 27.2 36.4 35.6 5.4 8.0 6.4
1. Other: health sciences and professional fields.2. China includes Hong Kong.
All fields(total number)
Clinicalmedicine
Source: National Science Foundation (2006), Science and Engineering Indicators 2006, Appendix table 5-44 and Appendix table 5-45.
researchBiology Chemistry PhysicsBiomedical Earth & space Engine
sciences techn

OECD PUBLICATIONS, 2, rue André-Pascal, 75775 PARIS CEDEX 16
PRINTED IN FRANCE
(92 2006 08 1 P) ISBN 92-64-02848-X – No. 55277 2006

2006
OE
CD
Sc
ien
ce
, Tec
hn
olo
gy a
nd
Ind
ustry
Ou
tloo
k
ISBN 92-64-02848-X92 2006 08 1 P
OECD Science, Technology and Industry Outlook
Science, technology and innovation have taken centre stage in efforts to boost economic growth and improve social well-being. OECD countries and non-members alike are introducing far-reaching reforms to strengthen investments in science, technology and innovation, and to enhance their contribution to national economies in a context of increasing globalisation. What types of reforms have they introduced and what are the main issues they aim to address? What emerging issues will policy makers need to address to improve future innovation capabilities? What policies can best stimulate the creation, diffusion, and exploitation of knowledge in all sectors of an increasingly competitive, global economy?
The OECD Science, Technology and Industry Outlook 2006 aims to answer such questions by offering a comprehensive review of key trends in science, technology and innovation policy, and reviewing recent policy developments in OECD countries. In addition to examining main trends across the OECD, the report delves into specific topics that are high on the agenda of innovation policy makers, including the role of intellectual property rights and technology licensing markets in innovation performance, policies to enhance benefits of the globalisation of business R&D, human resources for science and technology, and the evaluation of innovation policy. While retaining its focus on developments in OECD countries, this edition of this biennial publication highlights key developments in a number of important non-member economies, including China, Russia and South Africa. A statistical annex provides up-to-date statistics on R&D funding, patents, researchers and other indicators of innovative performance.
www.oecd.org/sti
-:HSTCQE=UW]Y]\:2006
The full text of this book is available on line via these links:
http://www.sourceoecd.org/industrytrade/926402848Xhttp://www.sourceoecd.org/scienceIT/926402848Xhttp://www.sourceoecd.org/industry/926402848X
Those with access to all OECD books on line should use this link: http://www.sourceoecd.org/926402848X
SourceOECD is the OECD’s online library of books, periodicals and statistical databases. For more information about this award-winning service and free trials ask your librarian, or write to us at [email protected].
OECD Science, Technology and Industry Outlook
2006
«922006081cov.indd 1 08-Nov-2006 11:36:21 AM