oecd handbook for internationally comparative education
TRANSCRIPT

OECD Handbook for Internationally Comparative Education Statistics 2018CONCEPTS, STANDARDS, DEFINITIONS AND CLASSIFICATIONSO
EC
D H
and
bo
ok fo
r Internatio
nally C
om
parative E
ducatio
n Statistics 2018 C
ON
CE
PT
S, S
TAN
DA
RD
S,
DE
FIN
ITIO
NS
AN
D C
LA
SS
IFIC
AT
ION
S

OECD Handbook for Internationally
Comparative Education Statistics
2018
CONCEPTS, STANDARDS, DEFINITIONS AND CLASSIFICATIONS
This work is published under the responsibility of the Secretary-General of the OECD. The
opinions expressed and arguments employed herein do not necessarily reflect the official
views of OECD member countries.
This document, as well as any data and any map included herein, are without prejudice
to the status of or sovereignty over any territory, to the delimitation of international
frontiers and boundaries and to the name of any territory, city or area.
Please cite this publication as:OECD (2018), OECD Handbook for Internationally Comparative Education Statistics 2018: Concepts,Standards, Definitions and Classifications, OECD Publishing, Paris.https://doi.org/10.1787/9789264304444-en
ISBN 978-92-64-30443-7 (print)ISBN 978-92-64-30444-4 (PDF)
The statistical data for Israel are supplied by and under the responsibility of the relevant Israeli authorities. The useof such data by the OECD is without prejudice to the status of the Golan Heights, East Jerusalem and Israelisettlements in the West Bank under the terms of international law.
Photo credits: Cover © Christopher Futcher/iStock, © Marc Romanelli/Gettyimages, © michaeljung/Shutterstock,© Pressmaster/Shutterstock.
Corrigenda to OECD publications may be found on line at: www.oecd.org/about/publishing/corrigenda.htm.
© OECD 2018
You can copy, download or print OECD content for your own use, and you can include excerpts from OECD publications, databases and
multimedia products in your own documents, presentations, blogs, websites and teaching materials, provided that suitable
acknowledgment of the source and copyright owner(s) is given. All requests for public or commercial use and translation rights should be
submitted to [email protected]. Requests for permission to photocopy portions of this material for public or commercial use shall be
addressed directly to the Copyright Clearance Center (CCC) at [email protected] or the Centre francais d’exploitation du droit de copie
(CFC) at [email protected].
FOREWORD │ 3
OECD HANDBOOK FOR INTERNATIONALLY COMPARATIVE EDUCATION STATISTICS 2018 © OECD 2018
Foreword
International comparative analysis has increasingly become a key pillar in governments’
education policy development. Through cooperation within the OECD framework, and
other international bodies, countries are seeking to learn from each other about how to
secure the benefits of education for all, how to foster competencies for the knowledge
society, and how to manage teaching and learning in order to promote learning
throughout life.
This attention has resulted in a major effort by the OECD to strengthen the collection and
reporting of comparative statistics and indicators in the field of education. Over the past
25 years, the OECD has developed and published a broad range of comparative indicators
that provide insights into the functioning of education systems, in particular through its
flagship annual publication, Education at a Glance. These indicators reflect both the
resources invested in education and their returns to individuals and societies. The OECD
education indicators provide information on many important features of the operation,
evolution and impact of education, from early childhood through formal education to
learning and training throughout life. They provide an opportunity for each country to see
its education system in the light of other countries’ performance and view themselves
compared with other countries’ practices and resources.
Over the years, various methodologies and data collection instruments have been
developed to facilitate international comparisons in the different educational areas. This
handbook draws these methodologies together and so provides a reference source for the
international standards, concepts, classifications and conventions being used in the
regular core Education at a Glance 2018 indicators.
This handbook’s target audience includes users of OECD statistics and education
indicators from the research community or national ministries involved in the compilation
of international statistical comparisons of education. It provides the definitions and
conventions used in the underlying data collections as well as the methodologies used to
compile the published statistics and indicators derived from them. By also providing
advice on data-quality issues, the handbook provides an essential aid to the effective use
of the statistics and indicators on education that the OECD produces. Secondly, this
handbook offers a unique reference source of standards and conventions for others to
adopt in their own compilation of international statistics and indicators on education.
The handbook is the product of a long-standing collaborative effort between OECD
member governments, the experts and institutions working within the framework of
OECD’s Indicators of Education Systems (INES) Programme, and the OECD Secretariat.
It was prepared by the Innovation and Measuring Progress Division (IMEP) of the OECD
Directorate for Education and Skills. Much of the material contained in it is adapted from
data collection documentation developed over the years, and in co-operation with the
INES team at the OECD: Deborah Roseveare (Head of Division), Marie-Helene Doumet
(Head of the INES programme), Karinne Logez (Co-ordinator of the Handbook), Etienne

4 │ FOREWORD
OECD HANDBOOK FOR INTERNATIONALLY COMPARATIVE EDUCATION STATISTICS 2018 © OECD 2018
Albiser, Eric Charbonnier, Manon Costinot, Camila De Moraes, Valérie Forges, Corinne
Heckmann, Simon Normandeau, Gara Rojas González, Daniel Sanchez Serra, Markus
Schwabe and Giovanni Maria Semeraro.

TABLE OF CONTENTS │ 5
OECD HANDBOOK FOR INTERNATIONALLY COMPARATIVE EDUCATION STATISTICS 2018 © OECD 2018
Table of contents
Foreword ................................................................................................................................................ 3
Executive summary ............................................................................................................................... 7
Chapter 1. Introduction ................................................................................................................... 9
1.1. Purpose of the handbook ............................................................................................................... 9 1.2. Target audience and using the handbook .................................................................................... 10 1.3. Structure of the handbook ........................................................................................................... 10 References .......................................................................................................................................... 11
Chapter 2. Conceptual framework for data collection for education statistics and
indicators 13
2.1. The development of international educational statistics and indicators ...................................... 14 2.2. The organising framework for the OECD education indicators ................................................. 15 2.3. Overview of current regular data collections and data sources................................................... 18 References .......................................................................................................................................... 20
Chapter 3. Scope and coverage of internationally comparable education statistics ................. 23
3.1. Definition of education ............................................................................................................... 24 3.2. The scope of the OECD's international education statistics ....................................................... 24 3.3. Coverage issues, specific inclusions and exclusions .................................................................. 25 3.4. Challenges in measuring student mobility .................................................................................. 30 References .......................................................................................................................................... 31
Chapter 4. Definitions and classifications of the OECD international education statistics ..... 33
4.1. Students and graduates ................................................................................................................ 34 4.2. Educational personnel ................................................................................................................. 41 4.3. School organisation and curriculum ........................................................................................... 51 4.4. Educational institutions ............................................................................................................... 54 4.5. Educational expenditure.............................................................................................................. 58 References .......................................................................................................................................... 75
Chapter 5. Definition and classification of educational programmes: The practical
implementation of ISCED 2011 .......................................................................................................... 77
5.1. Overview of ISCED 2011 ........................................................................................................... 78 5.2. Definition and classification of educational programmes ........................................................... 79 5.3. Detailed description of ISCED levels and application of the classification criteria ................... 85 5.4. Country ISCED mappings .......................................................................................................... 87 References .......................................................................................................................................... 87
Data quality .................................................................................................................. 89 Chapter 6.
6.1. OECD dimensions of data quality .............................................................................................. 89
6 │ TABLE OF CONTENTS
OECD HANDBOOK FOR INTERNATIONALLY COMPARATIVE EDUCATION STATISTICS 2018 © OECD 2018
6.2. Types (or causes) of data-quality issues ..................................................................................... 90 6.3. Tackling data-quality issues ........................................................................................................ 92 6.4. Suggestions for the estimation of missing data ........................................................................... 93 6.5. Remaining areas for data-quality improvement .......................................................................... 94 References .......................................................................................................................................... 96
Chapter 7. Indicator concepts and methodologies ........................................................................... 97
7.1. General/international averages .................................................................................................... 98 7.2. Graduation analysis ..................................................................................................................... 99 7.3. Educational attainment of the population ................................................................................. 102 7.4. Labour force participation ......................................................................................................... 103 7.5. Economic and social benefits of education ............................................................................... 105 7.6. Expenditure analysis ................................................................................................................. 112 7.7. Participation and access to education ....................................................................................... 128 7.8. Participation of adults in education ........................................................................................... 137 7.9. Learning environment and teacher working conditions analysis .............................................. 138 7.10. Education and work status of young people: The NEET rate ................................................. 144 7.11. Equity in education: Intergenerational mobility indicators ..................................................... 145 References ........................................................................................................................................ 147
Tables
Table 4.1. List of study areas (subjects) used in the questionnaire: ...................................................... 52 Table 4.2. Source of funding for educational goods and services by location of the service provider . 60 Table 5.1. ISCED 2011 and ISCED-97 levels compared ...................................................................... 80 Table 5.2. Typical duration of ISCED 2011 levels ............................................................................... 82 Table 5.3. Typical cumulative duration of primary and secondary education ...................................... 82 Table 5.4. Criteria for classifying educational programmes ................................................................. 85
Figures
Figure 2.1. Organising framework of indicators in Education at a Glance ........................................... 16 Figure 3.1. Taxonomy of formal vocational education and training programmes ................................ 29 Figure 7.1. Sources of funds considered in the calculation of public, private and international
expenditure on educational institutions ....................................................................................... 114 Figure 7.2. Sources of funds considered in the calculation of total public expenditure on
educational as a share of total government expenditure .............................................................. 121 Figure 7.3. What current and capital expenditure on education covers ............................................... 124
Boxes
Box 3.1. Other types of education outside the scope of international education statistics .................... 25

EXECUTIVE SUMMARY │ 7
OECD HANDBOOK FOR INTERNATIONALLY COMPARATIVE EDUCATION STATISTICS 2018 © OECD 2018
Executive summary
The growing interest in international education statistics has created a need to maintain
clear definitions of the concepts and methodologies which underlie them. This handbook
presents in detail the methodologies used to calculate the regular core indicators in
Education at a Glance, following commonly agreed definitions. It sets out the underlying
conceptual framework used by the OECD as the basis for its international statistics and
provides a reference for the international standards and conventions used in the collection
and assimilation of educational data.
This edition updates previous editions of the OECD Handbook for Internationally
Comparative Education Statistics. It sets out the concepts, definitions, classifications and
methodologies that ground the OECD’s work on regular core education statistics and
indicators in the 2018 edition of Education at a Glance (EAG). The original handbook
was released in May 2004, and the first update was released in September 2017, based on
2017 edition of Education at a Glance. Between 2004 and 2017, significant work had
been carried out on the education indicators in the original handbook, existing indicators
had been consolidated and new ones developed, while the methodologies and concepts
underlying them have been clarified and the International Standard Classification of
Education (ISCED) had also been revised to reflect the changes in education systems over
the last 15 years.
Between 2017 and 2018, further significant work has been carried out to consolidate
existing indicators, and this edition also clarifies their underlying methodologies and
concepts This handbook provides a thorough understanding of how the methodologies
work, and the limitations and interpretation of the resulting data. Each indicator is
complemented by an analysis of its limitations and comparability, based on a thorough
understanding of the calculation methodologies and frameworks and how they play out in
the context of national educational systems.
Chapter 1 introduces the purpose of the handbook, its target audience and the
structure of the publication.
Chapter 2 presents the conceptual framework used to collect the data used for
education statistics and indicators. It outlines the development of international
educational statistics and indicators, the organising framework used for OECD
education indicators, and gives an overview of current regular data collections and
data sources.
Chapter 3 outlines the scope and coverage of the OECD’s internationally
comparable education statistics. Starting with a precise definition of the term
“education”, it clarifies the boundary issues: what the statistics cover, and specific
inclusions and exclusions. It concentrates on early childhood programmes, special
needs education, non-regular or adult education, and vocational and professional
education. It also presents the challenges of identifying and classifying
internationally mobile students.
Chapter 4 catalogues the definitions and classifications used for the OECD’s
international education statistics. It covers students and graduates, educational
8 │ EXECUTIVE SUMMARY
OECD HANDBOOK FOR INTERNATIONALLY COMPARATIVE EDUCATION STATISTICS 2018 © OECD 2018
personnel, school organisation and curricula, educational institutions, and
educational expenditure.
Chapter 5 looks back at the definition and classification of educational
programmes and the practical implementation of ISCED. It provides an overview
of the latest standard, ISCED 2011, and how it defines and classifies educational
programmes and the boundaries between them. It also covers how individual
national programmes are mapped onto ISCED levels.
Chapter 6 focuses on data quality issues. It presents the OECD Quality
Framework, and eight quality considerations: relevance, accuracy, credibility,
timeliness, accessibility, interpretability, coherence and cost-efficiency. It
considers how data quality issues arise and how to tackle them, and suggests what
estimations can be made where data are missing. It also examines the remaining
areas for data quality improvement.
Chapter 7 presents the concepts behind the current core Indicators of Education
Systems (INES) indicators and how they are calculated. It looks at
general/international averages, graduation analysis, educational attainment of the
population, labour force participation, economic and social benefits of education,
expenditure analysis, participation and access to education, participation of adults
in education, learning environments and teachers’ working conditions, the
education and work status of young people, and equity in education. For each of
these it considers the policy context and the relevance of the indicator, and
explains the calculation methodology used. It also considers the limitations of the
indicator, presenting, as needed, any measurement issues, technical definitions,
notes on coverage and notes on interpretation, in order to improve understanding
of how the indicators may be used.

1 - INTRODUCTION │ 9
OECD HANDBOOK FOR INTERNATIONALLY COMPARATIVE EDUCATION STATISTICS 2018 © OECD 2018
Chapter 1. Introduction
Countries see a successful education system as a vital element of their social and
economic development. Human capital has long been identified as a key factor in battling
unemployment and low pay and there is also robust evidence that it is an important
determinant of economic growth. Moreover, there is emerging evidence that it is
associated with a wide range of non-economic benefits, including improvements in
health, stronger civic and social engagement, and a greater sense of well-being.
The development of effective education policies is therefore a priority for national
governments and they are increasingly looking to the international arena to inform and
influence their policy reforms. As part of the drive to enhance the OECD’s contribution in
this area, the OECD’s Directorate for Education and Skills devotes a major effort to the
development and analysis of quantitative and qualitative indicators, the results of which
are published in the flagship annual publication Education at a Glance. These enable
governments to analyse their education system in light of other countries’ performances.
Together with other OECD publications, the indicators are designed to support and
review efforts which governments are making towards policy reform.
Indicators from Education at a Glance reflect the progressive development of international
comparisons in education that has taken place over the last 25 years or so. Fundamental to
this development is the quality of the underlying data which is itself driven by the definition
of clear concepts, conventions and methodologies which underlie the data collections and
the calculations of the indicators. This handbook draws together all of these methodologies
in a single publication which is annually aligned to the regular core indicators of Education at
a Glance. In doing so, its aim is to facilitate a greater understanding of the statistics and
indicators produced and hence allow for their effective use in policy analysis.
The handbook therefore provides answers to questions such as “What do we mean by a
teacher?” and “What do we mean by public education expenditure?” as well as to questions
concerning the use of the indicators such as “How should I interpret expenditure per
student?” and “Are there data-quality issues I should be aware of?”
While much has been achieved in improving the international comparability of the
statistics, there is still plenty to be done and the handbook acknowledges this. Through its
networking with member countries and other international organisations, the OECD is
progressively working to address the areas of ambiguity that remain. The OECD will
publish further editions of the handbook as it makes updates and improvements.
1.1. Purpose of the handbook
This handbook has the following key objectives:
To set out the conceptual framework used by the OECD as the basis for the
international statistics and indicators it compiles and disseminates.
10 │ 1 - INTRODUCTION
OECD HANDBOOK FOR INTERNATIONALLY COMPARATIVE EDUCATION STATISTICS 2018 © OECD 2018
To document the international standards for concepts, classifications, conventions
and methodologies that the OECD applies in the collection and compilation of
education statistics and indicators.
To provide standards for others to follow in the collection, organisation and
international comparison of education statistics and indicators.
The handbook is not intended as a data collection manual but rather as a reference from
which such manuals can be compiled. For that reason it makes no detailed reference to
the current OECD data collection instruments and how they should be completed by
respondents. That task is fulfilled by the existing data collection manuals.
Importantly, the revision of the handbook has also provided an opportunity to review the
existing definitions that are used in the OECD data collections and seek improvements
where possible.
1.2. Target audience and using the handbook
It follows from these objectives that this handbook is intended for users of OECD
international statistics and education indicators, and for those involved in compiling
international data on education.
The users of the statistics and indicators will often be readers of Education at a Glance
but will also be those who access OECD education data in other ways, for example via
the OECD’s Education at a Glance Database (http://stats.oecd.org/ (OECD, 2018[1])) or
via the OECD data portal (https://data.oecd.org/education.htm (OECD, 2018[2])). For
them, the handbook aims to create a better understanding of the educational statistics and
indicators produced by the OECD and facilitate their use. The catalogue of data definitions
and classifications used in the underlying data collections as well as the concepts and
methodologies that are used to compile the statistics and indicators are vital in this regard.
The descriptions of country reporting practices are also important, particularly the
mappings of national educational programmes to the international classification, which
are published in Annex 2. Also key is an appreciation of the data-quality controls that are
applied in the collection and compilation of the statistics as well as knowledge of where
data quality is weakest. The handbook meets all of these needs.
For those involved in collecting and compiling international data on education, the
handbook provides a comprehensive reference for the established international standards
and conventions used by the OECD in the regular core indicators from Education at a
Glance, offering standards which they might follow. Greater consistency across
international collections can only enrich the collective data that are available at the
international level.
Finally, the transparency provided by explaining methodologies and highlighting remaining
data-quality problems presents an opportunity for debate about what improvements can
be made and how they can be achieved.
1.3. Structure of the handbook
Chapter 2 sets out the conceptual framework for international education statistics and
indicators which have driven the development of definitions and the data collections. The
chapter begins by giving a short historical perspective of the development of OECD-
INES statistics and indicators on education and describes the organisation of the OECD
1 - INTRODUCTION │ 11
OECD HANDBOOK FOR INTERNATIONALLY COMPARATIVE EDUCATION STATISTICS 2018 © OECD 2018
Indicators of Education Systems (INES) Programme, which produces these indicators. It
also gives an overview of the latest data collection instruments and methods which
provide the data underpinning the statistics and indicators.
Chapter 3 sets out the coverage of the OECD-INES internationally comparable
statistics on education. It begins by defining education and proceeds to define the
coverage of the statistics which follows from that. In order to clarify the coverage, it
discusses various boundary issues around education, for instance in relation to early
childhood programmes and vocational and technical education.
Chapter 4 sets out the definitions and classifications used in the collection of OECD-INES
international education statistics, taking in turn students and graduates, educational
personnel, school organisation and the curriculum, educational institutions, and
educational expenditure. It provides key definitions along with discussion of the
interpretation and practical implementation of these definitions. It also notes where work
remains to be done to further clarify these definitions.
Chapter 5 covers the conceptual, definition and classification issues concerning educational
programmes. It is organised in three parts. The first part begins with an overview of the
International Standard Classification of Education (ISCED 2011) and sets out the related
definitions and classifications that apply to educational programmes. The second part sets
out in detail how to allocate educational programmes within each of the levels of the ISCED
classification and is consistent with the OECD’s “ISCED 2011 Operational Manual
Guidelines for classifying national education programmes and related qualifications”.
Annex 2 contains diagrams mapping countries’ national educational programmes to the
ISCED framework, a key tool in interpreting the published statistics and indicators.
Chapter 6 examines issues surrounding the quality of the international education data. It
begins with a declaration of the OECD’s commitment to data quality and the quality
framework used to collect, compile and disseminate data. It then discusses the types of
data-quality problems that arise and why they arise, and describes how the OECD
assesses and addresses these issues. It suggests some ways to make estimates for missing
data and concludes with an account of the main international education data-quality issues
that remain to be tackled.
Chapter 7 turns to the statistics and indicators that are derived from the raw data. It
explains the concepts, methodologies and conventions used in the calculations, and the
measurement issues that can arise. It focuses on the main types of indicators compiled from
the data collected through the INES Programme. It does not seek to describe in detail every
indicator that appears or ever has appeared in Education at a Glance. Instead it focuses on
the key indicators or groups of indicators which have conceptual or methodological
aspects worthy of explanation and can therefore be considered a catalogue of indicator
methodologies rather than a catalogue of indicators.
References
OECD (2018), OECD Data, https://data.oecd.org/ (accessed on 26 July 2018). [2]
OECD (2018), OECD Statistics, https://stats.oecd.org/ (accessed on 26 July 2018). [1]

2 - CONCEPTUAL FRAMEWORK FOR DATA COLLECTION FOR EDUCATION STATISTICS… │ 13
OECD HANDBOOK FOR INTERNATIONALLY COMPARATIVE EDUCATION STATISTICS 2018 © OECD 2018
Chapter 2. Conceptual framework for data collection for education statistics
and indicators
This chapter sets out the conceptual framework for international education statistics and
indicators which have driven the development of definitions and the data collections. It
begins with a short historical perspective of the development of OECD statistics and
indicators on education and describes the organisation of the OECD Indicators of
Education Systems (INES) Programme.

14 │ 2 - CONCEPTUAL FRAMEWORK FOR DATA COLLECTION FOR EDUCATION STATISTICS…
OECD HANDBOOK FOR INTERNATIONALLY COMPARATIVE EDUCATION STATISTICS 2018 © OECD 2018
2.1. The development of international educational statistics and indicators
During the 1980s, there was increasing demand for information on education and the
need for improved knowledge about the functioning of education systems. This raised
many questions not only about data collection but also about the organisation, reporting
and interpretation of the data. These questions led authorities in the OECD member
countries to consider new ways of comparing their education systems. They reached
agreement on the feasibility and utility of developing an international set of indicators that
would present, in statistical form, key features of their education systems.
The OECD’s Centre for Educational Research and Innovation (CERI) responded to this
demand for comparative information by initiating the OECD’s Indicators of Education
Systems (INES) Programme. The programme developed a provisional framework for
organising the indicators, proposing a set of indicators and the methodologies for
measuring them. This framework has been considerably developed since then and is
presented in the next section of this chapter.
The first set of indicators was published in Education at a Glance in 1992 (OECD, 1992[1])
and drew mainly on existing data sources. The work to produce the first Education at a
Glance exposed weaknesses both in the underlying statistical classification (the
International Standard Classification of Education, ISCED, (OECD/Eurostat/UNESCO
Institute for Statistics, 2015[2])) and in the data collections themselves. Since then much work
has been put into revising ISCED and improving the methods and instruments for the
international data collection on education (OECD, 2004[3]) (OECD, 2017[4]). This
handbook describes the concepts, classifications and definitions that are the result of that
work to date.
The OECD education indicators are clearly the product of an ongoing process of
conceptual development and data collection. The objective is to link a broad range of
policy needs with the best available international data. In each area of work, the following
considerations have, traditionally, guided the indicator activities:
First, emphasising those education issues where the international comparative
perspective can offer significant added value over and above what can be
achieved through national analysis and evaluation.
Second, seeking to strike an appropriate balance between focusing new
developments on areas where the feasibility of data development is promising, and
not neglecting important areas where substantial investment in conceptual and
empirical work is needed to further the policy debate.
Third, continually reviewing the work to ensure that the outcomes are cross-nationally
valid and reliable.
The indicator programme places increasing emphasis on integrating its work through the
perspective of lifelong learning, with the aim of progressing from a model of education
built around institutions to one that looks more broadly at the extent and benefits of
learning throughout life. In addition, various activities within the programme are seeking
to better reflect equity-related issues, through assessing differences and inequalities
among individuals and groups of individuals.
The OECD’s INES programme is overseen and co-ordinated by the following bodies:
The Education Policy Committee oversees the strategic direction, coherence and
quality of the OECD’s overall work on education.

2 - CONCEPTUAL FRAMEWORK FOR DATA COLLECTION FOR EDUCATION STATISTICS… │ 15
OECD HANDBOOK FOR INTERNATIONALLY COMPARATIVE EDUCATION STATISTICS 2018 © OECD 2018
The INES Working Party oversees and co-ordinates the statistical work as well
as the development of indicators and quantitative analyses needed to meet the
requirements and priorities of the Education Policy Committee. The working
party also sets priorities and standards for data development, analysis and
reporting for INES, and provides direction on the dissemination of the
programme’s policy advice, analysis and research to a wide range of stakeholders.
In addition, two networks of technical experts from member and partner countries
develop and refine indicators for the INES programme:
The INES Network for the Collection and Adjudication of System-Level
Descriptive Information on Educational Structures, Policies and Practices
(NESLI) focuses on system-level indicators in education.
The INES Network on Data Collection and Development on Economic, Labour
Market and Social Outcomes of Education (LSO) focuses on developing
indicators on various outcomes of education, including labour market, economic
and social outcomes.
Each of these groups meets biannually and is made up of national representatives from
some of the OECD’s member and partner countries. The European Centre for the
Development of Vocational Training (CEDEFOP), Eurydice, Eurostat, the European
Commission and the UNESCO Institute for Statistics are also observers to the INES
programme.
2.2. The organising framework for the OECD education indicators
The OECD’s education indicators represent the consensus of professional thinking on
how to measure the current state of education internationally. They provide information
on the human and financial resources invested in education, how education and learning
systems operate and evolve, and the returns to investments in education. They are
organised thematically, each accompanied by information on the policy context and
interpretation of the data.
The education indicators are organised thematically and each is accompanied by relevant
background information. The indicators are presented within an organising framework
which:
distinguishes between the actors in education systems: individual learners,
instructional settings and learning environments, educational service providers,
and the education system as a whole
groups the indicators according to types of issues they address, and examines
contextual factors that influence policy (Figure 2.1).
In addition to these dimensions, the time perspective makes it possible to visualise
dynamic aspects of the development of education systems.
16 │ 2 - CONCEPTUAL FRAMEWORK FOR DATA COLLECTION FOR EDUCATION STATISTICS…
OECD HANDBOOK FOR INTERNATIONALLY COMPARATIVE EDUCATION STATISTICS 2018 © OECD 2018
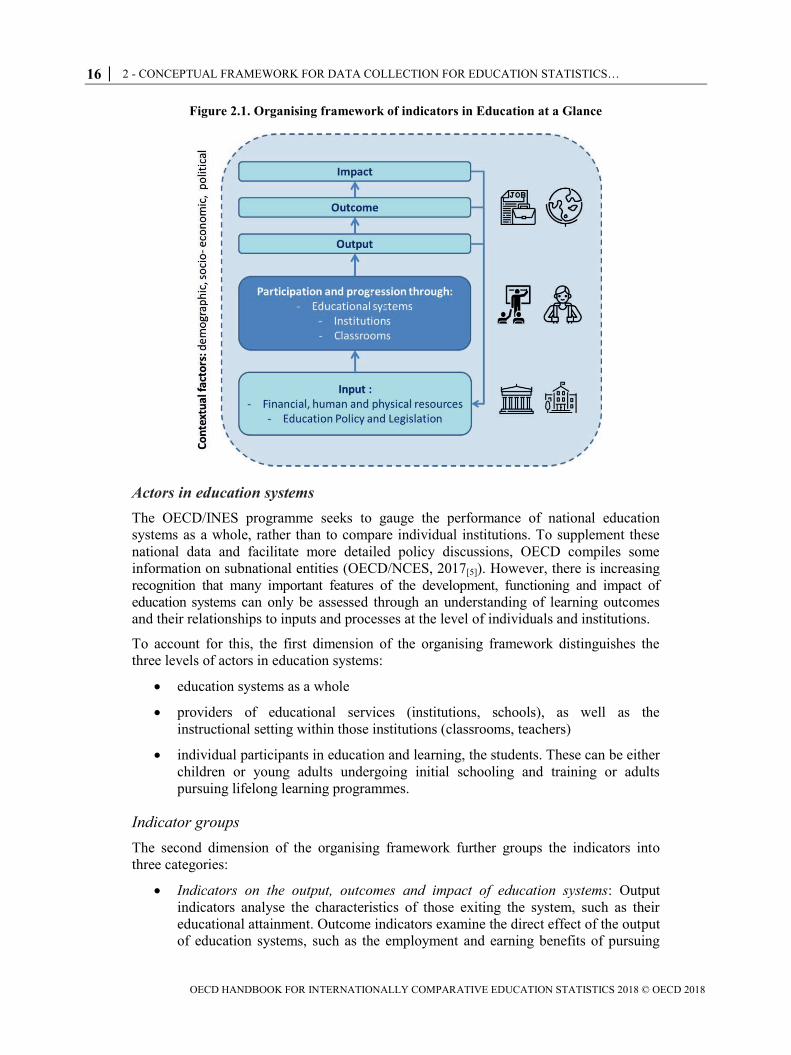
Figure 2.1. Organising framework of indicators in Education at a Glance
Actors in education systems
The OECD/INES programme seeks to gauge the performance of national education
systems as a whole, rather than to compare individual institutions. To supplement these
national data and facilitate more detailed policy discussions, OECD compiles some
information on subnational entities (OECD/NCES, 2017[5]). However, there is increasing
recognition that many important features of the development, functioning and impact of
education systems can only be assessed through an understanding of learning outcomes
and their relationships to inputs and processes at the level of individuals and institutions.
To account for this, the first dimension of the organising framework distinguishes the
three levels of actors in education systems:
education systems as a whole
providers of educational services (institutions, schools), as well as the
instructional setting within those institutions (classrooms, teachers)
individual participants in education and learning, the students. These can be either
children or young adults undergoing initial schooling and training or adults
pursuing lifelong learning programmes.
Indicator groups
The second dimension of the organising framework further groups the indicators into
three categories:
Indicators on the output, outcomes and impact of education systems: Output
indicators analyse the characteristics of those exiting the system, such as their
educational attainment. Outcome indicators examine the direct effect of the output
of education systems, such as the employment and earning benefits of pursuing
2 - CONCEPTUAL FRAMEWORK FOR DATA COLLECTION FOR EDUCATION STATISTICS… │ 17
OECD HANDBOOK FOR INTERNATIONALLY COMPARATIVE EDUCATION STATISTICS 2018 © OECD 2018
higher education. Impact indicators analyse the long-term indirect effect of the
outcomes, such as knowledge and skills acquired, contributions to economic
growth and societal well-being, and social cohesion and equity.
Indicators on the participation and progression within education entities: These
indicators assess the likelihood of students accessing, enrolling in, and completing
different levels of education, as well as the various pathways followed between
types of programmes and across education levels.
Indicators on the input into education systems or the learning environment: These
indicators provide information on the policy levers that shape the participation,
progression, outputs and outcomes at each level. Such policy levers relate to the
resources invested in education, including financial, human (such as teachers and
other school staff), or physical resources (such as buildings and infrastructure).
They also relate to policy choices regarding the instructional setting of
classrooms, pedagogical content and delivery of the curriculum. Finally, they
analyse the organisation of schools and education systems, including governance,
autonomy, and specific policies to regulate participation of students in certain
programmes.
2.2.2. Contextual factors that influence policy
Policy levers typically have antecedents, external factors that define or constrain policy
but are not directly connected to the policy topic at hand. Demographic, socio-economic
and political factors are all important national characteristics to take into account when
interpreting indicators. The recent financial crisis, for example, had a significant impact
on public funds available to education.
The characteristics of the students themselves, such as their gender, age, socio-economic
status, or cultural background, are also important contextual factors that influence the
outcomes of education policy.
2.2.3. Indicator analysis using the framework
This versatile framework can be used to understand the operation and functioning of any
educational entity, from an education system as a whole to a specific level of education or
programme, or even a smaller entity, such as a classroom.
This versatility is important because many features of education systems have varying
impacts at different levels of the system. For example, at the level of students within a
classroom, the relationship between student achievement and class size may be negative,
if students in small classes benefit from improved interactions with teachers. At the class
or school level, however, weaker or disadvantaged students are often intentionally
grouped and placed in smaller classes so that they receive more individual attention. At
the school level, therefore, the observed relationship between class size and student
achievement is often positive, suggesting that students in larger classes perform better
than students in smaller classes. At higher levels of aggregation, the relationship between
student achievement and class size is further confounded, by the socio-economic intake of
individual schools or by factors relating to the learning culture in different countries.
Therefore, to interpret the indicators, it is important to fully understand the relationships
between them.
Analysis of each element of the framework and the interplay between them contribute to
understanding a variety of policy perspectives:
18 │ 2 - CONCEPTUAL FRAMEWORK FOR DATA COLLECTION FOR EDUCATION STATISTICS…
OECD HANDBOOK FOR INTERNATIONALLY COMPARATIVE EDUCATION STATISTICS 2018 © OECD 2018
quality of education outcomes and education opportunities
equality of education outcomes and equity in education opportunities
adequacy, effectiveness and efficiency of resources invested in education
relevance of education policy measures to improve education outcomes.
2.3. Overview of current regular data collections and data sources
The data collections described below cover only the regular data collections conducted by
the INES programme to develop the indicators presented in this handbook. The
programme makes use of data available from other sources and from ad hoc surveys which
are occasionally carried out by subsidiary groups and bodies but these are not listed here.
All submitted questionnaires are subject to rigorous scrutiny by statisticians in the INES
team, checking year-on-year consistency of the data, cross-checking between tables and
raising queries with countries as necessary. Automated verification checks in the
questionnaires also facilitate the quality checking of the data and can often result in the
resubmission of data. Please see Chapter 6 for more information.
2.3.1. Joint data collection by the OECD, UNESCO and Eurostat (UOE data
collection)
The “UOE data collection” managed by the INES Working Party is the annual collection
of data on education systems which is conducted jointly between the OECD, the
UNESCO Institute for Statistics (UIS), and Eurostat and has been carried out as a joint
exercise in its current form since 1993. It is a collection of aggregate national data
comprising some 25 electronic questionnaires (Excel workbooks) covering student
enrolments (9 questionnaires), student entrants (4), graduates (3), personnel (3), finance
(3), class sizes (2) and general population (1). Countries’ ISCED mappings, which map
national educational programmes to the ISCED framework, form an important
supplement to the UOE data collection.
The questionnaires are completed by the statistical staff in each country using the data
available to them nationally.
The data requests are issued around the end of June each year. Data on students,
personnel, classes, and graduates are collected for the most recently completed school
year; the finance data are collected for the last but one complete financial year (to enable
out-turn data to be available). Returns are due between September and November.
Advice and guidance is provided to data providers through the “UOE Manual” or UOE
Data Collection on Formal Education, Manual on Concepts, Definitions and
Classifications, (UNESCO-UIS/OECD/EUROSTAT, 2016[6]) which is revised regularly
when necessary and is consistent with the concepts, definitions and classifications
described in this handbook.
Countries submit their completed questionnaires jointly to the OECD, Eurostat and
UNESCO (UNESCO-UIS/OECD/EUROSTAT, 2013[7]). For federal states (e.g.
Belgium), the data are collected by the different communities and then jointly presented
to the OECD and other partners. The three organisations co-operate over cleaning the
data and reviewing new submissions following corrections, to ensure efficiency in the
data collection and management process. According to European regulation, participation
in data collections by European Member States is compulsory.

2 - CONCEPTUAL FRAMEWORK FOR DATA COLLECTION FOR EDUCATION STATISTICS… │ 19
OECD HANDBOOK FOR INTERNATIONALLY COMPARATIVE EDUCATION STATISTICS 2018 © OECD 2018
2.3.2. Data collections by the NESLI Network
The NESLI Network administers three annual data collections on 1) the teachers’ and
school heads’ salaries; 2) teachers’ working time; and 3) instruction time for students.
NESLI has developed other non-periodical data collections which are not covered in this
handbook.
From 1991 until 2013 the network collected annual data through its Teachers and the
Curriculum survey. Data were collected through electronic (Excel) questionnaires and
covered: compulsory and non-compulsory intended instruction time for students,
teachers’ working time and teaching time, and annual statutory teacher compensation.
The data collected related more to the policies that applied in each country than the actual
activity. Thus, for example, figures on teachers’ working time reflected what was laid
down in regulations rather a measure of actual working time.
In 2014 the Teachers and the Curriculum survey was split into two different data
collections: instruction time, and teachers’ salaries and working time. First, the Eurydice
network and the OECD (NESLI Network) jointly collect data on instruction time. As both
organisations were collecting data on instruction time, they developed a common tool
aimed at simplifying work at national level and avoiding overlaps and inconsistencies.
This joint data collection gathers information on intended instruction time in compulsory
education from the first year of primary education to the end of full-time compulsory
education for all students. In grades where vocational and general programmes co-exist, it
only collects data for the general programmes. It does not include pre-primary education
programmes, even if they are compulsory. For each grade, it gathers the number of hours
of instruction as well as non-compulsory instruction time. The data requested relate to the
policies that apply in each country in the year in question. The tool also collects data on
actual instruction time in the different compulsory subjects, and qualitative information
on the organisation of the school day.
The NESLI Network also collected information on teachers’ salaries and working time
through a specific NESLI data collection covering full-time classroom teachers in public
institutions at pre-primary, primary, lower secondary and upper secondary levels. In
2017, this data collection was further split into two different collections, one on teachers’
and school heads’ salaries, and one on working time. As both Eurydice and the NESLI
Network were collecting data on teachers’ salaries, but the Eurydice data collection also
covered the salaries of school heads, they again developed a common tool aimed at
simplifying work at the national level and avoiding overlaps and inconsistencies. This
survey has been designed to meet the data needs of the two organisations. As a result it
differs from the data collections administered separately by Eurydice and the OECD in
previous years, and the joint data collection covers the salaries of teachers and school
heads for all countries. Second, the NESLI Network also collects information on
teachers’ working time through a specific NESLI data collection covering full-time
classroom teachers in public institutions at pre-primary, primary, lower secondary and
upper secondary levels.
For each level of education, the surveys collect teachers’ statutory and actual teaching
and working time and their statutory and actual salaries. They collect statutory salaries at
four stages of teachers’ careers (starting teachers, teachers with 10 and 15 years of
experience, and teachers at the top of the salary scale), and for teachers with different
levels of qualifications (distinguishing between minimum, most prevalent and maximum
qualification levels). They also collect criteria for additional payments in public
institutions, including remuneration for tasks performed by teachers.
20 │ 2 - CONCEPTUAL FRAMEWORK FOR DATA COLLECTION FOR EDUCATION STATISTICS…
OECD HANDBOOK FOR INTERNATIONALLY COMPARATIVE EDUCATION STATISTICS 2018 © OECD 2018
For these three annual data collections, experts in each country fill in electronic (Excel)
questionnaires, making reference to the various laws and regulations that are in place
nationally. The data are issued in October each year for return by mid-December. The
submitted questionnaires and related indicators are subject to rigorous scrutiny, requiring
liaison with the countries involved, before the validated data are published.
2.3.3. Data collections by the LSO Network
The Annual Labour Statistics data request compiles two data collections: on the
educational attainment and labour-market status of 25-64 year-olds, and on the transition
from education to work for 15-29 year-olds. The data request is conducted by the OECD
Secretariat in collaboration with the OECD Directorate for Employment, Labour and
Social Affairs (ELS) in February/March each year.
Both data collections are derived from national labour force surveys.
For the first collection, countries’ national statistical offices provide data on employment,
unemployment and population by national educational attainment categories, gender and
age groups. They are mapped onto ISCED 2011 levels of attainment using the agreed
mapping from national categories to the ISCED 2011 standardised levels of attainment,
which the LSO Network has established in consultation with country representatives.
International Labour Organization (ILO) guidelines and definitions of employment and
unemployment are used for reporting work status.
The second data collection covers the transition from education to work for 15-29 year-
olds. The data are collected with a reference period in the early part of the calendar year,
usually the first quarter. Countries report education and work status for each of three 5-
year age groups by gender and educational level attained. Education refers to formal
education only. The questionnaire also includes information on enrolment in work-study
programmes. Some other variables are collected on a periodical basis (not every year),
such as the number of hours worked, duration of unemployment or for the 18-24 age
group.
Another annual data collection is the one on education and earnings. It collects data on
earnings by attainment level and gender. Data are derived from national labour force
surveys and other surveys, such as the European Survey on Income and Living
Conditions (EU-SILC). It is conducted by the OECD Secretariat in October/November
each year.
Countries submit their completed questionnaires to the OECD. In addition to these direct
data submissions, the OECD also uses data from Eurostat, the ILO and UIS in order to fill
gaps. Countries as well as the four international organisations, CEDEFOP, Eurostat, ILO
and UIS, are contributing to the further development of the LSO data collections.
References
OECD (2017), OECD Handbook for Internationally Comparative Education Statistics: Concepts,
Standards, Definitions and Classifications, OECD Publishing, Paris,
http://dx.doi.org/10.1787/9789264279889-en.
[4]

2 - CONCEPTUAL FRAMEWORK FOR DATA COLLECTION FOR EDUCATION STATISTICS… │ 21
OECD HANDBOOK FOR INTERNATIONALLY COMPARATIVE EDUCATION STATISTICS 2018 © OECD 2018
OECD (2004), OECD Handbook for Internationally Comparative Education Statistics: Concepts,
Standards, Definitions and Classifications, OECD Publishing, Paris,
http://dx.doi.org/10.1787/9789264104112-en.
[3]
OECD (1992), Education at a Glance: OECD Indicators, OECD Publishing, Paris. [1]
OECD/Eurostat/UNESCO Institute for Statistics (2015), ISCED 2011 Operational
Manual: Guidelines for Classifying National Education Programmes and Related
Qualifications, OECD Publishing, Paris, http://dx.doi.org/10.1787/9789264228368-en.
[2]
OECD/NCES (2018), Education at a Glance Subnational Supplement, OECD/National Center
for Education Statistics, Paris and Washington, DC,,
https://nces.ed.gov/suveys/annualreports/oecd/.
[8]
OECD/NCES (2017), Education at a Glance Subnational Supplement (OECD/National Center
for Education Statistics), Paris and Washington, DC,
https://nces.ed.gov/surveys/annualreports/oecd/.
[5]
UNESCO-UIS/OECD/EUROSTAT (2016), UOE data collection on formal education Manual on
concepts, definitions and classifications UNESCO-UIS / OECD / EUROSTAT Data Collection
on formal education Manual on concepts, definitions and classifications,
http://uis.unesco.org/sites/default/files/documents/uoe2016manual_11072016_0.pdf (accessed
on 26 July 2018).
[6]
UNESCO-UIS/OECD/EUROSTAT (2013), UOE data collection on education systems Volume 2
- UOE questionnaires and instructions for their completion and submission,
https://circabc.europa.eu/sd/a/e94faeef-ff13-465d-94f9-
c2fb243ded57/UOE2013manual_volume_2_FINAL.pdf.
[7]

3 - SCOPE AND COVERAGE OF INTERNATIONALLY COMPARABLE EDUCATION STATISTICS │ 23
OECD HANDBOOK FOR INTERNATIONALLY COMPARATIVE EDUCATION STATISTICS 2018 © OECD 2018
Chapter 3. Scope and coverage of internationally comparable education
statistics
This chapter sets out the coverage of the OECD’s internationally comparative statistics on
education. It starts by defining education and proceeds to define the coverage of the
statistics which follows from that definition. It discusses various boundary issues around
education, in particular in relation to the coverage of early childhood programmes,
special needs education, non-regular and adult education and vocational and
professional education and training.
24 │ 3 - SCOPE AND COVERAGE OF INTERNATIONALLY COMPARABLE EDUCATION STATISTICS
OECD HANDBOOK FOR INTERNATIONALLY COMPARATIVE EDUCATION STATISTICS 2018 © OECD 2018
3.1. Definition of education
The basic underlying definition of education used in the collection of OECD international
education statistics is derived from the International Standard Classification of Education
(ISCED 2011):1
“The basic units of classification in ISCED are the national (and subnational)
education programme and the related recognized educational qualification. In
ISCED, an education programme is defined as a coherent set or sequence of
educational activities or communication designed and organized to achieve
predetermined learning objectives or accomplish a specific set of educational
tasks over a sustained period. Objectives encompass improving knowledge, skills
and competencies within any personal, civic, social and/or employment-related
context. Learning objectives are typically linked to the purpose of preparing for
more advanced studies and/or for an occupation, trade, or class of occupations or
trades but may be related to personal development or leisure. A common
characteristic of an education programme is that, upon fulfilment of learning
objectives or educational tasks, successful completion is certified.”
Compared to previous versions, ISCED 2011 includes improved definitions for different
types of education and clarifies their application. Categories have been added to the
classification of levels in recognition of the expansion of early childhood education and
the restructuring of tertiary education (UNESCO-UIS, 2011[1]).
3.2. The scope of the OECD's international education statistics
Although non-formal education is a recognised part of ISCED, the OECD international
data collection exercises (mappings, surveys, censuses, etc.) restrict the coverage of
international educational statistics to formal programmes for the sake of international
comparability and feasibility (OECD/Eurostat/UNESCO Institute for Statistics, 2015[2]).
The boundary between formal and non-formal programmes is therefore important and
should be given specific attention. Countries will have a large variety of education
programmes, such as initial education, regular education, second chance programmes,
literacy programmes, adult education, continuing education, open and distance education,
apprenticeships, technical or vocational education, training, and special needs education.
Box 3.1 details the types of education which are not included.
The restriction to formal education programmes determines the reporting of statistics on
education systems at different levels, such as enrolment, entrants and teachers and other
human and financial resources. Statistics on formal education programmes can therefore
provide information on the links between inputs (entrants into this system), the process
(participation) and outputs (the qualification).
Formal education is institutionalised, intentional and planned through public and
recognised private institutions. Formal education is recognised as such by the relevant
national education or equivalent authorities. Institutionalised education occurs when an
organisation provides structured educational arrangements, such as student-teacher
1 See Chapter 5 for a full description of ISCED 2011, its development and the OECD’s role in
that development.
3 - SCOPE AND COVERAGE OF INTERNATIONALLY COMPARABLE EDUCATION STATISTICS │ 25
OECD HANDBOOK FOR INTERNATIONALLY COMPARATIVE EDUCATION STATISTICS 2018 © OECD 2018
relationships and/or interactions, that are specially designed for education and learning.
Formal education typically takes place in educational institutions that are designed to
provide full-time education for students in a system designed as a continuous educational
pathway up to their first entrance to the labour market, although some parts of adult
education are also recognised as part of the formal education system.
Regular education has been defined within the new ISCED classification as the initial
education designed for individuals without special educational needs.
Box 3.1. Other types of education outside the scope of international education statistics
Non-formal education, like formal education, is institutionalised, intentional and
planned by an education provider and is complementary or alternative to formal
education within the course of individuals’ lifelong learning. However, non-formal
education mostly leads to qualifications that are not recognised as formal or equivalent
to formal qualifications by the relevant national or subnational education authorities,
or to no qualifications at all.
Informal learning is defined as forms of learning that are intentional or deliberate,
but are not institutionalised. Less organised and less structured than either formal or
non-formal education, informal learning may include learning activities that occur in
the family, workplace, local community and daily life, on a self-directed, family-
directed or socially-directed basis.
Incidental or random learning covers various forms of learning that are not
organised or that involve communication not designed to bring about learning.
Incidental or random learning may occur as a by-product of day-to-day activities,
events or communications that are not designed as deliberate educational or learning
activities. Examples may include learning that takes place during the course of a
meeting, or while listening to a radio programme or watching a television broadcast
that is not designed as an education programme.
3.3. Coverage issues, specific inclusions and exclusions
As national education systems vary in the way they are organised and in the way they
label different types of activity, it is necessary to clarify which areas of activity are
included or excluded (OECD, 2017[3]).
3.3.1. Coverage of early childhood programmes
According to ISCED 2011, early childhood programmes are considered as educational
when they have an intentional education component. These programmes aim to develop
the cognitive, physical and socio-emotional skills needed to participate in school and
society. ISCED level 0 covers early childhood education for all ages, including very
young children. Programmes are sub-classified into two categories depending on age and
the level of complexity of the educational content: early childhood educational
development (code 010) and pre-primary education (code 020). Early childhood
educational development programmes are a new class of education, not included in the
ISCED-97 classification, and are generally designed for children between the ages of 0
and 2, while pre-primary education corresponds exactly to what was previously known as
level 0 in ISCED-97.
26 │ 3 - SCOPE AND COVERAGE OF INTERNATIONALLY COMPARABLE EDUCATION STATISTICS
OECD HANDBOOK FOR INTERNATIONALLY COMPARATIVE EDUCATION STATISTICS 2018 © OECD 2018
Programmes classified at ISCED level 0 may be referred to in many ways, for example
early childhood education and development, play school, reception, pre-primary,
preschool or educación inicial, krippen. Programmes provided in crèches, day-care
centres, nurseries or guardería, kindergärten must meet the ISCED level 0 classification
criteria to be included in international education statistics. This means they must:
have adequate intentional educational properties
be institutionalised
be targeted towards children from the age of 0 up to the age of entry into ISCED
level 1 education
meet minimum levels of intensity/duration (an intensity of at least 2 hours per day
and duration of at least 100 days a year).
Wherever possible, programmes should also have a regulatory framework recognised by
the relevant national authorities and have trained or accredited staff as set out in the
appropriate regulatory framework.
The following programmes are excluded from ISCED-2011:
Programmes that provide childcare only (i.e. supervision, nutrition and health).
Integrated programmes in which the non-educational portion is greater than the
educational portion.
Purely family-based arrangements that may be purposeful but do not meet the
UOE definition of a “programme” (e.g. informal learning by children from their
parents, other relatives or friends is not included under ISCED level 0).
Learning activities delivered in private homes or other institutionalised centres
that are outside the jurisdiction of an appropriate national early childhood
education authority or regulatory body, regardless of whether the activities are
organised in the style of an approved early childhood education programme. An
example of this would be a private citizen who, of his or her own volition,
provides learning opportunities for young children that nominally meet the
ISCED level criteria around intentional education, intensity/duration and staff
qualification requirements, but who is not recognised by an authorising body.
Programmes where attendance can be ad hoc or of a drop-in style where
individual children will not experience a continuity of structured learning
opportunities.
Short-duration programmes, such as vacation care, which may have an
educational curriculum but do not offer a sustained period of instruction or
learning opportunities.
Programmes with intentional educational properties but with no minimum level of
attendance, such as when parents are free to choose an intensity and duration of
their child’s attendance that does not meet the ISCED level 0 criteria.
Early childhood services that are open for extended hours and provide intentional
educational activities during these hours, but do not require a minimum
intensity/duration of attendance or enrolment.
Some countries may define early childhood education more broadly than others. Some
countries have a so-called “integrated care and education on level ISCED 0” (where

3 - SCOPE AND COVERAGE OF INTERNATIONALLY COMPARABLE EDUCATION STATISTICS │ 27
OECD HANDBOOK FOR INTERNATIONALLY COMPARATIVE EDUCATION STATISTICS 2018 © OECD 2018
ISCED 01 and ISCED 02 enrolments cannot be separated). This is an integrated system
of care and education before entering primary education, but preschool curriculum is not
directly integrated with the curriculum of primary education. Thus, comparability of
international statistics on programmes at ISCED level 0 depends on each country’s ability
to report data for this level according to a standard international definition, even if that
definition may diverge from the one it uses in compiling its own national statistics. In this
regard, the data reported in Education at a Glance (OECD, 2018[4]) as ISCED level 0
programmes may differ from national reporting of early childhood education (see Chapter
5 for more detail on the implementation of the ISCED 2011 classification).
3.3.2. Coverage of special needs education
The ISCED 2011 manual defines special needs education as:
“education designed to facilitate learning by individuals who, for a wide variety
of reasons, require additional support and adaptive pedagogical methods in order
to participate and meet learning objectives in an education programme. Reasons
may include (but are not limited to) differences in physical, behavioural,
intellectual, emotional and social capacities (including disabilities, difficulties or
disadvantages). Education programmes in special needs education may follow a
similar curriculum as that offered in the parallel regular education system, but
they take individual needs into account by providing specific resources (e.g.
specially-trained personnel, equipment or space) and, if appropriate, modified
educational content or learning objectives. These programmes can be offered to
individual students within already-existing education programmes or as a
separate class in the same or separate educational institutions.”
While there was agreement on the need to include special needs education with the overall
scope of the UOE data collection (with certain specific exclusions), there remained
difficulties in terms of defining special needs students as a separate reporting group in an
internationally comparable manner. The ISCED 2011 classification considerably
improved the definition of special needs education, although types of provision may vary
across countries. Countries differ, for example, in the programmes offered, the degree to
which special needs education is integrated into the regular education system, the
classification of types of special needs and type of support given to these students. The
UOE data collection recommends only excluding special needs programmes from data on
numbers of classes and students in primary and lower secondary education by type of
institutions (UNESCO-UIS / OECD / EUROSTAT, 2017[5]) (UNESCO-UIS, 2013[6]).
3.3.3. Coverage of non-regular or adult education
Regular education has been defined within the new ISCED classification as the initial
education designed for individuals without special educational needs. Non-regular
education covers adult education.
Adult education is education specifically targeted at individuals who are regarded as
adults by their society to improve their technical or professional qualifications, further
develop their abilities, enrich their knowledge with the purpose to complete a level of
formal education, or to acquire, refresh or update their knowledge, skills and
competencies in a particular field. This also includes what may be referred to as
“continuing education”, “recurrent education” or “second chance education”, as opposed
to initial education.
28 │ 3 - SCOPE AND COVERAGE OF INTERNATIONALLY COMPARABLE EDUCATION STATISTICS
OECD HANDBOOK FOR INTERNATIONALLY COMPARATIVE EDUCATION STATISTICS 2018 © OECD 2018
Initial education is defined as education taken by people in preparation for their initial
entry into work. Initial education typically follows a continuous path or paths of
progression prior to initial entry into full-time employment.
Formal adult education programmes included in data collection may be designed as
second chance programmes for youth or adults and offered in the same or similar formal
settings as initial education. They do not have the same typical entry age as equivalent
programmes in initial education and may have a different, usually shorter, duration but
with subject content similar to initial education, leading to similar qualifications as
corresponding initial programmes. Data on these are assigned to the most appropriate
ISCED levels according to the instructional content of the programmes.
In some countries, adult education is not recognised as part of the formal education
system and is therefore excluded from data collection. Conversely, for instance, in
Belgium data on adult education is included in the data collection.
3.3.4. Coverage of vocational and professional education
For secondary, post-secondary non-tertiary and short-cycle tertiary education (ISCED
levels 2 to 5), programme orientations can be general or vocational. ISCED 2011 also
allows for the possibility of coding academic and professional orientation categories at
the tertiary levels (ISCED levels 6 to 8). However, internationally agreed definitions on
these orientation categories for tertiary education are still to be developed.
Vocational education and training (VET) programmes prepare participants for direct
entry into specific occupations without further training. Successful completion of such
programmes leads to a vocational or technical qualification that is relevant to the labour
market. Vocational programmes are further divided into two categories (school-based
programmes and combined school- and work-based programmes), based on the amount
of training provided in school as opposed to the workplace. The degree to which a
programme has a vocational or general orientation does not necessarily determine
whether participants have access to tertiary education. In several OECD countries,
vocationally oriented programmes are designed to prepare students for further study at the
tertiary level, and in some countries general programmes do not always provide direct
access to further education.
Figure 3.1 summarises the different combinations of vocational and training programmes.
3 - SCOPE AND COVERAGE OF INTERNATIONALLY COMPARABLE EDUCATION STATISTICS │ 29
OECD HANDBOOK FOR INTERNATIONALLY COMPARATIVE EDUCATION STATISTICS 2018 © OECD 2018
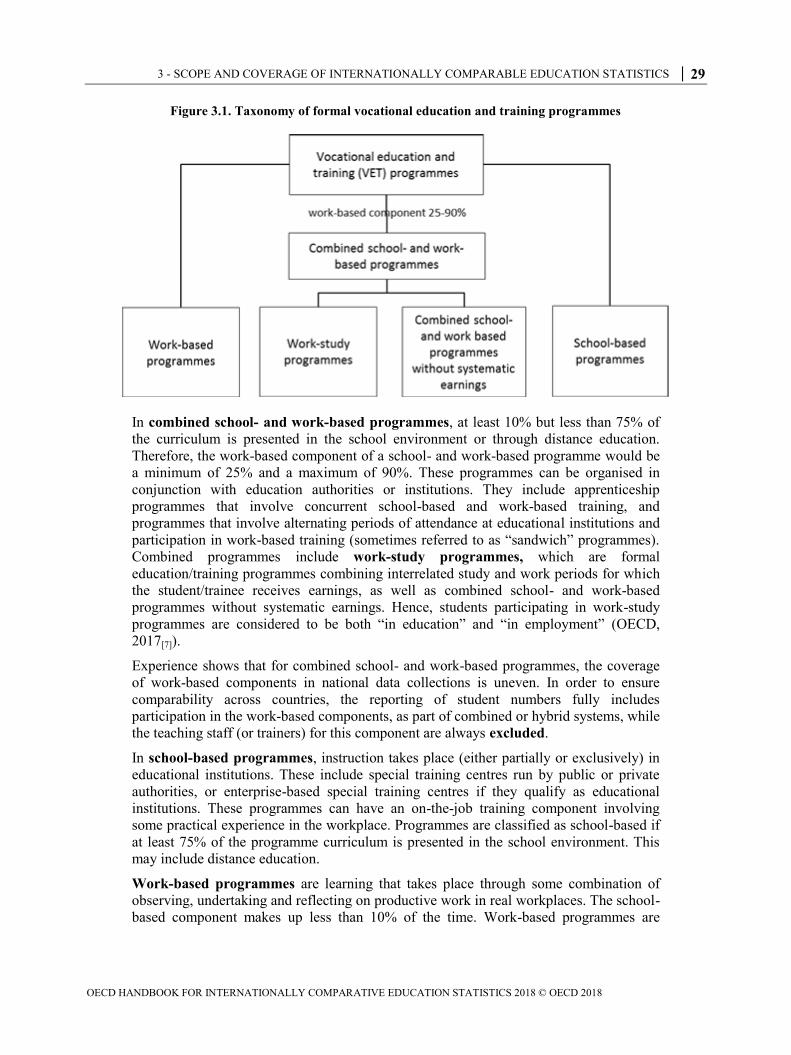
Figure 3.1. Taxonomy of formal vocational education and training programmes
In combined school- and work-based programmes, at least 10% but less than 75% of
the curriculum is presented in the school environment or through distance education.
Therefore, the work-based component of a school- and work-based programme would be
a minimum of 25% and a maximum of 90%. These programmes can be organised in
conjunction with education authorities or institutions. They include apprenticeship
programmes that involve concurrent school-based and work-based training, and
programmes that involve alternating periods of attendance at educational institutions and
participation in work-based training (sometimes referred to as “sandwich” programmes).
Combined programmes include work-study programmes, which are formal
education/training programmes combining interrelated study and work periods for which
the student/trainee receives earnings, as well as combined school- and work-based
programmes without systematic earnings. Hence, students participating in work-study
programmes are considered to be both “in education” and “in employment” (OECD,
2017[7]).
Experience shows that for combined school- and work-based programmes, the coverage
of work-based components in national data collections is uneven. In order to ensure
comparability across countries, the reporting of student numbers fully includes
participation in the work-based components, as part of combined or hybrid systems, while
the teaching staff (or trainers) for this component are always excluded.
In school-based programmes, instruction takes place (either partially or exclusively) in
educational institutions. These include special training centres run by public or private
authorities, or enterprise-based special training centres if they qualify as educational
institutions. These programmes can have an on-the-job training component involving
some practical experience in the workplace. Programmes are classified as school-based if
at least 75% of the programme curriculum is presented in the school environment. This
may include distance education.
Work-based programmes are learning that takes place through some combination of
observing, undertaking and reflecting on productive work in real workplaces. The school-
based component makes up less than 10% of the time. Work-based programmes are
30 │ 3 - SCOPE AND COVERAGE OF INTERNATIONALLY COMPARABLE EDUCATION STATISTICS
OECD HANDBOOK FOR INTERNATIONALLY COMPARATIVE EDUCATION STATISTICS 2018 © OECD 2018
usually non-formal education programmes or informal learning leading to a qualification
that is recognised by national education authorities (or equivalent).
3.4. Challenges in measuring student mobility
It has become increasingly important to measure mobility in education in recent years.
For example, European Union Council conclusions2 on the modernisation of higher
education have set a target of at least 20% of higher education graduates on average in the
EU having a “period of higher education-related study or training (including work
placement) abroad representing a minimum of 15 European Credit Transfer or lasting a
minimum of three months” by 2020. Defining mobile students and the criteria for
identifying them, types of learning mobility and proper indicators are among the
challenges faced in developing international statistics on this phenomenon.
The OECD international statistics on education report on domestic educational activity
(i.e. within a country’s own territory) regardless of ownership or sponsorship of the
institutions concerned and the education delivery mechanism. This has implications for
some special cases:
Distance learning/e-learning involving two countries: students from country A
who are enrolled with institutions in country B but who continue to live in
country A are reported in the statistics of country B and not in the statistics of
country A.
Commuting students who cross a national border daily in order to follow an
education programme in another country. As with distance learning, commuting
students who are enrolled with institutions in country B but reside in country A
are reported in the statistics of country B.
Internationally mobile students in short exchange programmes (of at least
three months but less than one academic year) that remain enrolled in their home
institution (country A) and where credits for successful completion of the study
abroad (country B) are awarded by the home institution. Students in such
exchange programmes do not obtain their qualifications from the host institution
abroad but at their home institution where they originally enrolled, and are
reported by the country in which they are enrolled (country A).
Foreign campus: an institution in country A may have a campus or outpost in
country B (i.e. a foreign campus). Country B should report the enrolments and
finance for the foreign campus in the same manner as it reports activities of its
domestic educational institutions. The mobile status of the students at these
campuses is determined as for all other students. Foreign campuses that in
practice do not accept students from the host country (for example schools
provided for the children of military personnel based outside their home country)
are treated in the same way as other foreign campuses. Although in practice the
host country may not have access to the data to report such students, their
numbers are not likely to be statistically significant. In cases where it is not
possible in practice to report these students, this should be noted.
2 http://www.consilium.europa.eu/uedocs/cms_data/docs/pressdata/en/educ/126375.pdf

3 - SCOPE AND COVERAGE OF INTERNATIONALLY COMPARABLE EDUCATION STATISTICS │ 31
OECD HANDBOOK FOR INTERNATIONALLY COMPARATIVE EDUCATION STATISTICS 2018 © OECD 2018
European schools are schools established to provide education to children of
personnel of the European institutions, leading to the European Baccalaureate.
Other children may be admitted subject to the availability of places and must pay
fees. It is a unique system that implements a form of co-operation between the
member states and between them and the European Commission. Countries in
which there are European schools report the enrolments, entrants, graduates,
personnel and finance data in the same manner as for foreign campuses, i.e. like
activities of its domestic educational institutions. European schools are considered
private institutions. Students in European schools are excluded from data
collection on language learning.
References
OECD (2018), Education at a Glance 2018: OECD Indicators, OECD Publishing, Paris,
http://www.oecd.org/education/education-at-a-glance-19991487.htm.
[4]
OECD (2017), Education at a Glance 2017: OECD Indicators, OECD Publishing, Paris,
http://dx.doi.org/10.1787/eag-2017-en.
[7]
OECD (2017), OECD Handbook for Internationally Comparative Education Statistics: Concepts,
Standards, Definitions and Classifications, OECD Publishing, Paris,
http://dx.doi.org/10.1787/9789264279889-en.
[3]
OECD/Eurostat/UNESCO Institute for Statistics (2015), ISCED 2011 Operational
Manual: Guidelines for Classifying National Education Programmes and Related
Qualifications, OECD Publishing, Paris, http://dx.doi.org/10.1787/9789264228368-en.
[2]
UNESCO-UIS (2013), UOE data collection on education systems Volume 2 - UOE
questionnaires and instructions for their completion and submission,
https://circabc.europa.eu/sd/a/e94faeef-ff13-465d-94f9-
c2fb243ded57/UOE2013manual_volume_2_FINAL.pdf.
[6]
UNESCO-UIS (2011), International Standard Classification of Education,
http://www.uis.unesco.org (accessed on 26 July 2018).
[1]
UNESCO-UIS / OECD / EUROSTAT (2017), UOE Data Collection on Formal Education.
Manual on Concepts, Definitions and Classifications, UNESCO-UIS / OECD / EUROSTAT,
Montreal, Paris, Luxembourg,
http://uis.unesco.org/sites/default/files/documents/uoe2016manual_11072016_0.pdf.
[5]


4 - DEFINITIONS AND CLASSIFICATIONS OF THE OECD INTERNATIONAL EDUCATION STATISTICS │ 33
OECD HANDBOOK FOR INTERNATIONALLY COMPARATIVE EDUCATION STATISTICS 2018 © OECD 2018
Chapter 4. Definitions and classifications of the OECD international
education statistics
This chapter sets out the definitions and classifications used for the collection of OECD
international education statistics, for students and graduates, educational personnel,
school organisation and the curriculum, educational institutions and educational
expenditure.

34 │ 4 - DEFINITIONS AND CLASSIFICATIONS OF THE OECD INTERNATIONAL EDUCATION STATISTICS
OECD HANDBOOK FOR INTERNATIONALLY COMPARATIVE EDUCATION STATISTICS 2018 © OECD 2018
Chapter 5 covers the definition and classification of educational programmes alongside
guidance on the implementation of the International Standard Classification of Education
(ISCED 2011) (OECD/Eurostat/UNESCO Institute for Statistics, 2015[1]) ((n.a.), 2011[2]).
The key definitions in each section are highlighted to distinguish them from the rest of the
text, which discusses issues of interpretation and practical implementation. While much
has been done over the years to improve the clarity of these definitions, this work is not
exhaustive and the text discusses any remaining areas of ambiguity.
4.1. Students and graduates
4.1.1. Students and student enrolments
In the OECD international education statistics, a student is defined as any individual
participating in formal educational programmes (OECD, 2017[3]). The term “student”
applies to pupils and students alike. Formal education is institutionalised, intentional and
planned, and provided by public organisations and recognised private bodies. It consists
primarily of initial education designed for children and young people before they first enter
the labour market. It also includes other types of education such as vocational, special needs
and adult education provided they are recognised as part of the formal education system by
the relevant national education authorities.
Enrolment or registration is the act of officially enlisting in a programme of study. A
student may enrol in more than one programme.
Two statistics measure the activity of students:
1. Number of students enrolled refers to the count of students studying in a given
education programme during the reference period of the data collection.
2. Number of registrations (or enrolments) refers to the count of enrolments
within the reference period.
Both measures yield the same result if every individual is enrolled in only one programme
during the reference period but they differ when students are enrolled in multiple
programmes. Both measures can be useful for understanding enrolments: the number of
students enrolled is more likely to be used to calculate participation rates within the
population at large and to profile the student body, while the number of registrations is
more likely to be used to assess total educational activity, resource allocation and
operational efficiency.
For cross-national comparability, where national data collection systems permit, the
number of students enrolled should reflect the number of students enrolled at the
beginning of the reference school or academic year. Preferably, the end (or near the end)
of the first month of the reference year should be chosen. If several rounds of data
collection are conducted per year, the one closest to the end of the first month of the
reference academic year should be used. Exceptions may need to be made at the early
childhood and tertiary levels of education. Early childhood education may have gradual
inflows of children, making it preferable to take an average over several dates. At the
tertiary level, student enrolment may not be stable enough at the beginning of the
academic year and therefore a count at a later point may be considered. Alternatively, for
these levels, counting students over a whole reference period (a year) may provide more
realistic results than taking a single snapshot count.

4 - DEFINITIONS AND CLASSIFICATIONS OF THE OECD INTERNATIONAL EDUCATION STATISTICS │ 35
OECD HANDBOOK FOR INTERNATIONALLY COMPARATIVE EDUCATION STATISTICS 2018 © OECD 2018
In all cases, the recommended method for calculating enrolment rates will depend on the
purpose for which the indicator is to be used. For example, when calculating expenditure
per student in order to align with the financial reference year a full-year count of full-time
equivalent (FTE) students will be preferred, but for comparing enrolment rates the
snapshot method is recommended.
It is more and more common for students to enrol in different programmes at different
levels and institutions. Consequently, care must be taken to avoid double counting. For
instance, when students enrol in multiple fields of education as part of their programme of
study, they should be divided proportionately between the fields of education according to
the percentage of instruction devoted to each field (UNESCO-UIS, 2014[4]).
For example, if a programme consists of 70% instruction in biology and 30% in chemistry
and there are 100 full-time students attending this programme, then 70 full-time students
should be reported under the biology category and 30 full-time students under the chemistry
category. If countries cannot divide students in this way, they should classify them
according to the main emphasis of the programme. A similar approach is followed when
students enrol in multiple types of programmes (e.g. programmes with different
orientations, i.e. general/vocational or destinations, i.e. with direct access to the labour
market or not).
Some double counting may occur when students enrol in more than one institution in the same
reference period, however. Such cases are difficult to identify and eliminate. Such double
counting is likely to be relatively insignificant, but it is worth mentioning.
4.1.2. New entrants
Data on new entrants are required in order to measure the intake in education
levels/programmes.
Students can be considered as either new entrants or re-entrants (repeaters, see
Section 4.1.3).
A new entrant is a student who is enrolled in a programme during the current reference
period but who was not enrolled in that programme in the previous reference year.
A new entrant to a level of education is a student who, during the course of the reference
academic year, enters any programme in a given level of education for the first time,
irrespective of whether the student entered the programme at the beginning or at an
advanced stage of the programme (e.g. by virtue of credits gained for relevant work
experience or courses taken at another level of education). If a student enters more than
one programme at the same ISCED level in the same reference year, the highest
programme within the level is used.
New entrants to an ISCED level must be distinguished from new entrants to an education
programme that does not represent a new level. Entrants to an education programme that
is preceded by a programme at the same level are excluded. For programmes which span
two ISCED levels, as participants enter the first grade of the higher ISCED level, they are
reported as new entrants to that ISCED level, even though from a national point of view
they are continuing their education within the same programme.
New entrants to tertiary education are new entrants at ISCED levels 5, 6 or 7 who are
entering tertiary education for the first time, i.e. with no previous education at any other
tertiary level. Students who enter an ISCED 5 programme and then decide to enter an
ISCED 6 programme, for example, are not counted as new entrants to tertiary education.

36 │ 4 - DEFINITIONS AND CLASSIFICATIONS OF THE OECD INTERNATIONAL EDUCATION STATISTICS
OECD HANDBOOK FOR INTERNATIONALLY COMPARATIVE EDUCATION STATISTICS 2018 © OECD 2018
Foreign or international students enrolling for the first time in a country are counted by
default as new entrants, regardless of their previous education in other countries, if in
practice countries are not able to identify their previous education.
4.1.3. Repeaters and over-age students
A repeater is defined as a student who enrols in the same grade or year of study of the
same educational programme for a second or further time.
Repeaters must be distinguished from students who enrol in second and further educational
programmes at the same level after having completed an earlier programme at that level
(returnees to a second programme). A repeater is one who is predominantly repeating the
same subject matter within the programme. Repeaters include re-entrants to the same
programme.
Over-age students are students who are older than the official school-age range for the
educational programme they are enrolled in and are defined as those at least two years
older than each grade’s intended age.
4.1.4. Graduates
A graduate is an individual who, during the reference school or academic year, has
successfully completed an education programme. Each graduate is counted only once,
even if they graduate from different levels or programmes within the same year. For
example, if students graduate from more than one programme at the same ISCED level in
the reference year for the data collection, it is the highest programme within the level that
counts. This is particularly important at secondary and tertiary levels of education where
a sequence of programmes may exist within a given level of education.
The requirements for successful completion of an education programme are normally
stipulated in the programme specifications. These usually include attendance requirements
and/or a demonstrated acquisition of expected knowledge, skills and competencies.
Successful completion must be distinguished from simple completion of a programme which
is achieved solely through fulfilling attendance requirements.
The acquisition of the knowledge, skills and competencies forming the learning objective of
an education programme is normally validated by:
passing (i.e. succeeding in) a final, curriculum-based examination or series of
examinations
accumulating the specified number of study credits
a successful formal assessment of the knowledge, skills and competencies
acquired.
In formal education, successful completion usually results in a qualification recognised
by relevant national education authorities. However, education programmes at ISCED
levels 1 and 2 (and occasionally at ISCED levels 3 or 4) do not always conclude with a
qualification. In this case, other criteria can be considered to determine successful
completion, such as having attended the full final year of the programme or gaining
access to a higher level of education.
Some programmes at ISCED levels 2 or 3 do not give access to programmes at a higher
ISCED level. Successful completion of these programmes is also considered to be
completion or partial completion of the level if the programme meets the following criteria:
4 - DEFINITIONS AND CLASSIFICATIONS OF THE OECD INTERNATIONAL EDUCATION STATISTICS │ 37
OECD HANDBOOK FOR INTERNATIONALLY COMPARATIVE EDUCATION STATISTICS 2018 © OECD 2018
it has a duration of at least two years of study at the given ISCED level
the cumulative duration since the start of ISCED level 1 is at least 8 years for
ISCED level 2 programmes and at least 11 years for ISCED level 3 programmes.
Adult education is a special case. It applies to formal education taken by adults to
improve their technical or professional qualifications, further develop their abilities and
enrich their knowledge by completing a level of education, to acquire, refresh or update
their knowledge, skills and competencies in a particular field. This also includes what
may be referred to as “continuing education”, “recurrent education” or “second chance
education”. Many countries do not recognise adult education as part of the formal
education system and therefore exclude it from data collection. Where formal adult
education programmes do exist, their graduates should be assigned to the most
appropriate ISCED levels rather than treated as a separate level of education, even if the
typical entry age and duration differ from formal initial education programmes.
For educational attainment purposes, any recognised qualifications obtained from the
successful completion of short programmes are classified at a lower ISCED level than
the programme itself.
4.1.5. Number of graduates
Graduates in the reference period can be either first-time graduates or repeat
graduates.
The flow of graduates within the reference period records the number of students who
have graduated during that time. Students are counted as graduating in the year in which
they complete all the requirements of the programme. For example, a student who
completed the final year of an upper secondary programme prior to the reference year but
passed the final examination during the reference year is counted as graduating in the
reference year.
A first-time graduate at a given level of education is a person who, during the
reference school or academic year, successfully completed an education programme
at the given level for the first time. First-time graduates only include those who have
never graduated from programmes at the same ISCED level before. The number of
first-time graduates is in general smaller than the total of all graduates in the
reference year. First-time graduates normally graduate from the first degree or
qualification level in the national degree structure. In some countries, however,
students may also graduate for the first time from second or further degrees.
A first-time graduate at the tertiary level is a person who, during the reference
school or academic year, successfully completed an education programme at the
tertiary level for the first time, i.e. at ISCED level 5, 6 or 7.
The sum of first-time graduates and repeat graduates in any year gives the total number of
graduations for that year. It is permissible to double count individuals across categories
over time. For example, a student obtaining a degree for the first time at ISCED level
6 in the reference year who had obtained a qualification at ISCED level 5 in an earlier
year can be counted as a first-time graduate at ISCED level 6 – but not as a first-time
graduate at the tertiary level.
The stock of graduates, in contrast to the flow of graduates in a given reference year,
reports the number of graduates at any point in time and is used to analyse the educational
attainment of the population. The educational attainment of the population is calculated

38 │ 4 - DEFINITIONS AND CLASSIFICATIONS OF THE OECD INTERNATIONAL EDUCATION STATISTICS
OECD HANDBOOK FOR INTERNATIONALLY COMPARATIVE EDUCATION STATISTICS 2018 © OECD 2018
based on the highest level of education completed by each individual member of the
population.
4.1.6. Grade of students
A grade is a specific stage of instruction in initial education, usually covered during one
academic year. Students in the same grade are usually of similar age. Grades are also
referred to as “classes”, “cohorts” or “years”.
Students generally remain within the same grade for the duration of the school year and,
on successful completion, proceed to the next grade the following year. If they do not
successfully complete a grade then they may repeat it.
Students taking subjects in more than one grade are allocated to the grade where they
spend the greatest amount of their time. Students not classifiable by grade (e.g. adults in
adult education) are allocated to the category “grade unknown”.
4.1.7. Age of students
Student age
According to the common reference point for age, students, graduates and new entrants
are classified by their age as of the 1st of January of the year in which the school or
academic year ends, e.g. 1 January 2016 for academic year 2015/16. An individual born
on 31 December 2004 will thus be counted as 11 years old, whereas one born on
1 January 2004 would be counted as 12 years old.
The choice of a common reference date, such as the 1st of January, can be problematic
when the school years being reported vary greatly between countries. This particularly
applies in Japan, Korea and New Zealand where the school year begins early in the year
and so a reference date of 1st January would record students’ ages at the end of the school
year. This is in contrast to most other countries where the 1st of January falls towards the
start of the school year. This difference may affect the comparability of net enrolment
rates for a single year age group, particularly before and after compulsory schooling.
Therefore, those countries may choose a reference date closer to the start of the school
year.
Typical age
The typical age is the conventional age of graduation from or entry into an education
level. The typical age of entry into an education level is defined as the age range which
covers at least half of the entry (which takes into account the number of new entrants of
each age but also the total number of men and women at that age). The typical age of
graduation from an education level is also defined as the age range covering at least half
of those graduating. The typical age is calculated taking into account the reference date
for students’ ages, which is by default the 1st
of January of the reference year.
4.1.8. Internationally mobile and foreign students
Students can be considered as either national students or internationally mobile students
(shortened elsewhere mainly to 'international students').
Internationally mobile students are individuals who have physically crossed an
international border between two countries with the objective of participating in
4 - DEFINITIONS AND CLASSIFICATIONS OF THE OECD INTERNATIONAL EDUCATION STATISTICS │ 39
OECD HANDBOOK FOR INTERNATIONALLY COMPARATIVE EDUCATION STATISTICS 2018 © OECD 2018
educational activities in the country of destination, where the country of destination is
different from their country of origin. Mobile students are enrolled as regular students in
any semester/term of a programme taught in the country of destination with the intention
of graduating from it in the country of destination and are expected to physically attend
most of the courses taught. In other words, distance learners are not considered to be
internationally mobile.
The measurement of student mobility depends to a large extent on country-specific
immigration legislation and constraints on data availability. Countries may define
international students as students who received their previous education in another
country or alternatively as those who are not residents of their country of study,
depending on which operational definition is most appropriate to their national context.
Foreign students are students who are not citizens of the country in which they are
pursuing education, but have not moved to the country with the sole intention of pursuing
education; they may have arrived as the result of other movements, such as immigration.
The status of internationally mobile student is thus dependent on the crossing of an
international border for the purpose of education and not on formal residence status in the
reporting country of destination. Usual residence is not a criterion to define mobility. For
example, “commuter students”, who live at home and commute to their classes in another
country are considered mobile if they are studying at tertiary level in a different country
from the one in which they were awarded their upper secondary leaving certificate. Nor
can citizenship be used as sole criterion to define mobility status. For example, students
who are citizens of the destination country but received their prior certificate abroad (also
known as “homecoming nationals”) are classified as mobile students for the destination
country.
Students in exchange programmes who undertake part of their studies at an educational
institution abroad are not counted as internationally mobile students in the country to
which they exchange. Exchange programmes (or short-term postings) are characterised as
normally lasting between three months and less than a full academic year. The defining
characteristic of such students is that they are given credits for their stay abroad by their
home institution where they originally enrolled and do not obtain their qualifications from
the institution to which they exchange.
The status of internationally mobile student is maintained for as long as continued
education at the same level of education lasts. This may involve several consecutive
education programmes with no or only minor gaps (less than a year) in between. Note
that all tertiary programmes are considered as belonging to the same level. Internationally
mobile students entering a programme at one level of tertiary education remain
internationally mobile if upon graduation they continue in a programme at another level
outside their country of origin.
Countries that do not have information on international students available may report
foreign students instead. This risks overestimating international mobility. When no other
suitable measure exists, country of citizenship may be used – but only as a last resort.
4.1.9. Full-time, part-time and full-time equivalents
Full-time and part-time students
Students are classified as full-time or part-time on the basis of their intended study load
within the reference period. The full-time/part-time distinction is therefore an attribute of

40 │ 4 - DEFINITIONS AND CLASSIFICATIONS OF THE OECD INTERNATIONAL EDUCATION STATISTICS
OECD HANDBOOK FOR INTERNATIONALLY COMPARATIVE EDUCATION STATISTICS 2018 © OECD 2018
the student’s study pattern rather than an attribute of the organisation of the educational
programme.
A full-time student is one committed within the reference period to an intended study
load of at least 75% of the normal full-time annual study load, where:
The intended study load is the study time or resource commitment expected of a
student enrolled in the given education programme during a single school or
academic year. For predominantly classroom-based study, time in the classroom
would be an adequate measure of this. This is a proxy measure for the amount of
instruction time that a student receives and can be counted in hours of instruction
during the reference school or academic year, the number of course credits taken,
or some combination of the two.
The normal full-time annual study load is the study time or resource commitment
expected of a typical student to complete a full-time full-year of a given education
programme.
Conversely, a part-time student is one whose intended study load is less than 75% of
the normal full-time annual study load.
The distinction between full-time and part-time programmes may also be based on the
characteristics of the education programmes themselves. In practice, the national context
tends to dictate which methods countries use to categorise students as full-time or part-
time and these tend to vary by level of education. For primary and secondary education,
the most frequent measure is student attendance at the institution or time in the classroom,
whereas at tertiary level study load is more likely to be measured in terms of instructional
hours and credit accumulation.
In the particular case of combined school- and work-based programmes, the work-based
component is considered a mandatory requirement to fulfil the programme. Therefore,
students participating in these dual system apprenticeship programmes are classified as
full-time students even though the school-based component comprises only part of the
programme.
Converting head-count data to full-time equivalents
The conversion of student head counts to full-time equivalents (FTEs) aims to express
study loads in a single standard unit which equates to a full-time, full-year student. To
determine the FTE of a given student, intended study load is divided by the corresponding
normal annual study load for the reference period.
For example if the normal study load during the reference school or academic year is 30
hours per week, someone who studies 15 hours per week would have an FTE of 0.5.
Given the definitions of full-time and part-time stated above it is possible for a full-time
student to have an FTE of less than one. For example, a student who studies 90% of the
normal annual study load is recorded as full-time but their FTE is 0.9. It is also possible
for a full-time student to have an FTE of more than one if they are enrolled in more than
one education programme or ISCED level during the reference academic year.
When converting student head-count data to FTEs, it is recommended:
Where data and norms on individual participation are available:
FTE = 𝐴𝑐𝑡𝑢𝑎𝑙 𝑠𝑡𝑢𝑑𝑦 𝑙𝑜𝑎𝑑
𝑛𝑜𝑟𝑚𝑎𝑙 𝑠𝑡𝑢𝑑𝑦 𝑙𝑜𝑎𝑑 𝑋
𝐴𝑐𝑡𝑢𝑎𝑙 𝑑𝑢𝑟𝑎𝑡𝑖𝑜𝑛 𝑜𝑓 𝑠𝑡𝑢𝑑𝑦 𝑑𝑢𝑟𝑖𝑛𝑔 𝑟𝑒𝑓𝑒𝑟𝑒𝑛𝑐𝑒 𝑝𝑒𝑟𝑖𝑜𝑑
𝑛𝑜𝑟𝑚𝑎𝑙 𝑑𝑢𝑟𝑎𝑡𝑖𝑜𝑛 𝑜𝑓 𝑠𝑡𝑢𝑑𝑦 𝑑𝑢𝑟𝑖𝑛𝑔 𝑟𝑒𝑓𝑒𝑟𝑒𝑛𝑐𝑒 𝑝𝑒𝑟𝑖𝑜𝑑
4 - DEFINITIONS AND CLASSIFICATIONS OF THE OECD INTERNATIONAL EDUCATION STATISTICS │ 41
OECD HANDBOOK FOR INTERNATIONALLY COMPARATIVE EDUCATION STATISTICS 2018 © OECD 2018
So, for example if the normal study load for a full-time student during the reference
period is 30 hours per week for 20 weeks, a student who studies 30 hours per week for 10
weeks would have an FTE of 0.5.
Where data and norms on individual student study loads are not available, then a
full-time student is considered equal to one FTE. Most countries will use this
assumption for the primary and secondary level of education. If equivalent
programmes exist separately as full-time and part-time programmes, then the ratio
of the theoretical durations of these programmes can be used as a proxy for the
conversion of part-time student head counts into full-time equivalents.
Early childhood education is a special case, since the concepts used to define full-time
and part-time participation are not easily applicable to ISCED level 0. The daily or
weekly hours that represent a typical full-time enrolment in an educational programme at
ISCED level 0 vary widely between countries. Currently, no consensus has been reached
on a methodology for calculating FTEs for early childhood education, but it is
recommended to consider all enrolments as full-time.
4.2. Educational personnel
4.2.1. Coverage of data on personnel
The term “education personnel” is used for teachers and other personnel engaging in a
broad number of activities including:
student instruction
professional support for students (whether academic or health/social support)
management and administration of the education service (both within and outside
educational institutions)
maintenance and operations of educational institutions
provision of services to educational institutions as a subcontractor.
These last are included if the personnel hired by the subcontractor are working
exclusively or mainly (i.e. at least 90% of the time) for the school or educational
institution throughout the period of the contract. For example, if the preparation of school
meals is subcontracted to a catering company, but company staffs are working exclusively
at the school for which they provide food, they are included as if they were employed by
the educational institution.
Therefore, educational personnel refer to all those employed in educational institutions
covering both instructional institutions (such as schools, colleges and universities) and
non-instructional institutions. This includes staff employed by national, regional and local
levels of government who administer the education system as well as staff in entities
providing support or ancillary services.
There are, however, certain exclusions:
Personnel from subcontracted services which cannot be distinguished from other
non-education services provided by the subcontractor. A typical example would
be that of a local transport company carrying out the school bus service as well as
other activities during the day. Similar situations might be encountered for

42 │ 4 - DEFINITIONS AND CLASSIFICATIONS OF THE OECD INTERNATIONAL EDUCATION STATISTICS
OECD HANDBOOK FOR INTERNATIONALLY COMPARATIVE EDUCATION STATISTICS 2018 © OECD 2018
building maintenance and school cleaning.
Retired teachers, including those who retired early, regardless of whether their
salary is still reported under expenditure on teacher salaries.
Educational personnel in the work-based component of combined school- and
work-based programmes. This approach is designed to improve comparability
across countries because virtually no country is able to report personnel in the
work-based component.
When determining the number of educational personnel, only individuals are counted,
irrespective of their assignments to specific programmes, levels or grades. Each staff
member is counted only once. If staff are assigned to more than one level or grade or
have more than one contract, numbers are divided proportionately according to the
percentage of contractual working hours devoted to each programme, level or grade
during the reference school or academic year.
Personnel for whom the teaching function and the management function are equally
important are treated as teachers and recorded as such. For example, a full-time teacher
with some management responsibilities who teaches for 60% of the average teaching time
of a full-time teacher will be counted as one full-time teacher and as 0.6 of a full-time
equivalent.
Special case: some analyses may wish to record the teaching responsibilities of all staff
whether classified as education personnel or not. For this purpose, school management
personnel who spend at least 0.25 of their working time teaching to a group or class of
students will be considered as having at least some teaching responsibilities.
4.2.2. Classification of educational personnel by function
The classification of educational personnel is intended to serve as a framework to classify
schools and other education system personnel for all levels of education (ISCED 2011
levels from 0 to 8). The classification is based on the primary or major functions
performed by staff and organises them into four main functional categories, three of
which are further broken down into sub-functions with specialised types of personnel:
1. instructional personnel
a. classroom teachers (ISCED 0-4); academic staff (ISCED 5-8)
b. teachers’ aides (ISCED 0-4); teaching/research assistants (ISCED 5-8)
2. professional support for students
a. pedagogical support (ISCED 0-4); academic support (ISCED 5-8)
b. health and social support (ISCED 0-8)
3. management/quality control/administration
a. school or institutional-level management (ISCED 0-8)
b. higher-level management (ISCED 0-8)
c. school or institutional-level administrative personnel (ISCED 0-8)
d. higher-level administrative personnel (ISCED 0-8)
4. maintenance and operations personnel (ISCED 0-6)
4 - DEFINITIONS AND CLASSIFICATIONS OF THE OECD INTERNATIONAL EDUCATION STATISTICS │ 43
OECD HANDBOOK FOR INTERNATIONALLY COMPARATIVE EDUCATION STATISTICS 2018 © OECD 2018
The following sections describe each of these categories in greater detail.
Instructional personnel
Classroom teachers and academic staff
A classroom teacher (ISCED 0-4) is defined as a person who plans, organises and conducts
a group of activities with the aim of developing students’ knowledge, skills and
competencies as stipulated by educational programmes. Teachers are employed in a
professional capacity to guide and direct the learning experiences of students, irrespective
of their training, qualifications or delivery mechanism. This category includes:
professional personnel whose primary or major activity is direct student
instruction
special education teachers in whichever setting they teach
other teachers who work with a whole class in a classroom, in small groups in a
resource room, or one-to-one inside or outside a regular classroom.
This category excludes:
educational staff whose primary function is something other than teaching, such
as managerial or administrative functions
student teachers and teachers’ aides.
Early childhood education is a special case. ISCED level 0 programmes are often
delivered by staff with varying levels of qualification, depending on their role in the
institution in which they are employed. For the purposes of reporting, reference should be
made to the relevant regulatory framework for detail on requirements for persons
providing or delivering an education programme to children in the years prior to primary
school (such as pedagogical qualifications, training or accreditation at various staffing
levels).
Academic staff (ISCED 5-8) includes personnel whose primary or major assignment is
instruction or research. This includes personnel who hold an academic rank with such
titles as professor, associate professor, assistant professor, instructor or lecturer and
personnel with other titles (such as dean, director, associate dean, assistant dean, chair or
head of department), if their principal activity is instruction or research.
This category excludes student teachers, teachers’ aides and paraprofessionals.
Teachers’ aides and teaching/research assistants
Teachers’ aides (ISCED 0-4) include not professionally qualified personnel who support
teachers in providing instruction to students and other paraprofessional personnel who are
employed on a full-time or part-time basis by an education system.
It excludes student teachers or other personnel who do not get paid for their employment.
At early childhood education level, support personnel are not regarded as teachers’ aides
unless they perform educational functions involving groups of pupils on a regular basis.
Teaching/research assistants (ISCED 5-8) includes all students employed on a part-
time basis for the primary purpose of assisting in classroom or laboratory instruction or in
the conduct of research. Personnel in these positions are typically graduate students who

44 │ 4 - DEFINITIONS AND CLASSIFICATIONS OF THE OECD INTERNATIONAL EDUCATION STATISTICS
OECD HANDBOOK FOR INTERNATIONALLY COMPARATIVE EDUCATION STATISTICS 2018 © OECD 2018
hold such titles as teaching assistant, teaching associate, teaching fellow or research
assistant, or equivalent personnel with other titles.
Professional support for students
Pedagogical and academic support
Pedagogical support (ISCED 0-4) includes professional staff providing services to
students to support their instructional programme such as guidance counsellors,
librarians, educational media specialists and attendance officers. In many cases, these
personnel were originally licensed as teachers but then moved into other professional
positions in education systems.
Academic support (ISCED 5-8) includes all personnel whose primary responsibility is
to support students’ academic programmes. It covers the same categories of staff included
under pedagogical support as well as other professional support staff employed in tertiary
education institutions.
Health and social support
This category includes all personnel employed in education systems who provide health
and social support services to students such as:
health professionals such as doctors, dentists, ophthalmologists, optometrists,
hygienists, nurses and diagnosticians
psychiatrists and psychologists
speech pathologists and audiologists
occupational therapists
social workers.
Management, quality control and administration
School or institution-level management
School-level management (ISCED 0-4) covers professional personnel whose
primary or major responsibility is leadership, school management and/or
administration. It includes school heads, principals, assistant principals,
headmasters, assistant headmasters, head teachers, assistant head teachers and
other management staff with similar responsibilities. It does not include
receptionists, secretaries, clerks and other staff who support the administrative
activities of the school.
Institution-level management (ISCED 5-8) covers personnel whose primary or
major responsibility is the management of the institution, or a recognised
department or subdivision of the institution. This category includes personnel
with the following titles or their equivalents, if their primary activity is
administrative: president, vice president, dean, director, chancellor, associate
dean, assistant dean, executive officer or department head.

4 - DEFINITIONS AND CLASSIFICATIONS OF THE OECD INTERNATIONAL EDUCATION STATISTICS │ 45
OECD HANDBOOK FOR INTERNATIONALLY COMPARATIVE EDUCATION STATISTICS 2018 © OECD 2018
Higher-level management
Higher-level management (ISCED 0-4) covers personnel whose primary or major
responsibility is quality control and the management of the education system at levels above
that of the school. These personnel may be employed by local boards of education, state or
regional ministries or departments of education, or by national ministries or departments
of education. Their work may involve direct administration or other functions that support
the operation of education systems such as planning, evaluation, budgeting and
accounting, and public information. This category includes the following types of
personnel: superintendents of schools, associate and assistant superintendents,
commissioners of education, associate and assistant commissioners, directors of
instruction and curriculum, directors of planning and evaluation, and other equivalent
titles. This category excludes personnel whose main activity is teaching but have some
management responsibilities.
Higher-level management (ISCED 5-8) covers personnel with similar functions
described above for ISCED 0-4. It also includes other administrative/management positions
specific to the tertiary education sector.
School or institution-level administrative personnel
School-level administrative personnel (ISCED 0-4) covers all personnel who support
the administration and management of the school. This category includes receptionists,
secretaries, typists and word processors, bookkeepers and clerks, and photocopying
assistants.
Institution-level administrative personnel (ISCED 5-8) covers all personnel with
similar functions described above for ISCED 0-4, and other personnel who support the
administrative / management functions of the institutions. These other personnel include:
accountants, analysts, auditors, computer programmers, systems analysts, evaluators,
financial aid officers, grant developers, lawyers, network administrators, public relations /
informational services officers, registrars, and others with similar functions and
responsibilities.
Higher-level administrative personnel at all ISCED levels
This category covers personnel who support the administrative or management functions
of the education system at the higher level. These personnel may be employed by local
boards of education, state or regional ministries or departments of education, or by national
ministries or departments of education.
Maintenance and operations personnel
At all ISCED levels, maintenance and operations personnel include personnel who
support the maintenance and operation of schools, school security, and ancillary services
such as the transportation of students to and from school, and food services operations. It
includes the following types of personnel:
masons, carpenters, electricians, locksmiths, maintenance repairers, painters and
paperhangers, plasterers, plumbers, and vehicle mechanics
bus drivers and other vehicle operators, construction workers, gardeners and
groundskeepers, bus monitors and crossing guards, cooks/food caterers,
custodians, food servers, dormitory supervisors, and security guards.
46 │ 4 - DEFINITIONS AND CLASSIFICATIONS OF THE OECD INTERNATIONAL EDUCATION STATISTICS
OECD HANDBOOK FOR INTERNATIONALLY COMPARATIVE EDUCATION STATISTICS 2018 © OECD 2018
4.2.3. Age of educational personnel
As when reporting the ages of students (see Section 4.1.7), educational personnel are
classified by their age as of 1st January of the year in which the school or academic year
ends (for example 1 January 2016 for academic year 2015/16). For example, in a country
where the school year runs from September to August, a teacher born on 31 December
1985 will be reported as aged 30 for the academic year 2015/16, whereas one born on
1 January 1986 will be reported as aged 29.
Countries where the 1st of January falls at the end of the school year may choose to
reference the ages of personnel at some time closer to the start of the school year and
redistribute the ages on the same basis as the estimation described for student data in
Section 4.1.7. The strict comparability of the reference dates for the ages of personnel is,
however, likely to be less of an issue than it is for the student data where the calculation of
participation rates are more sensitive to reporting differences.
Educational personnel not classifiable by age are allocated to the category “age
unknown”.
4.2.4. Employment status of educational personnel
Full-time and part-time educational personnel
The classification of educational personnel into full-time and part-time staff is done on the
basis of contractual working time. This classification is regarded as an attribute of their
individual contract of employment rather than as an attribute of the educational
programmes or the provision of education in general in which they are involved.
Full-time employment in each country will be defined differently but will usually be
based on the number of normal or statutory working hours which are expected of a full-
time employee. The normal or statutory working hours of educational personnel are those
needed to meet the requirements according to the official national policies or laws of full-
time employment at a specific level of education, or in the job or role in which they are
employed, over a full school or academic year.
In order to determine whether educational personnel are full-time or part-time, their
contractual working hours should be compared to the normal or statutory number of hours
for full-time educational personnel according to the national norms or conventions at the
given level of education.
The definitions of full-time and part-time educational personnel in the OECD education
statistics are stated relative to these national norms for each category of educational staff
as follows:
Full-time educational personnel are defined as employees who are employed for at least
90% of the normal or statutory working hours of educational personnel in the same job or
role at the given level of education over a complete school year.
Part-time educational personnel are employed for less than 90% of the normal or
statutory working hours of educational personnel in the same job or role at the given level
of education.
Note that the 90% cut-off point for educational personnel is different from the 75% cut-off
point for students. This reflects the greater standardisation within countries on the normal
4 - DEFINITIONS AND CLASSIFICATIONS OF THE OECD INTERNATIONAL EDUCATION STATISTICS │ 47
OECD HANDBOOK FOR INTERNATIONALLY COMPARATIVE EDUCATION STATISTICS 2018 © OECD 2018
working hours of full-time educational personnel in a given job or role compared with the
intended study load of full-time students.
Converting head-count data to full-time equivalents
Head counts of educational personnel are converted to FTEs in a similar way to students.
The aim is to express working hours during the reference period as a single standard unit
which equates to full-time, full-year educational personnel. FTEs are determined by
dividing contractual working hours by the corresponding normal or statutory working
hours for the reference period.
For example if the normal or statutory working hours during the reference school or
academic year is 30 hours per week, someone who works 15 hours per week would have
an FTE of 0.5. Given the definitions of full-time and part-time given earlier it is possible
for full-time educational personnel to have an FTE of less than one. For example, a
teacher who works 90% of the normal or statutory working hours of a full-time teacher
should be recorded as full-time but their FTE should be 0.9. It is also possible for full-
time educational personnel to represent more than 1 FTE if they have more than one
employment contract during the reference school or academic year. In these cases, they
should be reported as full-time educational personnel but with FTEs greater than 1.
The conversion to FTEs is often difficult for non-teaching educational personnel. Some
countries collect data on the number of contracted hours worked in a typical week for
certain categories of non-teaching staff, which are then converted into FTEs as above.
Classification of educational personnel involved in multiple education
programmes
It can be difficult to classify educational personnel whose work is divided between
different types of institutions (public/private), different levels of education, different
orientations (general/vocational) or between different functions (such as teaching and
administration). In this case, the calculation of head counts and FTEs will differ:
For reporting head counts: first, the total number of educational personnel is split into
those who are full-time and those who are part-time by aggregating their contractual
working hours over all of their activities. The full-time and part-time numbers are then
pro-rated between education levels, education programmes, types of institutions and
functions on the basis of the most appropriate data available relating to the split.
For example, in the absence of any better information, the numbers of educational
personnel who work exclusively in public and private institutions respectively can be
used to pro-rate the numbers who share their time between the two.
For reporting full-time equivalents, educational personnel are apportioned to the
different levels, education programmes, types of institutions and functions in proportion
to the amount of contractual working time that they spend on each function. For example,
a teacher whose working time totals 0.8 of an FTE teacher, and who spends 50% of their
time teaching ISCED 2 and 50% teaching ISCED 3 should be allocated as 0.4 FTE to
each of ISCED 2 and ISCED 3.
4.2.5. Classification of teachers by the orientation of education programmes
Teaching staff can be involved in the instruction of students on programmes with
different orientations: general, pre-vocational or vocational.

48 │ 4 - DEFINITIONS AND CLASSIFICATIONS OF THE OECD INTERNATIONAL EDUCATION STATISTICS
OECD HANDBOOK FOR INTERNATIONALLY COMPARATIVE EDUCATION STATISTICS 2018 © OECD 2018
The criterion used to classify teachers is the characteristics of the education programmes
followed by the students, rather than the specific subjects taught by the teachers.
In countries which do not have a reporting system which classifies teachers directly by
the level and orientation of the programmes they teach, then, for the purpose of reporting
head-count data, teachers are pro-rated according to the time they are assigned to the
corresponding levels and type of educational programmes. Teachers in different types of
programmes are divided in proportion to their contractual working hours. For the
reporting of full-time equivalents, teachers are apportioned according to their contractual
working time in the respective programmes.
4.2.6. Teachers’ working time, teaching time and non-teaching time
Teachers’ working time is defined as the number of hours per year that a full-time
teacher is expected to work according to the formal policy of that country. This should
exclude overtime, non-specified preparation time and days that the school is closed for
public holidays, vacations, and festivities. Days or periods of self-regulated professional
development which take place during school holidays should also not be reported as
working time. To account for non-specified working time in countries where teachers are
also subject to other labour regulations (like those that pertain to public employees), the
working time of the relevant part of the labour force is also measured (i.e. the statutory
working time of public employees).
Working time in school is defined as the working time teachers are supposed to be at
school, including both teaching and non-teaching time.
Teachers’ working time can be divided into teaching time and non-teaching time:
Teaching time is defined as the number of hours per year that a full-time teacher teaches
a group or class of students according to the formal policy in that country each year.
Activities such as professional development days, student examination days, attendance
at conferences, and time devoted to the preparation of classes should not be counted as
teaching time. Teaching time is calculated as the net contact time for instruction,
excluding any time allocated for breaks of ten minutes or more, and days that the school is
closed for holidays. To ensure measures of teaching time are comparable, teaching periods
must be transformed into 60-minute periods (e.g. a 45-minute lesson = 0.75 hour).
The formula used to calculate hours of teaching time per year is the following product:
∏(𝑁𝑢𝑚𝑏𝑒𝑟 𝑜𝑓 𝑡𝑒𝑎𝑐ℎ𝑖𝑛𝑔 𝑑𝑎𝑦𝑠 𝑝𝑒𝑟 𝑦𝑒𝑎𝑟, 𝑁𝑢𝑚𝑏𝑒𝑟 𝑜𝑓 𝑡𝑒𝑎𝑐ℎ𝑖𝑛𝑔 ℎ𝑜𝑢𝑟𝑠 𝑝𝑒𝑟 𝑑𝑎𝑦)
Where the number of teaching days per year = number of teaching days per week
multiplied by the number of teaching weeks per year minus the number of days that the
school is closed for holidays. The number of teaching hours per day is converted into 60-
minute periods, excluding breaks of ten minutes or longer.
An exception to the use of this formula is the calculation of teaching time at the pre-primary
and primary level, where short breaks are included if the classroom teacher is responsible for
the class during these breaks. However, even at these levels, lunch breaks should not be
included.
All data relating to teachers’ working and teaching time should refer to the situation that
applies according to the formal policy in each country. This formal policy may be framed
in terms of minimum, maximum or typical requirements. Where the regulations vary
within the country (e.g. by region, school type or teacher group), weighted averages of
4 - DEFINITIONS AND CLASSIFICATIONS OF THE OECD INTERNATIONAL EDUCATION STATISTICS │ 49
OECD HANDBOOK FOR INTERNATIONALLY COMPARATIVE EDUCATION STATISTICS 2018 © OECD 2018
these regulations can be used, according to the number of teachers to which the variations
apply. When this is impractical, countries should consider the teaching and working
requirements of the typical teacher.
Non-teaching time refers to the number of hours a full-time teacher spends per year,
according to the formal policy, on:
teaching-related tasks, such as lesson preparation, correction of assignments and
tests, supervision activities, meetings about student reporting, annual exams, and
meetings with parents
general school tasks, such as providing student support, cultural activities,
meetings, supervision of students during breaks and administrative tasks
professional development activities, such as observational visits to other schools,
attending internal or external conferences, workshops and training.
Some of these activities may take place inside or outside of the school, depending on the
formal policy in that country.
Actual teaching time is the annual average number of hours that full-time teachers teach
a group or class of students, including overtime. The data can be gathered from
administrative registers, statistical databases, representative sample surveys or other
representative sources.
4.2.7. Teachers’ statutory and actual salaries
The annual gross statutory salary consists of teachers’ pay according to existing salary
scales including any additional benefits that all teachers receive and that constitute a
regular part of the annual base salary, such as a thirteenth month or holiday bonus. These
salary scales can be based on regulations or agreements between stakeholders, such as
teachers’ unions, local authorities or school boards.
For example in Spain, the trienios (a small salary supplement added to the salary of
teachers after every three-year period of service) and the sexenios (a salary supplement
added after each six-year period and related to in-service training) are included in the
annual gross statutory salary figures.
This approach can be considered as the gross salary from the employee’s point of view, since
it includes any social security contributions and pension scheme contributions that are paid by
employees, even if they are deducted automatically from the employee’s gross salary by
the employer. However, it excludes any employers’ premiums for social security and
pension contributions. For example a teacher in the United Kingdom receives a monthly
gross salary from which some 6% is automatically deducted as the employee’s contribution
towards the national insurance scheme. Separately, the teacher’s employer pays an
employer’s contribution towards the scheme. In this case, the gross salary reported is the
salary before the deduction of the 6% but not including the employer’s contribution.
Data on statutory salaries are collected at four points on the salary scale (for a specific
level of qualifications of teachers, as explained in Section 4.2.8.): starting salaries,
salaries after 10 years of experience, salaries after 15 years of experience and salaries at
the top of the scale.
Starting salaries refer to the average scheduled gross annual salary for a full-time
teacher at the beginning of his or her teaching career.

50 │ 4 - DEFINITIONS AND CLASSIFICATIONS OF THE OECD INTERNATIONAL EDUCATION STATISTICS
OECD HANDBOOK FOR INTERNATIONALLY COMPARATIVE EDUCATION STATISTICS 2018 © OECD 2018
Salaries after 10 and 15 years’ experience refer to the scheduled annual salary of a
full-time classroom teacher with 10 and 15 years’ experience.
Salaries at the top of the scale refer to the maximum salaries of a full-time
classroom teacher.
Progression in the salary range (from starting point to the top) only reflects pay increases
resulting from the number of years in service. It excludes salary increases due to other
factors, such as the completion of continuing professional development activities.
Teachers may acquire other compensation, such as bonuses and allowances on top of
their statutory salaries, in addition to the amount received on the basis of educational
qualification and experience. These may be awarded for teaching in remote areas, for
participating in school improvement projects or special activities, for taking on
management responsibilities in addition to teaching duties (such as serving as a head of
department or co-ordinator of teachers in a particular class/grade), or for excellence in
teaching performance.
The actual gross salary is the annual money earnings actually received by qualified full-
time teachers as direct payment for labour services provided, before taxes. It is the gross
salary from the employee’s point of view, since it includes the portion of any social
security and pension scheme contributions paid by employees, even if deducted
automatically from the employees’ gross salary by the employer. However, it excludes
any employers’ contributions towards social security and pension schemes. Work-related
payments such as annual bonuses, result-related bonuses, extra pay for holidays and sick-
leave pay from employer(s) should also be included. Income from other sources, such as
government social transfers, investment income and any other income not directly related
to their profession are not to be included. These data can be derived from a variety of
sources, including administrative registers, statistical databases, representative sample
surveys and other representative sources.
Remarks
Definitions here might be different from those in Section 4.5.5 because they refer to different data sources.
4.2.8. Teacher qualifications
A fully qualified teacher is one who has fulfilled all the training requirements for teaching
(a certain subject) and meets all other administrative requirements, such as a successful
probation period, according to the formal policy of a country (e.g. a bachelor’s degree
plus a competitive examination plus an induction programme). The qualification level
refers to the entry point to the teaching profession. In a few countries, all teachers must
obtain further qualifications to move up in the salary range. Professional experience or
number of years in service can also be recognised as further qualifications. In this case,
the qualification level will be considered to be that of the starting teachers, even though
teachers with a certain number of years’ service may have further qualifications.
Sometimes, changes in the qualification level are compulsory for all teachers after a
certain number of years in the teaching profession.
The minimum level of qualification or training required to teach at a given ISCED
level is defined as the minimum duration and type of training required for entry into the
profession in the reference year. It does not include any eventual further requirements to
become a licensed teacher in the public school system, such as completing probation
years. In a few countries, the minimum qualification requirements to enter the teaching
4 - DEFINITIONS AND CLASSIFICATIONS OF THE OECD INTERNATIONAL EDUCATION STATISTICS │ 51
OECD HANDBOOK FOR INTERNATIONALLY COMPARATIVE EDUCATION STATISTICS 2018 © OECD 2018
profession may have changed over time. As a result, the minimum level of qualification
of teachers with 10 or 15 years of experience and at the end of their careers may be
different from the stated qualification level for starting teachers.
The higher than minimum qualification (if most prevalent) to enter the teaching
profession in the reference year is defined as the level of qualification and training
higher than the minimum that is held by the largest proportion of teachers (among all
teachers at a given level of education) and recognised through a specific salary range.
Information on teachers with this qualification is collected to give a more representative
perspective in countries where most teachers hold a qualification higher than the
minimum to enter the teaching profession and which is also recognised by the
compensation system. In all other countries, the most prevalent qualification is considered
to be the minimum qualification. In a few countries, the most prevalent qualification for
teachers with 10 or more years of experience may be different from the most prevalent
qualification at entry to the profession in the reference year, especially when qualification
requirements have changed over time.
The maximum level of qualification or training is defined as the highest level of
qualification recognised from the point of view of compensation. The maximum
qualification may correspond with the minimum qualification or a higher than minimum
qualification to enter the teaching profession that is held by the largest proportion of
teachers. In a few countries, the maximum qualification requirements for teachers with 10
or more years of experience may be different from the maximum qualification at entry to
the profession in the reference year.
The most prevalent level of attainment refers to the ISCED 2011 level of attainment
reached by the greatest proportion of teachers in the system at a given time (e.g. the
reference year of the reported data).
4.3. School organisation and curriculum
4.3.1. Instruction time
Two measures of instruction time are collected: intended and actual instruction time.
Intended instruction time
Intended instruction time is defined as the amount of time a student ought to receive
instruction from a classroom teacher during the year.
Intended instruction time includes:
the amount of instruction time a public school is expected to provide to students
on all subjects integrated into the compulsory and non-compulsory curriculum
(see Section 4.3.2) on the school premises
time spent on out-of-school activities which are a formal part of the compulsory
programmes.
Intended instruction time excludes:
breaks between classes or other types of interruptions
non-compulsory time outside the school day
time dedicated to homework activities

52 │ 4 - DEFINITIONS AND CLASSIFICATIONS OF THE OECD INTERNATIONAL EDUCATION STATISTICS
OECD HANDBOOK FOR INTERNATIONALLY COMPARATIVE EDUCATION STATISTICS 2018 © OECD 2018
individual tutoring or private study
days when schools are closed for festivities, such as national holidays, and days
when students are not expected to be at school because of teacher development
days or examination periods.
Table 4.1. List of study areas (subjects) used in the questionnaire:
Term Definition
Reading, writing and literature (L1)
Covers skills such as spelling, reading and writing in the language of instruction and includes subjects such as grammar, the language of instruction and literature. It can be considered as the first language taught to students. If there are two languages of instruction in almost
every public school, then the hours allocated to reading, writing and literature in both languages of instruction should be reported.
Mathematics Covers all numeracy skills and subjects such as arithmetic, algebra, geometry and statistics.
Natural sciences Includes subjects such as science, physics, chemistry, biology, environmental sciences and ecology.
Social sciences Includes subjects such as history, geography and all related studies. May also include community studies, social and political instruction, and philosophy or civics education.
Languages (2-5) Includes subjects that develop students’ knowledge of a language viewed in the curriculum as “foreign” (or modern) languages, other national languages and/or regional and minority languages. This definition of languages in the curriculum is educationally based and
unrelated to the political status of the languages.
Physical education and health
Includes subjects such as education in sports and health-enhancing physical activities, as well as time devoted to instruction in competitive and traditional games, gymnastics, swimming, athletics, dance or other activities that develop pupils’ physical and social
competences (including knowledge, skills, psychomotor co-ordination, co-operation and leadership) and an active healthy lifestyle.
Arts education Includes subjects such as arts, history of arts, music, visual arts, drama, music and dance performance, photography, and creative handicraft.
Religion/ ethics/ moral education
Includes subjects whose aim it is to teach the principles and history of one or more religions and subjects such as ethics whose aim it is to determine how to live and behave in accordance with human and social principles.
Information and communication technologies (ICT)
Includes subjects such as informatics, information and communication technologies or computer science. These subjects include a wide range of topics concerned with the new technologies used for the processing and transmission of digital information, including computers,
computerised networks (including the Internet), microelectronics, multimedia, software and programming.
Technology Includes subjects that provide knowledge on the practical use of scientific or technological discoveries that use specific instruments and
processes, such as construction, electricity, electronics, graphics and design.
Practical and vocational skills
Includes vocational skills (preparation for a specific occupation), accountancy, business studies, career education, clothing and textiles, driving and road security, home economics, nursing, secretarial studies, tourism and hospitality, woodwork, metalwork, and sewing.
Other subjects Includes different subjects that cannot be classified within the other groups or which specifically reflect national concerns. The following types of subjects could be included in this category: Latin, ancient Greek, classical studies, minority languages that have not been
reported in the Languages 2-5 columns, environmental education, and personal development and well-being.
The “other subjects” must be part of the compulsory curriculum to be provided by schools. Form time, assemblies and tutoring should only be included if they are compulsory, have an educational component and are aimed at all students.
Compulsory subjects with flexible timetable (total time devoted to…)
Includes the total amount of instruction time indicated by the central authorities for a given group of subjects, which regional authorities, local authorities, schools or teachers allocate to individual subjects. There is flexibility in the time spent on a subject, but not in the
subjects to be taught. For example, central authorities may define the total number of hours that students should be studying reading, writing and literature; mathematics; science; and modern foreign languages per year and schools may choose how to distribute this time
between these individual subjects.
Compulsory options chosen by the students
Includes the total amount of instruction time on one or more subjects that pupils have to select (from a set of subjects that it is compulsory for schools to offer) in order to cover part of their compulsory instruction time. This only applies if students have a choice between different
subjects and not a choice within a subject category. For example, students may be able to choose between studying a second foreign language or computer science or economics, but it is compulsory for them to study one of these options.
Compulsory flexible subjects chosen by schools
Includes the total amount of compulsory instruction time indicated by the central authorities, which regional authorities, local authorities, schools or teachers allocate to subjects of their choice (or subjects they chose from a list defined by central education authorities). For
example, schools may be able to choose between offering religious education or more science, or art but, but it is compulsory for the school to offer one of these subjects and the students must study it.
Non-compulsory curriculum
Includes the total amount of instruction time to which students are entitled beyond the compulsory hours of instruction and that almost every public school is expected to provide. Subjects can vary from school to school or from region to region and take the form of elective
subjects. For example, students may have the possibility to take an enriched maths course or to study an additional foreign language, above the compulsory hours of instruction. Students are not required to choose one of these elective subjects, but all public schools are
expected to offer them the possibility. Please note that additional activities before/after classes offered by the school are not per se part of non-compulsory curriculum if they can be considered as non-formal instruction. For example, non-compulsory education excludes
additional activities such as morning care classes or after-school care classes, even if they are officially regulated.
4 - DEFINITIONS AND CLASSIFICATIONS OF THE OECD INTERNATIONAL EDUCATION STATISTICS │ 53
OECD HANDBOOK FOR INTERNATIONALLY COMPARATIVE EDUCATION STATISTICS 2018 © OECD 2018
Although instruction time can be recorded in different units in different countries, it is
converted into hours (of 60 minutes) per grade for the purpose of comparing statistics on
educational indicators.
The subject areas taught during compulsory education vary depending on the country.
They have therefore been grouped into more general subject areas, in order to be able to
compare the collected information. The scope, however, is not identical for each of the
subject categories. Certain subject categories (e.g. natural sciences) cover several taught
subjects (physics, chemistry or biology), whereas others are more specific
(e.g. technology). Table 4.1 defines the subject categories that are included in the data
collection on instruction time.
Actual instruction time
Actual instruction time is defined as the average instruction time, by subject, in each
grade in schools. Actual instruction time refers to the instruction time actually provided in
schools, taking into account the cancellation of lessons for a variety of reasons (e.g.
school closures, teacher absenteeism and strikes).
Actual instruction time is especially relevant for countries without central
recommendations on the intended curriculum and countries that delegate the setting of
instruction time to schools or local authorities. Additionally, for countries with
regulations on the distribution of intended instruction time, data on the actual instruction
time will help to present the national situation in a more accurate way.
4.3.2. Curriculum
The national curriculum is usually set out in a document describing the common goals,
objectives and quality and/or content criteria of a national school system. This document
may take the form of standards (defined objectives and achievement criteria at given
levels of education and in specific subjects of study areas) without allocating actual time
or mentioning subjects. It may also resemble a timetable, specifying the number of
periods for each subject and in each grade by programme. It may also indicate the extent
to which decisions on curriculum content and final time allocation can be made at the
local or school level.
The intended (or prescribed) curriculum’s goals, structure, subjects and notional student
workload may be based on the regulations or standards of the top-level authority
responsible for education. The top-level authority is usually the state, but in some
countries the competencies lie (or are shared) with sub-state entities such as regions. The
regulations or standards may document the different elements of the curriculum as a
whole, as well as the instruction time linked to each subject. Alternatively, they might
only include information on the goals and the content of the subjects, and delegate the
distribution of instruction time to other complementary documents. All of these sources
of information may be used to collect data about the time allocation between subjects and
educational stages.
The intended curriculum comprises both compulsory and non-compulsory parts of the
curriculum.
The compulsory curriculum refers to the amount and allocation of instruction time that
has to be provided in almost every public school and must be attended by almost all
public sector students. The compulsory curriculum may be flexible in various ways,
giving local authorities, schools, teachers and/or students varying degrees of freedom to

54 │ 4 - DEFINITIONS AND CLASSIFICATIONS OF THE OECD INTERNATIONAL EDUCATION STATISTICS
OECD HANDBOOK FOR INTERNATIONALLY COMPARATIVE EDUCATION STATISTICS 2018 © OECD 2018
choose the subjects and/or the allocation of compulsory instruction time (see
Section 4.3.1). Its goals, structure, subjects and students’ notional workload may be based
on regulations or standards from the central (top-level) authority responsible for
education. Again, this central authority is usually the state, but in some countries the
competence lies (or is shared) with sub-state entities, such as regions.
The non-compulsory curriculum is included when almost all public sector students are
entitled to instruction time above the compulsory hours of instruction. For example,
educational authorities may expect almost every public school to allocate resources to
teaching elective subjects. These subjects often vary from school to school or from region
to region, and may take the form of non-compulsory elective subjects.
4.3.3. Classes and class size
Data on average class sizes are collected for primary and lower secondary education.
A class is a group of students who receive tuition together.
Class size is simply the number of students in the group who receive tuition together. In
general, the calculation of average class size is simply the total number of students divided
by the total number of classes. Students attending special-needs programmes are excluded
from this data collection to ensure comparability between countries.
At primary and secondary education levels, class size is computed by division. A
division, often commonly referred to as a class, is made up of the students who are
following a common course of study. Students may only be registered in one division,
and grouped together based on the highest number of common courses, usually
compulsory studies. A division is therefore the pedagogical structure in which each
student is enrolled.
In some cases, divisions can be further divided into sub-groups according to the modules
being taught. While the concept of average class size can be applied to either the division
or the sub-group, this manual uses the average class size per division, as divisions are
more commonly used than sub-groups to partition programmes across education levels.
For example, if a teacher has a division of 28 pupils during 8 hours, and this division is
also divided in two sub-groups of 14 students during 1 hour for a specific module, then
the average size of the class is considered to be the number of students per division =
28/1=28, without consideration for the sub-groups. For more details on class-size
calculations see Chapter 7, Section 7.9.2.
4.4. Educational institutions
Although educational institutions are no longer a statistical unit for the purpose of regular
international data collections (data on the number of educational institutions are no longer
collected), the definition of educational institutions is crucial in defining the coverage of
educational expenditure. In the context of lifelong learning, educational institutions
remain important because of their role in formal education.
4.4.1. Basic definition
Educational institutions are defined as entities that provide either core or peripheral
educational goods and services to individuals and other educational institutions.

4 - DEFINITIONS AND CLASSIFICATIONS OF THE OECD INTERNATIONAL EDUCATION STATISTICS │ 55
OECD HANDBOOK FOR INTERNATIONALLY COMPARATIVE EDUCATION STATISTICS 2018 © OECD 2018
This definition leaves some ambiguity surrounding the definition of institutions as
separately identifiable statistical units. In particular, the issue of whether an institution
with several campuses should be regarded as a single or multiple institutions still needs to
be properly addressed. Further complications arise where campuses are located in another
country and in the area of distance learning, where courses are Internet based. Further
work is needed in this area.
For instance, an institution in country A may have a campus or outpost in country B (i.e.
a foreign campus). Country B should report enrolments and finance for the foreign
campus in the same manner as it reports activities of its domestic educational institutions.
The mobile status of the students at these campuses should be determined as for all other
students. Foreign campuses which in practice do not accept students from the host
country (for example schools provided for the children of military personnel based
outside their home country) should be treated in the same way as other foreign campuses.
Whether or not an entity qualifies as an educational institution is not contingent upon
which public or private authority (if any) has responsibility for it. For example, tertiary
institutions are classified as educational institutions regardless of which ministry or other
authority may have ultimate responsibility for them. In some countries, the ministry of
agriculture or defence might have responsibility for some institutions.
4.4.2. Instructional and non-instructional educational institutions
Instructional educational institutions are institutions such as schools, colleges and
universities, whose main purpose is to provide educational programmes for students and
which fall within the scope of education statistics. Instructional institutions are typically
where students enrol in order to study educational programmes. Such institutions are
normally accredited or sanctioned by the relevant national education authorities or
equivalent authorities. Instructional educational institutions may also be operated by
private organisations, such as religious bodies, special interest groups or private
educational and training enterprises, both for profit and non-profit.
The generic term “school” is often used to refer to instructional institutions at the primary,
secondary and post-secondary non-tertiary levels, and “universities” to those at the
tertiary level.
Non-instructional educational institutions are educational institutions providing
education-related administrative, advisory or professional services for individuals or other
educational institutions. Non-instructional educational institutions include the following
types of entities:
Entities administering educational institutions: institutions such as national,
state, and provincial ministries or departments of education; other bodies that
administer education at various levels of government (e.g. the administrative
offices of local education authorities and education officers of municipalities, and
central agencies responsible for the remuneration of staff or pension payments);
and analogous bodies in the private sector (e.g. diocesan offices administering
Catholic schools and agencies administering admissions to universities).
Entities providing support services to other educational institutions including
institutions that provide educational support and materials as well as operation and
maintenance services for buildings. These may be part of general-purpose units of
public authorities. An example of an institution providing educational support in
Greece is the Textbook Publishing Organisation (OEDB) whose chief

56 │ 4 - DEFINITIONS AND CLASSIFICATIONS OF THE OECD INTERNATIONAL EDUCATION STATISTICS
OECD HANDBOOK FOR INTERNATIONALLY COMPARATIVE EDUCATION STATISTICS 2018 © OECD 2018
responsibility is to publish and distribute all books and printed material necessary
for all levels of education. The OEDB is an agency overseen by the Ministry of
Education, but not formally part of it.
Entities providing ancillary services: separate organisations providing
education-related services such as vocational and psychological counselling,
placement, transportation of students, and student meals and housing. In many
countries, general-purpose units of public authorities (states or municipalities)
provide maintenance and ancillary services such as administering student
transport. Although they cannot be defined as educational institutions as a whole,
the expenditure and personnel committed to the education-related services they
provide should be included in data collection. In that sense, general-purpose units
of public authorities should be treated as educational institutions to the extent that
they provide services to schools or students.
4.4.3. Classifying public and private institutions
Basic classification criteria
Educational institutions are classified as either public or private. Private institutions are
further divided into government-dependent and independent private institutions.
An institution is classified as public or private depending on whether a public agency or a
private entity has overall control over it. Overall control is decided with reference to who
has the power to determine the general policies and activities of the institution and to
appoint the officers managing it. Overall control will usually also extend to the decision to
open or close the institution. As many institutions are under the operational control of a
governing body, the constitution of that body will also have a bearing on the classification.
An institution is classified as public if it is controlled and managed:
directly by a public education authority or agency of the country where it is
located
directly by a government agency or by a governing body (such as a council or
committee), most of whose members are appointed by a public authority or
elected by public franchise.
An institution is classified as private if:
overall control and management rest with a non-governmental organisation (e.g. a
church, trade union, business enterprise or foreign or international agency)
the governing board consists mostly of members not selected by a public agency.
Remarks
Classification criteria: when classifying educational institutions as either public or private, only the school-
based component of combined school- and work-based programmes should be considered. Similarly, the
classification of students as enrolled in public or private institutions should consider only the school-based
component of such programmes. For example, if a student performs the school-based component in a public
school and the work-based component in a private enterprise, this student should be counted under the
“public” heading.
Source of funds: the extent to which an institution receives its funding from public or private sources does
not determine its classification as a public or private institution. For example, a privately managed school
could obtain all of its funding from public sources and a publicly controlled institution could derive most of
its funds from tuition fees paid by households.

4 - DEFINITIONS AND CLASSIFICATIONS OF THE OECD INTERNATIONAL EDUCATION STATISTICS │ 57
OECD HANDBOOK FOR INTERNATIONALLY COMPARATIVE EDUCATION STATISTICS 2018 © OECD 2018
Ownership: whether or not a public or private body owns the buildings and site of a school is not crucial to
its classification status. The term “ownership” may refer to the ownership of school buildings and site, or
alternatively ownership of the institution in the sense of ultimate management control. Only in the latter sense
is ownership relevant for classifying institutions.
Regulation: privately managed but publicly funded schools may be subject to some regulation or control by
public authorities, but these institutions should nevertheless be classified as private, provided that they are
ultimately subject to private control. Public regulation may extend to areas such as the curriculum, staffing
appointments and admissions policies. In practice, publicly regulated private schools may pose problems of
classification where the extent of regulation is on a par with that of publicly controlled schools. This may
especially be the case at tertiary level where institutions may be autonomous and self-governing but subject to
considerable public control. Control over such functions as the selection and dismissal of staff, the setting of
curricula, the examination and testing of students, and the admission of students may all be shared between a
public authority and a governing board. It is also not uncommon for private schools in many countries to be
required to teach the national curriculum and be subject to more or less the same regulations as public
schools, in return for public funding of these schools.
Legal basis: in the case of some institutions, a legal basis for their foundation may exist in a public charter,
deed of trust or even legislation enacted by parliament. In general, the legal instrument on which the
institution is founded affects its classification status only to the extent that such a legal instrument enables a
public authority to exercise ultimate authority or control over the institution. The issue of public recognition
or licensing of private schools should not be confused with the issue of overall control.
Difficult cases
In many countries, the public authorities lay down minimum conditions for private
schools (both government-dependent and independent) in relation to the curriculum or
qualifications of staff.
Some countries have autonomous, self-governing universities, which are owned and
managed by self-perpetuating governing boards made up of private members, but are
publicly chartered and considered to be performing a “public” function. Nevertheless,
these institutions should be classified as private.
In other cases, a public agency may have granted so much educational and fiscal
autonomy to individual schools (sometimes vesting authority in school governing boards
composed of private members), that few significant elements of public control or
governance remain. Nevertheless, these institutions should be classified as public as it
was the choice of the public agency which had overall control to grant additional freedom
to the schools.
In still other cases, the degree of public regulation of nominally privately owned and
managed institutions may be so great that few vestiges of private decision-making
authority remain. Nevertheless, these institutions should be classified as private.
European schools, established for the children of personnel of the European institutions,
should be classified as private institutions, because they are not directly controlled or
managed by a public education authority or agency of the country in which they are
located. In fact, they are managed by an intergovernmental institution, the Board of
Governors, pursuant to a distinct international treaty. They are classified as private
independent institutions, because most of their core funding comes from the European
Commission’s operating budget, with less than 50% coming from government agencies
of the host countries.
58 │ 4 - DEFINITIONS AND CLASSIFICATIONS OF THE OECD INTERNATIONAL EDUCATION STATISTICS
OECD HANDBOOK FOR INTERNATIONALLY COMPARATIVE EDUCATION STATISTICS 2018 © OECD 2018
Distinguishing between government-dependent and independent private
institutions
The terms “government-dependent” and “independent” refer only to the degree to
which a private institution is dependent on funding from government sources; they do not
refer to the degree of government direction or regulation.
A government-dependent private institution is a private institution that receives 50%
or more of its core funding from government agencies, or one whose teaching personnel are
paid by a government agency or through government directly.
An independent private institution is a private institution that receives less than 50% of
its core funding from government agencies and whose teaching personnel are not paid by a
government agency.
Core funding refers to the funds that support the basic or core educational services of the
institutions. It therefore excludes:
funds provided specifically for research projects
payments for services purchased or contracted by private organisations
fees and subsidies received for ancillary services, such as lodging and meals.
Tuition fees and other fees paid to institutions by students should not be considered as
government funds unless the fees are financed by government scholarships or loans to the
students or households and the student has no choice but to use the fee in that class of
institution.
The classification of institutions as government-dependent or independent should be made
for classes of institutions rather than for individual institutions. For example, if a country
has a number of church-affiliated upper secondary schools, the determination should
depend on whether such schools in general receive a majority of their core funding from
government sources. If the answer is yes, then all the schools in the category should be
considered government-dependent, even if some individual schools in the class may
happen to receive less than half of their core funds from government sources.
4.5. Educational expenditure
This section provides specific and detailed definitions and concepts used in the compilation of
international statistics on educational finance and expenditure from all sources on formal
education. This includes government expenditure, including expenditure from all
government ministries and agencies financing or supporting education programmes; and
expenditure from international and private sources.
4.5.1. The framework for educational expenditure
Data on education finance and expenditure are reported for the same programmes as for
students, teaching staff and graduates. This means they cover spending on formal
education programmes which are delivered within the national territory, irrespective of
the citizenship of students enrolled in these programmes and irrespective of the type of
institutions (instructional or non-instructional educational institutions, public or private)
(UNESCO-UIS / OECD / EUROSTAT, 2017[5]).
Expenditure on education includes expenditure on core educational goods and services,
such as teaching staff, school buildings, and schoolbooks and teaching materials, and
4 - DEFINITIONS AND CLASSIFICATIONS OF THE OECD INTERNATIONAL EDUCATION STATISTICS │ 59
OECD HANDBOOK FOR INTERNATIONALLY COMPARATIVE EDUCATION STATISTICS 2018 © OECD 2018
peripheral educational goods and services such as ancillary services, general
administration and other activities.
Ideally, international comparisons of educational expenditure should be defined in terms
of the educational goods and services which are purchased in relation to the educational
programmes within the scope of each data collection. In practice, educational institutions
are most commonly used as defining units rather than educational goods and services,
reflecting the traditional interest in how much schools, colleges and universities cost. But
while an institutional dimension is important, international comparisons may be
problematic because some of the goods and services provided by educational institutions
in one country may be provided outside educational institutions in another country.
Differentiating the spending devoted to educational and non-educational goods and services
offered by institutions also provides for an analysis of the expenditure devoted to core
educational purposes. Finally, the source of funds dedicated to education spending assesses
who the major contributors are and the impact this may have on the access and provision of
education.
It is therefore important to consider a framework for educational finance data built around
three dimensions (Figure 4.1):
the location of service providers (within or outside of institutions)
the goods and services provided or purchased (core and peripheral goods)
the source of funds that finance the provision or purchase of these goods and
services (from public, private and international sources).
The first dimension – represented by the horizontal axis in the diagram below – relates to
the location where spending occurs. Spending on educational institutions includes
spending on teaching institutions such as schools and universities, and non-teaching
institutions such as education ministries and other agencies directly involved in providing
and supporting education. Spending on education outside these institutions covers
expenditure on educational good and services purchased outside institutions, such as
books, computers and fees for private tutoring. It also deals with student living costs and
costs of student transport not provided by educational institutions.
The second dimension – represented by the vertical axis in the diagram below – classifies
the goods and services that are purchased. Educational core goods and services include all
expenditure directly related to instruction and education. It covers all expenditure on
teachers, maintenance of school buildings, teaching materials, books, tuition outside
schools and administration of schools. However, not all expenditure on educational
institutions can be classified as direct educational or instructional expenditure.
Educational institutions in many OECD countries offer various ancillary services – such
as meals, transport, housing, etc. – in addition to teaching services to support students and
their families. At the tertiary level, spending on research and development can be
significant. Additionally, not all spending on educational goods and services occurs
within educational institutions. For example, families may purchase textbooks and
materials themselves or seek private tutoring for their children. In this sense, "non-
instruction” expenditure covers all expenditure broadly related to student living costs or
services provided by institutions for the general public.

60 │ 4 - DEFINITIONS AND CLASSIFICATIONS OF THE OECD INTERNATIONAL EDUCATION STATISTICS
OECD HANDBOOK FOR INTERNATIONALLY COMPARATIVE EDUCATION STATISTICS 2018 © OECD 2018
Table 4.2. Source of funding for educational goods and services by location of the service
provider
Type of goods and services
Location of service providers
Spending on educational institutions (e.g. schools, universities,
educational administration and student welfare services)
Spending on education outside educational institutions (e.g. private purchases of
educational goods and services, including private tutoring)
Spending on core educational
goods and services
Public and international funds e.g. public spending on instructional services in
educational institutions
Publicly subsidised private funds e.g. subsidised private spending on books, materials or fees for private
tutoring
Private funds e.g. private spending on books and
other school materials or private tutoring
Publicly subsidised private funds e.g. subsidised private spending on instructional
services in educational institutions
Private funds e.g. private spending on tuition fees
Edu
cati
on
al p
eri
ph
eral
go
od
s an
d s
erv
ice
s
Spending on research and development
Public and international funds e.g. public spending on university research
Private funds e.g. funds from private industry for research and
development in educational institutions
Spending on educational services other
than instruction
Public and international funds e.g. public spending on ancillary services such as
meals, transport to schools, or housing on the campus
Publicly subsidised private funds e.g. subsidised private spending on
student living costs or reduced prices for transport
Public subsidised private funds e.g. public subsidies for lodging, meals, health services, or other welfare services furnished to
students by the educational institutions
Private funds e.g. private spending on fees for ancillary
services
Private funds e.g. private spending on student
living costs or transport
Public and international
funds
Private funds (net of subsidies)
Public subsidies to private entities
4 - DEFINITIONS AND CLASSIFICATIONS OF THE OECD INTERNATIONAL EDUCATION STATISTICS │ 61
OECD HANDBOOK FOR INTERNATIONALLY COMPARATIVE EDUCATION STATISTICS 2018 © OECD 2018
The third dimension – represented by the colours in Table 4.2 – distinguishes among the
sources from which funding originates. These include the public sector and international
agencies (indicated by light blue), and households and other private entities (indicated by
medium-blue). Where private expenditure on education is subsidised by public funds, this
is indicated by cells in the grey colour. The uncoloured cells indicate the parts of the
framework that are excluded from the coverage of the finance indicators in Education at
a Glance.
4.5.2. Accounting principles
In keeping with the system used by many countries to record government expenditures
and revenues, educational expenditure data are compiled on a cash accounting rather than
an accrual accounting basis. That is to say that expenditure (both capital and current) is
recorded in the year in which the payments occurred. This means in particular that:
Capital acquisitions are counted fully in the year in which the expenditure occurs.
Depreciation of capital assets is not recorded as expenditure, although expenditure
on repairs and maintenance is recorded in the year it occurs. This can result in
sharp fluctuations in expenditure from year to year owing to the onset or
completion of school building projects which, by their nature, are sporadic.
Expenditure on student loans is recorded as the gross loan outlay in the year in
which the loans are made, without subtracting repayments or interest payments
from existing borrowers.
A notable exception to the cash accounting rules is the treatment of the retirement costs of
educational personnel in situations where there are no (or only partial) ongoing employer
contributions towards the future retirement benefits of the personnel. In these cases,
countries are asked to impute these expenditures in order to arrive at a more
internationally comparable cost of employing the personnel.
4.5.3. What educational expenditure covers
The coverage of the finance expenditure data includes:
goods and services of educational institutions: all direct public, private and
international expenditure whether educational or non-educational (e.g. ancillary
services) but with one or two exceptions (see below)
goods and services purchased outside educational institutions: private expenditure
on educational goods and services
public subsidies to students for student living costs: regardless of where or how
the student spends these subsidies.
The coverage of the finance data excludes:
research and development (R&D) outside of educational institutions, as this is
clearly outside the scope of education
private, non-subsidised expenditure on student living costs outside of educational
institutions

62 │ 4 - DEFINITIONS AND CLASSIFICATIONS OF THE OECD INTERNATIONAL EDUCATION STATISTICS
OECD HANDBOOK FOR INTERNATIONALLY COMPARATIVE EDUCATION STATISTICS 2018 © OECD 2018
expenditure on non-formal educational activities: besides their formal educational
programmes, some educational institutions offer educational activities such as
evening courses for adults that are classified as leisure courses.
Expenditure on goods and services within educational institutions
The following indicates what the expenditure data cover for goods and services provided
by educational institutions, and presents difficult cases.
Coverage
The coverage of educational core goods and services includes:
instruction costs (i.e. teaching costs), including in teaching hospitals as it relates
to the teaching of medical students
educational goods (books, materials, etc.) provided by institutions
training of apprentices and other participants in combined school and work-based
educational programmes at the workplace
administration
capital expenditure and rent
special educational needs
guidance.
The coverage of educational peripheral goods and services includes:
R&D
educational research and curriculum development (including teaching hospitals,
see below)
research and development performed at higher education institutions
non-instructional goods and services (ancillary services)
student transportation, school meals, student housing, boarding and student health
services
services for the general public provided by educational institutions.
The coverage of educational goods and services excludes:
child care or day care provided by schools and other instructional institutions
expenditure on non-formal educational programmes (such as leisure courses)
activities of public authorities (such as ministries) that are not directly related to
education (e.g. culture, sports and youth activities) unless provided as an ancillary
service
teaching hospitals’ expenditure as it relates to patient care and other general
expenditures not related to education
debt servicing (i.e. payments of interest or repayments of the principal)
depreciation of capital assets and capital charges
4 - DEFINITIONS AND CLASSIFICATIONS OF THE OECD INTERNATIONAL EDUCATION STATISTICS │ 63
OECD HANDBOOK FOR INTERNATIONALLY COMPARATIVE EDUCATION STATISTICS 2018 © OECD 2018
goods and services taxes (GST)
research and development outside of educational institutions.
The following sections provide special instructions concerning categories of spending on
educational institutions which have posed problems for international comparability in the
past.
Expenditure on research and development
Expenditure on R&D is defined according to the OECD Frascati Manual (OECD,
2002[6]). This includes all expenditure on research performed at universities and other
tertiary education institutions, regardless of whether the research is financed from general
institutional funds, through separate grants, or from contracts from public or private
sponsors.
Expenditure on R&D excludes expenditure on independent, organisationally separate,
government research institutions in cases where the connection between universities and
research institutions is purely administrative.
Where R&D expenditure is embedded within general university budgets, problems can
arise in separating expenditure on R&D from total expenditure. This embedded
expenditure includes, for example, spending on the compensation of teaching staff who
work part of their time on R&D. These elements need to be identified and staff costs need
to be broken down for education and R&D activities. The OECD Frascati Manual
suggests standard practices for the separation.
Teaching hospital expenditure
Expenditure by or on teaching hospitals (sometimes referred to as academic hospitals or
university hospitals) is excluded from educational expenditure, particularly all costs of
patient care and other general expenses of academic hospitals, even if such expenses are
paid for by the education authorities.
However, teaching hospital expenditure that it is directly and specifically related to the
training of medical students, and expenditure on R&D at teaching hospitals are included.
Expenditure on ancillary services
Ancillary services are defined as services provided by educational institutions that are
peripheral to the main educational mission. The two main components of ancillary
services are:
Student welfare services at ISCED levels 0-3, student welfare services include
such things as meals, school health services and transportation to and from
school. At the tertiary level, they include halls of residence (dormitories, dining
halls and health care.
Services for the general public: these include such things as museums, radio and
television broadcasting, sports, and recreational or cultural programmes.
All such ancillary services in educational institutions are included in the coverage of the
expenditure data.
64 │ 4 - DEFINITIONS AND CLASSIFICATIONS OF THE OECD INTERNATIONAL EDUCATION STATISTICS
OECD HANDBOOK FOR INTERNATIONALLY COMPARATIVE EDUCATION STATISTICS 2018 © OECD 2018
Expenditure on free or subsidised transportation
The classification of some public expenditure is ambiguous, since it may be classified
either as ancillary services or as public subsidies to students in kind. This applies
especially to free or subsidised transport of students to travel to school or for students’
use more generally.
Free or subsidised transport can be provided to students in two different forms:
Special school buses organised to bring the students to the school. Such
transportation is classified as an ancillary service offered by the educational
institution.
Free or subsidised tickets for (local) transport companies.
If the main purpose of the expenditure is to fund the students’ transport to school, the
expenditure is classified as expenditure on an ancillary service. If the purpose of the
expenditure is to fund the general use of the transport system by the student, then the
expenditure is recorded as subsidies to students in kind. Note that in the latter case, the
allocation of the subsidy must be contingent on the recipient being a student.
Expenditure on day and evening child care
In some countries, institutions providing pre-primary and primary education also provide
extended day or evening child care. In the interest of international comparability, the cost
of such services from reported expenditure statistics, especially at ISCED levels 0 and 1
are excluded.
Educational expenditure at the workplace to train participants in combined
school and work-based training programmes
Expenditure by private companies on certain combined school- and work-based
programmes that take place at the workplace, and public subsidies for such programmes,
are regarded as expenditure by independent private educational institutions for the
purposes of the indicators described in this handbook.
Expenditure on these programmes includes expenditure on the training itself (e.g. salaries
and other compensation of instructors and other personnel, and costs of instructional
materials and equipment). It excludes salaries or other compensation paid to students or
apprentices.
For example, if the estimated total cost of a dual system apprenticeship programme to the
employer is EUR 10 billion, of which EUR 6 billion is the estimated cost of training and
EUR 4 billion is the cost of apprentices’ salaries, social security contributions and other
compensation, only the EUR 6 billion used for the cost of training would be included in
educational expenditure.
Measurement of expenditure on contributions to pension schemes
The employee cost reported for educational institutions includes the cost to the employer
of contributions to retirement schemes for the currently active educational employees.
Retirement expenditure is defined, in principle, as the actual or imputed expenditure by
employers or third parties (e.g. social security agencies, pension agencies or finance
ministries) to finance retirement benefits for current educational personnel. Pension
contributions made by the employees themselves, whether deducted automatically from
4 - DEFINITIONS AND CLASSIFICATIONS OF THE OECD INTERNATIONAL EDUCATION STATISTICS │ 65
OECD HANDBOOK FOR INTERNATIONALLY COMPARATIVE EDUCATION STATISTICS 2018 © OECD 2018
their gross salaries or otherwise, are not included in retirement expenditure of educational
institutions.
Depending on the types of retirement schemes in operation in a country, estimates are
sometimes used according to the type of pension system available:
In a fully funded, contributory pension system, employers pay contributions for
each of their current employees into a fund which is sufficient to pay the required
pension when the employees retire. In this case, the expenditure on retirement to
be reported equates to the current employer’s contribution to the pension fund.
In a completely unfunded retirement system, employers make no ongoing
contributions into a fund and instead the government meets the cost of retirement
as it arises. This is the type of scheme (sometimes called “pay as you go”) used to
provide pensions for civil servants in many countries. In this case, the expenditure
on retirement must be estimated or imputed.
Likewise, in partially funded systems where employers contribute to a
retirement system but the contributions are inadequate to cover the full costs of
future pensions, it is necessary to impute the contributions which make up the
short fall. Thus, retirement expenditure is the sum of actual employers’ (or third
party) contributions and the imputed contribution needed to cover the projected
funding gap.
The System of National Accounts 2008 (SNA 2008) as well as the European System of
Accounts (ESVG 2010) for European Union (EU) countries gives some guidance on the
reporting of imputed social contributions such as for retirement. This enhances
comparability between countries and harmonisation with National Accounts
methodology.
Expenditure outside educational institutions
This covers educational goods and services purchased outside institutions and mainly
student living costs.
Educational goods and services purchased outside institutions, in the free market, include:
Expenditure on educational goods which are needed for participation in the
programmes and which are therefore imposed on the student either directly or
indirectly by the educational institutions. Examples include school uniforms,
books requested for instruction, athletic equipment and materials for arts lessons.
Expenditure on educational goods which are not required by institutions, but
which students and households choose to buy to support their study in the
programmes in scope of the data collection. Examples include additional books or
computers and learning software to be used at home.
Fees for private out-of-school tuition related to the educational programmes being
pursued. This will be the main type of educational service purchased outside
institutions.
Purchases from commercial enterprises operated or sponsored by educational
institutions (such as university bookstores) are regarded as expenditure outside
educational institutions.

66 │ 4 - DEFINITIONS AND CLASSIFICATIONS OF THE OECD INTERNATIONAL EDUCATION STATISTICS
OECD HANDBOOK FOR INTERNATIONALLY COMPARATIVE EDUCATION STATISTICS 2018 © OECD 2018
Expenditure on educational goods and services purchased outside institutions will usually
be measured by household expenditure surveys, so the definition of goods and services
will tend to be dictated by those used in the national survey instrument. Care therefore
needs to be taken to ensure that this does not result in double counting with expenditure
on educational institutions and that student living costs are not included.
For example, if private expenditure on educational institutions is reported on the basis of
school accounts, and includes fees paid by households for laboratory materials and art
supplies besides tuition fees, the same fees should not be counted again as payments to
outside institutions on the basis of household reports in educational expenditure surveys.
Student living costs are accounted only if they are subsidised through financial
aid to students by public or private entities. The rationale for including these
subsidies is that in many countries, public and private scholarships, grants or
loans are provided to students not primarily or exclusively to cover the tuition
fees charged by educational institutions but rather to subsidise student living
expenses. It is therefore desirable to capture this expenditure in order to provide a
complete picture of total investment by public and other private entities in
education.
Note, however, that fees paid by private households to educational institutions for
ancillary services as for student accommodation is included in private expenditure
regardless of whether it is subsidised or not.
This category excludes:
students’ foregone earnings
expenditure on student living costs outside educational institutions which are not
subsidised through financial aid to students by public or private entities.
4.5.4. Sources of educational expenditure and types of transactions
Sources of funds for educational expenditure are classified as:
governmental (central, regional or local government)
households and other private entities (including firms and religious institutions
and other non-profit organisations)
international agencies and other foreign sources.
These sources can be either initial of final payers of funds, depending on what type of
transaction is involved. The data distinguish three types of financial transactions:
Type 1: direct expenditure/payments to educational institutions (disaggregated
according to the type of service provider to which, or for which, the payments are
made: public institutions, government-dependent private institutions, and
independent private institutions)
Type 2: intergovernmental transfers of funds
Type 3: Public-to-private transfers of funds.
Transfer transactions can be considered to have two sources of funds, depending on the
indicator being calculated. The initial source of funds is the original source of the funds

4 - DEFINITIONS AND CLASSIFICATIONS OF THE OECD INTERNATIONAL EDUCATION STATISTICS │ 67
OECD HANDBOOK FOR INTERNATIONALLY COMPARATIVE EDUCATION STATISTICS 2018 © OECD 2018
before transfers have taken place while the final source of funds is after transfers have
taken place.
The following sections describe each source of funds fin more detail.
Public (government) sources of expenditure
Public expenditure refers to spending by public authorities at all levels. It excludes
expenditure not directly related to education (such as culture, sports or youth activities)
unless these services/activities are provided as ancillary services by educational
institutions. It includes expenditure on education by other ministries or equivalent
institutions, for example health and agriculture. It also includes subsidies provided to
households and other private entities (often in the form of financial aid to students) which
can be attributable to educational institutions (e.g. fees) or not (e.g. private living costs
outside of institutions).
Public expenditure on education includes expenditure by all levels of government, both
education-specific authorities and other government agencies. Thus, central government
expenditure includes not only expenditure by national education ministries, but also all
expenditure on education by other central government ministries and authorities.
Similarly, educational expenditure by regional and local governments includes not only
expenditure by the regional or local agencies with primary responsibility for operating
schools (e.g. provincial ministries of education or local education authorities) but also
expenditure by other regional and local bodies that contribute to the financing of
education.
Classification of levels of government
Public expenditure is classified by the following three levels of government:
central (national) government
regional government (province, state, Land, etc.)
local government (municipality, district, commune, etc.).
Remarks
To clarify some ambiguities in this classification:
If a country only has two levels of government, the lower level usually must be designated as local rather than
regional.
If there are four or more levels, the second level usually must be designated as regional and the third (and
subsequent ones) as local.
If a city (such as the national capital) has dual status as both regional and local government, its expenditure is
reported as expenditure of regional level of government (e.g. the Stadtstaaten of Hamburg, Bremen and
Berlin in Germany).
Regional and local government responsibilities:
The terms “regional” and “local” apply to governments whose responsibilities are exercised within certain
geographical subdivisions of a country. They do not apply to government bodies whose roles are not
geographically circumscribed but are defined in terms of responsibility for particular services, functions or
categories of students.

68 │ 4 - DEFINITIONS AND CLASSIFICATIONS OF THE OECD INTERNATIONAL EDUCATION STATISTICS
OECD HANDBOOK FOR INTERNATIONALLY COMPARATIVE EDUCATION STATISTICS 2018 © OECD 2018
Direct public expenditure on educational institutions
Direct expenditure on educational institutions by government may take two forms:
Purchases by a government body of educational resources to be used by
educational institutions. Examples include direct payments of teachers’ salaries
by a central or regional education ministry, direct payments by a municipality to
building contractors for the construction of school buildings, and procurement of
textbooks by a central or regional authority for subsequent distribution to local
authorities or schools.
Payments by a government body to educational institutions which are responsible
for purchasing educational resources themselves. Examples of such payments
include a government appropriation or block grant to a university, which the
university then uses to pay staff salaries and to buy other resources, government
allocations of funds to fiscally autonomous public schools, government subsidies to
private schools, and government payments under contract to private companies
conducting educational research.
The coverage of direct expenditure on educational institutions includes:
Current expenditure on staff compensation (salaries for teaching and non-teaching
staff, expenditure on retirement and other non-salary compensation).
Expenditure designated for capital spending, ancillary services and R&D:
Expenditure designated for capital spending: expenditure in this case must have
been explicitly designated, or earmarked for capital investment. Actual capital
expenditure (on buildings, equipment, etc.) may exceed the amount designated for
capital if funds not specifically earmarked by governments for capital formation
are used to finance capital outlays.
Expenditure for ancillary services: the expenditure must have been explicitly
designated, or earmarked for ancillary services. The amount actually spent for
ancillary services may exceed the amount designated for ancillary services by
public and other private sources plus fees paid by households in cases where
funds not specifically earmarked by governments are used to finance ancillary
services.
Expenditure for R&D activities: although direct public expenditure for R&D
activities is reported separately, it is desirable to include it in the data, broken
down by public institutions, government-dependent private institutions and
independent private institutions. The concept reflected in this category is the
amount actually spent on R&D activities which are financed by central, regional
or local levels of government.
The coverage of direct expenditure on educational institutions excludes:
Expenditure on servicing debts (i.e. payments of interest on the amounts
borrowed for educational purposes and repayments of the principal).
Tuition payments received from students (or their families) enrolled in public
schools under that body’s jurisdiction, even if the tuition payments flow, in the
first instance, to the government body rather than to the institution in question.
Such tuition payments are reported as payments by students or households to
public educational institutions.
4 - DEFINITIONS AND CLASSIFICATIONS OF THE OECD INTERNATIONAL EDUCATION STATISTICS │ 69
OECD HANDBOOK FOR INTERNATIONALLY COMPARATIVE EDUCATION STATISTICS 2018 © OECD 2018
Intergovernmental transfers of funds
Intergovernmental transfers are transfers of funds specifically designated for education
from one level of government to another. They are defined as net transfers from a higher
level to a lower level of government. Every transfer from one level to another level is
reported as expenditure at the level of government receiving the funds.
Remarks
Sometimes, central government transfers to local governments are “passed through” regional governments:
that is, the regional governments are responsible for disbursing central government funds to local authorities.
In cases where this disbursement is compulsory (i.e. regional governments may not retain the funds for their
own use), the payments in question are classified as central government transfers to local rather than to
regional governments.
Public-to-private transfers of funds
Government transfers of funds to private entities fall into two distinct categories, public
subsidies to households, and public subsidies to other private entities.
Public subsidies to households
This is financial aid to students in the form of scholarships and loans to students to cover
tuition fees or living costs. There are two different forms of aid: scholarships and other
grants, including child allowances and special public subsidies, and student loans.
Scholarships and other grants cover:
Scholarships and grants including public scholarships and all kinds of similar
public grants, such as fellowships, awards and bursaries for students. Government
scholarships that are channelled through educational institutions for
administrative purposes are considered government transfers to students. These
scholarships and grants can be separately categorised as either those that are
attributable to educational institutions (i.e. grants for payment of tuition and other
fees) or those that are not. This distinction is important in determining
expenditure by households on educational institutions net of subsidies.
Special public subsidies are all those transfers to households that are linked to specific
spending by students and contingent upon the student status exclude all kinds of tuition
costs, with the exception of tuition and other fees paid to institutions abroad. Only in
exceptional cases will the payments go to educational institutions as fees for ancillary
services, i.e. for lodging, meals, health services, or other welfare services furnished to
students by the educational institutions. Those payments that go to institutions have to be
treated with care so that subsidies attributable to institutions are separated out. The
special subsidies include those for:
transport
medical expenses
books and supplies
social and recreational purposes
study abroad
other special subsidies.

70 │ 4 - DEFINITIONS AND CLASSIFICATIONS OF THE OECD INTERNATIONAL EDUCATION STATISTICS
OECD HANDBOOK FOR INTERNATIONALLY COMPARATIVE EDUCATION STATISTICS 2018 © OECD 2018
Family or children’s allowances only includes allowances contingent upon student
status and excludes any allowances independent of the educational status of a child.
For example, if a country provides family allowances for all children up to age 18
regardless of educational status and provides additional allowances for young people aged
19-25 who are enrolled in an educational institution, the allowances for 19-25 year-olds
are included in scholarships and other grants, but the allowances for those aged 18 and
below are excluded.
Student loans, including those not attributable to household payments for educational
institutions, such as subsidies for student living costs, are reported on a gross basis, that is
without subtracting or netting out repayments or interest payments from the borrowers
(students or households). The cost to the government of servicing these loans (i.e.
interest-rate subsidies and the cost of default payments) is not included. Thus, student
loan expenditure represents the total value of loans paid by government to students during
the reference year.
The rationale for measuring government loans to students on a gross rather than net basis
is that it provides an appropriate measure of the financial aid provided to current
participants in education in the current year. A net calculation of loan expenditure would
be more appropriate for other purposes (e.g. for assessing the shares of public and private
expenditure on education) but further work is needed to establish an internationally
agreed method for doing this.
Public subsidies to other private entities
Public subsidies to other private entities are transfers to entities specifically defined as
non-educational institutions such as commercial companies or non-profit organisations.
Such transactions include:
transfers to business or labour associations providing adult education within the
scope of the data collection
subsidies to private companies (or labour organisations or associations of such
entities) for the provision of training at the workplace as part of combined school
and work-based programmes, including apprenticeship programmes
the cost to government of supporting loans paid to students by private financial
institutions (e.g. interest-rate subsidies, the cost of guaranteeing the loans and the
cost of defaults on repayments).
Private sources
Private expenditure on education can be categorised according to sources of education
funds:
Private expenditure by households, i.e. students and their families.
Private expenditure by other private entities, i.e. private businesses and non-
profit organisations, including religious organisations, charitable organisations,
and business and labour associations. It also includes expenditure by private
companies on the work-based element of school and work-based training of
apprentices and students.

4 - DEFINITIONS AND CLASSIFICATIONS OF THE OECD INTERNATIONAL EDUCATION STATISTICS │ 71
OECD HANDBOOK FOR INTERNATIONALLY COMPARATIVE EDUCATION STATISTICS 2018 © OECD 2018
Private expenditure by households
Household expenditure includes:
transfers to households and students (public and private scholarships, grants or
loans) and used for tuition fee payments to educational institutions
payment for ancillary services provided by educational institutions
costs borne by private households for the purchase of educational goods and
services outside of educational institutions.
Household expenditure excludes the living expenses of students (such as costs of
housing, meals, clothing and recreation).
Payments to educational institutions: in most countries, the main form of direct
household expenditure on education are fees paid to educational institutions. These
consist of:
tuition fees
other fees charged for educational services, such as registration fees, laboratory
fees and charges for teaching materials plus fees paid for lodging, meals, health
services
fees paid for other welfare services furnished to students by the educational
institutions.
Payments from students and households to institutions are reported as net amounts, that
is, after subtracting any scholarships or other forms of financial aid (such as reductions in
tuition fees or waivers of fees) provided to students by the educational institutions
themselves.
For example, if the normal university tuition fee is USD 2 000 per student but some
students are offered free tuition or charged only USD 1 000, the figures reflect the
reduced amounts actually paid by students, not the hypothetical full tuition fees.
Payment for ancillary services: this includes household payments for lodging, meals,
health services and other welfare services provided to students by the educational
institutions.
Payments for educational goods and services purchased outside educational
institutions:
Educational goods purchased outside institutions should include books not
supplied by educational institutions, school supplies, paper, school uniforms,
athletic equipment, calculators and computers.
Educational services purchased outside institutions will mainly consist of private
expenditure on private tutoring outside school.
Private expenditure by other private entities
Private expenditure by other private entities includes direct payments to educational
institutions and subsidies to students or households.
Direct payments to educational institutions: is expenditure by other private entities on
educational institutions, including:
72 │ 4 - DEFINITIONS AND CLASSIFICATIONS OF THE OECD INTERNATIONAL EDUCATION STATISTICS
OECD HANDBOOK FOR INTERNATIONALLY COMPARATIVE EDUCATION STATISTICS 2018 © OECD 2018
contributions or subsidies to vocational and technical schools from business or
labour organisations
payments by private companies to universities under contract for research,
training or other services
grants to educational institutions from non-profit organisations, such as private
foundations
charitable donations to educational institutions (other than from households)
rents paid by private organisations and earnings from private endowment funds
expenditure by private employers on the training of apprentices and other
participants in combined school and work-based educational programmes
public subsidies to other private entities for the provision of training at the
workplace included as spending by other private entities.
Subsidies to students or households: consists of financial aid to students or households
provided by other private entities, including:
scholarships provided by businesses and religious or other non-profit
organisations
student loans from banks and other private lenders (even if such loans are
guaranteed or subsidised by government, or made through programmes of private
lending organised by the government).
As with public student loans, loans are reported as gross amounts, without subtracting
payments of interest or repayments of the principal by the borrowers. Thus, the student
loan expenditure here should represent the total value of loans paid by banks and private
lenders to students during the reference year.
Government support of these private loans (in the form of interest subsidies or payments
for defaulters) is reported as public subsidies to other private entities.
Funds from international agencies and other foreign sources
International funds consist of funds from public multilateral organisations for
development aid to education. These organisations include multilateral development
banks (the World Bank and regional development banks), United Nations agencies and
other intergovernmental organisations, bilateral development co-operation government
agencies, and international non-governmental organisations (NGOs) established in the
receiving country. International funds also include other foreign grants for R&D at
tertiary institutions.
Educational expenditure based on loans from intergovernmental organisations, such as
World Bank loans, is included as gross loans, and excludes repayments to international
organisations.
International funds can be reported as:
International payments direct to public, government-dependent private and
independent private institutions. An example would be a research grant from a
foreign corporation to a public university.

4 - DEFINITIONS AND CLASSIFICATIONS OF THE OECD INTERNATIONAL EDUCATION STATISTICS │ 73
OECD HANDBOOK FOR INTERNATIONALLY COMPARATIVE EDUCATION STATISTICS 2018 © OECD 2018
International payments direct to all type of educational institutions for R&D
activities.
Transfers of funds from international sources to central, regional and local
governments.
Transfers of funds from international sources to governments are not automatically
included in the total of expenditure on educational institutions. These payments are
reported as a transfer and expenditure at the level of the recipient of the funds.
4.5.5. Expenditure by resource category
Within educational institutions, expenditure is broadly categorised as either current or
capital expenditure and these two categories are the standard ones used in national
income accounting:
Current expenditure is expenditure on goods and services consumed within the
current year, which needs to be made recurrently to sustain the production of
educational services. Minor expenditure on items of equipment, below a certain
cost threshold, is also reported as current spending.
Capital expenditure is expenditure on assets that last longer than one year. It
includes spending on construction, renovation and major repair of buildings, and
expenditure on new or replacement equipment.
Capital expenditure
Capital expenditure represents the value of educational capital assets acquired or created
during the year in question regardless of whether the capital expenditure was financed
from current revenues or by borrowing. The cost of the depreciation of capital assets is
not included. Capital expenditure excludes expenditure on debt servicing. This means
that neither interest payments nor repayments of the principal are counted as part of
capital or current spending.
Current expenditure
Current expenditure is broken down into the following categories:
Expenditure on compensation of personnel, which includes:
Salaries, which are the gross salaries of educational personnel, before deduction
of taxes, contributions for retirement or health care plans, and other contributions
or premiums for social insurance or other purposes. Additional bonuses on top of
basic salary (e.g. arising from the experience, age or other circumstances of the
personnel) should be included.
Expenditure for retirement (pension schemes), which covers actual or imputed
expenditure by employers or third parties to finance retirement benefits for current
educational personnel. This expenditure excludes pension contributions made by
the employees themselves, whether deducted automatically from their gross
salaries or otherwise.
Expenditure on other non-salary compensation, which covers spending by
employers or third parties on employee benefits other than pensions. These
benefits may include such things as health care or health insurance, disability

74 │ 4 - DEFINITIONS AND CLASSIFICATIONS OF THE OECD INTERNATIONAL EDUCATION STATISTICS
OECD HANDBOOK FOR INTERNATIONALLY COMPARATIVE EDUCATION STATISTICS 2018 © OECD 2018
insurance, unemployment compensation, maternity and childcare benefits, other
forms of social insurance, non-cash supplements (such as free or subsidised
housing), and free or subsidised child care.
Expenditure on compensation of personnel is also categorised by the type of personnel –
distinguishing between expenditure on teaching and non-teaching staff (as defined in
Section 4.2.5) including the appropriate portions of the compensation of staff who teach
part-time.
Note that the breakdown of compensation of personnel into salaries and non-salary
components is not requested for independent private institutions as it has not been
possible to obtain these data for a significant number of countries. The underestimation of
non-salary compensation, especially in countries where no reliable estimates exist for
future pension liabilities of current expenditure, remains a significant potential bias in
comparisons of expenditure data.
Current expenditure other than compensation of personnel includes the following
categories:
o Expenditure on contracted and purchased services refers to expenditure on
services obtained from external providers, as opposed to services produced by
the education authorities or educational institutions themselves using their
own personnel. The services most commonly obtained under contracts are:
maintenance of school buildings and ancillary services, such as preparation of
meals for students.
o Rents paid for school buildings and other facilities. Expenditure on other
resources covers the purchases of other resources used in education, such as
teaching and learning materials, other materials and supplies, items of
equipment not classified as capital, fuel, electricity, telecommunications,
travel expenses, and insurance.
o Required payments other than expenditure on educational resources: This
can include, for example, any property taxes that educational institutions may
be required to pay.
o Financial aid to students is not included unless it is provided by the institution’s
own funds in the form of a reduction in tuition fees or waiver of fees and it
exceeds household payments to the institution. This is because household
expenditure payments to educational institutions are themselves calculated as
net of institutional subsidies.
Remarks
Definitions here might differ from Section 4.2.7 because of references to different data sources.
4 - DEFINITIONS AND CLASSIFICATIONS OF THE OECD INTERNATIONAL EDUCATION STATISTICS │ 75
OECD HANDBOOK FOR INTERNATIONALLY COMPARATIVE EDUCATION STATISTICS 2018 © OECD 2018
References
(n.a.) (2011), International Standard Classification of Education, http://www.uis.unesco.org
(accessed on 26 July 2018).
[7]
(n.a.) (2011), International Standard Classification of Education, http://www.uis.unesco.org
(accessed on 26 July 2018).
[2]
OECD (2017), OECD Handbook for Internationally Comparative Education Statistics: Concepts,
Standards, Definitions and Classifications, OECD Publishing, Paris,
http://dx.doi.org/10.1787/9789264279889-en.
[3]
OECD (2002), Frascati Manual 2002: Proposed Standard Practice for Surveys on Research and
Experimental Development, The Measurement of Scientific and Technological Activities,
OECD Publishing, Paris, http://dx.doi.org/10.1787/9789264199040-en.
[6]
OECD/Eurostat/UNESCO Institute for Statistics (2015), ISCED 2011 Operational
Manual: Guidelines for Classifying National Education Programmes and Related
Qualifications, OECD Publishing, Paris, http://dx.doi.org/10.1787/9789264228368-en.
[1]
UNESCO-UIS (2014), ISCED Fields of Education and Training 2013 (ISCED-F 2013): Manual
to Accompany the International Standard Classification of Education 2011; 2014, UNESCO
Institute for Statistics, Montreal, http://dx.doi.org/10.15220/978-92-9189-150-4-en (accessed
on 18 April 2018).
[4]
UNESCO-UIS / OECD / EUROSTAT (2017), UOE Data Collection on Formal Education.
Manual on Concepts, Definitions and Classifications, UNESCO-UIS / OECD / EUROSTAT,
Montreal, Paris, Luxembourg,
http://uis.unesco.org/sites/default/files/documents/uoe2016manual_11072016_0.pdf.
[5]


5 - DEFINITION AND CLASSIFICATION OF EDUCATIONAL PROGRAMMES: THE PRACTICAL… │ 77
OECD HANDBOOK FOR INTERNATIONALLY COMPARATIVE EDUCATION STATISTICS 2018 © OECD 2018
Chapter 5. Definition and classification of educational programmes: The
practical implementation of ISCED 2011
This chapter covers the conceptual, definitional and classification issues concerning
educational programmes. It starts with an overview of the latest International Standard
Classification of Education (ISCED 2011) which provides the foundation for
internationally comparative education statistics. It goes on to set out the definitions and
classifications that apply to educational programmes within it. It then sets out the detail
of how educational programmes are allocated within each ISCED level, considering the
criteria that define the boundaries between educational levels.
78 │ 5 - DEFINITION AND CLASSIFICATION OF EDUCATIONAL PROGRAMMES: THE PRACTICAL…
OECD HANDBOOK FOR INTERNATIONALLY COMPARATIVE EDUCATION STATISTICS 2018 © OECD 2018
5.1. Overview of ISCED 2011
ISCED is at the heart of international statistics on education. As the structure and
curricular content of national education systems vary, it can be difficult to benchmark
performance across countries over time or monitor progress towards national and
international goals. In order to understand and properly interpret the inputs, processes and
outcomes of education systems from a global perspective, it is vital to ensure that data are
comparable. This can be done by using ISCED, the standard framework used to
categorise and report cross-nationally comparable education statistics.
The ISCED classification serves as an instrument to compile and present education
statistics both nationally and internationally. The framework is occasionally updated in
order to better capture new developments in education systems worldwide.
Initially developed by UNESCO in the 1970s, the first ISCED (hereafter referred to as
ISCED-76) became operational from 1976 and was first revised in 1997 (ISCED-97).
Over the years that followed, education systems became increasingly complex, often
reflecting increased choices of types of programmes and modes of attendance. This
imposed new difficulties for the international comparability of education statistics and
many of these changes could no longer be adequately reflected in data collected under
ISCED-97. The case for a revised ISCED was clear. Following a collaborative effort
involving UNESCO, the OECD and Eurostat, the UNESCO General Conference adopted
ISCED 2011 as the replacement for ISCED-97 at its 36th session in November 2011. The
first presentation of UNESCO ISCED 2011 was published in December 2012 (UIS,
2011[1]), followed by an operational manual (OECD/Eurostat/UNESCO Institute for
Statistics, 2015[2]). ISCED 2011 was first integrated into the joint OECD, Eurostat and
UNESCO UOE data collection for the school year 2013, the indicators from which were
published in the 2015 edition of OECD’s Education at a Glance.
ISCED 2011 is designed to provide an integrated and consistent statistical framework for
the collection and reporting of internationally comparable education statistics. It is a
programme-based taxonomy which seeks to reduce complex national educational
structures into defined international categories based on certain classification criteria. It
helps to transform detailed national education statistics, compiled on the basis of national
concepts and definitions, into aggregate categories that are deemed to be internationally
comparable. The coverage of ISCED 2011 extends to all organised and sustained learning
opportunities for children, young people and adults, including those with special
educational needs, irrespective of the institutions or organisations providing them or the
form in which they are delivered.
The educational programme is the basic unit of classification in ISCED 2011. Each
programme should be allocated to a particular level of education on the basis of its
educational content, which in practice is determined by applying classification criteria
such as typical starting ages, entrance qualifications and type of qualification awarded.
ISCED-97 introduced these multi-dimensional criteria to capture the complexities of
modern education systems and represented a major shift from the uni-dimension ladder
system on which ISCED-76 was based.
The ISCED 2011 classification is an important step forward in improving the
comparability of international statistics on education. The major changes between ISCED
2011 and ISCED-97 are:

5 - DEFINITION AND CLASSIFICATION OF EDUCATIONAL PROGRAMMES: THE PRACTICAL… │ 79
OECD HANDBOOK FOR INTERNATIONALLY COMPARATIVE EDUCATION STATISTICS 2018 © OECD 2018
The ISCED 2011 classification revises the ISCED-97 levels of education programmes
(ISCED-P) and introduces for the first time a related classification of educational
attainment levels (ISCED-A) based on recognised education qualifications.
The ISCED 2011 classification includes improved definitions of formal and non-formal
education, educational activities and programmes.
Compared to ISCED-97, which had seven levels of education, ISCED 2011 now has nine
levels to take into account changes in tertiary education, such as the Bologna structure.
Programmes previously classified as level 5 in ISCED-97 will now be allocated to level
5, 6 or 7 in ISCED 2011. Moreover, while ISCED-97 mentioned the position in the
national degree structure of tertiary programmes, ISCED 2011 introduces specific coding
for this dimension for levels 6 and 7 (bachelor’s or equivalent and master’s or equivalent
levels, respectively).
ISCED 2011 expands level 0 to include a new category covering early childhood
educational development programmes designed for children under the age of 3.
The ISCED 2011 classification improves the use of general and vocational orientation
categories within ISCED levels. Programmes not leading to labour-market relevant
qualifications, classified as pre-vocational in ISCED-97, are now mainly classified as
general education.
ISCED-97 distinguished two categories of access to education at higher ISCED levels,
depending on the type of subsequent education, while ISCED 2011 identifies only one.
The ISCED 2011 sub-category “level completion with access to higher ISCED levels”
corresponds to the combined destination categories A and B in ISCED-97. ISCED 2011
further sub-classifies programmes that do not provide access to higher ISCED levels into
the sub-categories “no level completion”, “partial level completion” and “level
completion”. These three sub-categories in ISCED 2011 correspond to destination
category C in ISCED-97.
5.2. Definition and classification of educational programmes
The educational programme is the basic unit of classification within ISCED 2011 and as
such is the main building block for international statistical comparisons in education. This
section first defines an educational programme and then describes the various ways in
which such programmes can be classified: by level, outcomes and destinations,
vocational/general orientation, and field of study.
5.2.1. Definition of an educational programme
The basic units of classification in ISCED are the national (and subnational) education
programme and the related recognised educational qualification. An educational
programme is defined as a collection of educational activities which are organised to
accomplish a predetermined objective or the completion of a specified set of educational
tasks.
The term “educational activities” has a broader meaning than terms such as “course” or
“class”. Educational activities can be courses (e.g. the study of individual subjects)
organised into programmes or free-standing courses. They can also include a variety of
components not normally characterised as courses, for example periods of work
experience in enterprises, research projects and the preparation of dissertations.
Objectives could include preparation for more advanced study, the achievement of a

80 │ 5 - DEFINITION AND CLASSIFICATION OF EDUCATIONAL PROGRAMMES: THE PRACTICAL…
OECD HANDBOOK FOR INTERNATIONALLY COMPARATIVE EDUCATION STATISTICS 2018 © OECD 2018
qualification, preparation for an occupation or range of occupations, or simply an increase
in knowledge and understanding.
An educational programme could be the study of a single subject leading to a recognised
qualification or it can be the study of a collection of subjects, along with perhaps a period
of work experience, all of which contribute towards the same qualification aim.
5.2.2. Classification of educational programmes by level
Table 5.1 summarises the levels to which programmes are assigned within ISCED 2011
and ISCED-97.
Table 5.1. ISCED 2011 and ISCED-97 levels compared
ISCED 2011 ISCED-97
01 Early childhood educational development 0
Pre-primary education
02 Pre-primary education
1 Primary education 1 Primary education or first stage of basic education
2 Lower secondary education 2 Lower secondary education or second stage of basic education
3 Upper secondary education 3 (Upper) secondary education
4 Post-secondary non-tertiary education 4 Post-secondary non-tertiary education
5 Short-cycle tertiary education 5 First stage of tertiary education not leading directly to an advanced research qualification (5A, 5B)
6 Bachelor’s or equivalent level
7 Master’s or equivalent level
8 Doctoral or equivalent level 6 Second stage of tertiary education leading to an advanced research qualification
Levels of education are an ordered set grouping education programmes together in
relation to gradations of learning experiences, as well as the knowledge, skills and
competencies which each programme is designed to impart. The ISCED level reflects the
degree of complexity and specialisation of the content of an education programme, from
foundational to complex.
From ISCED 2011, early childhood education (ISCED level 0) provides learning and
educational activities with a holistic approach to support children’s early cognitive,
physical, social and emotional development and to introduce young children to organised
instruction outside of the family context. It aims to develop some of the skills needed for
academic readiness and to prepare them for entry into primary education.
Primary education (ISCED level 1) provides learning and educational activities
typically designed to provide students with fundamental skills in reading, writing and
mathematics (i.e. literacy and numeracy) and establish a solid foundation for learning and
understanding core areas of knowledge and personal development, preparing for lower
secondary education. It focuses on learning at a basic level of complexity with little, if
any, specialisation.
Lower secondary education (ISCED level 2) is typically designed to build on the
learning outcomes from ISCED level 1. Usually, the educational aim is to lay the
foundation for lifelong learning and human development upon which education systems
may then expand further educational opportunities. Programmes at this level are usually
organised around a more subject-oriented curriculum, introducing theoretical concepts
across a broad range of subjects.

5 - DEFINITION AND CLASSIFICATION OF EDUCATIONAL PROGRAMMES: THE PRACTICAL… │ 81
OECD HANDBOOK FOR INTERNATIONALLY COMPARATIVE EDUCATION STATISTICS 2018 © OECD 2018
Upper secondary education (ISCED level 3) is typically designed to complete
secondary education in preparation for tertiary education, to provide skills relevant to
employment, or both. Programmes at this level offer students more varied, specialised
and in-depth instruction than in lower secondary education. They are more differentiated,
with an increased range of options and streams available.
Post-secondary non-tertiary education (ISCED level 4) provides learning experiences
building on secondary education, preparing for labour-market entry as well as tertiary
education. It typically targets students who have completed upper secondary education
(ISCED level 3), but who want to increase their opportunities to enter the labour market
or progress to tertiary education. Programmes are often not significantly more advanced
than those at upper secondary education as they typically serve to broaden – rather than
deepen – knowledge, skills and competencies. They therefore aim at learning below the
high level of complexity characteristic of tertiary education.
Tertiary education (ISCED levels 5 to 8) builds on secondary education, providing
learning activities in specialised fields of education. It aims at learning at a high level of
complexity and specialisation. Tertiary education includes what is commonly understood
as academic education but also includes advanced vocational or professional education.
The level of an educational programme should be determined by its educational content.
It is very difficult, however, to directly assess and compare the content of the educational
programmes in a way that is internationally comparative. Curricula are too diverse, multi-
faceted and complex to allow for clear judgements that one curriculum for students of
given age or grade belongs to a higher level of education than another. Therefore, ISCED
2011 defines criteria which describe the characteristics of a programme used to allocate
national programmes to ISCED levels (UIS, 2012).
Categories of education programmes and qualifications
ISCED 2011 categorises education programmes and qualifications according to the
outcomes and destinations to which successful completion of the programme (or the
resulting qualification) can lead. It is necessary to distinguish between the successful
completion of an education programme and the completion of an ISCED level. At most
ISCED levels, ISCED 2011 distinguishes between programmes which are sufficient for
level completion and those which are not.
Successful completion of an education programme is the achievement of the learning
objectives of the programme typically validated through the assessment of acquired
knowledge, skills and competencies. Successful completion of a programme is usually
documented by the award of an educational qualification.
Completion of an ISCED level is the successful completion of an education programme
sufficient for level completion:
At ISCED levels 1 and 4-8, the successful completion of a programme meeting
the content and minimum duration criteria for the given level is considered as
level completion.
At ISCED levels 2 and 3 the successful completion of any programme granting
access to programmes at higher ISCED levels (i.e. ISCED level 3 in the case of
ISCED level 2 programmes and ISCED level 5, 6 or 7 in the case of ISCED level
3 programmes) is counted as level completion, as is the completion of any
terminal programme meeting the content, minimum duration (2 years) and
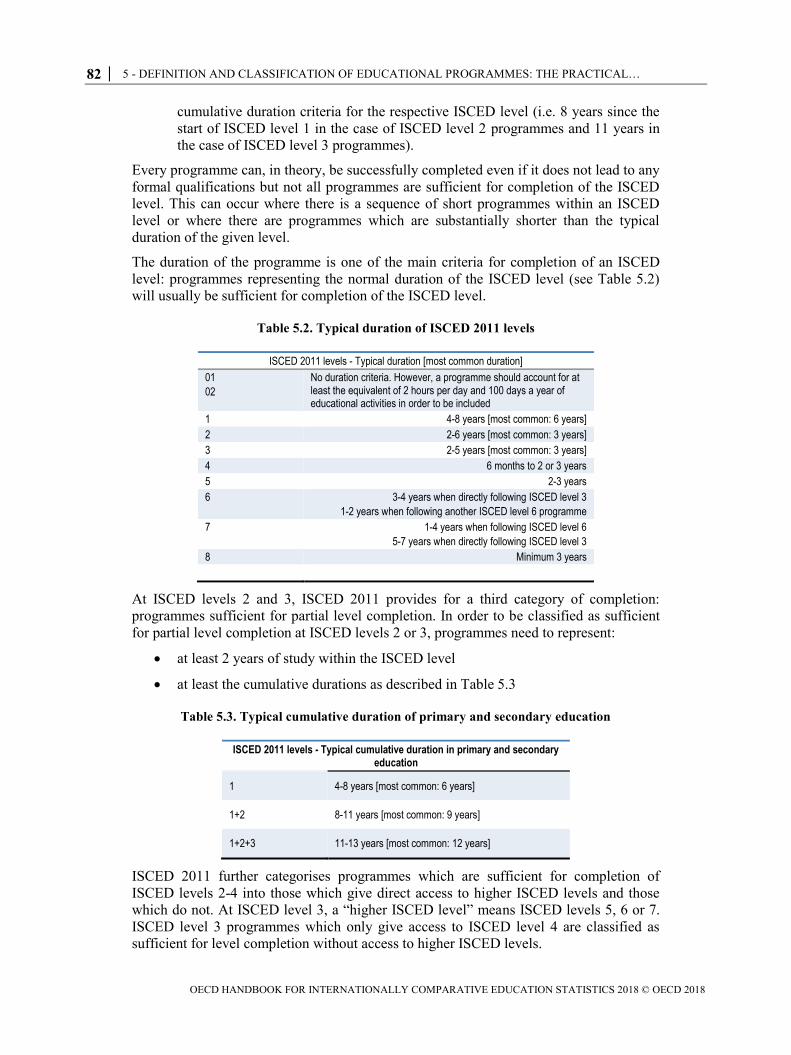
82 │ 5 - DEFINITION AND CLASSIFICATION OF EDUCATIONAL PROGRAMMES: THE PRACTICAL…
OECD HANDBOOK FOR INTERNATIONALLY COMPARATIVE EDUCATION STATISTICS 2018 © OECD 2018
cumulative duration criteria for the respective ISCED level (i.e. 8 years since the
start of ISCED level 1 in the case of ISCED level 2 programmes and 11 years in
the case of ISCED level 3 programmes).
Every programme can, in theory, be successfully completed even if it does not lead to any
formal qualifications but not all programmes are sufficient for completion of the ISCED
level. This can occur where there is a sequence of short programmes within an ISCED
level or where there are programmes which are substantially shorter than the typical
duration of the given level.
The duration of the programme is one of the main criteria for completion of an ISCED
level: programmes representing the normal duration of the ISCED level (see Table 5.2)
will usually be sufficient for completion of the ISCED level.
Table 5.2. Typical duration of ISCED 2011 levels
ISCED 2011 levels - Typical duration [most common duration]
01
02
No duration criteria. However, a programme should account for at least the equivalent of 2 hours per day and 100 days a year of educational activities in order to be included
1 4-8 years [most common: 6 years]
2 2-6 years [most common: 3 years]
3 2-5 years [most common: 3 years]
4 6 months to 2 or 3 years
5 2-3 years
6 3-4 years when directly following ISCED level 3
1-2 years when following another ISCED level 6 programme
7 1-4 years when following ISCED level 6
5-7 years when directly following ISCED level 3
8 Minimum 3 years
At ISCED levels 2 and 3, ISCED 2011 provides for a third category of completion:
programmes sufficient for partial level completion. In order to be classified as sufficient
for partial level completion at ISCED levels 2 or 3, programmes need to represent:
at least 2 years of study within the ISCED level
at least the cumulative durations as described in Table 5.3
Table 5.3. Typical cumulative duration of primary and secondary education
ISCED 2011 levels - Typical cumulative duration in primary and secondary education
1 4-8 years [most common: 6 years]
1+2 8-11 years [most common: 9 years]
1+2+3 11-13 years [most common: 12 years]
ISCED 2011 further categorises programmes which are sufficient for completion of
ISCED levels 2-4 into those which give direct access to higher ISCED levels and those
which do not. At ISCED level 3, a “higher ISCED level” means ISCED levels 5, 6 or 7.
ISCED level 3 programmes which only give access to ISCED level 4 are classified as
sufficient for level completion without access to higher ISCED levels.

5 - DEFINITION AND CLASSIFICATION OF EDUCATIONAL PROGRAMMES: THE PRACTICAL… │ 83
OECD HANDBOOK FOR INTERNATIONALLY COMPARATIVE EDUCATION STATISTICS 2018 © OECD 2018
Education programmes and corresponding qualifications can thus be classified into four
categories:
Insufficient for level completion (with no access to higher ISCED levels).
Partial level completion (with no access to higher ISCED levels). This category
applies only at ISCED levels 2 and 3.
Level completion without access to higher ISCED levels.
Level completion with access to higher ISCED levels (UIS, 2012[3]).
Orientation of education programmes
In ISCED 2011, the two categories of orientation of programmes at ISCED levels 2-5 are
general and vocational. ISCED 2011 does not define academic and professional more
precisely, but opens up the possibility of using any national definitions that exist.
General education programmes are designed to develop learners’ general knowledge,
skills and competencies, as well as literacy and numeracy skills, often to prepare
participants for more advanced education programmes at the same or a higher ISCED
level and to lay the foundation for lifelong learning. Such programmes are typically
school- or college-based. General education includes education programmes that are
designed to prepare participants for entry into vocational education but do not prepare for
employment in a particular occupation, trade or class of occupations or trades, nor lead
directly to a labour-market relevant qualification.
Vocational education programmes are designed for learners to acquire the knowledge,
skills and competencies specific to a particular occupation, trade or class of occupations
or trades. Such programmes may have work-based components (for example
apprenticeships or dual-system education programmes). Successful completion of such
programmes leads to labour-market relevant, vocational qualifications acknowledged as
occupationally oriented by the relevant national authorities and/or the labour market.
Both general and vocational programmes can contain some courses or subjects that are
common to both programmes. For example, a vocational programme may contain courses
on mathematics or the national language which are also taught to students in general
programmes. When reporting data on certain statistical units, in particular education
personnel, by programme orientation it is the classification of the programme that
determines the orientation and not the subject being studied or taught (UIS, 2012[3]).
Field of education of programmes
Fields of education and training are defined as the subject matter taught in an education
programme.
Programmes are classified into fields of education as defined in UNESCO’s ISCED
Fields of Education and Training 2013 (UNESCO-UIS, 2014[4]).
The same classification by field of education is used for all levels of education. The fields
of education are not defined within levels, but are independent of levels. It is recognised,
however, that not all fields appear at all levels.
In summary, the classification distinguishes the following fields:
00 Generic programmes and qualifications

84 │ 5 - DEFINITION AND CLASSIFICATION OF EDUCATIONAL PROGRAMMES: THE PRACTICAL…
OECD HANDBOOK FOR INTERNATIONALLY COMPARATIVE EDUCATION STATISTICS 2018 © OECD 2018
001 Basic programmes and qualifications
002 Literacy and numeracy
003 Personal skills and development
01 Education
011 Education
02 Arts and humanities
021 Arts
022 Humanities (except languages)
023 Languages
03 Social sciences, journalism and information
031 Social and behavioural sciences
032 Journalism and information
04 Business, administration and law
041 Business and administration
042 Law
05 Natural sciences, mathematics and statistics
051 Biological and related sciences
052 Environment
053 Physical sciences
054 Mathematics and statistics
06 Information and communication technologies
061 Information and communication technologies
07 Engineering, manufacturing and construction
071 Engineering and engineering trades
072 Manufacturing and processing
073 Architecture and construction
08 Agriculture, forestry, fisheries and veterinary
081 Agriculture
082 Forestry
083 Fisheries
084 Veterinary
09 Health and welfare
091 Health
092 Welfare

5 - DEFINITION AND CLASSIFICATION OF EDUCATIONAL PROGRAMMES: THE PRACTICAL… │ 85
OECD HANDBOOK FOR INTERNATIONALLY COMPARATIVE EDUCATION STATISTICS 2018 © OECD 2018
10 Services
101 Personal services
102 Hygiene and occupational health services
103 Security services
104 Transport services
5.3. Detailed description of ISCED levels and application of the classification
criteria
There are several main and auxiliary criteria that act as proxy measures for educational
content, which can help decide how to classify the level of any given educational
programme. Table 5.4 outlines the criteria for each ISCED 2011.
Table 5.4. Criteria for classifying educational programmes
ISCED level Main criteria Subsidiary criteria Complementary dimensions
Level 0
Early childhood education
• educational properties of the programme
• institutional context
• typical target age of children for whom the programme is designed
• programme intensity or duration
• staff qualifications
• existence of a regulatory framework
• typically not part of compulsory education
• One dimension differentiates education programmes at ISCED level 0: target age group
Level 1
Primary education
• systematic instruction in fundamental knowledge, skills and competencies
• typical entrance age and duration
• instruction organised typically by one main class teacher
• part of compulsory education None
Level 2
Lower secondary education
• transition to more subject-oriented instruction
• entry requirements
• cumulative duration since the beginning of ISCED level 1
• typical entry age
• instruction by subject teachers and qualifications of teachers
• part of compulsory education
Two dimensions differentiate education programmes at ISCED level 2:
• Two orientation categories: general and vocational.
• Four level completion and access sub-categories:
1) no completion of ISCED level 2 (and thus without direct access to ISCED 3);
2) partial completion of ISCED level 2 without direct access to ISCED 3;
3) completion of ISCED level 2 without direct access to ISCED 3; and
4) completion of ISCED level 2 with direct access to ISCED 3.
Level 3
Upper secondary education
• second/final stage of general and vocational secondary education
• entry requirements
• cumulative duration since the beginning of ISCED level 1
• more differentiated programmes, with an increased range of options and streams
• teachers’ qualifications
Two dimensions differentiate education programmes at ISCED level 3:
• Two orientation categories: general and vocational.
• Four level completion and access sub-categories:
1) no completion of ISCED level 3 (and thus without direct access to first tertiary programmes at ISCED level 5, 6 or 7);
2) partial completion of ISCED level 3 without direct access to first tertiary programmes at ISCED level 5, 6 or 7; 3) completion of ISCED level 3 without direct access to first tertiary programmes at ISCED level 5, 6 or 7; and
4) completion of ISCED level 3 with direct access to first tertiary programmes at ISCED level 5, 6 or 7.

86 │ 5 - DEFINITION AND CLASSIFICATION OF EDUCATIONAL PROGRAMMES: THE PRACTICAL…
OECD HANDBOOK FOR INTERNATIONALLY COMPARATIVE EDUCATION STATISTICS 2018 © OECD 2018
ISCED level Main criteria Subsidiary criteria Complementary dimensions
Level 4
Post-secondary non-tertiary education
• orientation
• complexity of content higher than ISCED level 3 and below the level of tertiary education
• entry requirements
none Two dimensions differentiate education programmes at ISCED level 4:
• Two orientation categories: general and vocational.
• Three level completion and access sub-categories:
1) no completion of ISCED level 4;
2) completion of ISCED level 4 without direct access to first tertiary programmes at ISCED level 5, 6 or 7; and
3) completion of ISCED level 4 with direct access to first tertiary programmes at ISCED level 5, 6 or 7.
Level5
Short-cycle tertiary education
• content of short-cycle tertiary education programmes
• entry requirements
• minimum duration of level
• institutional transition point
• typical duration of level
Two dimensions differentiate education programmes at ISCED level 5:
• Two orientation categories: general and vocational.
• Two level completion and access sub-categories:
1) no completion of ISCED level 5, if the stage (or programme) is less than two years’ duration and therefore insufficient for completion of the level; and
2) completion of ISCED level 5 if the programme has a duration of two or more years and is therefore sufficient for completion of the level.
Level 6
Bachelor’s or equivalent level
• theoretically and/or professionally based content
• entry requirements
• minimum cumulative duration of (first-degree) programme
• position in the national degree and qualification structure
• staff qualifications Two dimensions differentiate education programmes at ISCED level 6:
• Two orientation categories: academic and professional.
• Four level completion and access sub-categories:
1) stage (or programme) within a first degree at bachelor’s or equivalent level with a cumulative theoretical duration (at tertiary level) of less than three years, therefore insufficient for completion of the level;
2) first-degree programme at bachelor’s or equivalent level with a cumulative theoretical duration (at tertiary level) of three to four years;
3) long first-degree programme at bachelor’s or equivalent level with a cumulative theoretical duration (at tertiary level) of more than four years; and
4) second or further degree programme at bachelor’s or equivalent level (following successful completion of a bachelor’s or equivalent programme).
Level 7
Master’s or equivalent level
• theoretically and/or professionally based content
• position in the national degree and qualification structure
• entry requirements
• minimum cumulative duration of long first-degree programme
• direct access to ISCED level 8 programmes
Two dimensions differentiate education programmes at ISCED level 7:
• Two orientation categories: academic and professional.
• Four level completion and access sub-categories:
1) stage (or programme) within a first degree at master’s or equivalent level with a cumulative theoretical duration (at tertiary level) of less than five years, therefore insufficient for completion of the level;
2) long first-degree programme at a master’s or equivalent level with a cumulative theoretical duration (at tertiary level) of at least five years (that does not require prior tertiary education);
3) second or further degree programme at master’s or equivalent level (following successful completion of a bachelor’s or equivalent programme); and
4) second or further degree programme at master’s or equivalent level (following successful completion of another master’s or equivalent programme).
Level 8 Doctoral or equivalent level
• written work requirements
• entry requirements
• minimum duration of level
• doctoral degree/ qualification required for specific occupations
One dimension differentiate education programmes at ISCED level 8:
• Two orientation categories: academic and professional.
Source: (UIS, 2012[3]).
5 - DEFINITION AND CLASSIFICATION OF EDUCATIONAL PROGRAMMES: THE PRACTICAL… │ 87
OECD HANDBOOK FOR INTERNATIONALLY COMPARATIVE EDUCATION STATISTICS 2018 © OECD 2018
5.4. Country ISCED mappings
From the initial implementation of ISCED, it has been crucial to accurately document
how the ISCED classification maps onto national educational programmes.
Since the public release of the new ISCED classification, OECD member countries have
invested great efforts into establishing new mappings of their national educational
programmes to ISCED 2011. Making the mapping of countries transparent to data
providers and users of educational data is one of the most important steps in
implementing ISCED 2011. As educational systems and their programmes are not static,
it is crucial that ISCED remain a flexible tool for classifying programmes. It is crucial
that changes in educational systems are mirrored in the ISCED mapping of countries, and,
equally important, that those changes remain transparent to other countries. The ISCED
mappings are therefore kept up-to-date every year via a questionnaire as part of the
regular UOE data collection.
The link to the latest version of the country mappings at the time of publication is
contained in Annex 2.
References
OECD/Eurostat/UNESCO Institute for Statistics (2015), ISCED 2011 Operational
Manual: Guidelines for Classifying National Education Programmes and Related
Qualifications, OECD Publishing, Paris, http://dx.doi.org/10.1787/9789264228368-en.
[2]
UIS (2012), International Standard Classification of Education: ISCED-2011,
http://uis.unesco.org/sites/default/files/documents/international-standard-classification-of-
education-isced-2011-en.pdf.
[3]
UIS (2011), International Standard Classification of Education, http://www.uis.unesco.org
(accessed on 26 July 2018).
[1]
UNESCO-UIS (2014), ISCED Fields of Education and Training 2013 (ISCED-F 2013): Manual
to Accompany the International Standard Classification of Education 2011; 2014, UNESCO
Institute for Statistics, Montreal, http://dx.doi.org/10.15220/978-92-9189-150-4-en (accessed
on 18 April 2018).
[4]


6 – DATA QUALITY │ 89
OECD HANDBOOK FOR INTERNATIONALLY COMPARATIVE EDUCATION STATISTICS 2018 © OECD 2018
Data quality Chapter 6.
This chapter examines issues surrounding the quality of the OECD’s international
education data. It begins with a declaration on the OECD commitment to data quality and
the quality framework used to collect, compile and disseminate education data. It then
discusses the type of data-quality problems that arise and why, together with a description
of what the OECD does to assess and address them. It then makes some suggestions
about making estimates for missing data and concludes with an account of the main data-
quality issues that remain to be tackled in the area of international education data.
6.1. OECD dimensions of data quality
Data quality is fundamental to the credibility of the statistics produced by the OECD in
general and by the OECD Directorate of Education and Skills in particular. The OECD
collection of education statistics adheres to the core values stated in the OECD’s Quality
Framework and Guidelines for OECD Statistical Activities (OECD, 2011[1]).
The OECD’s education statistics are compiled and made available on an impartial basis.
They are produced according to strictly professional considerations, including scientific
principles and professional ethics, with regard to methods and procedures used for the
collection, processing, storage and dissemination of statistical data.
Quality is defined as “fitness for use” for users’ needs. This definition is broader than has
been customary in the past, when quality was equated with accuracy. It is now generally
recognised that there are other important dimensions. Even if data are accurate, they
cannot be said to be of good quality if they are produced too late to be useful, or cannot
be easily accessed, or appear to conflict with other data. Thus, quality can be seen as a
multi-faceted concept. Which quality characteristics are most important depend on users’
perspectives, needs and priorities, which vary across groups of users.
The OECD views quality in terms of seven dimensions: relevance, accuracy, credibility,
timeliness, accessibility, interpretability and coherence. Last but not least, cost-efficiency
is an important factor although not strictly speaking, a quality dimension. Cost-efficiency
must be considered in the possible application of any one or more of these seven
dimensions.
The OECD Quality Framework is therefore built around eight considerations:
Relevance: measuring relevance requires the identification of user groups and
their needs.
Accuracy is the degree to which the data correctly estimate or describe the
quantities or characteristics that they are designed to measure.
Credibility is the confidence that users place in data products based simply on
their image of the data producer, i.e. the brand image. Credibility is determined in
part by the integrity of the production process. Principle 2 of the UN Principles of

90 │ 6 – DATA QUALITY
OECD HANDBOOK FOR INTERNATIONALLY COMPARATIVE EDUCATION STATISTICS 2018 © OECD 2018
Official Statistics (United Nations, 1994) states: “to retain trust in official
statistics, the statistical agencies need to decide according to strictly professional
considerations, including scientific principles and professional ethics, on the
methods and procedures for the collection, processing, storage and presentation of
statistical data”.
Timeliness reflects the length of time between data becoming available and the
events or phenomena they describe. The notion of timeliness is assessed on the
time period that permits the information to be of value and still acted upon.
Accessibility reflects how readily data products can be located and accessed from
within OECD data holdings.
Interpretability reflects the ease with which users may understand and properly
use and analyse the data. The adequacy of the definitions of concepts, target
populations, variables and terminology underlying the data, and information
describing the limitations of the data, if any, largely determines the degree of
interpretability.
Coherence reflects the degree to which the data are logically connected and
mutually consistent.
o Coherence within a dataset implies that the elementary data items are based
on compatible concepts, definitions and classifications and can be
meaningfully combined. Incoherence within a dataset occurs, for example,
when two sides of an implied balancing statement, such as inflows and
outflows, do not balance.
o Coherence across datasets implies that the data are based on common
concepts, definitions and classifications, or that any differences are explained
and can be allowed for.
o Coherence over time implies that the data are based on common concepts,
definitions and methodology over time, or that any differences are explained
and can be allowed for. Incoherence over time refers to breaks in a series
resulting from changes in concepts, definitions or methodologies.
o Coherence across countries implies that the data are based on common
concepts, definitions, classifications and methodology, or that any differences
are explained and can be allowed for.
Cost-efficiency measures the costs and provider burden relative to the output.
Provider burden is a cost that happens to be borne by the provider, but is a cost
nevertheless. Although the OECD does not regard cost-efficiency as a dimension
of quality, it is a factor that must be taken into account in any analysis of quality
as it can affect quality in all dimensions.
6.2. Types (or causes) of data-quality issues
As with any data collected by the OECD, the quality of education statistics and indicators
disseminated depends on two aspects: the quality of the national statistics received and
the quality of the internal processes for the collection, processing, analysis and
dissemination of data and metadata. While the latter is within OECD’s control, the former
is less so.

6 – DATA QUALITY │ 91
OECD HANDBOOK FOR INTERNATIONALLY COMPARATIVE EDUCATION STATISTICS 2018 © OECD 2018
The quality of national statistics received will essentially be a function of:
the adequacy of national data sources to provide the required international data
the extent to which international data definitions and guidelines are correctly
applied
internal capacity within countries to implement OECD guidelines and develop
appropriate data collection systems
the quality and reliability of data transfer channels between national statistics
offices and the OECD.
Within the field of education, a number of factors may mean national data sources are
inadequate to provide the required data at the international level.
The coverage of national sources – either individually or collectively – may not
match the intended coverage of education as defined in Chapter 3. This can result
either in gaps in the reported data or over-reporting through the inclusion of
educational programmes that are not in scope of the data collection. This can also
happen where there is ambiguity surrounding the validity for inclusion of some
programmes, such as some continuing education programmes. As countries will
typically use a number of national data sources to compile their international data
returns, inconsistent coverage between them can cause problems of internal
consistency and perhaps double counting of data reported by an individual
country. This may occur between student data at different ISCED levels or
between enrolment and finance data.
Similarly, the point in time when the data are collected (the reference period)
and the date on which the count of students is taken (the reference year for
statistics), may differ from the international requirements. Data may simply not
yet be available for the intended reference periods of the data collections, either
because the national data-processing timetable does not fit well with the
international data collection or perhaps because national data collections do not
occur every year.
National data item definitions (e.g. of teachers, graduates and programmes) and
their classifications (e.g. programme level or type of educational personnel) may
be different from international guidelines.
Difficulties adhering to international guidelines can arise when national data cannot
readily be translated into the international definitions, but they can also arise from
weaknesses in the guidance itself. This may be due to the lack of an internationally
agreed definition for a data item or a lack of clarity in its description (United Nations,
2014[2]).
In addition to these challenges, ensuring education statistics are comparable over time is
often a challenge. There are three possible reasons for significant changes in the data
from one year to another:
Changes in the educational system. This refers to “real” changes in the data due
to changing conditions of the educational system, such as the implementation of
reforms that lead to, for instance, an increase in the stock of students.
Changes in the coverage of the data collection. This refers to changes
introduced due to the exclusion or inclusion of programmes compared to the

92 │ 6 – DATA QUALITY
OECD HANDBOOK FOR INTERNATIONALLY COMPARATIVE EDUCATION STATISTICS 2018 © OECD 2018
previous year, for example the inclusion of adult literacy programmes or private
schools.
Changes in the methodology used. This refers to significant changes in the data
due to new/modified methodologies in collecting or estimating data.
6.3. Tackling data-quality issues
Both the OECD and member countries have committed considerable efforts to assuring
and improving the quality of education data. On the one hand this involves a rigorous
data collection and verification process and on the other hand, a commitment to
continuously address areas of weakness in data quality.
The OECD’s main actions to improve data quality are:
Meeting with countries to provide advice and guidance on detailed data
definitions and data reporting. This guidance advises the data providers about the
checks that will be carried out and the treatment of missing values.
Using electronic data collection instruments (electronic questionnaires) which
include aggregations of sub-classifications in areas where it is known to be
difficult for countries to provide the required data, for example the disaggregation
of some ISCED levels. Those instruments allow checks to be readily available. It
also helps with coherence across the different questionnaires. For instance,
student enrolment data are collected on different bases to match the coverage of
the finance and the personnel data.
Using codes in data tables to inform users of missing data or data of lower
quality:
o category not applicable (a)
o data included in other categories (x, xr…, xc…, xa… indicating the row (r)
and column (c) in which the data are included)
o includes data from another category (d)
o data not available (m)
o too few observations to provide reliable estimates (c)
o values are below a certain reliability threshold and should be interpreted with
caution (r)
Asking countries to provide metadata along with their data which outline the
concepts, definitions and methods used in collection, compilation, transformation,
revision practices and dissemination of statistics. For education statistics, an
important element of metadata is the mapping of countries’ national educational
programmes to the ISCED levels and the description of these programmes. Other
metadata collected include:
o reference periods (start and end of school years) for each level of education
o data collection periods (e.g. snapshot or whole year counts within the
reference periods)
o reference data for student ages
6 – DATA QUALITY │ 93
OECD HANDBOOK FOR INTERNATIONALLY COMPARATIVE EDUCATION STATISTICS 2018 © OECD 2018
o theoretical starting, ending and graduation rates
o data sources and methods used
o documentation on breaks in time series.
Including automated verification in the electronic questionnaire spreadsheets sent
to countries to fill in. The data providers can then run a check routine which
identifies data cells with missing values and verifies the internal consistency of
the data both within and between tables. Countries are asked to explain any
verification errors remaining in their questionnaire submission.
Subjecting the submitted questionnaires to rigorous scrutiny from the OECD
Secretariat, particularly checking year-on-year consistency of the data, and raising
queries with countries as required. These may lead to countries resubmitting data.
Informing countries on how their data have been used in the calculation of the
indicators that will subsequently appear in the publication Education at a Glance
through preliminary tables shared with countries. Countries’ knowledge of the use
to which the data will be put is an important element in achieving good data
quality.
Beyond the data collection process, the OECD makes a continual effort to assess and to
improve the data quality, mainly conducted through the agendas of the INES Working
Party and INES Network meetings. Special studies are conducted in areas where
comparability problems have been identified. This specific approach allows the OECD to
clarify countries’ current data reporting approaches and use this to refine the data
reporting guidance it provides to countries and to enrich the metadata. Such studies have
been carried out in the areas of educational finance and enrolment.
In addition, the OECD runs trend data collections every year to re-collect data for past
years on a consistent (similar) basis approach, in order to have comparable data over time
and ensure that any adjustments to previous data have been taken into account in the most
current data collection (UNESCO-UIS/OECD/EUROSTAT, 2016[3]).
6.4. Suggestions for the estimation of missing data
National data sources are rarely adequate to provide all of the data requested at the
international level and missing codes frequently have to be used. This section provides
some suggestions on techniques that can be used to derive estimates for some of these
missing values. In each case they are, merely suggestions; the data providers are best
placed to judge how reasonable the estimation techniques are in their own countries’ data.
There are broadly five situations in which missing values might arise:
Data not collected for a variable. In this case, it may be possible to create an
estimate based on assumed relationships to other variables. For example, if
students’ age distribution is not available but the grade distribution is, it may be a
reasonable assumption that all students in the same grade are the same age.
Alternatively, there may be information about the relationship between age and
grade from another source (such as a research study or ad hoc survey) which can
help with estimating the missing variable.
Data not available for the desired level of aggregation. A common example
here would be where data only provide partial national coverage, e.g. are

94 │ 6 – DATA QUALITY
OECD HANDBOOK FOR INTERNATIONALLY COMPARATIVE EDUCATION STATISTICS 2018 © OECD 2018
available for some regions but not all. Here a feasible approach may be to scale up
the subnational figures to national level using a scaling factor derived from a
different, but related dataset. For example, partial student enrolment numbers
could be scaled up on the basis of student data from labour force surveys or from
the results of an ad hoc survey.
Data only available for certain sub-populations. This case is similar to the
previous situation and the same potential solution could be applied. For example,
where certain data may be available for public schools and government-dependent
private schools but not for independent private schools, they could be scaled up as
described above.
Data not available for the desired level of disaggregation. For example,
expenditure data may not be available for each level of education separately but
can be apportioned to the corresponding levels based on student enrolments in the
respective levels. Alternatively, expenditure could be apportioned based on the
relative student-teacher ratios between the levels, or staff numbers. Similarly,
teacher numbers or teaching hours could be used to distribute teachers’ salaries
between ISCED levels. A related situation is where most national data can be
allocated to the international classification but there are a number of cases that
cannot and would otherwise be recorded as “not known”. Here, the “not knowns”
could be allocated to the target classification on a pro-rated basis.
Data not available for the year of the data collection. In this case it may be
possible to estimate the data on the basis of data from previous years. For some
finance data, applying inflation rates to a previous year’s data may be appropriate
as long as that is seen as a reasonable estimate of the expenditure that will
actually have occurred. Budgeted rather than actual expenditure figures may also
provide a reasonable basis for estimating current year expenditure. For student
enrolment data, current year estimates could be derived by applying estimates of
transition rates between levels or grades, preferably based on historical trends.
In all cases, when choosing a technique to estimate missing data, thought needs to be
given to the use to which the data will be put, particularly in indicator calculations. For
example, using student numbers as a basis for estimating missing expenditure data would
be inappropriate if the estimated expenditure data were then to be used to calculate
expenditure per student.
6.5. Remaining areas for data-quality improvement
Although much progress has been made in improving the comparability of international
education statistics and indicators, much has still to be done. Comparability could still be
improved in the following major areas:
6.5.1. Coverage of educational programmes
Although non-formal education is a recognised part of the international classification of
education, as defined in Chapter 3, international data collections are likely to restrict their
coverage of educational statistics to formal programmes for the sake of international
comparability and feasibility.
The heterogeneity of non-formal education programmes means that it is difficult to
provide general guidelines for their application in statistical instruments, given the
6 – DATA QUALITY │ 95
OECD HANDBOOK FOR INTERNATIONALLY COMPARATIVE EDUCATION STATISTICS 2018 © OECD 2018
purpose of international comparability. Currently, the OECD recommends using the
criteria of equivalency of content for the classification of non-formal education
programmes, which relate non-formal programmes to formal programmes with similar
content within ISCED. However, at this stage, ISCED 2011 does not give specific advice
on the development of mappings for non-formal programmes or any related non-formal
educational qualifications.
6.5.2. Classification of programmes by level
According to the ISCED manual, the notion of “levels” of education is represented by an
ordered set, grouping education programmes in relation to gradations of learning
experiences, as well as the knowledge, skills and competencies which each programme is
designed to impart. The “level” reflects the degree of complexity and specialisation of the
content of an education programme, from foundational to complex. However, curricula
are too diverse, multi-faceted and complex to directly assess and compare the content of
programmes across education systems in a consistent way. In the absence of direct
measures to classify educational content, ISCED employs proxy criteria. These proxies
only provide a pragmatic answer and efforts need to continue to arrive at a more
comparable allocation of programmes to levels.
6.5.3. Full-time and part-time student status and conversion to full-time
equivalents
The reporting of these data to common international data definitions is one of the areas
that is most constrained by what is collected nationally. As noted in Chapter 4
(Section 4.1.9), up to the end of secondary level, the method used to distinguish between
full-time and part-time students is more likely to depend on student attendance or time in
the classroom. At tertiary level, study load is more likely to be measured in terms of
instructional hours and credit accumulation, but this may not be consistent across
countries. Moreover, some countries distinguish between full- and part-time on the basis
of the characteristics of the programme rather than of the time students spend studying.
For instance, in the particular case of combined school and work-base programmes,
students participating in these dual-system apprenticeship programmes are classified as
full-time students even though the school-based component comprises only part of the
programme.
In addition, the factors used for converting these student numbers to full-time equivalents
will not necessarily be derived on the same basis. Some will be based on classroom
attendance, some on study time commitment and some on credit accumulation, and this is
likely to lead to some distortion in international comparisons. The indicators affected will
be those on ratios of students to staff and expenditures per student.
6.5.4. Successful completion/graduation
The recent revision of the ISCED classification helped to clarify international definitions
of graduation. When a qualification obtained does not provide direct access to a higher
ISCED level, successful completion of programmes may be considered as level
completion (without access) or no level completion. If such a programme meets the right
criteria, completion could be partial (more details in Chapter 4, Section 4.1.4). The
inherent difficulty lies in being unable to measure the quality or value of a graduation
across (and within) countries. This would require an international standard or benchmark
which is not available at present.

96 │ 6 – DATA QUALITY
OECD HANDBOOK FOR INTERNATIONALLY COMPARATIVE EDUCATION STATISTICS 2018 © OECD 2018
6.5.5. Ancillary services expenditure
While it is clear that expenditure on ancillary services within educational institutions
should be included in the reported data (see Chapter 4, Section 4.5.3), the extent to which
they are varies from country to country. Where countries do report such expenditure, it
remains difficult for many of them to report it separately from expenditure on educational
core services, particularly at the tertiary level. This could lead to distortions in the
expenditure indicators and prevents these indicators – particularly expenditure per student
– from being calculated on a more logical basis using core services expenditures only.
6.5.6. Financial aid to students
Generally, there is a need to seek fairer and more complete measures of the financial aid
provided to students. Two issues in particular have not yet been adequately addressed:
first, the reporting of student loans and second the tax benefits and allowances paid to
students and their families which are contingent on the beneficiary being a student (see
Chapter 4, Section 4.5.4). Student loans are currently measured on a gross basis, without
subtracting repayments. While this is acceptable as a measure of the financing of students
in the current year it does not adequately measure the generosity of the aid package
available to students and nor does it fairly reflect the share of cost between the public and
private sectors. Tax benefits to students and their families are excluded from the
expenditures on education as there is no internationally agreed methodology for
measuring and reporting them, and yet these are legitimate means of providing support to
students and their families. Excluding such expenditure therefore undermines
comparisons of financial aid to students and of public subsidies to households generally.
6.5.7. Student mobility
Mobility measurement in education has gained importance in the last years, which
translated to an effort to better define what exactly is covered (Chapter 3,
Section 3.3.5 ). Henceforth, efforts are needed to capture better data to improve the
comparability of the foreign student data and differentiate foreign from international
students.
References
OECD (2011), Quality Framework for OECD Statistical Activities,
http://www.oecd.org/sdd/qualityframeworkforoecdstatisticalactivities.htm (accessed on
26 July 2018).
[1]
UNESCO-UIS/OECD/EUROSTAT (2016), UOE data collection on formal education Manual on
concepts, definitions and classifications,
http://uis.unesco.org/sites/default/files/documents/uoe2016manual_11072016_0.pdf (accessed
on 26 July 2018).
[3]
United Nations (2014), Fundamental Principles of Official Statistics,
https://unstats.un.org/unsd/dnss/gp/fundprinciples.aspx (accessed on 26 July 2018).
[2]
7 - INDICATOR CONCEPTS AND METHODOLOGIES │ 97
OECD HANDBOOK FOR INTERNATIONALLY COMPARATIVE EDUCATION STATISTICS 2018 © OECD 2018
Chapter 7. Indicator concepts and methodologies
This chapter aims to explain the concepts, methodologies and conventions used to
calculate the educational statistics and indicators and the related measurement issues.
The methodologies presented in this chapter are grouped according to their measurement
objectives: general/international averages, graduation analysis, educational attainment
analysis, labour force participation analysis, economic and social benefits of education,
expenditure analysis, participation and access to education, continuing education and
training analysis, learning environment and teacher working conditions analysis,
education and work status of young people, equity in education.
98 │ 7 - INDICATOR CONCEPTS AND METHODOLOGIES
OECD HANDBOOK FOR INTERNATIONALLY COMPARATIVE EDUCATION STATISTICS 2018 © OECD 2018
This chapter aims to explain the concepts, methodologies and conventions used to
calculate the educational statistics and indicators and the related measurement issues. It
does not seek to describe in detail every indicator that appears or has appeared in
Education at a Glance (OECD, 2018[1]). Instead it focuses on the core indicators or
groups of indicators which appear regularly in EAG with conceptual or methodological
aspects which are worthy of explanation. It can be considered as a catalogue of indicator
methodologies rather than a catalogue of indicators.
The methodologies presented in this chapter are grouped according to their measurement
objectives:
general/international averages
graduation analysis
educational attainment analysis
labour force participation analysis
economic and social benefits of education
expenditure analysis
participation and access to education
continuing education and training analysis
learning environment and teacher working conditions analysis
education and work status of young people
equity in education.
Apart from Section 7.1, each section starts with discussing the policy context, explaining
the relevance of each objective in the debate on education. This is followed by an
explanation of the calculation methodology used. Finally, each section closes with a
description of the limitations of the proposed methodology and any additional paths that
could be explored to broaden the analysis.
7.1. General/international averages
To enable comparisons across countries or group of countries, the EAG often calculates
averages for OECD countries, OECD partner countries and countries belonging to the
European Union.
The OECD average is calculated as the unweighted mean of the data values of all OECD
countries for which data are available or can be estimated. The OECD average refers to
an average of national values and can be used to answer the question of how an indicator
value for a given country compares with the value for a “typical” or average country. The
OECD average therefore does not take into account the size of the population in each
country, with each country contributing equally from Luxembourg to the United States.
The OECD total is calculated as if it is a weighted mean of the data values of all OECD
countries for which data are available or can be estimated. It reflects the value for a given
indicator when considering the OECD area as a whole. This approach is taken for the
purpose of comparing, for example, expenditure charts for individual countries with those
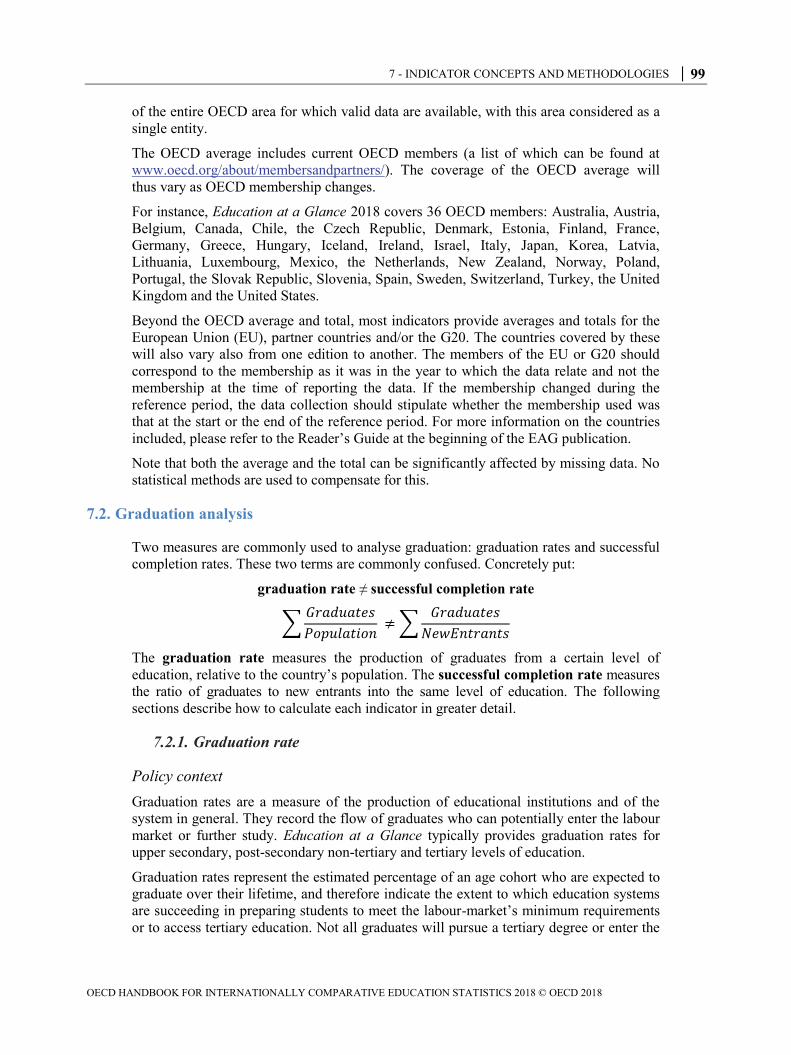
7 - INDICATOR CONCEPTS AND METHODOLOGIES │ 99
OECD HANDBOOK FOR INTERNATIONALLY COMPARATIVE EDUCATION STATISTICS 2018 © OECD 2018
of the entire OECD area for which valid data are available, with this area considered as a
single entity.
The OECD average includes current OECD members (a list of which can be found at
www.oecd.org/about/membersandpartners/). The coverage of the OECD average will
thus vary as OECD membership changes.
For instance, Education at a Glance 2018 covers 36 OECD members: Australia, Austria,
Belgium, Canada, Chile, the Czech Republic, Denmark, Estonia, Finland, France,
Germany, Greece, Hungary, Iceland, Ireland, Israel, Italy, Japan, Korea, Latvia,
Lithuania, Luxembourg, Mexico, the Netherlands, New Zealand, Norway, Poland,
Portugal, the Slovak Republic, Slovenia, Spain, Sweden, Switzerland, Turkey, the United
Kingdom and the United States.
Beyond the OECD average and total, most indicators provide averages and totals for the
European Union (EU), partner countries and/or the G20. The countries covered by these
will also vary also from one edition to another. The members of the EU or G20 should
correspond to the membership as it was in the year to which the data relate and not the
membership at the time of reporting the data. If the membership changed during the
reference period, the data collection should stipulate whether the membership used was
that at the start or the end of the reference period. For more information on the countries
included, please refer to the Reader’s Guide at the beginning of the EAG publication.
Note that both the average and the total can be significantly affected by missing data. No
statistical methods are used to compensate for this.
7.2. Graduation analysis
Two measures are commonly used to analyse graduation: graduation rates and successful
completion rates. These two terms are commonly confused. Concretely put:
graduation rate ≠ successful completion rate
∑𝐺𝑟𝑎𝑑𝑢𝑎𝑡𝑒𝑠
𝑃𝑜𝑝𝑢𝑙𝑎𝑡𝑖𝑜𝑛 ≠ ∑
𝐺𝑟𝑎𝑑𝑢𝑎𝑡𝑒𝑠
𝑁𝑒𝑤𝐸𝑛𝑡𝑟𝑎𝑛𝑡𝑠
The graduation rate measures the production of graduates from a certain level of
education, relative to the country’s population. The successful completion rate measures
the ratio of graduates to new entrants into the same level of education. The following
sections describe how to calculate each indicator in greater detail.
7.2.1. Graduation rate
Policy context
Graduation rates are a measure of the production of educational institutions and of the
system in general. They record the flow of graduates who can potentially enter the labour
market or further study. Education at a Glance typically provides graduation rates for
upper secondary, post-secondary non-tertiary and tertiary levels of education.
Graduation rates represent the estimated percentage of an age cohort who are expected to
graduate over their lifetime, and therefore indicate the extent to which education systems
are succeeding in preparing students to meet the labour-market’s minimum requirements
or to access tertiary education. Not all graduates will pursue a tertiary degree or enter the

100 │ 7 - INDICATOR CONCEPTS AND METHODOLOGIES
OECD HANDBOOK FOR INTERNATIONALLY COMPARATIVE EDUCATION STATISTICS 2018 © OECD 2018
labour force immediately, however – see Section 7.10 on young people neither in
employment, nor in education and training (NEETS).
Graduation rates do not capture the quality of education outcomes but may provide a
picture of students’ disengagement leading to them dropping out of the education system,
meaning that they leave school without a qualification.
Calculation
The calculation of graduation rates is based on the age-specific distribution of graduates
(see Chapter 4, Section 4.1.5) in a specific year. Graduation rates can be net or gross.
Net graduation rates represent the expected probability of individuals graduating from
upper secondary or tertiary education over their lifetime if current patterns are
maintained. The calculation uses the sum of the age-specific graduation rates and cross-
section data of the current cohort of graduates by ages.
Net graduation rates:
∑𝐺𝑟𝑎𝑑𝑢𝑎𝑡𝑒𝑠𝐸𝑑𝑢𝑐𝐿𝑒𝑣𝑒𝑙,𝐴𝑔𝑒
𝑃𝑜𝑝𝑢𝑙𝑎𝑡𝑖𝑜𝑛𝐴𝑔𝑒𝐴𝑔𝑒 x 100
Where 𝐺𝑟𝑎𝑑𝑢𝑎𝑡𝑒𝑠𝐸𝑑𝑢𝑐𝐿𝑒𝑣𝑒𝑙,𝐴𝑔𝑒 is the number of graduates at a specific International
Standard Classification of Education (ISCED 2011) level at a specific age and
𝑃𝑜𝑝𝑢𝑙𝑎𝑡𝑖𝑜𝑛𝐴𝑔𝑒 is the size of the population of that specific age.
As an example, for a given country and year, the number of graduates from an education
level is broken down into age groups. The number of 15-year-old graduates is divided by
the total number of 15-year-olds in the country; the number of 16-year-old graduates is
divided by the total number of 16-year-olds in the country, etc. The total graduation rate
is then calculated as the sum of the age-specific graduation rates.
Note that graduate data are only available broken down into single years between the ages
of 11 to 49 years. For adults aged 50 to 64, graduation rates are estimated on the basis of
5-year age bands, and for those aged 65 and over, graduation rates are based on the cohort
size for 65 year-olds and over (UNESCO-UIS / OECD / EUROSTAT, 2017[2]).
Gross graduation rates measure the total number of graduates from the specified
level of education regardless of their age, divided by the population at the typical age of
graduation for that level. The typical age of graduation is the age that covers more than
50% of those graduating at each level of education.
Gross graduation rates:
∑𝐺𝑟𝑎𝑑𝑢𝑎𝑡𝑒𝑠𝐸𝑑𝑢𝑐𝐿𝑒𝑣𝑒𝑙
𝑃𝑜𝑝𝑢𝑙𝑎𝑡𝑖𝑜𝑛𝑇𝑦𝑝𝑖𝑐𝑎𝑙𝐴𝑔𝑒 x 100
Where 𝐺𝑟𝑎𝑑𝑢𝑎𝑡𝑒𝑠𝐸𝑑𝑢𝑐𝐿𝑒𝑣𝑒𝑙 is the total number of graduates in the reference year at a
specific ISCED level and 𝑃𝑜𝑝𝑢𝑙𝑎𝑡𝑖𝑜𝑛𝑇𝑦𝑝𝑖𝑐𝑎𝑙𝐴𝑔𝑒is the number of people at the typical age
of graduation.
In Education at a Glance, net graduation rates are always preferred to gross graduation rates
where data are available. They are calculated for upper secondary, post-secondary non-
tertiary, short-cycle tertiary, bachelor’s or equivalent, master’s or equivalent and doctoral
level education.

7 - INDICATOR CONCEPTS AND METHODOLOGIES │ 101
OECD HANDBOOK FOR INTERNATIONALLY COMPARATIVE EDUCATION STATISTICS 2018 © OECD 2018
First-time graduation rates may also be used in addition to graduation rates. This calculation is
based on the number of first-time graduates (defined in Chapter 4, Section 4.1.5) in a given year.
It has the advantage of eliminating double counting of graduates over time within the same
level, which can otherwise lead to overestimating graduation rates.
Limitations and further considerations
The interpretation of the graduation rate indicator is complex. It is not a measure
of the proportion of graduates in a country at a specific time but a measure of the
probability of someone in the country graduating in the long term, based on
current graduation patterns. Therefore, graduation rates are sensitive to any changes
in education systems, such as the introduction of new programmes or variations in a
programme’s duration, like those seen in many EU countries as a result of the
implementation of the Bologna Process. If the pattern of graduation is seen to be
changing due to temporary education system changes, the interpretation of the
results can be difficult.
Upper secondary graduation rates can be very high – even over 100% – during a
period. This could be due to a large number of people graduating outside the
typical ages (e.g. through second chance programmes), a change in the education
system, such as changes in the duration of some programmes (which strongly
affect graduation rates) or other reasons such as double counting of students (it is
complex to identify first-time graduates without detailed registers). To resolve
this issue, data report first-time graduation rates to general and vocational
programmes as of Education at a Glance 2018.
The analysis of graduation rates can be expanded by determining the profiles of
first-time graduates. Such profiles look at the distribution of graduates by gender,
age group, international status and ISCED level, or by fields of education at upper
secondary and tertiary level.
7.2.2. Completion rates
Policy context
The completion rate describes the percentage of students who graduate from a certain
educational programme a given number of years after they entered, as a share of those
who entered. It is a measure of how efficiently students flow through a level of education
(upper secondary or tertiary).
Calculation
Completion rate:
∑𝐺𝑟𝑎𝑑𝑢𝑎𝑡𝑒𝑠𝐸𝑑𝑢𝑐𝐿𝑒𝑣𝑒𝑙,𝑌𝑒𝑎𝑟
𝑁𝑒𝑤𝐸𝑛𝑡𝑟𝑎𝑛𝑡𝑌𝑒𝑎𝑟−𝑛x100
Where 𝐺𝑟𝑎𝑑𝑢𝑎𝑡𝑒𝑠𝐸𝑑𝑢𝑐𝐿𝑒𝑣𝑒𝑙,𝑌𝑒𝑎𝑟 is the number of graduates from a specific level of
education in a specific year and 𝑁𝑒𝑤𝐸𝑛𝑡𝑟𝑎𝑛𝑡𝑌𝑒𝑎𝑟−𝑛 is the number of new entrants (see the
definition in Chapter 4, Section 4.1.2) at that level of education “n” years previously where
“n” is the number of years of full-time study required to complete the qualification. It can
also be calculated for a longer timeframe of n+2 or n+3 to account for students who had to
repeat a grade or individual courses, or who studied part time and so on.

102 │ 7 - INDICATOR CONCEPTS AND METHODOLOGIES
OECD HANDBOOK FOR INTERNATIONALLY COMPARATIVE EDUCATION STATISTICS 2018 © OECD 2018
Limitations and further considerations
Depending on data availability for the level of education of interest, the
completion rate can be calculated using two different methods. The first method,
true cohort, follows individual students from entry into a programme until a
specified number of years later. Completion is then calculated as the share of
entrants who have graduated in that timeframe. The second method, cross cohort,
is used when individual data are not available. It calculates completion by
dividing the number of graduates in a year by the number of new entrants to that
programme a certain number of years before, when the number of years
corresponds to the theoretical duration of the programme.
Due to the difference in methodologies, caution must be used when comparing
results. For example, consider a programme with a theoretical duration of two
years. Completion rates could be calculated using the graduation cohort in 2014
and an entry cohort two academic years earlier, in 2012/13. For countries using
cross-cohort data, the graduation cohort in 2014 will include the students who
entered in 2012/13 and graduated on time (within two years) but also any others
who entered before 2012/13 and graduated in 2014. As a result, in countries
where a significant share of students takes longer to graduate, cross-cohort
calculations will overestimate completion rates when compared to true-cohort
ones, which have a more limited time frame.
7.3. Educational attainment of the population
7.3.1. Educational attainment of the population
Policy context
Educational attainment is a commonly used proxy for the stock of human capital – that is,
the skills/knowledge available in the population. Qualifications certify and offer information
about the type of knowledge and skills that graduates have acquired in formal education.
Educational attainment provides a profile of the level of educational attainment of the
population as a whole or subsets of it such as the labour force or specific age groups.
Calculation
Educational attainment rate is determined by the distribution of the population or subsets
by the highest level of education attained.
Educational attainment rate:
𝑃𝑜𝑝𝑢𝑙𝑎𝑡𝑖𝑜𝑛𝐴𝑔𝑒,𝐺𝑒𝑛𝑑𝑒𝑟,𝐸𝑑𝑢𝑐𝐿𝑒𝑣𝑒𝑙𝐴𝑡𝑡𝑎𝑖𝑛𝑒𝑑
𝑃𝑜𝑝𝑢𝑙𝑎𝑡𝑖𝑜𝑛𝐴𝑔𝑒,𝐺𝑒𝑛𝑑𝑒𝑟,𝑇𝑜𝑡𝑎𝑙x100
Where 𝑃𝑜𝑝𝑢𝑙𝑎𝑡𝑖𝑜𝑛𝐴𝑔𝑒,𝑔𝑒𝑛𝑑𝑒𝑟,𝐸𝑑𝑢𝑐𝐿𝑒𝑣𝑒𝑙 is the number of people in a particular age and
gender group broken down by highest educational attainment level and
𝑃𝑜𝑝𝑢𝑙𝑎𝑡𝑖𝑜𝑛𝐴𝑔𝑒,𝐺𝑒𝑛𝑑𝑒𝑟,𝑇𝑜𝑡𝑎𝑙 is the total population of the same group. Education at a
Glance typically shows data for all educational levels as described by ISCED 2011.
Similar to graduation rates, attainment rates require the successful completion of a
programme, rather than simply attending that programme. However, educational
attainment differs from graduation in referring only to the highest degree of education an

7 - INDICATOR CONCEPTS AND METHODOLOGIES │ 103
OECD HANDBOOK FOR INTERNATIONALLY COMPARATIVE EDUCATION STATISTICS 2018 © OECD 2018
individual has successfully completed. For educational attainment, only the recognised
successful completion of the highest programme attended is counted.
The source for the data for most countries is that country’s national labour force survey
(LFS).
Limitations and further considerations
People with unknown level of educational attainment are excluded from the
calculation of the indicator.
Trends in educational attainment of the population are important for assessing
expansion of the education system, but are difficult to measure. Changes in the
ISCED classification in 1997 and 2011 have created breaks in the series. Another
way to measure trends in educational attainment is by looking at the educational
attainment across age groups. The difference in the attainment of younger and older
cohorts gives a good estimation of the expansion of the education system across
generations. Example: “A comparison of educational attainment rate among
younger (25-34 year-olds) and older (55-64 year-olds) age groups indicates marked
progress in attaining tertiary education in most countries.” (OECD, 2017[3]).
However, any results from countries reporting high participation in adult learning
should be treated with caution.
7.4. Labour force participation
7.4.1. Labour force participation
Policy context
In recent decades, economies and labour markets have in many countries become
increasingly dependent on a stable supply of well-educated workers to further their
economic development and to maintain their competitiveness. This indicator provides a
perspective on this effect by examining the labour force participation rates of groups with
different levels of education. People with higher-level qualifications are more likely to be
employed, as they are considered better equipped with the skills required in the labour
market. On the other hand, while there is still work for those with lower levels of
education, people with the lowest educational qualifications are at greater risk of being
unemployed.
Calculation
The employment rate for a particular age group, gender and level of educational
attainment is equal to the percentage of people of that same age group, gender and level
of educational attainment who are employed.
The employment rate by level of education:
𝐸𝑚𝑝𝑙𝑜𝑦𝑒𝑑𝐴𝑔𝑒,𝐺𝑒𝑛𝑑𝑒𝑟,𝐸𝑑𝑢𝑐𝐿𝑒𝑣𝑒𝑙
𝑃𝑜𝑝𝑢𝑙𝑎𝑡𝑖𝑜𝑛𝐴𝑔𝑒,𝐺𝑒𝑛𝑑𝑒𝑟,𝐸𝑑𝑢𝑐𝐿𝑒𝑣𝑒𝑙x100
Where 𝐸𝑚𝑝𝑙𝑜𝑦𝑒𝑑𝐴𝑔𝑒,𝐺𝑒𝑛𝑑𝑒𝑟,𝐸𝑑𝑢𝑐𝐿𝑒𝑣𝑒𝑙 is the number of people employed within a specified
age group and gender who have attained a certain education/ISCED level. Employed
individuals are those who, during the survey reference week: 1) have worked for pay
(employees) or profit (self-employed and unpaid family workers) for at least one hour; or
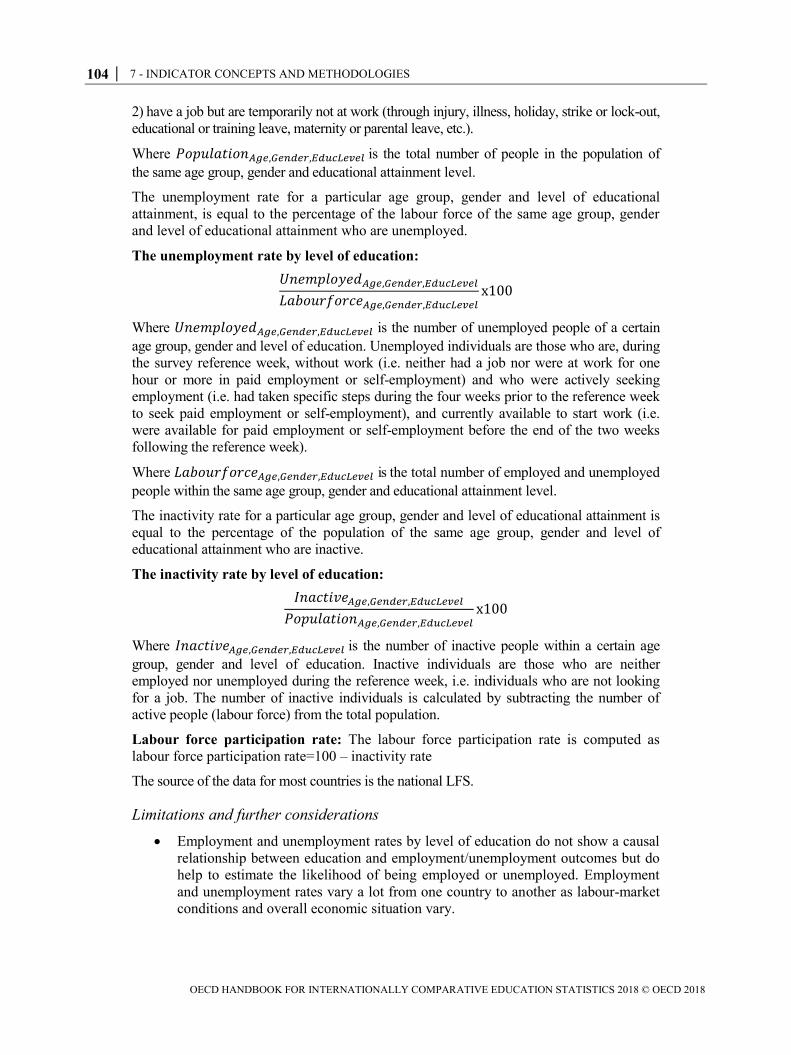
104 │ 7 - INDICATOR CONCEPTS AND METHODOLOGIES
OECD HANDBOOK FOR INTERNATIONALLY COMPARATIVE EDUCATION STATISTICS 2018 © OECD 2018
2) have a job but are temporarily not at work (through injury, illness, holiday, strike or lock-out,
educational or training leave, maternity or parental leave, etc.).
Where 𝑃𝑜𝑝𝑢𝑙𝑎𝑡𝑖𝑜𝑛𝐴𝑔𝑒,𝐺𝑒𝑛𝑑𝑒𝑟,𝐸𝑑𝑢𝑐𝐿𝑒𝑣𝑒𝑙 is the total number of people in the population of
the same age group, gender and educational attainment level.
The unemployment rate for a particular age group, gender and level of educational
attainment, is equal to the percentage of the labour force of the same age group, gender
and level of educational attainment who are unemployed.
The unemployment rate by level of education:
𝑈𝑛𝑒𝑚𝑝𝑙𝑜𝑦𝑒𝑑𝐴𝑔𝑒,𝐺𝑒𝑛𝑑𝑒𝑟,𝐸𝑑𝑢𝑐𝐿𝑒𝑣𝑒𝑙
𝐿𝑎𝑏𝑜𝑢𝑟𝑓𝑜𝑟𝑐𝑒𝐴𝑔𝑒,𝐺𝑒𝑛𝑑𝑒𝑟,𝐸𝑑𝑢𝑐𝐿𝑒𝑣𝑒𝑙x100
Where 𝑈𝑛𝑒𝑚𝑝𝑙𝑜𝑦𝑒𝑑𝐴𝑔𝑒,𝐺𝑒𝑛𝑑𝑒𝑟,𝐸𝑑𝑢𝑐𝐿𝑒𝑣𝑒𝑙 is the number of unemployed people of a certain
age group, gender and level of education. Unemployed individuals are those who are, during
the survey reference week, without work (i.e. neither had a job nor were at work for one
hour or more in paid employment or self-employment) and who were actively seeking
employment (i.e. had taken specific steps during the four weeks prior to the reference week
to seek paid employment or self-employment), and currently available to start work (i.e.
were available for paid employment or self-employment before the end of the two weeks
following the reference week).
Where 𝐿𝑎𝑏𝑜𝑢𝑟𝑓𝑜𝑟𝑐𝑒𝐴𝑔𝑒,𝐺𝑒𝑛𝑑𝑒𝑟,𝐸𝑑𝑢𝑐𝐿𝑒𝑣𝑒𝑙 is the total number of employed and unemployed
people within the same age group, gender and educational attainment level.
The inactivity rate for a particular age group, gender and level of educational attainment is
equal to the percentage of the population of the same age group, gender and level of
educational attainment who are inactive.
The inactivity rate by level of education:
𝐼𝑛𝑎𝑐𝑡𝑖𝑣𝑒𝐴𝑔𝑒,𝐺𝑒𝑛𝑑𝑒𝑟,𝐸𝑑𝑢𝑐𝐿𝑒𝑣𝑒𝑙
𝑃𝑜𝑝𝑢𝑙𝑎𝑡𝑖𝑜𝑛𝐴𝑔𝑒,𝐺𝑒𝑛𝑑𝑒𝑟,𝐸𝑑𝑢𝑐𝐿𝑒𝑣𝑒𝑙x100
Where 𝐼𝑛𝑎𝑐𝑡𝑖𝑣𝑒𝐴𝑔𝑒,𝐺𝑒𝑛𝑑𝑒𝑟,𝐸𝑑𝑢𝑐𝐿𝑒𝑣𝑒𝑙 is the number of inactive people within a certain age
group, gender and level of education. Inactive individuals are those who are neither
employed nor unemployed during the reference week, i.e. individuals who are not looking
for a job. The number of inactive individuals is calculated by subtracting the number of
active people (labour force) from the total population.
Labour force participation rate: The labour force participation rate is computed as
labour force participation rate=100 – inactivity rate
The source of the data for most countries is the national LFS.
Limitations and further considerations
Employment and unemployment rates by level of education do not show a causal
relationship between education and employment/unemployment outcomes but do
help to estimate the likelihood of being employed or unemployed. Employment
and unemployment rates vary a lot from one country to another as labour-market
conditions and overall economic situation vary.
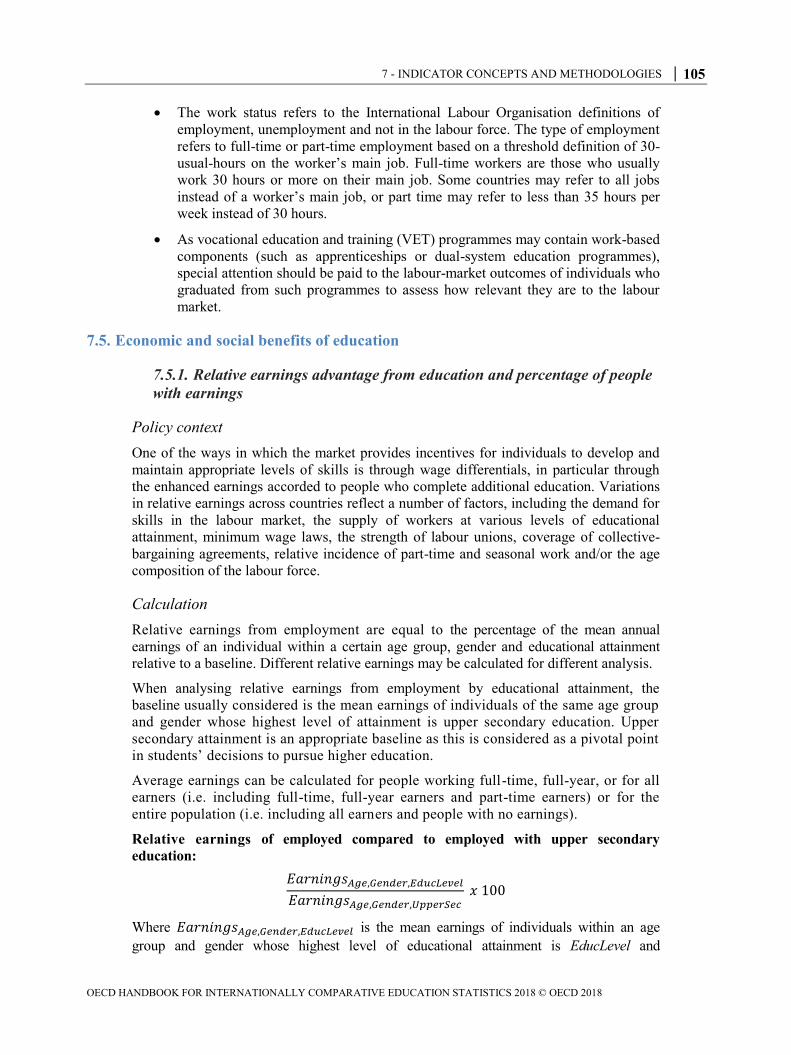
7 - INDICATOR CONCEPTS AND METHODOLOGIES │ 105
OECD HANDBOOK FOR INTERNATIONALLY COMPARATIVE EDUCATION STATISTICS 2018 © OECD 2018
The work status refers to the International Labour Organisation definitions of
employment, unemployment and not in the labour force. The type of employment
refers to full-time or part-time employment based on a threshold definition of 30-
usual-hours on the worker’s main job. Full-time workers are those who usually
work 30 hours or more on their main job. Some countries may refer to all jobs
instead of a worker’s main job, or part time may refer to less than 35 hours per
week instead of 30 hours.
As vocational education and training (VET) programmes may contain work-based
components (such as apprenticeships or dual-system education programmes),
special attention should be paid to the labour-market outcomes of individuals who
graduated from such programmes to assess how relevant they are to the labour
market.
7.5. Economic and social benefits of education
7.5.1. Relative earnings advantage from education and percentage of people
with earnings
Policy context
One of the ways in which the market provides incentives for individuals to develop and
maintain appropriate levels of skills is through wage differentials, in particular through
the enhanced earnings accorded to people who complete additional education. Variations
in relative earnings across countries reflect a number of factors, including the demand for
skills in the labour market, the supply of workers at various levels of educational
attainment, minimum wage laws, the strength of labour unions, coverage of collective-
bargaining agreements, relative incidence of part-time and seasonal work and/or the age
composition of the labour force.
Calculation
Relative earnings from employment are equal to the percentage of the mean annual
earnings of an individual within a certain age group, gender and educational attainment
relative to a baseline. Different relative earnings may be calculated for different analysis.
When analysing relative earnings from employment by educational attainment, the
baseline usually considered is the mean earnings of individuals of the same age group
and gender whose highest level of attainment is upper secondary education. Upper
secondary attainment is an appropriate baseline as this is considered as a pivotal point
in students’ decisions to pursue higher education.
Average earnings can be calculated for people working full-time, full-year, or for all
earners (i.e. including full-time, full-year earners and part-time earners) or for the
entire population (i.e. including all earners and people with no earnings).
Relative earnings of employed compared to employed with upper secondary
education:
𝐸𝑎𝑟𝑛𝑖𝑛𝑔𝑠𝐴𝑔𝑒,𝐺𝑒𝑛𝑑𝑒𝑟,𝐸𝑑𝑢𝑐𝐿𝑒𝑣𝑒𝑙
𝐸𝑎𝑟𝑛𝑖𝑛𝑔𝑠𝐴𝑔𝑒,𝐺𝑒𝑛𝑑𝑒𝑟,𝑈𝑝𝑝𝑒𝑟𝑆𝑒𝑐 𝑥 100
Where 𝐸𝑎𝑟𝑛𝑖𝑛𝑔𝑠𝐴𝑔𝑒,𝐺𝑒𝑛𝑑𝑒𝑟,𝐸𝑑𝑢𝑐𝐿𝑒𝑣𝑒𝑙 is the mean earnings of individuals within an age
group and gender whose highest level of educational attainment is EducLevel and

106 │ 7 - INDICATOR CONCEPTS AND METHODOLOGIES
OECD HANDBOOK FOR INTERNATIONALLY COMPARATIVE EDUCATION STATISTICS 2018 © OECD 2018
𝐸𝑎𝑟𝑛𝑖𝑛𝑔𝑠𝐴𝑔𝑒,𝐺𝑒𝑛𝑑𝑒𝑟,𝑈𝑝𝑝𝑒𝑟𝑆𝑒𝑐 is the mean earnings of individuals of the same age group and
gender whose highest level of attainment is upper secondary.
It is also appropriate to analyse the relative earnings by gender for a given age group and
educational attainment. In this case, the baseline considered is the mean annual earnings
of men with the same age group and level of educational attainment.
Women’s earnings relative to men:
𝐸𝑎𝑟𝑛𝑖𝑛𝑔𝑠𝐴𝑔𝑒,𝐸𝑑𝑢𝑐𝐿𝑒𝑣𝑒𝑙,𝑊𝑜𝑚𝑒𝑛
𝐸𝑎𝑟𝑛𝑖𝑛𝑔𝑠𝐴𝑔𝑒,𝐸𝑑𝑢𝑐𝑙𝑒𝑣𝑒𝑙,𝑀𝑒𝑛 𝑥 100
Where 𝐸𝑎𝑟𝑛𝑖𝑛𝑔𝑠𝐴𝑔𝑒,𝐸𝑑𝑢𝑐𝐿𝑒𝑣𝑒𝑙,𝑊𝑜𝑚𝑒𝑛 is the annual mean earnings of women of a particular
age group and highest educational attainment level and 𝐸𝑎𝑟𝑛𝑖𝑛𝑔𝑠𝐴𝑔𝑒,𝐸𝑑𝑢𝑐𝑙𝑒𝑣𝑒𝑙,𝑀𝑒𝑛 is the
annual mean earnings of men of the same age group and level of educational attainment.
Level of earnings relative to median earnings:
The level of earnings relative to median earnings is defined as the ratio of the number of
people with earnings within an earnings level relative to the median, and all people who
have earnings from employment.
The distribution is calculated for all earners (i.e. including full-time, full-year earners and
part-time earners).
Percentage of people with earnings:
𝑃𝑜𝑝𝑢𝑙𝑎𝑡𝑖𝑜𝑛 𝐸𝑎𝑟𝑛𝑖𝑛𝑔𝐿𝑒𝑣𝑒𝑙
𝑃𝑜𝑝𝑢𝑙𝑎𝑡𝑖𝑜𝑛𝐸𝑎𝑟𝑛𝑖𝑛𝑔𝑠x 100
Where 𝑃𝑜𝑝𝑢𝑙𝑎𝑡𝑖𝑜𝑛𝐸𝑎𝑟𝑛𝑖𝑛𝑔𝐿𝑒𝑣𝑒𝑙 is the number of individuals broken down into the
following earning levels: 1) less than or half of the median; 2) more than half the median and
less than or equal to the median; 3) more than the median and less than or equal to 1.5 times
the median; 4) more than 1.5 times the median and less than or equal to twice the median;
and 5) more than twice the median.
Where 𝑃𝑜𝑝𝑢𝑙𝑎𝑡𝑖𝑜𝑛𝐸𝑎𝑟𝑛𝑖𝑛𝑔𝑠 is the number of individuals with earnings.
In some cases, the relative earnings of students and non-students are computed. This is
defined as the mean annual earnings of students divided by the mean earnings of non-
students.
Relative earnings of students compared to non-students:
𝐸𝑎𝑟𝑛𝑖𝑛𝑔𝑠𝑆𝑡𝑢𝑑𝑒𝑛𝑡𝑠
𝐸𝑎𝑟𝑛𝑖𝑛𝑔𝑠𝑁𝑜𝑛−𝑠𝑡𝑢𝑑𝑒𝑛𝑡𝑠x 100
Where 𝐸𝑎𝑟𝑛𝑖𝑛𝑔𝑠𝑠𝑡𝑢𝑑𝑒𝑛𝑡𝑠 is the annual mean earnings of students and
𝐸𝑎𝑟𝑛𝑖𝑛𝑔𝑠𝑁𝑜𝑛−𝑠𝑡𝑢𝑑𝑒𝑛𝑡𝑠 is the annual mean earnings of non-students.
Limitations and further considerations
The presentation of relative earnings improves the comparability of data across
countries, by avoiding the need to convert earnings into a single monetary unit.
While earnings data should be based on annual, full-year earnings, before tax and
excluding earnings from self-employment, this is not the case for all countries and
therefore results should be interpreted with caution. For example, in countries
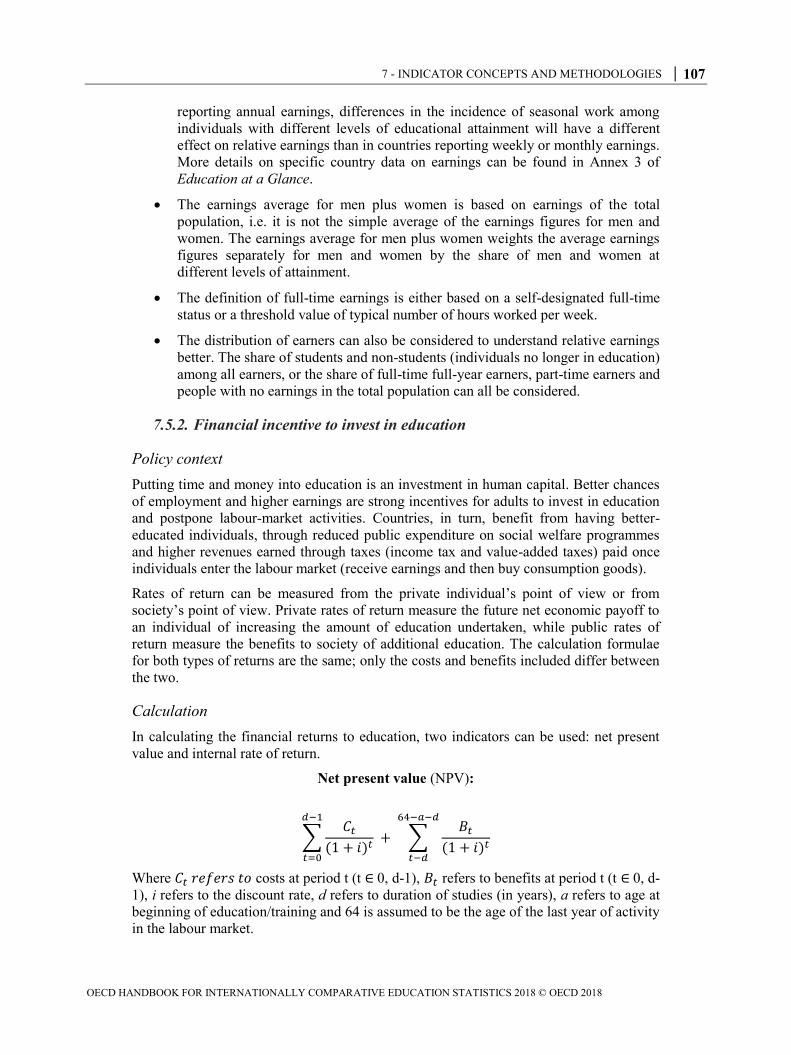
7 - INDICATOR CONCEPTS AND METHODOLOGIES │ 107
OECD HANDBOOK FOR INTERNATIONALLY COMPARATIVE EDUCATION STATISTICS 2018 © OECD 2018
reporting annual earnings, differences in the incidence of seasonal work among
individuals with different levels of educational attainment will have a different
effect on relative earnings than in countries reporting weekly or monthly earnings.
More details on specific country data on earnings can be found in Annex 3 of
Education at a Glance.
The earnings average for men plus women is based on earnings of the total
population, i.e. it is not the simple average of the earnings figures for men and
women. The earnings average for men plus women weights the average earnings
figures separately for men and women by the share of men and women at
different levels of attainment.
The definition of full-time earnings is either based on a self-designated full-time
status or a threshold value of typical number of hours worked per week.
The distribution of earners can also be considered to understand relative earnings
better. The share of students and non-students (individuals no longer in education)
among all earners, or the share of full-time full-year earners, part-time earners and
people with no earnings in the total population can all be considered.
7.5.2. Financial incentive to invest in education
Policy context
Putting time and money into education is an investment in human capital. Better chances
of employment and higher earnings are strong incentives for adults to invest in education
and postpone labour-market activities. Countries, in turn, benefit from having better-
educated individuals, through reduced public expenditure on social welfare programmes
and higher revenues earned through taxes (income tax and value-added taxes) paid once
individuals enter the labour market (receive earnings and then buy consumption goods).
Rates of return can be measured from the private individual’s point of view or from
society’s point of view. Private rates of return measure the future net economic payoff to
an individual of increasing the amount of education undertaken, while public rates of
return measure the benefits to society of additional education. The calculation formulae
for both types of returns are the same; only the costs and benefits included differ between
the two.
Calculation
In calculating the financial returns to education, two indicators can be used: net present
value and internal rate of return.
Net present value (NPV):
∑𝐶𝑡
(1 + 𝑖)𝑡
𝑑−1
𝑡=0
+ ∑𝐵𝑡
(1 + 𝑖)𝑡
64−𝑎−𝑑
𝑡−𝑑
Where 𝐶𝑡 𝑟𝑒𝑓𝑒𝑟𝑠 𝑡𝑜 costs at period t (t ∈ 0, d-1), 𝐵𝑡 refers to benefits at period t (t ∈ 0, d-
1), i refers to the discount rate, d refers to duration of studies (in years), a refers to age at
beginning of education/training and 64 is assumed to be the age of the last year of activity
in the labour market.

108 │ 7 - INDICATOR CONCEPTS AND METHODOLOGIES
OECD HANDBOOK FOR INTERNATIONALLY COMPARATIVE EDUCATION STATISTICS 2018 © OECD 2018
The net present value (NPV) expresses in present value terms cash transfers happening at
different times, to allow direct comparisons of costs and benefits. In this framework, costs
and benefits during a working-age life are transferred back to the start of the investment.
This is done by discounting all cash flows back to the beginning of the investment using a
fixed interest rate known as the discount rate that makes possible to compare costs or
benefits (cash flows) over time. All the values presented in the tables in this indicator are
in net present value equivalent, converted to USD using purchasing power parities (PPP).
The PPP controls for different costs of living and price levels between countries, by
equalising the purchasing power of different countries’ currencies for a market “basket of
goods”.
The internal rate of return (IRR) is the discount rate i at which NPV=0.
The IRR looks at the issue of the financial returns to education from a different angle.
The IRR is the discount rate at which the net present values of all cash flows is equal to
the initial investment, or in other words, the rate at which the investment breaks even.
Translated to education, the IRR can be interpreted as the interest rate an individual can
expect to receive every year during their working life on the investment made on higher
education. In project evaluation, a project is approved if the IRR is greater than the
prevailing interest rate or the return from an alternative investment. The higher the IRR,
the more attractive it is to pursue higher education.
The financial returns on investment in education are calculated from the age of entry
into further education to a theoretical age of retirement, assumed to be 64. It considers
two periods: 1) time spent in education during which the private individual and the
government are paying the cost of education; and 2) time spent in the labour market
during which the individual and the government are receiving the additional payments
associated with further education.
These two indicators incorporate costs and benefits which need to be carefully
determined.
The costs
Investing in a higher level of education has both direct and indirect costs. Direct costs are
the upfront expenditure paid during the years of additional studies. Indirect costs for
private individuals are the foregone earnings that they would have received if they had
decided to work instead of pursuing an additional degree of education. Similarly, indirect
costs for the public sector are the foregone tax revenues not received because individuals
chose to pursue further education instead of entering the labour market:
private costs = direct costs + foregone earnings
public costs = direct costs + foregone tax revenues
The direct costs of education include all expenditures on education for all levels of
government combined (public direct costs) and all education-related household
expenditure (private direct costs).
Private direct costs are net of loans and grants, and public loans are not included in public
direct costs. Excluding loans from public costs may lead to public costs being
underestimated for some countries, particularly at the tertiary level. In cases where loans
and grants cover more than the private direct costs, the private direct costs are set to zero.
Foregone earnings (FE) and foregone tax receipts (FT) are both indirect costs. Foregone
earnings or taxes are the earnings/tax receipts lost during the years spent in education
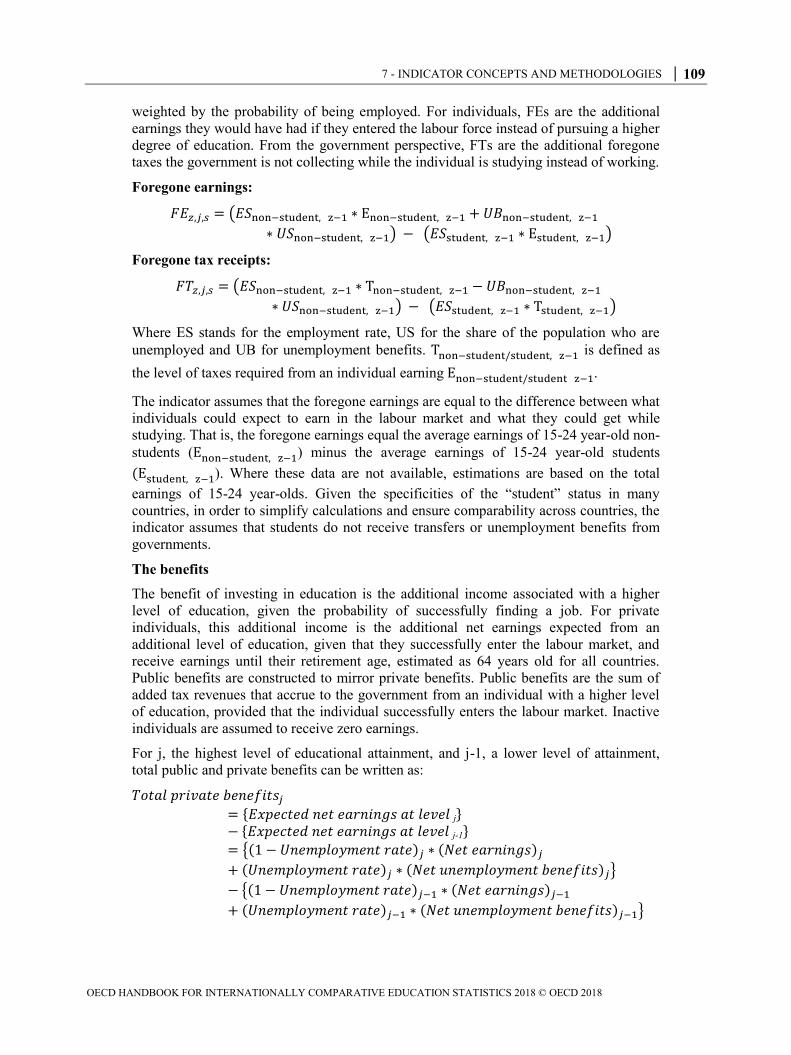
7 - INDICATOR CONCEPTS AND METHODOLOGIES │ 109
OECD HANDBOOK FOR INTERNATIONALLY COMPARATIVE EDUCATION STATISTICS 2018 © OECD 2018
weighted by the probability of being employed. For individuals, FEs are the additional
earnings they would have had if they entered the labour force instead of pursuing a higher
degree of education. From the government perspective, FTs are the additional foregone
taxes the government is not collecting while the individual is studying instead of working.
Foregone earnings:
𝐹𝐸𝑧,𝑗,𝑠 = (𝐸𝑆non−student, z−1 ∗ Enon−student, z−1 + 𝑈𝐵non−student, z−1
∗ 𝑈𝑆non−student, z−1) − (𝐸𝑆student, z−1 ∗ Estudent, z−1)
Foregone tax receipts:
𝐹𝑇𝑧,𝑗,𝑠 = (𝐸𝑆non−student, z−1 ∗ Tnon−student, z−1 − 𝑈𝐵non−student, z−1
∗ 𝑈𝑆non−student, z−1) − (𝐸𝑆student, z−1 ∗ Tstudent, z−1)
Where ES stands for the employment rate, US for the share of the population who are
unemployed and UB for unemployment benefits. Tnon−student/student, z−1 is defined as
the level of taxes required from an individual earning Enon−student/student z−1.
The indicator assumes that the foregone earnings are equal to the difference between what
individuals could expect to earn in the labour market and what they could get while
studying. That is, the foregone earnings equal the average earnings of 15-24 year-old non-
students (Enon−student, z−1) minus the average earnings of 15-24 year-old students
(Estudent, z−1). Where these data are not available, estimations are based on the total
earnings of 15-24 year-olds. Given the specificities of the “student” status in many
countries, in order to simplify calculations and ensure comparability across countries, the
indicator assumes that students do not receive transfers or unemployment benefits from
governments.
The benefits
The benefit of investing in education is the additional income associated with a higher
level of education, given the probability of successfully finding a job. For private
individuals, this additional income is the additional net earnings expected from an
additional level of education, given that they successfully enter the labour market, and
receive earnings until their retirement age, estimated as 64 years old for all countries.
Public benefits are constructed to mirror private benefits. Public benefits are the sum of
added tax revenues that accrue to the government from an individual with a higher level
of education, provided that the individual successfully enters the labour market. Inactive
individuals are assumed to receive zero earnings.
For j, the highest level of educational attainment, and j-1, a lower level of attainment,
total public and private benefits can be written as:
𝑇𝑜𝑡𝑎𝑙 𝑝𝑟𝑖𝑣𝑎𝑡𝑒 𝑏𝑒𝑛𝑒𝑓𝑖𝑡𝑠𝑗
= {𝐸𝑥𝑝𝑒𝑐𝑡𝑒𝑑 𝑛𝑒𝑡 𝑒𝑎𝑟𝑛𝑖𝑛𝑔𝑠 𝑎𝑡 𝑙𝑒𝑣𝑒𝑙 j}− {𝐸𝑥𝑝𝑒𝑐𝑡𝑒𝑑 𝑛𝑒𝑡 𝑒𝑎𝑟𝑛𝑖𝑛𝑔𝑠 𝑎𝑡 𝑙𝑒𝑣𝑒𝑙 j-1}
= {(1 − 𝑈𝑛𝑒𝑚𝑝𝑙𝑜𝑦𝑚𝑒𝑛𝑡 𝑟𝑎𝑡𝑒)𝑗 ∗ (𝑁𝑒𝑡 𝑒𝑎𝑟𝑛𝑖𝑛𝑔𝑠)𝑗
+ (𝑈𝑛𝑒𝑚𝑝𝑙𝑜𝑦𝑚𝑒𝑛𝑡 𝑟𝑎𝑡𝑒)𝑗 ∗ (𝑁𝑒𝑡 𝑢𝑛𝑒𝑚𝑝𝑙𝑜𝑦𝑚𝑒𝑛𝑡 𝑏𝑒𝑛𝑒𝑓𝑖𝑡𝑠)𝑗}
− {(1 − 𝑈𝑛𝑒𝑚𝑝𝑙𝑜𝑦𝑚𝑒𝑛𝑡 𝑟𝑎𝑡𝑒)𝑗−1 ∗ (𝑁𝑒𝑡 𝑒𝑎𝑟𝑛𝑖𝑛𝑔𝑠)𝑗−1
+ (𝑈𝑛𝑒𝑚𝑝𝑙𝑜𝑦𝑚𝑒𝑛𝑡 𝑟𝑎𝑡𝑒)𝑗−1 ∗ (𝑁𝑒𝑡 𝑢𝑛𝑒𝑚𝑝𝑙𝑜𝑦𝑚𝑒𝑛𝑡 𝑏𝑒𝑛𝑒𝑓𝑖𝑡𝑠)𝑗−1}

110 │ 7 - INDICATOR CONCEPTS AND METHODOLOGIES
OECD HANDBOOK FOR INTERNATIONALLY COMPARATIVE EDUCATION STATISTICS 2018 © OECD 2018
𝑇𝑜𝑡𝑎𝑙 𝑝𝑢𝑏𝑙𝑖𝑐 𝑏𝑒𝑛𝑒𝑓𝑖𝑡𝑠𝑗
= {𝐸𝑥𝑝𝑒𝑐𝑡𝑒𝑑 𝑡𝑎𝑥 𝑟𝑒𝑐𝑒𝑖𝑝𝑡𝑠 𝑎𝑡 𝑙𝑒𝑣𝑒𝑙 j}− {𝐸𝑥𝑝𝑒𝑐𝑡𝑒𝑑 𝑡𝑎𝑥 𝑟𝑒𝑐𝑒𝑖𝑝𝑡𝑠 𝑎𝑡 𝑙𝑒𝑣𝑒𝑙 j-1}
= {(1 − 𝑈𝑛𝑒𝑚𝑝𝑙𝑜𝑦𝑚𝑒𝑛𝑡 𝑟𝑎𝑡𝑒)𝑗 ∗ (𝑡𝑎𝑥 𝑟𝑒𝑐𝑒𝑖𝑝𝑡)𝑗
− (𝑈𝑛𝑒𝑚𝑝𝑙𝑜𝑦𝑚𝑒𝑛𝑡 𝑟𝑎𝑡𝑒)𝑗 ∗ (𝑁𝑒𝑡 𝑢𝑛𝑒𝑚𝑝𝑙𝑜𝑦𝑚𝑒𝑛𝑡 𝑏𝑒𝑛𝑒𝑓𝑖𝑡𝑠)𝑗}
− {(1 − 𝑢𝑛𝑒𝑚𝑝𝑙𝑜𝑦𝑚𝑒𝑛𝑡 𝑟𝑎𝑡𝑒)𝑗−1 ∗ (𝑡𝑎𝑥 𝑟𝑒𝑐𝑒𝑖𝑝𝑡)𝑗−1
− (𝑈𝑛𝑒𝑚𝑝𝑙𝑜𝑦𝑚𝑒𝑛𝑡 𝑟𝑎𝑡𝑒)𝑗−1 ∗ (𝑁𝑒𝑡 𝑢𝑛𝑒𝑚𝑝𝑙𝑜𝑦𝑚𝑒𝑛𝑡 𝑏𝑒𝑛𝑒𝑓𝑖𝑡𝑠)𝑗−1}
Decomposition of earnings and tax receipt effects: this indicator presents the
decomposition of earnings and tax revenue effects, based on additional income associated
with a higher level of attainment.
Gross earnings benefits are the discounted sum of earnings premiums over the
course of a working-age life associated with a higher level of education, provided
that the individual successfully enters the labour market. In order to increase the
stability of the indicator, data on earnings use a moving average combining three
years of earnings.
The income tax effect is the discounted sum of the additional amount of income
tax paid by the individual and received by the government for a higher level of
education. Income tax data are computed using the OECD Taxing Wages model (
(OECD, 2015[4])), which determines the level of taxes based on a given level of
income. This model computes the level of the tax wedge on income for several
household composition scenarios. This indicator uses a single worker with no
children.
The social contribution effect is the discounted sum of the additional amount of
employee social contributions paid by the individual and received by the
government for a higher level of attainment. Employee social contributions are
computed using the OECD Taxing Wages model’s scenario of a single worker
with no children, aged 40.
The social transfers effect is the discounted sum of the additional amount of social
transfers paid to individuals by the government for a higher level of attainment.
Social transfers correspond to the sum of social assistance and housing benefits
paid by the government to individuals. Social transfers are computed using the
OECD Tax-Benefit model ( (OECD, 2015[4])), under the assumption of a single
worker with no children, aged 40.
The unemployment benefit effect is the discounted sum of additional
unemployment benefits associated with a higher education level over the course
of a working-age life and received during periods of unemployment, taking into
account the probability of being unemployed for the different levels of
educational attainment.. Unemployment benefits are computed using the OECD
Tax-Benefit model, under the assumption of a single worker with no children,
aged 40. Individuals are considered to be eligible for full unemployment benefits
during unemployment.
Limitations and further considerations
Data reported are accounting-based values only. The results will probably differ
from econometric estimates using the same data at the micro level (i.e. data from
7 - INDICATOR CONCEPTS AND METHODOLOGIES │ 111
OECD HANDBOOK FOR INTERNATIONALLY COMPARATIVE EDUCATION STATISTICS 2018 © OECD 2018
household or individual surveys) rather than a stream of earnings derived from
average earnings during a working-age life.
The approach used estimates future earnings for adults with different levels of
education, based on knowledge of how average present gross earnings vary by
level of attainment and age. However, the relationship between different levels of
educational attainment and earnings may change in the future, as technological,
economic and social changes may all alter how wage levels relate to education
levels.
The approach takes into account the effect of education on the likelihood of
finding employment. However, this also makes the estimate sensitive to the stage
in the economic cycle at which the data are collected. Given that more highly
educated adults typically have better labour-market outcomes, the value of
education generally increases in times of slow economic growth.
The theoretical retirement age of 64 has been used to calculate returns over the
lifetime. However, the age of eligibility for pensions varies widely between
countries. A few years more or less in the labour market can make a substantial
difference in the returns to education for an individual and the public.
The model only considers the taxes and benefits directly linked to the earnings
level of an individual, disregarding other taxes that may indirectly be incurred
from activities individuals may engage in as a result of their higher income. For
instance, as earnings generally increase with educational attainment, individuals
with higher levels of education typically consume more goods and services, and
thus pay additional value-added tax (VAT) on their consumption. This indicator
thus underestimates the public returns.
Individuals with higher earnings also tend to pay more into their pensions and so,
after leaving the labour force, will have a further income advantage that the
indicator does not take into account. In addition, in countries where a substantial
part of the pension system is financed by employers through employer
contributions added to salaries, the returns to higher education are typically
underestimated compared to countries where pensions are paid for by the
individual.
Many governments have programmes that provide loans to students at low
interest rates which provide a strong incentive for individuals to pursue their
studies and reduce the costs of attaining higher education. Yet, as loans have to be
repaid later, they also reduce the financial benefits of education. While currently
not included in the calculation, these subsidies can often make a substantial
difference to the public and private returns to education.
Other factors not reflected in this indicator affect the returns to education. For
instance, the financial returns may be affected by the field of study and by
country-specific economic situations, labour-market contexts and institutional
settings, as well as by social and cultural factors. Furthermore, returns to
education are not limited to financial returns but also include other economic
outcomes, such as increased productivity that boosts economic growth, and social
outcomes, such as better health and well-being and higher social participation.
The discount rate reflects the time-value of money and makes it possible to
compare costs or payments (cash flows) over time. The discount rate can be
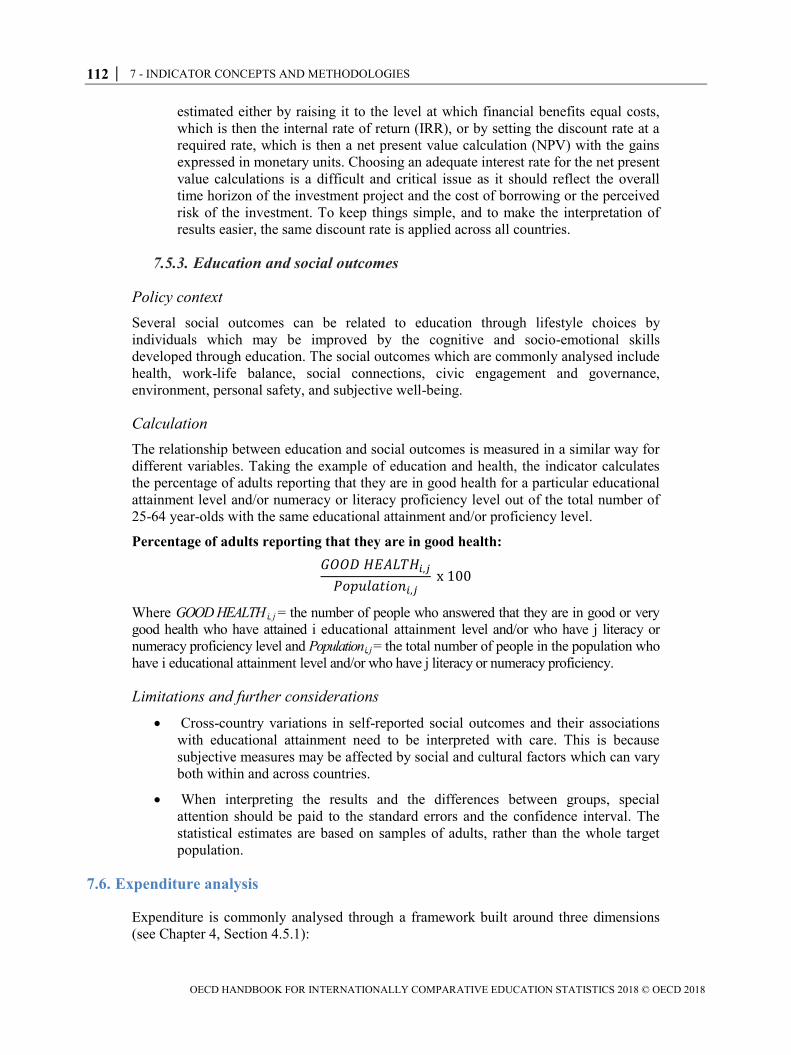
112 │ 7 - INDICATOR CONCEPTS AND METHODOLOGIES
OECD HANDBOOK FOR INTERNATIONALLY COMPARATIVE EDUCATION STATISTICS 2018 © OECD 2018
estimated either by raising it to the level at which financial benefits equal costs,
which is then the internal rate of return (IRR), or by setting the discount rate at a
required rate, which is then a net present value calculation (NPV) with the gains
expressed in monetary units. Choosing an adequate interest rate for the net present
value calculations is a difficult and critical issue as it should reflect the overall
time horizon of the investment project and the cost of borrowing or the perceived
risk of the investment. To keep things simple, and to make the interpretation of
results easier, the same discount rate is applied across all countries.
7.5.3. Education and social outcomes
Policy context
Several social outcomes can be related to education through lifestyle choices by
individuals which may be improved by the cognitive and socio-emotional skills
developed through education. The social outcomes which are commonly analysed include
health, work-life balance, social connections, civic engagement and governance,
environment, personal safety, and subjective well-being.
Calculation
The relationship between education and social outcomes is measured in a similar way for
different variables. Taking the example of education and health, the indicator calculates
the percentage of adults reporting that they are in good health for a particular educational
attainment level and/or numeracy or literacy proficiency level out of the total number of
25-64 year-olds with the same educational attainment and/or proficiency level.
Percentage of adults reporting that they are in good health:
𝐺𝑂𝑂𝐷 𝐻𝐸𝐴𝐿𝑇𝐻𝑖,𝑗
𝑃𝑜𝑝𝑢𝑙𝑎𝑡𝑖𝑜𝑛𝑖,𝑗 x 100
Where GOOD HEALTH i,, j = the number of people who answered that they are in good or very
good health who have attained i educational attainment level and/or who have j literacy or
numeracy proficiency level and Population i,, j = the total number of people in the population who
have i educational attainment level and/or who have j literacy or numeracy proficiency.
Limitations and further considerations
Cross-country variations in self-reported social outcomes and their associations
with educational attainment need to be interpreted with care. This is because
subjective measures may be affected by social and cultural factors which can vary
both within and across countries.
When interpreting the results and the differences between groups, special
attention should be paid to the standard errors and the confidence interval. The
statistical estimates are based on samples of adults, rather than the whole target
population.
7.6. Expenditure analysis
Expenditure is commonly analysed through a framework built around three dimensions
(see Chapter 4, Section 4.5.1):
7 - INDICATOR CONCEPTS AND METHODOLOGIES │ 113
OECD HANDBOOK FOR INTERNATIONALLY COMPARATIVE EDUCATION STATISTICS 2018 © OECD 2018
the type of goods and services provided or purchased (core and peripheral)
the service provider (educational or other organisations, such as bus companies)
the source of funds financing the provision or purchase of these goods and
services (public or private sources).
In addition, there are four different types of expenditure:
direct public, private and international expenditure on educational institutions
private expenditure on educational goods and services purchased outside
educational institutions
subsidies to students from government and other private entities
transfers and payments to other private entities.
Depending on the indicator being calculated, the type of expenditure, the nature of the
goods and services purchased, the type of service provider and the source of funds
considered may vary, as the following sections lay out in more detail.
7.6.1. Expenditure on educational institutions per student
Policy context
Effective learning requires the right combination of trained and talented personnel,
adequate facilities, state-of-the-art equipment and motivated students ready to learn.
Policy makers must balance the importance of improving the quality of education
services with the desirability of expanding access to education opportunities.
It is difficult to assess the optimal resources needed to ensure optimal returns for either
the individual or society as a whole. However, international comparisons of expenditure
on educational institutions per student can provide a starting point for discussion on the
extent of countries’ investment in education in order to assess the effectiveness of
different models of educational provision. It indicates the adequacy or efficiency of
education funding relative to the system key unit: the student.
Calculation
This indicator calculates the total expenditure on educational institutions in relation to the
number of full-time equivalent students enrolled in these institutions. It includes
expenditure on staff compensation, and expenditure designated for capital investment,
ancillary services and research and development (R&D), from public, private, and
international sources (Figure 7.1). It excludes expenditure on servicing debts (i.e.
payments of interests on the amounts borrowed for educational purposes and
repayments of the principal) and tuition fees paid by households to regional or local
government rather than directly to educational institutions (UNESCO-UIS / OECD /
EUROSTAT, 2017[2]).

114 │ 7 - INDICATOR CONCEPTS AND METHODOLOGIES
OECD HANDBOOK FOR INTERNATIONALLY COMPARATIVE EDUCATION STATISTICS 2018 © OECD 2018
Figure 7.1. Sources of funds considered in the calculation of public, private and international
expenditure on educational institutions

7 - INDICATOR CONCEPTS AND METHODOLOGIES │ 115
OECD HANDBOOK FOR INTERNATIONALLY COMPARATIVE EDUCATION STATISTICS 2018 © OECD 2018
Expenditure on educational institutions per student at a particular level of education for
all education levels except for early childhood education and care (ISCED 0):
𝐸𝐷𝑈_𝐸𝑋𝑃𝐸𝑁𝐷𝐼𝑇𝑈𝑅𝐸𝑦𝑒𝑎𝑟_𝑥 / 𝑃𝑃𝑃 𝑦𝑒𝑎𝑟_𝑥
𝐴𝑑𝑗𝑢𝑠𝑡𝑒𝑑𝐹𝑇𝐸_𝐸𝑁𝑅𝐿𝑦𝑒𝑎𝑟_𝑥
This indicator can be disaggregated by the source of funds: public, private or international.
The disaggregation of the indicator across public, private and international funds is
presented both from the perspective of the initial source of funds before government
transfers to the private sector, and from the final source of funds, after public transfers
have been made to private entities.
Public expenditure on educational institutions per student:
𝐸𝐷𝑈_𝐸𝑋𝑃𝐸𝑁𝐷𝐼𝑇𝑈𝑅𝐸𝑝𝑢𝑏𝑙𝑖𝑐,𝑦𝑒𝑎𝑟_𝑥/𝑃𝑃𝑃𝑦𝑒𝑎𝑟_𝑥
𝐴𝑑𝑗𝑢𝑠𝑡𝑒𝑑𝐹𝑇𝐸_𝐸𝑁𝑅𝐿 𝑦𝑒𝑎𝑟_𝑥
Private expenditure on educational institutions per student:
𝐸𝐷𝑈_𝐸𝑋𝑃𝐸𝑁𝐷𝐼𝑇𝑈𝑅𝐸𝑝𝑟𝑖𝑣𝑎𝑡𝑒,𝑦𝑒𝑎𝑟_𝑥/𝑃𝑃𝑃𝑦𝑒𝑎𝑟_𝑥
𝐴𝑑𝑗𝑢𝑠𝑡𝑒𝑑𝐹𝑇𝐸_𝐸𝑁𝑅𝐿 𝑦𝑒𝑎𝑟_𝑥
International expenditure on educational institutions per student:
𝐸𝐷𝑈_𝐸𝑋𝑃𝐸𝑁𝐷𝐼𝑇𝑈𝑅𝐸𝑖𝑛𝑡𝑒𝑟𝑛𝑎𝑡𝑖𝑜𝑛𝑎𝑙,𝑦𝑒𝑎𝑟_𝑥/𝑃𝑃𝑃𝑦𝑒𝑎𝑟_𝑥
𝐴𝑑𝑗𝑢𝑠𝑡𝑒𝑑𝐹𝑇𝐸_𝐸𝑁𝑅𝐿 𝑦𝑒𝑎𝑟_𝑥
𝐸𝐷𝑈_𝐸𝑋𝑃𝐸𝑁𝐷𝐼𝑇𝑈𝑅𝐸𝑦𝑒𝑎𝑟_𝑥 is the total expenditure (public, private and international) on
educational institutions (Figure 7.1). It includes expenditure on core educational goods
and services such as teaching staff, school buildings, and school books and teaching
materials, and peripheral educational goods and services such as research and
development services (R&D), ancillary services, general administration and other
activities (see Chapter 4, Section 4.5 for definitions of educational expenditure).
𝐸𝐷𝑈_𝐸𝑋𝑃𝐸𝑁𝐷𝐼𝑇𝑈𝑅𝐸𝑝𝑢𝑏𝑙𝑖𝑐,𝑦𝑒𝑎𝑟_𝑥 refers to total direct government expenditures on
educational institutions for a specific year. When this is calculated from the initial source of
funds, it includes public subsidies to households and other private entities for educational
institutions. International expenditure on educational institutions may be included in public
sources as this often represents a very small share of total funding on education.
𝐸𝐷𝑈_𝐸𝑋𝑃𝐸𝑁𝐷𝐼𝑇𝑈𝑅𝐸𝑝𝑟𝑖𝑣𝑎𝑡𝑒,𝑦𝑒𝑎𝑟_𝑥 refers to total household payments to educational
institutions, and total payments of other private institutions to educational institutions.
When this is calculated from the final source of funds, it includes public subsidies to
household and other private entities for educational institutions.
𝐸𝐷𝑈_𝐸𝑋𝑃𝐸𝑁𝐷𝐼𝑇𝑈𝑅𝐸𝑖𝑛𝑡𝑒𝑟𝑛𝑎𝑡𝑖𝑜𝑛𝑎𝑙,𝑦𝑒𝑎𝑟_𝑥 refers to total expenditure for educational
institutions from international sources. When this is calculated from the final source of
funds, it includes transfers from international sources for education to government.
𝐸𝐷𝑈_𝐸𝑋𝑃𝐸𝑁𝐷𝐼𝑇𝑈𝑅𝐸𝑦𝑒𝑎𝑟_𝑥 / 𝑃𝑃𝑃 𝑦𝑒𝑎𝑟_𝑥 is expenditure on educational institutions (in
national currency) converted into equivalent USD by dividing the national currency
figure by the purchasing power parity (PPP) index for gross domestic product (GDP). The
PPP exchange rate is used because the market exchange rate is affected by many factors
(interest rates, trade policies, expectations of economic growth, etc.) that have little to do

116 │ 7 - INDICATOR CONCEPTS AND METHODOLOGIES
OECD HANDBOOK FOR INTERNATIONALLY COMPARATIVE EDUCATION STATISTICS 2018 © OECD 2018
with current relative domestic purchasing power in different OECD countries. The PPP
controls for the different costs of living and price levels by equalising the purchasing
power of different currencies for a market “basket of goods”.
𝐴𝑑𝑗𝑢𝑠𝑡𝑒𝑑𝐹𝑇𝐸_𝐸𝑁𝑅𝐿𝑦𝑒𝑎𝑟_𝑥 is the number of full-time students enrolled in educational
institutions adjusted to the financial year. Using different reference periods for the
expenditure and enrolment data would bias the expenditure on educational institutions per
student. Therefore, it is necessary to estimate student numbers for the reference period
that coincides with the financial year. This involves taking a weighted average of the full-
time equivalent number of students in the two adjacent academic years that overlap with the
financial year.
𝐴𝑑𝑗𝑢𝑠𝑡𝑒𝑑𝐹𝑇𝐸_𝐸𝑁𝑅𝐿𝑦𝑒𝑎𝑟_𝑥 =
𝑊𝑦𝑒𝑎𝑟_𝑥−1/𝑥 ∗ 𝐹𝑇𝐸_𝐸𝑁𝑅𝐿𝑦𝑒𝑎𝑟_𝑥−1/𝑥 + 𝑊𝑦𝑒𝑎𝑟_𝑥/𝑥+1 ∗ 𝐹𝑇𝐸_𝐸𝑁𝑅𝐿𝑦𝑒𝑎𝑟_𝑥/𝑥+1
Where 𝑊𝑦𝑒𝑎𝑟_𝑥−1/𝑥 is the weight representing the portion of the academic year (x-1) that
overlaps with the financial year x; 𝑊𝑦𝑒𝑎𝑟_𝑥/𝑥+1 is the weight representing the portion of
the academic year (x+1) that overlaps with the financial year x; and 𝐹𝑇𝐸𝑦𝑒𝑎𝑟_𝑥−1/𝑥 is the
number of full-time equivalent students enrolled in educational institutions in the academic
year x-1 /x; and 𝐹𝑇𝐸𝑦𝑒𝑎𝑟_𝑥/𝑥+1 is the number of full-time equivalent students enrolled in
educational institutions in the academic year x/x+1.
For example, in Austria, aligning school enrolment data with the 2001 financial year
involves adding 8/12ths of the 2000/01 school year full-time equivalent (FTE) enrolment
data and 4/12ths of the 2001/02 school year FTE enrolment data.
Expenditure on educational institutions per student can also be expressed relative to GDP
per capita to measure the relative proportion of a nation’s wealth per capita that is
invested in educational institutions.
Expenditure on educational institutions per student as a percentage of GDP per capita:
𝐸𝐷𝑈_𝐸𝑋𝑃𝐸𝑁𝐷𝐼𝑇𝑈𝑅𝐸𝑦𝑒𝑎𝑟_𝑥
𝐴𝑑𝑗𝑢𝑠𝑡𝑒𝑑𝐹𝑇𝐸_𝐸𝑁𝑅𝐿𝑦𝑒𝑎𝑟_𝑥/
𝐺𝐷𝑃𝑦𝑒𝑎𝑟_𝑥
𝑃𝑜𝑝𝑢𝑙𝑎𝑡𝑖𝑜𝑛𝑦𝑒𝑎𝑟_𝑥
Expenditure on educational institutions in the national currency is divided by GDP per
capita in the national currency. See more details in next section.
Limitations and further considerations
All expenditure data as well as the GDP are adjusted to latest year available prices
using the GDP price deflator.
In the cases where the financial year data do not align to the reference year
(calendar year), the financial year data are updated to the intended reference
period using the appropriate GDP deflators. As a result, adjusted FTE figures
might differ from FTE figures in other indicators.
Not all spending on instructional goods and services occurs within educational
institutions. For example, families may purchase commercial textbooks and
materials or seek private tutoring for their children outside educational
institutions. At the tertiary level, students’ living expenses and foregone earnings
can also account for a significant proportion of the costs of education. This

7 - INDICATOR CONCEPTS AND METHODOLOGIES │ 117
OECD HANDBOOK FOR INTERNATIONALLY COMPARATIVE EDUCATION STATISTICS 2018 © OECD 2018
indicator excludes all expenditure outside educational institutions, even if
publicly subsidised.
At higher levels of education, this measure is more difficult to interpret because
student enrolment rates vary widely among countries. At tertiary level, for
example, OECD countries may rank relatively high on this measure if a large
proportion of their wealth is spent on educating a relatively small number of
students.
Expenditure on programmes not distributed by ISCED level were excluded from
the calculation of total education expenditure.
When spending per student is calculated at the level of early childhood education
and care programmes (ISCED 0) per child, headcounts are used instead of FTE.
7.6.2. Expenditure on educational institutions as a percentage of GDP
Policy context
Expenditure on educational institutions is an investment that can help to foster economic
growth, enhance productivity, contribute to personal and social development, and reduce
social inequality. The proportion of total financial resources each country devotes to
education is one of the key choices governments make. This indicator provides a measure
of the proportion of their wealth (GDP) that nations invest in educational institutions and
therefore allows countries’ investment to be valued as a function of their relative ability
to pay. The “domestic” approach (relative to GDP) is preferred to the “national” approach
(relative to gross national product, GNP) because it is consistent with other concepts used
in education statistics and in the UOE data collection.
Calculation
This indicator represents expenditures on educational institutions in relation to the wealth
of nations as measured by GDP. It includes expenditure on staff compensation, and
expenditure designated for capital investment, ancillary services and R&D, from public,
private and international sources (detailed in Figures 7.1, 7.2 and 7.3). It excludes
expenditure on servicing debts (i.e. payments of interests on the amounts borrowed for
educational purposes and repayments of the principal) and tuition fees paid by households
to regional or local government rather than directly to educational institutions.
Expenditure on educational institutions as a percentage of GDP:
𝐸𝐷𝑈_𝐸𝑋𝑃𝐸𝑁𝐷𝐼𝑇𝑈𝑅𝐸𝑦𝑒𝑎𝑟_𝑥
𝐺𝐷𝑃𝑦𝑒𝑎𝑟_𝑥
This indicator can be disaggregated by sources of funds – public, private or international. The
disaggregation of the indicator across public, private and international funds is presented
both from the perspective of the initial source of funds before government transfers to
the private sector, and from the final source of funds, after public transfers have been
made to private entities (Figure 7.1).
Public expenditure as a percentage of GDP:
𝐸𝐷𝑈_𝐸𝑋𝑃𝐸𝑁𝐷𝐼𝑇𝑈𝑅𝐸𝑝𝑢𝑏𝑙𝑖𝑐,𝑦𝑒𝑎𝑟_𝑥
𝐺𝐷𝑃𝑦𝑒𝑎𝑟_𝑥
Private expenditure as a percentage of GDP:
118 │ 7 - INDICATOR CONCEPTS AND METHODOLOGIES
OECD HANDBOOK FOR INTERNATIONALLY COMPARATIVE EDUCATION STATISTICS 2018 © OECD 2018
𝐸𝐷𝑈_𝐸𝑋𝑃𝐸𝑁𝐷𝐼𝑇𝑈𝑅𝐸𝑝𝑟𝑖𝑣𝑎𝑡𝑒,𝑦𝑒𝑎𝑟_𝑥
𝐺𝐷𝑃𝑦𝑒𝑎𝑟_𝑥
International expenditure as a percentage of GDP:
𝐸𝐷𝑈_𝐸𝑋𝑃𝐸𝑁𝐷𝐼𝑇𝑈𝑅𝐸𝑖𝑛𝑡𝑒𝑟𝑛𝑎𝑡𝑖𝑜𝑛𝑎𝑙,𝑦𝑒𝑎𝑟_𝑥
𝐺𝐷𝑃𝑦𝑒𝑎𝑟_𝑥
Where 𝐸𝐷𝑈_𝐸𝑋𝑃𝐸𝑁𝐷𝐼𝑇𝑈𝑅𝐸𝑝𝑢𝑏𝑙𝑖𝑐,𝑦𝑒𝑎𝑟_𝑥 refers to total direct government expenditure on
educational institutions for a specific year. When this is calculated from the initial source
of funds, it includes public subsidies to households and other private entities for educational
institutions. International expenditure on educational institutions may be included in public
sources as this often represents a very small share of total funding on education.
𝐸𝐷𝑈_𝐸𝑋𝑃𝐸𝑁𝐷𝐼𝑇𝑈𝑅𝐸𝑝𝑟𝑖𝑣𝑎𝑡𝑒,𝑦𝑒𝑎𝑟_𝑥 refers to total household payments to educational
institutions, and total payments of other private institutions to educational institutions.
When this is calculated from the final source of funds, it includes public subsidies to
household and other private entities for educational institutions.
𝐸𝐷𝑈_𝐸𝑋𝑃𝐸𝑁𝐷𝐼𝑇𝑈𝑅𝐸𝑖𝑛𝑡𝑒𝑟𝑛𝑎𝑡𝑖𝑜𝑛𝑎𝑙,𝑦𝑒𝑎𝑟_𝑥 refers to total expenditure for educational
institutions from international sources. When this is calculated from the final source of
funds, it includes transfers from international sources for education to government.
𝐺𝐷𝑃𝑦𝑒𝑎𝑟_𝑥 refers the gross domestic product for a specific year, or the producers’ value of
the gross outputs of resident producers, including distributive trades and transport, minus
the value of purchasers’ intermediate consumption plus import duties. GDP is expressed in
local currency (in millions).
Limitations and further considerations
For countries which provide this information for a reference year that is different
from the calendar year (such as Australia and New Zealand), adjustments are
made by linearly weighting their GDP between two adjacent national reference
years to match the calendar year. The data are derived from the National Accounts
Database.
The student enrolment data are aligned to the financial year reference period. It
may not be necessary to use an inflation adjustment to bring the financial year in
line with the reference year if the GDP per capita figures refer to the same
reference year as the finance data.
As in the previous indicator, not all spending on instructional goods and services
– such as on textbooks and private tutoring – occurs within educational
institutions. This indicator excludes all expenditure outside educational
institutions, even if publicly subsidised.
Expenditure on programmes not distributed by ISCED level are excluded from
the calculation of total education expenditure.
The theoretical framework underpinning the calculation of GDP has been
provided for many years by the United Nations’ publication, A System of National
Accounts, which was released in 1968. Updated versions were released in 1993
and 2008 (commonly referred to as SNA93 and SNA2008).
7 - INDICATOR CONCEPTS AND METHODOLOGIES │ 119
OECD HANDBOOK FOR INTERNATIONALLY COMPARATIVE EDUCATION STATISTICS 2018 © OECD 2018
7.6.3. Relative proportions of public, private and international expenditure
on educational institutions
Policy context
How costs are shared between participants in the education system and society as a whole
is an issue under discussion in many countries. This question is especially relevant at the
beginning and end of a student’s education – early childhood and tertiary education –
where full or nearly full public funding is less common in some countries. This indicator
illustrates how the cost of education is shared between the public and private sectors,
including the amounts invested by one sector relative to the other and the extent of
transfers of educational funds between them.
Calculation
This indicator represents the relative proportions of disaggregated public, private and
international expenditure on educational institutions. It includes expenditure on staff
compensation, and expenditure designated for capital investment, ancillary services and
R&D, from public, private, and international sources (detailed in Figure 7.1). It excludes
expenditure on servicing debts (i.e. payments of interests on the amounts borrowed for
educational purposes and repayments of the principal) and tuition fees paid by households
to regional or local government rather than directly to educational institutions.
The attribution of spending to public, private and international funds is presented both
from the perspective of the initial source of funds before government transfers to the
private sector, and from the final source of funds, after public transfers have been made
to private entities.
Relative proportion of public sources:
𝐸𝐷𝑈_𝐸𝑋𝑃𝐸𝑁𝐷𝐼𝑇𝑈𝑅𝐸𝑝𝑢𝑏𝑙𝑖𝑐
𝐸𝐷𝑈_𝐸𝑋𝑃𝐸𝑁𝐷𝐼𝑇𝑈𝑅𝐸x100
Relative proportion of private sources:
𝐸𝐷𝑈_𝐸𝑋𝑃𝐸𝑁𝐷𝐼𝑇𝑈𝑅𝐸𝑝𝑟𝑖𝑣𝑎𝑡𝑒
𝐸𝐷𝑈_𝐸𝑋𝑃𝐸𝑁𝐷𝐼𝑇𝑈𝑅𝐸x100
Relative proportion of international sources:
𝐸𝐷𝑈_𝐸𝑋𝑃𝐸𝑁𝐷𝐼𝑇𝑈𝑅𝐸𝑖𝑛𝑡𝑒𝑟𝑛𝑎𝑡𝑖𝑜𝑛𝑎𝑙
𝐸𝐷𝑈_𝐸𝑋𝑃𝐸𝑁𝐷𝐼𝑇𝑈𝑅𝐸x100
Where 𝐸𝐷𝑈_𝐸𝑋𝑃𝐸𝑁𝐷𝐼𝑇𝑈𝑅𝐸𝑝𝑢𝑏𝑙𝑖𝑐 refers to public expenditure on institutions including
expenditure on ancillary services and R&D. It excludes expenditure not directly related to
education (such as on culture, sports and youth activities) unless provided as ancillary
services. When this is calculated from the initial source of funds, it includes public
subsidies to households and other private entities for educational institutions.
𝐸𝐷𝑈_𝐸𝑋𝑃𝐸𝑁𝐷𝐼𝑇𝑈𝑅𝐸𝑝𝑟𝑖𝑣𝑎𝑡𝑒 refers to expenditure by the private sector (students,
households and other private entities as defined in Chapter 4, Section 4.5.4) on educational
institutions. When this is calculated from the final source of funds, it includes public
subsidies to households and other private entities for educational institutions.
𝐸𝐷𝑈_𝐸𝑋𝑃𝐸𝑁𝐷𝐼𝑇𝑈𝑅𝐸𝑖𝑛𝑡𝑒𝑟𝑛𝑎𝑡𝑖𝑜𝑎𝑛𝑎𝑙 refers to funds from public multilateral
organisations for development aid to education. These organisations include
multilateral development banks (the World Bank and regional development
120 │ 7 - INDICATOR CONCEPTS AND METHODOLOGIES
OECD HANDBOOK FOR INTERNATIONALLY COMPARATIVE EDUCATION STATISTICS 2018 © OECD 2018
banks), United Nations agencies and other intergovernmental organisations,
bilateral development co-operation government agencies, and international non-
governmental organisations (NGOs) established in the receiving country.
International expenditure on educational institutions may be included in public
expenditure as this often represents a very small share of total funding on education.
𝐸𝐷𝑈_𝐸𝑋𝑃𝐸𝑁𝐷𝐼𝑇𝑈𝑅𝐸 refers to total public, private and international spending on
educational institutions as defined above.
Limitations and further considerations
As with the previous two indicators, not all spending on instructional goods and
services occurs within educational institutions. This indicator excludes all
expenditure outside educational institutions, even if publicly subsidised.
Expenditure on servicing debts (i.e. payments of interests on the amounts
borrowed for educational purposes and repayments of the principal) is excluded
from the calculation.
Tuition fees that the families of students enrolled in public educational institutions
are paying to regional or local government rather than directly to educational
institutions are excluded to avoid double counting as they are included under
household payments to institutions.
Expenditure on programmes not distributed by ISCED level were excluded from
the calculation of total education expenditure.
7.6.4. Total public expenditure on education
Policy context
Public expenditure on education as a percentage of total public expenditure indicates the
value of education spending relative to that of other public investments such as health
care, social security, and defence and security. To some extent, it can be interpreted in
terms of relative priorities between different functions of the public sector and the
abilities of the private sector to deliver on them. However, the role and mandate of the
public sector varies greatly from country to country, according to their specific
circumstances. For instance, nationwide health or security crises may result in
comparatively lower spending on education relative to health or defence, even though
education may remain a high priority for the public agenda.

7 - INDICATOR CONCEPTS AND METHODOLOGIES │ 121
OECD HANDBOOK FOR INTERNATIONALLY COMPARATIVE EDUCATION STATISTICS 2018 © OECD 2018
Figure 7.2. Sources of funds considered in the calculation of total public expenditure on
educational as a share of total government expenditure
Calculation
Contrary to previous indicators, which focused solely on expenditure on educational
institutions, this indicator looks at total public educational expenditure (see Figure 7.2).
This includes subsidies for expenditure outside institutions (such as for students’ living
costs) and by all public entities, not just ministries of education.
122 │ 7 - INDICATOR CONCEPTS AND METHODOLOGIES
OECD HANDBOOK FOR INTERNATIONALLY COMPARATIVE EDUCATION STATISTICS 2018 © OECD 2018
Total public expenditure in education:
𝐸𝐷𝑈_𝐸𝑋𝑃𝐸𝑁𝐷𝐼𝑇𝑈𝑅𝐸𝑝𝑢𝑏𝑙𝑖𝑐
𝐴𝐿𝐿_𝐸𝑋𝑃𝐸𝑁𝐷𝐼𝑇𝑈𝑅𝐸𝑝𝑢𝑏𝑙𝑖𝑐
Where 𝐸𝐷𝑈_𝐸𝑋𝑃𝐸𝑁𝐷𝐼𝑇𝑈𝑅𝐸𝑝𝑢𝑏𝑙𝑖𝑐 is total public spending on educational institutions
and outside educational institutions. It includes all public-to-private transfers including
loans for tuition, loans and subsidies for students’ living costs and for other private
expenditure outside institutions (subsidies for education to private entities). It includes
expenditure by all public entities at central (national) government level including
ministries other than ministries of education, local and regional governments, and other
public agencies.
𝐴𝐿𝐿_𝐸𝑋𝑃𝐸𝑁𝐷𝐼𝑇𝑈𝑅𝐸𝑝𝑢𝑏𝑙𝑖𝑐 is general government spending and corresponds to the non-
repayable current and capital expenditure of all levels of government: central, regional
and local.
Limitations and further considerations
The data can also be presented broken down by government sources of
expenditure on education, apart from international sources, classified into three
levels: central (national) government, regional government (province, state, Land
etc.) and local government (municipality, district, commune etc.). The terms
“regional” and “local” apply to governments whose responsibilities are exercised
within certain geographical subdivisions of a country. They do not apply to
government bodies whose roles are not geographically circumscribed but are
defined in terms of responsibility for particular services, functions or categories of
students (see Chapter 4, Section 4.5.4 for more detail on the levels of
government).
Although expenditure on debt servicing (e.g. interest payments) is included in
total public expenditure, it is excluded from public expenditure on education. The
reason is that some countries cannot separate interest payments for education
from those for other services. This means that public expenditure on education as
a percentage of general government expenditure may be underestimated in
countries where interest payments represent a large proportion of total public
expenditure on all services.
This indicator is usually calculated for public expenditure on primary to tertiary
education.
Expenditure on programmes not distributed by ISCED level were excluded from
the calculation of total education expenditure.
7.6.5. Financial support to students and tuition fees charged by educational
institutions
Policy context
Policy decisions related to tuition fees affect both the cost of tertiary education to students
and the resources available to tertiary institutions. Policies aimed at supporting students
and their families enables governments to encourage participation in education –
particularly among low-income students – by covering part of the cost of education and
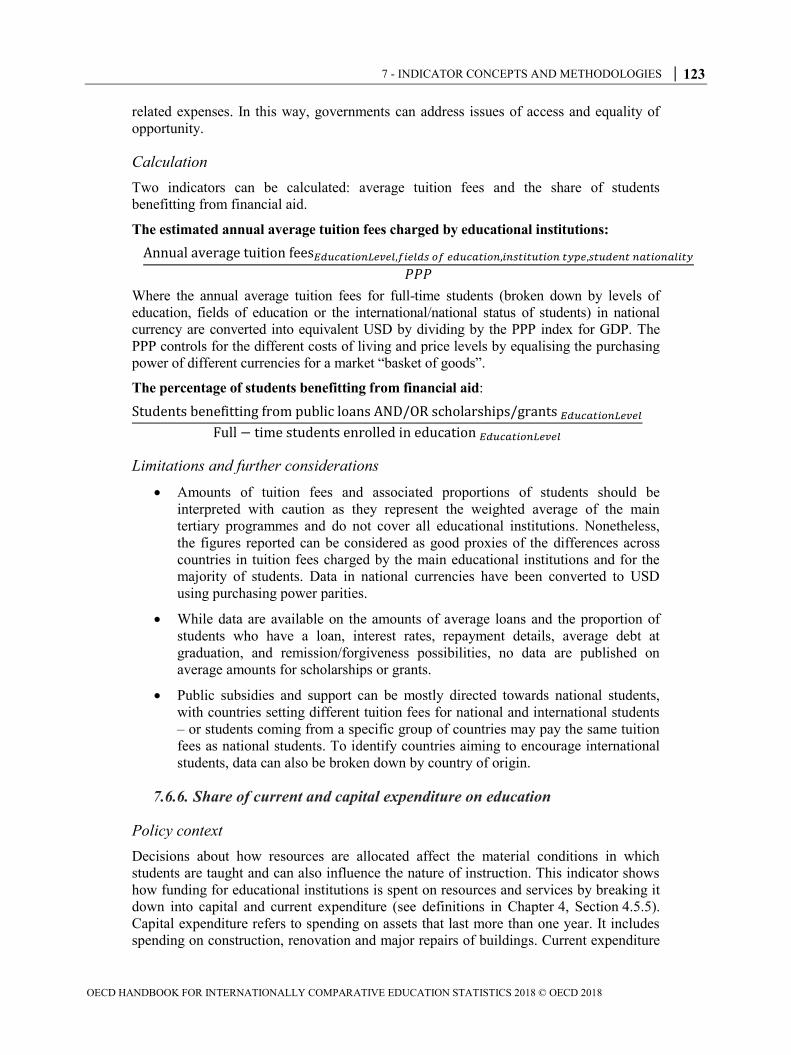
7 - INDICATOR CONCEPTS AND METHODOLOGIES │ 123
OECD HANDBOOK FOR INTERNATIONALLY COMPARATIVE EDUCATION STATISTICS 2018 © OECD 2018
related expenses. In this way, governments can address issues of access and equality of
opportunity.
Calculation
Two indicators can be calculated: average tuition fees and the share of students
benefitting from financial aid.
The estimated annual average tuition fees charged by educational institutions:
Annual average tuition fees𝐸𝑑𝑢𝑐𝑎𝑡𝑖𝑜𝑛𝐿𝑒𝑣𝑒𝑙,𝑓𝑖𝑒𝑙𝑑𝑠 𝑜𝑓 𝑒𝑑𝑢𝑐𝑎𝑡𝑖𝑜𝑛,𝑖𝑛𝑠𝑡𝑖𝑡𝑢𝑡𝑖𝑜𝑛 𝑡𝑦𝑝𝑒,𝑠𝑡𝑢𝑑𝑒𝑛𝑡 𝑛𝑎𝑡𝑖𝑜𝑛𝑎𝑙𝑖𝑡𝑦
𝑃𝑃𝑃
Where the annual average tuition fees for full-time students (broken down by levels of
education, fields of education or the international/national status of students) in national
currency are converted into equivalent USD by dividing by the PPP index for GDP. The
PPP controls for the different costs of living and price levels by equalising the purchasing
power of different currencies for a market “basket of goods”.
The percentage of students benefitting from financial aid:
Students benefitting from public loans AND/OR scholarships/grants 𝐸𝑑𝑢𝑐𝑎𝑡𝑖𝑜𝑛𝐿𝑒𝑣𝑒𝑙
Full − time students enrolled in education 𝐸𝑑𝑢𝑐𝑎𝑡𝑖𝑜𝑛𝐿𝑒𝑣𝑒𝑙
Limitations and further considerations
Amounts of tuition fees and associated proportions of students should be
interpreted with caution as they represent the weighted average of the main
tertiary programmes and do not cover all educational institutions. Nonetheless,
the figures reported can be considered as good proxies of the differences across
countries in tuition fees charged by the main educational institutions and for the
majority of students. Data in national currencies have been converted to USD
using purchasing power parities.
While data are available on the amounts of average loans and the proportion of
students who have a loan, interest rates, repayment details, average debt at
graduation, and remission/forgiveness possibilities, no data are published on
average amounts for scholarships or grants.
Public subsidies and support can be mostly directed towards national students,
with countries setting different tuition fees for national and international students
– or students coming from a specific group of countries may pay the same tuition
fees as national students. To identify countries aiming to encourage international
students, data can also be broken down by country of origin.
7.6.6. Share of current and capital expenditure on education
Policy context
Decisions about how resources are allocated affect the material conditions in which
students are taught and can also influence the nature of instruction. This indicator shows
how funding for educational institutions is spent on resources and services by breaking it
down into capital and current expenditure (see definitions in Chapter 4, Section 4.5.5).
Capital expenditure refers to spending on assets that last more than one year. It includes
spending on construction, renovation and major repairs of buildings. Current expenditure

124 │ 7 - INDICATOR CONCEPTS AND METHODOLOGIES
OECD HANDBOOK FOR INTERNATIONALLY COMPARATIVE EDUCATION STATISTICS 2018 © OECD 2018
covers spending on resources used each year to operate the educational institution. It
includes such spending as the pay of teachers and institution staff, maintenance of
buildings, school meals, and the rental of buildings and other facilities.
Figure 7.3. What current and capital expenditure on education covers
Totalexpenditure in
publicins tu ons
Currentexpenditure
Teaching / non-teaching staffcompensa on (salaries, pensions,
benefits other than re rement)
Current expenditure other than on staffcompensa onCapital
expenditure
Totalexpenditure ingovernment-dependent
privateins tu ons
Currentexpenditure
Teaching / non-teaching staffcompensa on (salaries, pensions,
benefits other than re rement)
Current expenditure other than on staffcompensa onCapital
expenditure
Totalexpenditure inindependent
privateins tu ons
Currentexpenditure
Teaching / non-teaching staffcompensa on (salaries, pensions,
benefits other than re rement)
Current expenditure other than onstaffcompensa onCapital
expenditure
All
(pu
bli
ca
nd
priv
ate
)so
urces
ALL PRIVATE
PUBLIC

7 - INDICATOR CONCEPTS AND METHODOLOGIES │ 125
OECD HANDBOOK FOR INTERNATIONALLY COMPARATIVE EDUCATION STATISTICS 2018 © OECD 2018
Calculation
Relative proportion of current expenditure:
𝐸𝐷𝑈_𝐸𝑋𝑃𝐸𝑁𝐷𝐼𝑇𝑈𝑅𝐸𝑐𝑢𝑟𝑟𝑒𝑛𝑡,𝐸𝑑𝑢𝑐𝐿𝑒𝑣𝑒𝑙
𝐸𝐷𝑈_𝐸𝑋𝑃𝐸𝑁𝐷𝐼𝑇𝑈𝑅𝐸x100
Relative proportion of capital expenditure:
𝐸𝐷𝑈_𝐸𝑋𝑃𝐸𝑁𝐷𝐼𝑇𝑈𝑅𝐸𝑐𝑎𝑝𝑖𝑡𝑎𝑙,𝐸𝑑𝑢𝑐𝐿𝑒𝑣𝑒𝑙
𝐸𝐷𝑈_𝐸𝑋𝑃𝐸𝑁𝐷𝐼𝑇𝑈𝑅𝐸x100
𝐸𝐷𝑈_𝐸𝑋𝑃𝐸𝑁𝐷𝐼𝑇𝑈𝑅𝐸𝑐𝑢𝑟𝑟𝑒𝑛𝑡,𝐸𝑑𝑢𝑐𝐿𝑒𝑣𝑒𝑙 refers to spending on goods and services
consumed at a certain level of education within the current year and requiring recurrent
production in order to sustain educational services. Other than salaries, current expenditure
by educational institutions includes expenditure on subcontracted services such as support
services (e.g. maintenance of buildings), ancillary services (e.g. preparation of meals for
students) and rental of buildings and other facilities. It also includes expenditure on other
resources and covers the purchases of other resources used in education, such as teaching
and learning materials, other materials and supplies, items of equipment not classified as
capital, fuel, electricity, telecommunications, travel expenses, and insurance, and required
payments other than expenditure on educational resources and services. For example, this
indicator includes the property taxes that educational institutions are required to pay in
some countries. These services are obtained from outside providers, unlike the services
provided by the education authorities or by the educational institutions using their own
personnel. All sources of funding are considered in this definition, public and private.
𝐸𝐷𝑈_𝐸𝑋𝑃𝐸𝑁𝐷𝐼𝑇𝑈𝑅𝐸𝑐𝑎𝑝𝑖𝑡𝑎𝑙,𝐸𝑑𝑢𝑐𝐿𝑒𝑣𝑒𝑙 refers to spending on assets at a specific level of
education that last longer than one year. It includes construction, renovation or major repair
of buildings and new or replacement equipment. It represents the value of educational
capital acquired or created during the year in question – that is, the amount of capital
formation – regardless of whether the capital expenditure was financed from current
revenue or through borrowing. For example, if a school building costing EUR 10 millions is
constructed in 2010, the full amount should be reported as capital expenditure for 2010,
even if the building is financed by a loan with repayments spread over 20 years. If the
building was constructed over two years, 2009-10, with EUR 7 million paid towards the
cost of construction in the first year and EUR 3 million in the second year, capital outlays of
EUR 7 million should be included in the 2009 data and EUR 3 million in the 2010 data. All
sources of funding are considered in this definition, public and private.
𝐸𝐷𝑈_𝐸𝑋𝑃𝐸𝑁𝐷𝐼𝑇𝑈𝑅𝐸 refers to total educational expenditure at all levels of education,
including public and private sources.
Limitations and further considerations
Neither current nor capital expenditure includes debt servicing (e.g. interest
payments or repayments of the principal). This means that neither interest
payments nor repayments of the principal should be counted as part of capital or
current spending.
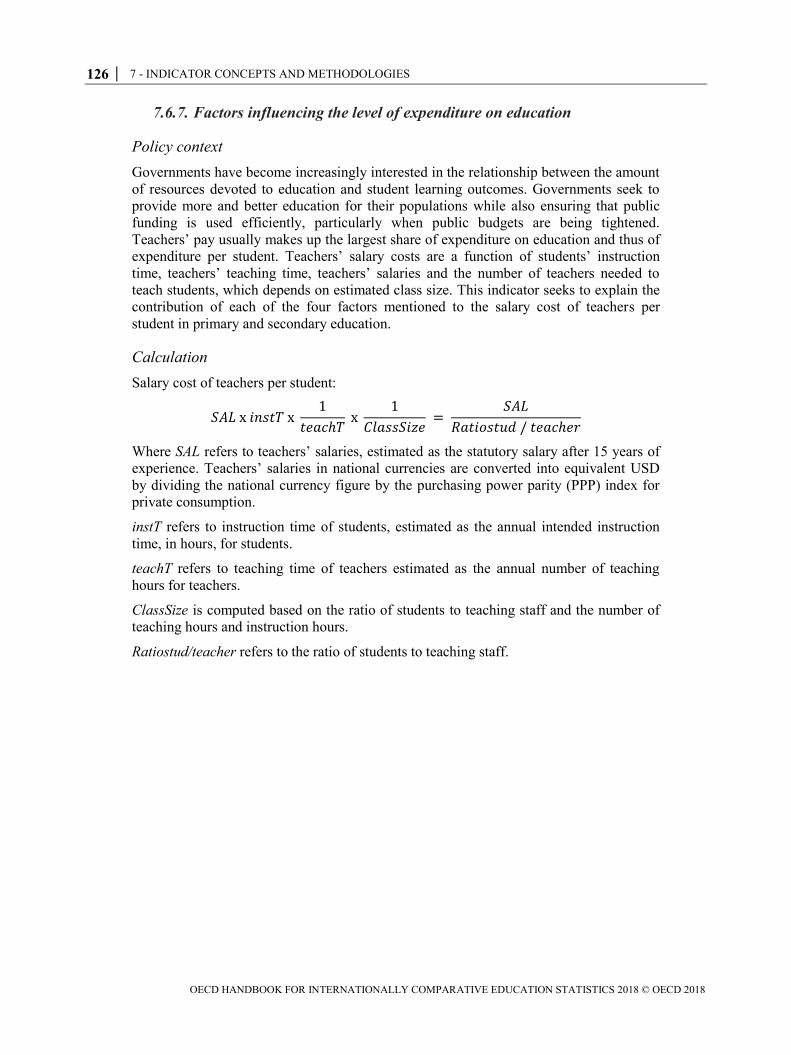
126 │ 7 - INDICATOR CONCEPTS AND METHODOLOGIES
OECD HANDBOOK FOR INTERNATIONALLY COMPARATIVE EDUCATION STATISTICS 2018 © OECD 2018
7.6.7. Factors influencing the level of expenditure on education
Policy context
Governments have become increasingly interested in the relationship between the amount
of resources devoted to education and student learning outcomes. Governments seek to
provide more and better education for their populations while also ensuring that public
funding is used efficiently, particularly when public budgets are being tightened.
Teachers’ pay usually makes up the largest share of expenditure on education and thus of
expenditure per student. Teachers’ salary costs are a function of students’ instruction
time, teachers’ teaching time, teachers’ salaries and the number of teachers needed to
teach students, which depends on estimated class size. This indicator seeks to explain the
contribution of each of the four factors mentioned to the salary cost of teachers per
student in primary and secondary education.
Calculation
Salary cost of teachers per student:
𝑆𝐴𝐿 x 𝑖𝑛𝑠𝑡𝑇 x 1
𝑡𝑒𝑎𝑐ℎ𝑇 x
1
𝐶𝑙𝑎𝑠𝑠𝑆𝑖𝑧𝑒 =
𝑆𝐴𝐿
𝑅𝑎𝑡𝑖𝑜𝑠𝑡𝑢𝑑 / 𝑡𝑒𝑎𝑐ℎ𝑒𝑟
Where SAL refers to teachers’ salaries, estimated as the statutory salary after 15 years of
experience. Teachers’ salaries in national currencies are converted into equivalent USD
by dividing the national currency figure by the purchasing power parity (PPP) index for
private consumption.
instT refers to instruction time of students, estimated as the annual intended instruction
time, in hours, for students.
teachT refers to teaching time of teachers estimated as the annual number of teaching
hours for teachers.
ClassSize is computed based on the ratio of students to teaching staff and the number of
teaching hours and instruction hours.
Ratiostud/teacher refers to the ratio of students to teaching staff.
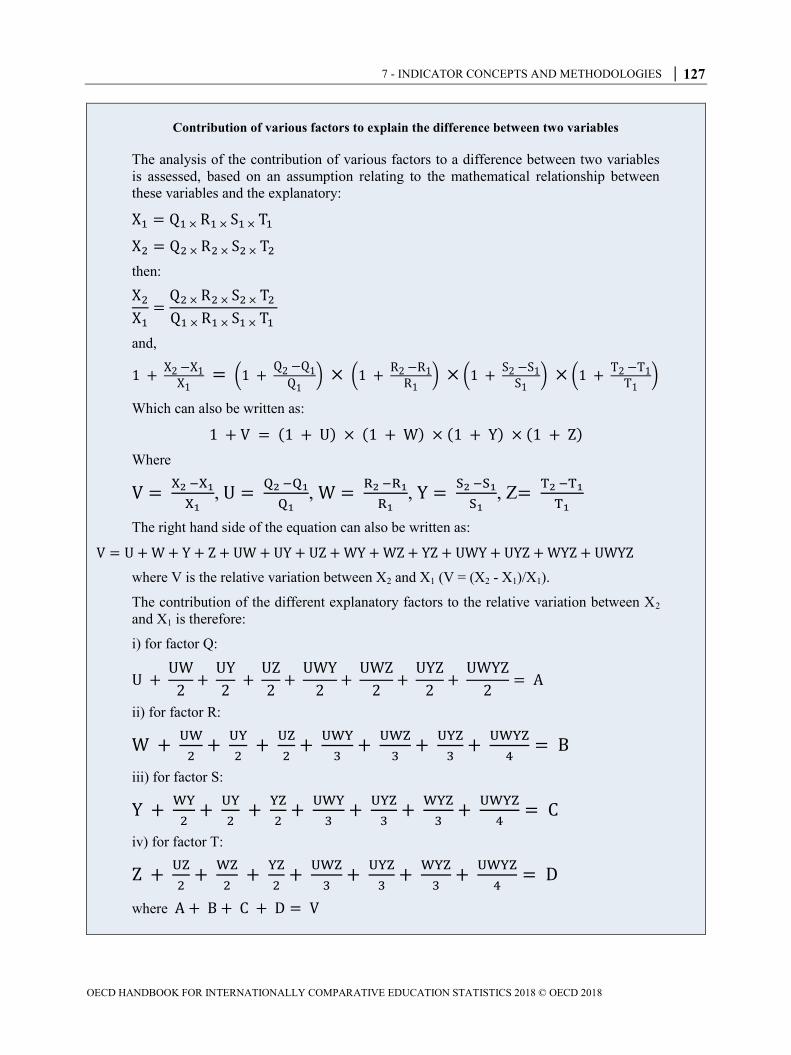
7 - INDICATOR CONCEPTS AND METHODOLOGIES │ 127
OECD HANDBOOK FOR INTERNATIONALLY COMPARATIVE EDUCATION STATISTICS 2018 © OECD 2018
Contribution of various factors to explain the difference between two variables
The analysis of the contribution of various factors to a difference between two variables
is assessed, based on an assumption relating to the mathematical relationship between
these variables and the explanatory:
X1 = Q1 × R1 × S1 × T1
X2 = Q2 × R2 × S2 × T2
then:
X2
X1=
Q2 × R2 × S2 × T2
Q1 × R1 × S1 × T1
and,
1 + X2 −X1
X1 = (1 +
Q2 −Q1Q1
) × (1 + R2 −R1
R1) × (1 +
S2 −S1S1
) × (1 + T2 −T1
T1)
Which can also be written as:
1 + V = (1 + U) × (1 + W) × (1 + Y) × (1 + Z)
Where
V = X2 −X1
X1, U =
Q2 −Q1
Q1, W =
R2 −R1
R1, Y =
S2 −S1
S1, Z=
T2 −T1
T1
The right hand side of the equation can also be written as:
V = U + W + Y + Z + UW + UY + UZ + WY + WZ + YZ + UWY + UYZ + WYZ + UWYZ
where V is the relative variation between X2 and X1 (V = (X2 - X1)/X1).
The contribution of the different explanatory factors to the relative variation between X2
and X1 is therefore:
i) for factor Q:
U + UW
2+
UY
2 +
UZ
2+
UWY
2+
UWZ
2+
UYZ
2+
UWYZ
2= A
ii) for factor R:
W + UW
2+
UY
2 +
UZ
2+
UWY
3+
UWZ
3+
UYZ
3+
UWYZ
4= B
iii) for factor S:
Y + WY
2+
UY
2 +
YZ
2+
UWY
3+
UYZ
3+
WYZ
3+
UWYZ
4= C
iv) for factor T:
Z + UZ
2+
WZ
2 +
YZ
2+
UWZ
3+
UYZ
3+
WYZ
3+
UWYZ
4= D
where A + B + C + D = V

128 │ 7 - INDICATOR CONCEPTS AND METHODOLOGIES
OECD HANDBOOK FOR INTERNATIONALLY COMPARATIVE EDUCATION STATISTICS 2018 © OECD 2018
With this method, we can measure the direct and indirect contribution of each factor to
the variation of the variable between the two countries. For example, if a worker receives
a 10% increase of the hourly wage and increases the number of hours of work by 20%,
his earnings will increase by 32%, resulting from the direct contribution of each of these
variations (0.1 + 0.2) and the indirect contribution of these variations due to the
combination for these two factors (0.1*0.2).
The contribution of explanatory factors to the absolute difference between the two
variables (X2 - X1) is:
i) for factor U:
A
V × (X2 − X1) = AX1 = a
ii) for factor R:
B
V × (X2 − X1) = BX1 = b
iii) for factor S:
C
V × (X2 − X1) = CX1 = c
iv) for factor T:
D
V × (X2 − X1) = DX1 = d
With
𝑎 + 𝑏 + 𝑐 + 𝑑 = 𝑋2 − 𝑋1
Limitations and further considerations
Class size is an estimated proxy for the average number of students that are
grouped together in classrooms. It is estimated on the basis of the ratio of students
to teaching staff and the number of teaching hours and instruction hours. As a
proxy, this estimate should be interpreted with caution.
The salary cost of teachers per student is estimated based on theoretical values:
statutory salaries at a specific point in the salary scale, theoretical students’
instruction times and statutory teachers’ teaching times, and estimated class sizes.
As a consequence, this measure may differ from the actual teachers’ salary costs
resulting from the combination of actual average values for these four factors.
7.7. Participation and access to education
A well-educated population has become a defining feature of a modern society. Education
is seen as a mechanism for instilling civic values, and as a means for developing
individuals’ productive and social capacity. Early childhood programmes prepare young
children socially and academically for primary education. Primary and secondary
education provides basic skills that serve as a foundation for young people to become
productive members of society. Tertiary education provides opportunities to acquire
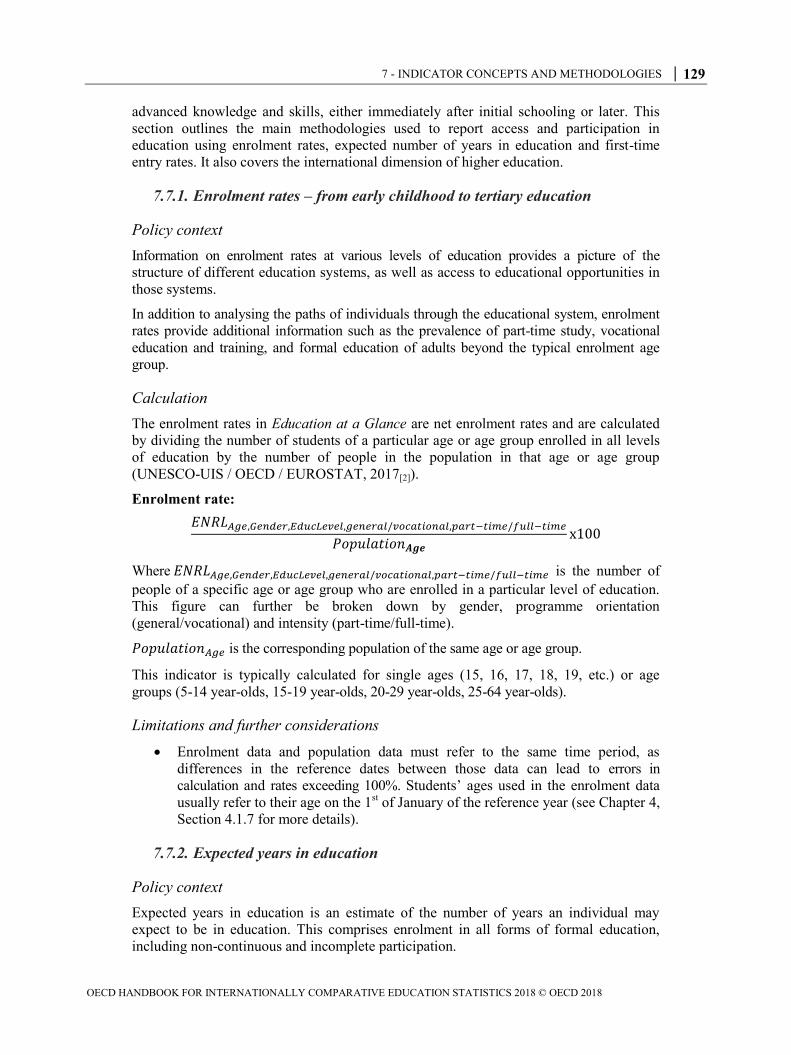
7 - INDICATOR CONCEPTS AND METHODOLOGIES │ 129
OECD HANDBOOK FOR INTERNATIONALLY COMPARATIVE EDUCATION STATISTICS 2018 © OECD 2018
advanced knowledge and skills, either immediately after initial schooling or later. This
section outlines the main methodologies used to report access and participation in
education using enrolment rates, expected number of years in education and first-time
entry rates. It also covers the international dimension of higher education.
7.7.1. Enrolment rates – from early childhood to tertiary education
Policy context
Information on enrolment rates at various levels of education provides a picture of the
structure of different education systems, as well as access to educational opportunities in
those systems.
In addition to analysing the paths of individuals through the educational system, enrolment
rates provide additional information such as the prevalence of part-time study, vocational
education and training, and formal education of adults beyond the typical enrolment age
group.
Calculation
The enrolment rates in Education at a Glance are net enrolment rates and are calculated
by dividing the number of students of a particular age or age group enrolled in all levels
of education by the number of people in the population in that age or age group
(UNESCO-UIS / OECD / EUROSTAT, 2017[2]).
Enrolment rate:
𝐸𝑁𝑅𝐿𝐴𝑔𝑒,𝐺𝑒𝑛𝑑𝑒𝑟,𝐸𝑑𝑢𝑐𝐿𝑒𝑣𝑒𝑙,𝑔𝑒𝑛𝑒𝑟𝑎𝑙/𝑣𝑜𝑐𝑎𝑡𝑖𝑜𝑛𝑎𝑙,𝑝𝑎𝑟𝑡−𝑡𝑖𝑚𝑒/𝑓𝑢𝑙𝑙−𝑡𝑖𝑚𝑒
𝑃𝑜𝑝𝑢𝑙𝑎𝑡𝑖𝑜𝑛𝑨𝒈𝒆x100
Where 𝐸𝑁𝑅𝐿𝐴𝑔𝑒,𝐺𝑒𝑛𝑑𝑒𝑟,𝐸𝑑𝑢𝑐𝐿𝑒𝑣𝑒𝑙,𝑔𝑒𝑛𝑒𝑟𝑎𝑙/𝑣𝑜𝑐𝑎𝑡𝑖𝑜𝑛𝑎𝑙,𝑝𝑎𝑟𝑡−𝑡𝑖𝑚𝑒/𝑓𝑢𝑙𝑙−𝑡𝑖𝑚𝑒 is the number of
people of a specific age or age group who are enrolled in a particular level of education.
This figure can further be broken down by gender, programme orientation
(general/vocational) and intensity (part-time/full-time).
𝑃𝑜𝑝𝑢𝑙𝑎𝑡𝑖𝑜𝑛𝐴𝑔𝑒 is the corresponding population of the same age or age group.
This indicator is typically calculated for single ages (15, 16, 17, 18, 19, etc.) or age
groups (5-14 year-olds, 15-19 year-olds, 20-29 year-olds, 25-64 year-olds).
Limitations and further considerations
Enrolment data and population data must refer to the same time period, as
differences in the reference dates between those data can lead to errors in
calculation and rates exceeding 100%. Students’ ages used in the enrolment data
usually refer to their age on the 1st of January of the reference year (see Chapter 4,
Section 4.1.7 for more details).
7.7.2. Expected years in education
Policy context
Expected years in education is an estimate of the number of years an individual may
expect to be in education. This comprises enrolment in all forms of formal education,
including non-continuous and incomplete participation.
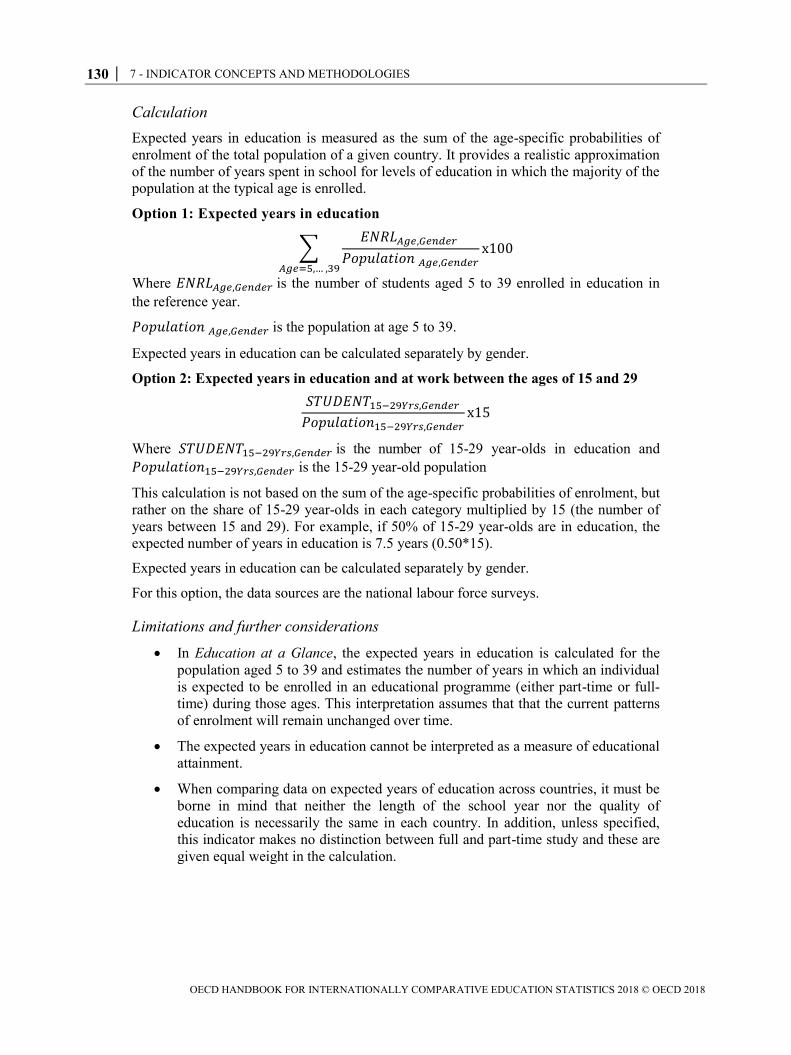
130 │ 7 - INDICATOR CONCEPTS AND METHODOLOGIES
OECD HANDBOOK FOR INTERNATIONALLY COMPARATIVE EDUCATION STATISTICS 2018 © OECD 2018
Calculation
Expected years in education is measured as the sum of the age-specific probabilities of
enrolment of the total population of a given country. It provides a realistic approximation
of the number of years spent in school for levels of education in which the majority of the
population at the typical age is enrolled.
Option 1: Expected years in education
∑𝐸𝑁𝑅𝐿𝐴𝑔𝑒,𝐺𝑒𝑛𝑑𝑒𝑟
𝑃𝑜𝑝𝑢𝑙𝑎𝑡𝑖𝑜𝑛 𝐴𝑔𝑒,𝐺𝑒𝑛𝑑𝑒𝑟
𝐴𝑔𝑒=5,… ,39
x100
Where 𝐸𝑁𝑅𝐿𝐴𝑔𝑒,𝐺𝑒𝑛𝑑𝑒𝑟 is the number of students aged 5 to 39 enrolled in education in
the reference year.
𝑃𝑜𝑝𝑢𝑙𝑎𝑡𝑖𝑜𝑛 𝐴𝑔𝑒,𝐺𝑒𝑛𝑑𝑒𝑟 is the population at age 5 to 39.
Expected years in education can be calculated separately by gender.
Option 2: Expected years in education and at work between the ages of 15 and 29
𝑆𝑇𝑈𝐷𝐸𝑁𝑇15−29𝑌𝑟𝑠,𝐺𝑒𝑛𝑑𝑒𝑟
𝑃𝑜𝑝𝑢𝑙𝑎𝑡𝑖𝑜𝑛15−29𝑌𝑟𝑠,𝐺𝑒𝑛𝑑𝑒𝑟x15
Where 𝑆𝑇𝑈𝐷𝐸𝑁𝑇15−29𝑌𝑟𝑠,𝐺𝑒𝑛𝑑𝑒𝑟 is the number of 15-29 year-olds in education and
𝑃𝑜𝑝𝑢𝑙𝑎𝑡𝑖𝑜𝑛15−29𝑌𝑟𝑠,𝐺𝑒𝑛𝑑𝑒𝑟 is the 15-29 year-old population
This calculation is not based on the sum of the age-specific probabilities of enrolment, but
rather on the share of 15-29 year-olds in each category multiplied by 15 (the number of
years between 15 and 29). For example, if 50% of 15-29 year-olds are in education, the
expected number of years in education is 7.5 years (0.50*15).
Expected years in education can be calculated separately by gender.
For this option, the data sources are the national labour force surveys.
Limitations and further considerations
In Education at a Glance, the expected years in education is calculated for the
population aged 5 to 39 and estimates the number of years in which an individual
is expected to be enrolled in an educational programme (either part-time or full-
time) during those ages. This interpretation assumes that that the current patterns
of enrolment will remain unchanged over time.
The expected years in education cannot be interpreted as a measure of educational
attainment.
When comparing data on expected years of education across countries, it must be
borne in mind that neither the length of the school year nor the quality of
education is necessarily the same in each country. In addition, unless specified,
this indicator makes no distinction between full and part-time study and these are
given equal weight in the calculation.
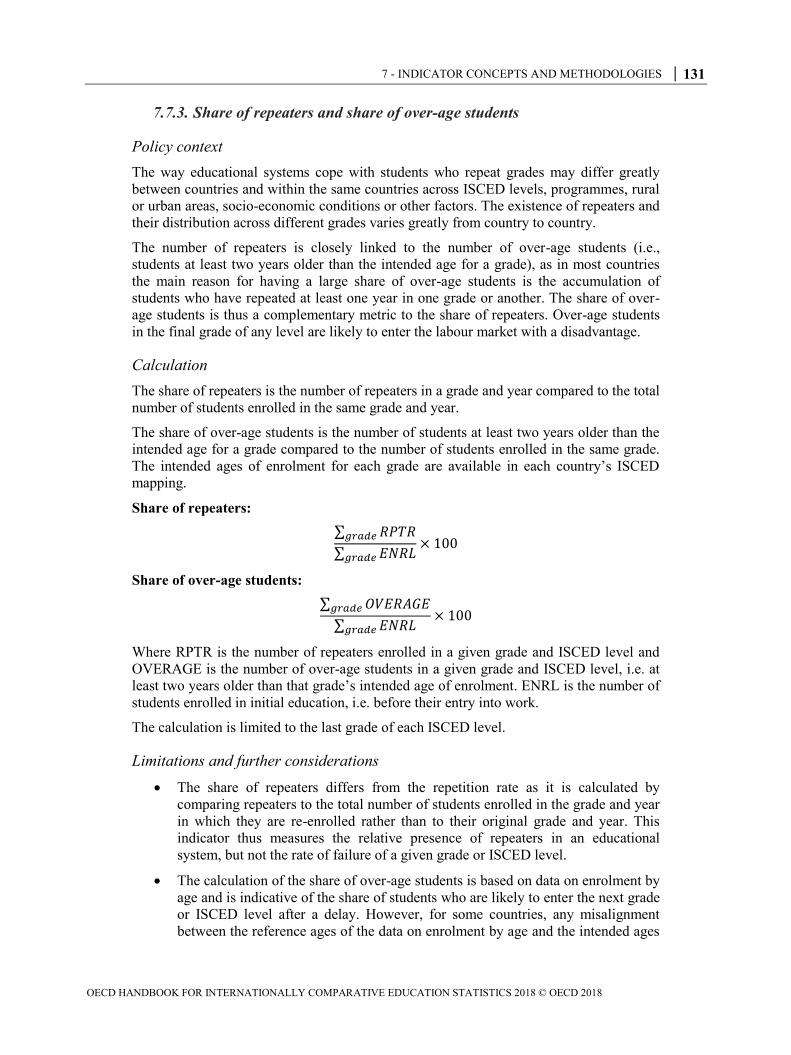
7 - INDICATOR CONCEPTS AND METHODOLOGIES │ 131
OECD HANDBOOK FOR INTERNATIONALLY COMPARATIVE EDUCATION STATISTICS 2018 © OECD 2018
7.7.3. Share of repeaters and share of over-age students
Policy context
The way educational systems cope with students who repeat grades may differ greatly
between countries and within the same countries across ISCED levels, programmes, rural
or urban areas, socio-economic conditions or other factors. The existence of repeaters and
their distribution across different grades varies greatly from country to country.
The number of repeaters is closely linked to the number of over-age students (i.e.,
students at least two years older than the intended age for a grade), as in most countries
the main reason for having a large share of over-age students is the accumulation of
students who have repeated at least one year in one grade or another. The share of over-
age students is thus a complementary metric to the share of repeaters. Over-age students
in the final grade of any level are likely to enter the labour market with a disadvantage.
Calculation
The share of repeaters is the number of repeaters in a grade and year compared to the total
number of students enrolled in the same grade and year.
The share of over-age students is the number of students at least two years older than the
intended age for a grade compared to the number of students enrolled in the same grade.
The intended ages of enrolment for each grade are available in each country’s ISCED
mapping.
Share of repeaters:
∑ 𝑅𝑃𝑇𝑅𝑔𝑟𝑎𝑑𝑒
∑ 𝐸𝑁𝑅𝐿𝑔𝑟𝑎𝑑𝑒× 100
Share of over-age students:
∑ 𝑂𝑉𝐸𝑅𝐴𝐺𝐸𝑔𝑟𝑎𝑑𝑒
∑ 𝐸𝑁𝑅𝐿𝑔𝑟𝑎𝑑𝑒× 100
Where RPTR is the number of repeaters enrolled in a given grade and ISCED level and
OVERAGE is the number of over-age students in a given grade and ISCED level, i.e. at
least two years older than that grade’s intended age of enrolment. ENRL is the number of
students enrolled in initial education, i.e. before their entry into work.
The calculation is limited to the last grade of each ISCED level.
Limitations and further considerations
The share of repeaters differs from the repetition rate as it is calculated by
comparing repeaters to the total number of students enrolled in the grade and year
in which they are re-enrolled rather than to their original grade and year. This
indicator thus measures the relative presence of repeaters in an educational
system, but not the rate of failure of a given grade or ISCED level.
The calculation of the share of over-age students is based on data on enrolment by
age and is indicative of the share of students who are likely to enter the next grade
or ISCED level after a delay. However, for some countries, any misalignment
between the reference ages of the data on enrolment by age and the intended ages
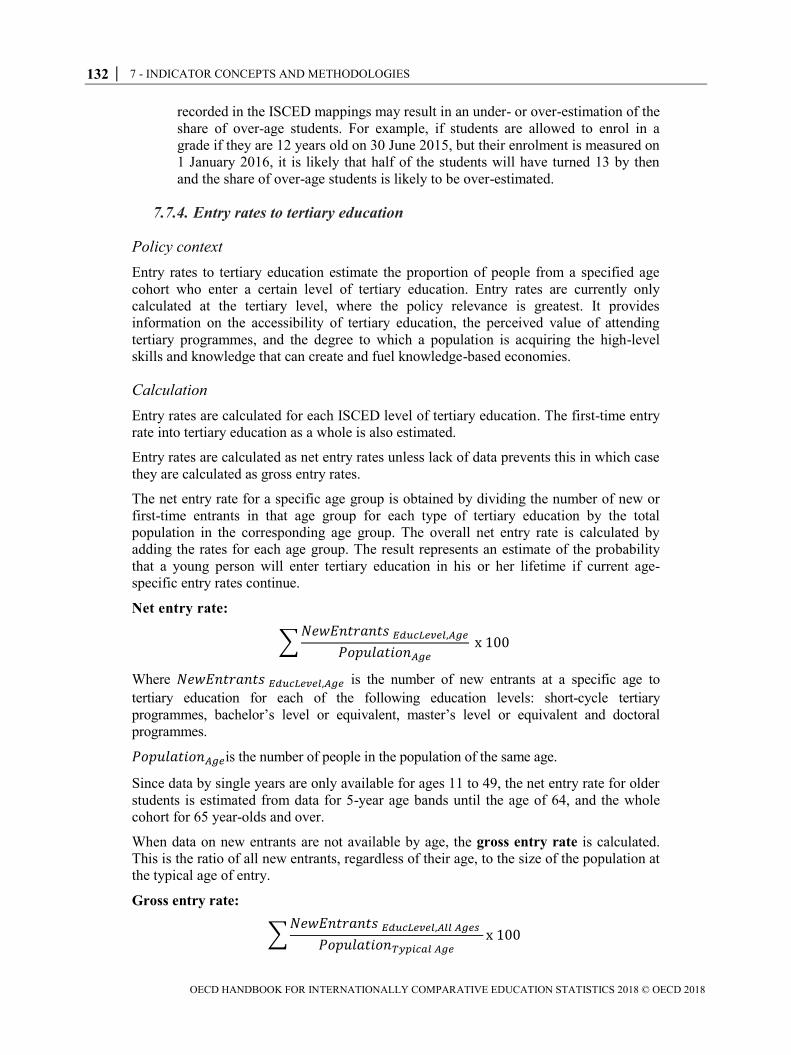
132 │ 7 - INDICATOR CONCEPTS AND METHODOLOGIES
OECD HANDBOOK FOR INTERNATIONALLY COMPARATIVE EDUCATION STATISTICS 2018 © OECD 2018
recorded in the ISCED mappings may result in an under- or over-estimation of the
share of over-age students. For example, if students are allowed to enrol in a
grade if they are 12 years old on 30 June 2015, but their enrolment is measured on
1 January 2016, it is likely that half of the students will have turned 13 by then
and the share of over-age students is likely to be over-estimated.
7.7.4. Entry rates to tertiary education
Policy context
Entry rates to tertiary education estimate the proportion of people from a specified age
cohort who enter a certain level of tertiary education. Entry rates are currently only
calculated at the tertiary level, where the policy relevance is greatest. It provides
information on the accessibility of tertiary education, the perceived value of attending
tertiary programmes, and the degree to which a population is acquiring the high-level
skills and knowledge that can create and fuel knowledge-based economies.
Calculation
Entry rates are calculated for each ISCED level of tertiary education. The first-time entry
rate into tertiary education as a whole is also estimated.
Entry rates are calculated as net entry rates unless lack of data prevents this in which case
they are calculated as gross entry rates.
The net entry rate for a specific age group is obtained by dividing the number of new or
first-time entrants in that age group for each type of tertiary education by the total
population in the corresponding age group. The overall net entry rate is calculated by
adding the rates for each age group. The result represents an estimate of the probability
that a young person will enter tertiary education in his or her lifetime if current age-
specific entry rates continue.
Net entry rate:
∑𝑁𝑒𝑤𝐸𝑛𝑡𝑟𝑎𝑛𝑡𝑠 𝐸𝑑𝑢𝑐𝐿𝑒𝑣𝑒𝑙,𝐴𝑔𝑒
𝑃𝑜𝑝𝑢𝑙𝑎𝑡𝑖𝑜𝑛𝐴𝑔𝑒 x 100
Where 𝑁𝑒𝑤𝐸𝑛𝑡𝑟𝑎𝑛𝑡𝑠 𝐸𝑑𝑢𝑐𝐿𝑒𝑣𝑒𝑙,𝐴𝑔𝑒 is the number of new entrants at a specific age to
tertiary education for each of the following education levels: short-cycle tertiary
programmes, bachelor’s level or equivalent, master’s level or equivalent and doctoral
programmes.
𝑃𝑜𝑝𝑢𝑙𝑎𝑡𝑖𝑜𝑛𝐴𝑔𝑒is the number of people in the population of the same age.
Since data by single years are only available for ages 11 to 49, the net entry rate for older
students is estimated from data for 5-year age bands until the age of 64, and the whole
cohort for 65 year-olds and over.
When data on new entrants are not available by age, the gross entry rate is calculated.
This is the ratio of all new entrants, regardless of their age, to the size of the population at
the typical age of entry.
Gross entry rate:
∑𝑁𝑒𝑤𝐸𝑛𝑡𝑟𝑎𝑛𝑡𝑠 𝐸𝑑𝑢𝑐𝐿𝑒𝑣𝑒𝑙,𝐴𝑙𝑙 𝐴𝑔𝑒𝑠
𝑃𝑜𝑝𝑢𝑙𝑎𝑡𝑖𝑜𝑛𝑇𝑦𝑝𝑖𝑐𝑎𝑙 𝐴𝑔𝑒x 100

7 - INDICATOR CONCEPTS AND METHODOLOGIES │ 133
OECD HANDBOOK FOR INTERNATIONALLY COMPARATIVE EDUCATION STATISTICS 2018 © OECD 2018
Where 𝑁𝑒𝑤𝐸𝑛𝑡𝑟𝑎𝑛𝑡𝑠 𝐸𝑑𝑢𝑐𝐿𝑒𝑣𝑒𝑙,𝐴𝑙𝑙 𝐴𝑔𝑒𝑠 is the total number of new entrants to tertiary
education for each of the following education levels: short-cycle tertiary programmes,
bachelor’s level or equivalent, master’s level or equivalent and doctoral programmes,
irrespective of their age.
𝑃𝑜𝑝𝑢𝑙𝑎𝑡𝑖𝑜𝑛𝑇𝑦𝑝𝑖𝑐𝑎𝑙 𝐴𝑔𝑒 is the number of people in the population that are at the typical age
of entry to that level (see Chapter 4, Section 4.1.7 for more details).
Not all countries can distinguish between students entering a tertiary programme for the
first time and those transferring between different levels of tertiary education or repeating
or re-entering a level after an absence.
First-time entry rate at tertiary level:
∑𝑁𝑒𝑤𝐸𝑛𝑡𝑟𝑎𝑛𝑡𝑠 𝑇𝑒𝑟𝑡𝑖𝑎𝑟𝑦𝐿𝑒𝑣𝑒𝑙,𝐴𝑔𝑒𝐺𝑟𝑜𝑢𝑝
𝑃𝑜𝑝𝑢𝑙𝑎𝑡𝑖𝑜𝑛𝐴𝑔𝑒𝐺𝑟𝑜𝑢𝑝𝑥 100
Where 𝑁𝑒𝑤𝐸𝑛𝑡𝑟𝑎𝑛𝑡𝑠𝑇𝑒𝑟𝑡𝑖𝑎𝑟𝑦𝐿𝑒𝑣𝑒𝑙,𝐴𝑔𝑒𝐺𝑟𝑜𝑢𝑝 is the number of new entrants to any level of
tertiary education at a specific age group and 𝑃𝑜𝑝𝑢𝑙𝑎𝑡𝑖𝑜𝑛𝐴𝑔𝑒is the number of people in the
population of the same age group.
Rates for each level of tertiary education cannot simply be added together to form a total
tertiary-level new entrants rate because it would result in counting entrants twice.
Entry rates can be disaggregated by gender and national origin. The profile of new entrants
can also be disaggregated by fields of education.
Limitations and further considerations
Entry rates represent the percentage of an age cohort that is expected to enter a
tertiary programme over a lifetime. This estimate is based on the number of new
entrants in a reference year and the age distribution of this group. Therefore, the
entry rates are based on a “synthetic cohort” assumption, according to which the
current pattern of entry constitutes the best estimate of the behaviour of today’s
young adults over their lifetime. Entry rates are sensitive to changes in the
education system, such as the introduction of new programmes. For example,
during the implementation of the Bologna Process, some students in European
countries stayed longer than expected in tertiary education, while others
postponed their entrance in order to earn a degree under the new classification.
Entry rates can be very high, and even greater than 100% (thus clearly indicating
that the synthetic cohort assumption is implausible), during a period when there
are an unexpectedly high number of entrants.
In interpreting these indicators, it must be remembered that student numbers are
reported on a domestic basis. In countries with limited tertiary study
opportunities, entry/participation rates will appear low.
The entry rate adjusted for international students calculates the entry rate while
excluding international students in the numerator of each age-specific entry rate.
In several countries, all international students enrolling for the first time in that
country are counted as new entrants, regardless of their previous education in
other countries. To highlight the impact of international students on entry rates,
both unadjusted and adjusted entry rates (i.e. the entry rate when international
students are excluded from consideration) should be considered.

134 │ 7 - INDICATOR CONCEPTS AND METHODOLOGIES
OECD HANDBOOK FOR INTERNATIONALLY COMPARATIVE EDUCATION STATISTICS 2018 © OECD 2018
7.7.5. International students in tertiary education
Policy context
The term “international students” refers to students who have crossed borders specifically
for the purpose of study. Tertiary education is becoming more international, not just
through student mobility, but also through a number of other factors such as distance
education, international education-related internships and training experiences, cross-
border delivery of academic programmes and offshore satellite campuses.
Student mobility is of great interest to both governments and university leaders. From the
government’s perspective, higher student mobility provides increased access to an
international talent pool during the course of study and after graduation. From the
university’s perspective, higher student mobility provides increased funding in terms of
tuition fees, and international diversity contributes to the dynamism of an educational
programme which in turn fosters an attractive environment for talented students and
academic staff.
Student mobility has increased dramatically over the past years which raises some policy
questions and has increased the need for monitoring.
Calculation
Student mobility can be calculated from the perspective of the country of origin or of the
country of destination. International students are those who received their prior education
in another country and are not residents of their current country of study (see definitions
in Chapter 4, Section 4.1.8). When information on international students is not available,
foreign students – students who are not citizens of the country in which they study – can
be used as a proxy.
Foreign and international student enrolment provides evidence of the extent of student
mobility in tertiary education. This indicator shows international enrolment as a
proportion of the total enrolment in the destination (host) country at tertiary level.
International or foreign enrolment:
𝐸𝑁𝑅𝐿_𝐹𝑜𝑟𝑒𝑖𝑔𝑛/𝐼𝑛𝑡𝑒𝑟𝑛𝑎𝑡𝑖𝑜𝑛𝑎𝑙 𝐸𝑑𝑢𝑐𝐿𝑒𝑣𝑒𝑙,𝐸𝑑𝑢𝑐𝐹𝑖𝑒𝑙𝑑,𝐺𝑒𝑛𝑑𝑒𝑟,𝐷𝑒𝑠𝑡𝐴
𝐸𝑁𝑅𝐿 𝐸𝑑𝑢𝑐𝐿𝑒𝑣𝑒𝑙,𝐸𝑑𝑢𝑐𝐹𝑖𝑒𝑙𝑑,𝐷𝑒𝑠𝑡𝐴x100
Where 𝐸𝑁𝑅𝐿_𝐹𝑜𝑟𝑒𝑖𝑔𝑛/𝐼𝑛𝑡𝑒𝑟𝑛𝑎𝑡𝑖𝑜𝑛𝑎𝑙 𝐸𝑑𝑢𝑐𝐿𝑒𝑣𝑒𝑙,𝐸𝑑𝑢𝑐𝐹𝑖𝑒𝑙𝑑,𝐺𝑒𝑛𝑑𝑒𝑟,𝐷𝑒𝑠𝑡𝐴refers to the
number of international and foreign students of a particular education/ISCED level, field
of education, and gender, enrolled in a given destination country.
𝐸𝑁𝑅𝐿 𝐸𝑑𝑢𝑐𝐿𝑒𝑣𝑒𝑙,𝐸𝑑𝑢𝑐𝐹𝑖𝑒𝑙𝑑,𝐷𝑒𝑠𝑡𝐴 refers to the total enrolment at the same education/ISCED
level, field of education, and destination country, including local, international, and
foreign students.
The data can be broken down by gender, by different tertiary levels of education (short-
cycle tertiary, bachelor’s or equivalent, master’s or equivalent, doctoral or equivalent) or
by fields of education, indicating the relative attractiveness of tertiary programmes for
international students in each country.
The distribution of international or foreign students in OECD countries at tertiary level by
country of destination identifies the major destinations of international students by
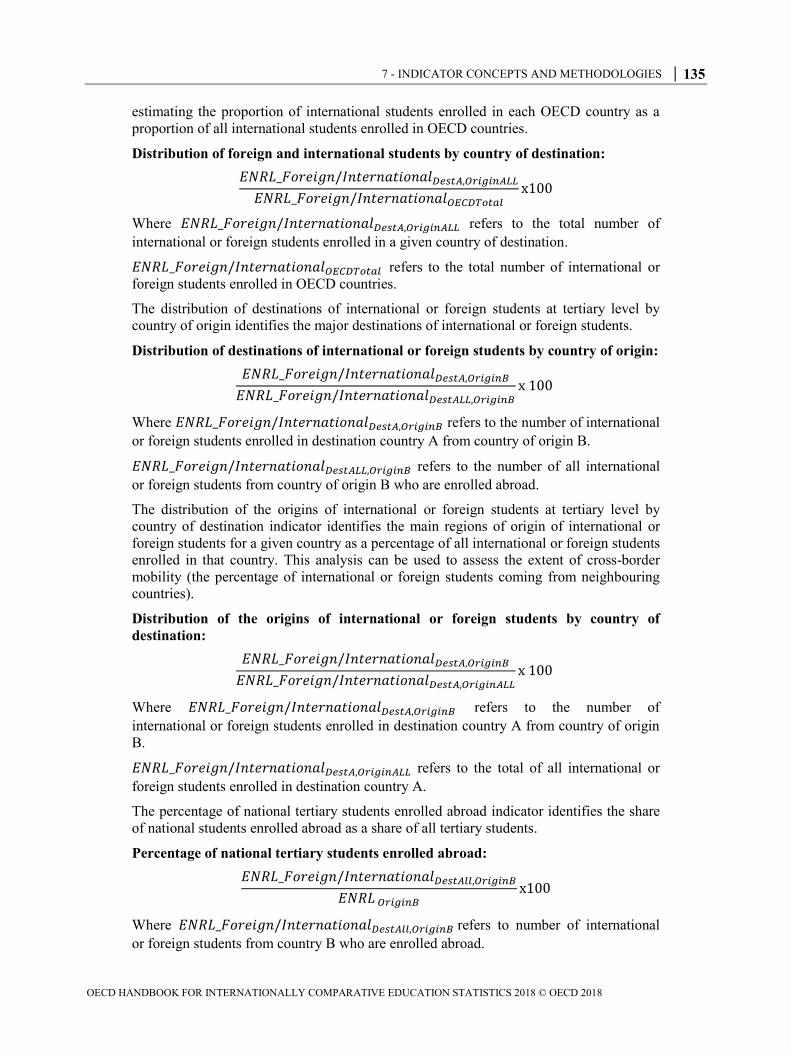
7 - INDICATOR CONCEPTS AND METHODOLOGIES │ 135
OECD HANDBOOK FOR INTERNATIONALLY COMPARATIVE EDUCATION STATISTICS 2018 © OECD 2018
estimating the proportion of international students enrolled in each OECD country as a
proportion of all international students enrolled in OECD countries.
Distribution of foreign and international students by country of destination:
𝐸𝑁𝑅𝐿_𝐹𝑜𝑟𝑒𝑖𝑔𝑛/𝐼𝑛𝑡𝑒𝑟𝑛𝑎𝑡𝑖𝑜𝑛𝑎𝑙𝐷𝑒𝑠𝑡𝐴,𝑂𝑟𝑖𝑔𝑖𝑛𝐴𝐿𝐿
𝐸𝑁𝑅𝐿_𝐹𝑜𝑟𝑒𝑖𝑔𝑛/𝐼𝑛𝑡𝑒𝑟𝑛𝑎𝑡𝑖𝑜𝑛𝑎𝑙𝑂𝐸𝐶𝐷𝑇𝑜𝑡𝑎𝑙x100
Where 𝐸𝑁𝑅𝐿_𝐹𝑜𝑟𝑒𝑖𝑔𝑛/𝐼𝑛𝑡𝑒𝑟𝑛𝑎𝑡𝑖𝑜𝑛𝑎𝑙𝐷𝑒𝑠𝑡𝐴,𝑂𝑟𝑖𝑔𝑖𝑛𝐴𝐿𝐿 refers to the total number of
international or foreign students enrolled in a given country of destination.
𝐸𝑁𝑅𝐿_𝐹𝑜𝑟𝑒𝑖𝑔𝑛/𝐼𝑛𝑡𝑒𝑟𝑛𝑎𝑡𝑖𝑜𝑛𝑎𝑙𝑂𝐸𝐶𝐷𝑇𝑜𝑡𝑎𝑙 refers to the total number of international or
foreign students enrolled in OECD countries.
The distribution of destinations of international or foreign students at tertiary level by
country of origin identifies the major destinations of international or foreign students.
Distribution of destinations of international or foreign students by country of origin:
𝐸𝑁𝑅𝐿_𝐹𝑜𝑟𝑒𝑖𝑔𝑛/𝐼𝑛𝑡𝑒𝑟𝑛𝑎𝑡𝑖𝑜𝑛𝑎𝑙𝐷𝑒𝑠𝑡𝐴,𝑂𝑟𝑖𝑔𝑖𝑛𝐵
𝐸𝑁𝑅𝐿_𝐹𝑜𝑟𝑒𝑖𝑔𝑛/𝐼𝑛𝑡𝑒𝑟𝑛𝑎𝑡𝑖𝑜𝑛𝑎𝑙𝐷𝑒𝑠𝑡𝐴𝐿𝐿,𝑂𝑟𝑖𝑔𝑖𝑛𝐵x 100
Where 𝐸𝑁𝑅𝐿_𝐹𝑜𝑟𝑒𝑖𝑔𝑛/𝐼𝑛𝑡𝑒𝑟𝑛𝑎𝑡𝑖𝑜𝑛𝑎𝑙𝐷𝑒𝑠𝑡𝐴,𝑂𝑟𝑖𝑔𝑖𝑛𝐵 refers to the number of international
or foreign students enrolled in destination country A from country of origin B.
𝐸𝑁𝑅𝐿_𝐹𝑜𝑟𝑒𝑖𝑔𝑛/𝐼𝑛𝑡𝑒𝑟𝑛𝑎𝑡𝑖𝑜𝑛𝑎𝑙𝐷𝑒𝑠𝑡𝐴𝐿𝐿,𝑂𝑟𝑖𝑔𝑖𝑛𝐵 refers to the number of all international
or foreign students from country of origin B who are enrolled abroad.
The distribution of the origins of international or foreign students at tertiary level by
country of destination indicator identifies the main regions of origin of international or
foreign students for a given country as a percentage of all international or foreign students
enrolled in that country. This analysis can be used to assess the extent of cross-border
mobility (the percentage of international or foreign students coming from neighbouring
countries).
Distribution of the origins of international or foreign students by country of
destination:
𝐸𝑁𝑅𝐿_𝐹𝑜𝑟𝑒𝑖𝑔𝑛/𝐼𝑛𝑡𝑒𝑟𝑛𝑎𝑡𝑖𝑜𝑛𝑎𝑙𝐷𝑒𝑠𝑡𝐴,𝑂𝑟𝑖𝑔𝑖𝑛𝐵
𝐸𝑁𝑅𝐿_𝐹𝑜𝑟𝑒𝑖𝑔𝑛/𝐼𝑛𝑡𝑒𝑟𝑛𝑎𝑡𝑖𝑜𝑛𝑎𝑙𝐷𝑒𝑠𝑡𝐴,𝑂𝑟𝑖𝑔𝑖𝑛𝐴𝐿𝐿x 100
Where 𝐸𝑁𝑅𝐿_𝐹𝑜𝑟𝑒𝑖𝑔𝑛/𝐼𝑛𝑡𝑒𝑟𝑛𝑎𝑡𝑖𝑜𝑛𝑎𝑙𝐷𝑒𝑠𝑡𝐴,𝑂𝑟𝑖𝑔𝑖𝑛𝐵 refers to the number of
international or foreign students enrolled in destination country A from country of origin
B.
𝐸𝑁𝑅𝐿_𝐹𝑜𝑟𝑒𝑖𝑔𝑛/𝐼𝑛𝑡𝑒𝑟𝑛𝑎𝑡𝑖𝑜𝑛𝑎𝑙𝐷𝑒𝑠𝑡𝐴,𝑂𝑟𝑖𝑔𝑖𝑛𝐴𝐿𝐿 refers to the total of all international or
foreign students enrolled in destination country A.
The percentage of national tertiary students enrolled abroad indicator identifies the share
of national students enrolled abroad as a share of all tertiary students.
Percentage of national tertiary students enrolled abroad:
𝐸𝑁𝑅𝐿_𝐹𝑜𝑟𝑒𝑖𝑔𝑛/𝐼𝑛𝑡𝑒𝑟𝑛𝑎𝑡𝑖𝑜𝑛𝑎𝑙𝐷𝑒𝑠𝑡𝐴𝑙𝑙,𝑂𝑟𝑖𝑔𝑖𝑛𝐵
𝐸𝑁𝑅𝐿 𝑂𝑟𝑖𝑔𝑖𝑛𝐵x100
Where 𝐸𝑁𝑅𝐿_𝐹𝑜𝑟𝑒𝑖𝑔𝑛/𝐼𝑛𝑡𝑒𝑟𝑛𝑎𝑡𝑖𝑜𝑛𝑎𝑙𝐷𝑒𝑠𝑡𝐴𝑙𝑙,𝑂𝑟𝑖𝑔𝑖𝑛𝐵 refers to number of international
or foreign students from country B who are enrolled abroad.

136 │ 7 - INDICATOR CONCEPTS AND METHODOLOGIES
OECD HANDBOOK FOR INTERNATIONALLY COMPARATIVE EDUCATION STATISTICS 2018 © OECD 2018
𝐸𝑁𝑅𝐿 𝑂𝑟𝑖𝑔𝑖𝑛𝐵 refers to total tertiary enrolment of students from country B.
The global balance of student mobility indicator identifies in relative terms the number of
international students in country A, compared to the number of students from country A
studying abroad. In other words, this indicator measures the balance for a given country
between incoming international or foreign students and outgoing national students
studying abroad.
Global balance of student mobility:
𝐸𝑁𝑅𝐿_𝐹𝑜𝑟𝑒𝑖𝑔𝑛/𝐼𝑛𝑡𝑒𝑟𝑛𝑎𝑡𝑖𝑜𝑛𝑎𝑙 𝐷𝑒𝑠𝑡𝐴,𝑂𝑟𝑖𝑔𝑖𝑛𝐴𝐿𝐿
𝐸𝑁𝑅𝐿_𝐹𝑜𝑟𝑒𝑖𝑔𝑛/𝐼𝑛𝑡𝑒𝑟𝑛𝑎𝑡𝑖𝑜𝑛𝑎𝑙𝐷𝑒𝑠𝑡𝐴𝐿𝐿,𝑂𝑟𝑖𝑔𝑖𝑛𝐴x100
Where 𝐸𝑁𝑅𝐿_𝐹𝑜𝑟𝑒𝑖𝑔𝑛/𝐼𝑛𝑡𝑒𝑟𝑛𝑎𝑡𝑖𝑜𝑛𝑎𝑙 𝐷𝑒𝑠𝑡𝐴,𝑂𝑟𝑖𝑔𝑖𝑛𝐴𝐿𝐿 refers to the number of
international or foreign students enrolled in country A.
𝐸𝑁𝑅𝐿_𝐹𝑜𝑟𝑒𝑖𝑔𝑛/𝐼𝑛𝑡𝑒𝑟𝑛𝑎𝑡𝑖𝑜𝑛𝑎𝑙𝐷𝑒𝑠𝑡𝐴𝐿𝐿,𝑂𝑟𝑖𝑔𝑖𝑛𝐴 refers to the number of international or
foreign students from country A who are enrolled abroad.
Change in the inflow of international or foreign enrolment (since 2013):
𝐸𝑁𝑅𝐿_𝐹𝑜𝑟𝑒𝑖𝑔𝑛/𝐼𝑛𝑡𝑒𝑟𝑛𝑎𝑡𝑖𝑜𝑛𝑎𝑙 𝐷𝑒𝑠𝑡𝐴,𝑂𝑟𝑖𝑔𝑖𝑛𝐴𝐿𝐿,2016
𝐸𝑁𝑅𝐿_𝐹𝑜𝑟𝑒𝑖𝑔𝑛/𝐼𝑛𝑡𝑒𝑟𝑛𝑎𝑡𝑖𝑜𝑛𝑎𝑙𝐷𝑒𝑠𝑡𝐴,𝑂𝑟𝑖𝑔𝑖𝑛𝐴𝐿𝐿,2013x100
Where 𝐸𝑁𝑅𝐿_𝐹𝑜𝑟𝑒𝑖𝑔𝑛/𝐼𝑛𝑡𝑒𝑟𝑛𝑎𝑡𝑖𝑜𝑛𝑎𝑙 𝐷𝑒𝑠𝑡𝐴,𝑂𝑟𝑖𝑔𝑖𝑛𝐴𝐿𝐿,2016 refers to the number of
international or foreign students enrolled in country A in 2016.
𝐸𝑁𝑅𝐿_𝐹𝑜𝑟𝑒𝑖𝑔𝑛/𝐼𝑛𝑡𝑒𝑟𝑛𝑎𝑡𝑖𝑜𝑛𝑎𝑙 𝐷𝑒𝑠𝑡𝐴,𝑂𝑟𝑖𝑔𝑖𝑛𝐴𝐿𝐿,2013 refers to the number of international
or foreign students enrolled in country A in 2013.
Change in the outflow of international or foreign enrolment towards OECD
countries (since 2013 ):
𝐸𝑁𝑅𝐿_𝐹𝑜𝑟𝑒𝑖𝑔𝑛/𝐼𝑛𝑡𝑒𝑟𝑛𝑎𝑡𝑖𝑜𝑛𝑎𝑙 𝐷𝑒𝑠𝑡𝐴𝐿𝐿,𝑂𝑟𝑖𝑔𝑖𝑛𝐴,2016
𝐸𝑁𝑅𝐿_𝐹𝑜𝑟𝑒𝑖𝑔𝑛/𝐼𝑛𝑡𝑒𝑟𝑛𝑎𝑡𝑖𝑜𝑛𝑎𝑙𝐷𝑒𝑠𝑡𝐴𝐿𝐿,𝑂𝑟𝑖𝑔𝑖𝑛𝐴,2013x100
Where 𝐸𝑁𝑅𝐿_𝐹𝑜𝑟𝑒𝑖𝑔𝑛/𝐼𝑛𝑡𝑒𝑟𝑛𝑎𝑡𝑖𝑜𝑛𝑎𝑙 𝐷𝑒𝑠𝑡𝐴𝐿𝐿,𝑂𝑟𝑖𝑔𝑖𝑛𝐴,2016 refers to the number of
international or foreign students from country A enrolled in OECD countries in 2016.
𝐸𝑁𝑅𝐿_𝐹𝑜𝑟𝑒𝑖𝑔𝑛/𝐼𝑛𝑡𝑒𝑟𝑛𝑎𝑡𝑖𝑜𝑛𝑎𝑙 𝐷𝑒𝑠𝑡𝐴𝐿𝐿,𝑂𝑟𝑖𝑔𝑖𝑛𝐴,2013 refers to the number of international
or foreign students from country A enrolled in OECD countries in 2013.
Limitations and further considerations
The data on students studying abroad are provided by the countries of destination.
As a result, the data by country of origin are normally comprehensive and cover
most of the countries in the world where students originate from. Data by country
of destination are not as complete, as the destinations include only the OECD
countries.
There is a distinction between “international students” and “foreign students”.
The measurement of student mobility depends to a large extent on country-
specific immigration legislation and constraints on data availability. Countries are
free to define “international students” as those who are not residents of their
country of study or as students who received their prior education in another
country. Some countries, which do not have information on international students,

7 - INDICATOR CONCEPTS AND METHODOLOGIES │ 137
OECD HANDBOOK FOR INTERNATIONALLY COMPARATIVE EDUCATION STATISTICS 2018 © OECD 2018
submit data on foreign students or students who are not citizens of the country in
which the data are collected. Using data on foreign students can overestimate the
number of tertiary students who go to a particular country for the purpose of
study.
Indicators are often presented with details by country of origin and by country of
destination. To identify results “by destination”, the total for all destinations
should reach 100%, and “by origin”, the total for all countries of origin should
reach 100%.
The distribution of international students among destination countries identifies
the top receiving countries in absolute terms but does not reflect the percentage of
international/foreign students in relative to tertiary enrolment in the host country.
For example, the United States is an attractive region for international students, as
the United States accounts for 18.6% of the total OECD destinations ( (OECD,
2016[5])) but international students make up only 4% of students in the United
States.
7.8. Participation of adults in education
7.8.1. Participation of adults in education
Policy context
As a result of globalisation and the development of new technologies, competition for
skills is fierce, particularly in high-growth, high-technology markets. In order to function
effectively in this context, an ever-larger segment of the population must be able to adapt
to changing technologies, and to learn and apply a new set of skills tailored to meet the
needs of the changing labour market.
As part of lifelong learning, adult learning is essential for upgrading the skills of the
labour force and considered crucial for meeting the challenges of economic
competitiveness and demographic change, and for combating unemployment, poverty and
social exclusion.
Calculation
This indicator measures the percentage of adults aged 25-64 participating in learning
activities to improve their technical or professional qualifications; further develop their
abilities; enrich their knowledge to complete a level of formal education; or to acquire,
refresh or update their knowledge, skills and competencies in a particular field. This also
includes what may be referred to as “continuing education”, “recurrent education” or
“second chance education”.
Distribution of the population participating in adult education:
𝑃𝑜𝑝𝑢𝑙𝑎𝑡𝑖𝑜𝑛25−64 𝑤ℎ𝑜 𝑝𝑎𝑟𝑡𝑖𝑐𝑖𝑝𝑎𝑡𝑒𝑑 𝑖𝑛 𝑙𝑒𝑎𝑟𝑛𝑖𝑛𝑔 𝑎𝑐𝑡𝑖𝑣𝑖𝑡𝑖𝑒𝑠
𝑃𝑜𝑝𝑢𝑙𝑎𝑡𝑖𝑜𝑛25−64
This indicator can be calculated for different age groups, or by gender, educational
attainment level, literacy or numeracy proficiency level and employment status.
All data are based on the Survey of Adult Skills (PIAAC). PIAAC is the OECD
Programme for the International Assessment of Adult Competencies. For more
information on PIAAC please consult (OECD, 2016[6]).
138 │ 7 - INDICATOR CONCEPTS AND METHODOLOGIES
OECD HANDBOOK FOR INTERNATIONALLY COMPARATIVE EDUCATION STATISTICS 2018 © OECD 2018
Limitations and further considerations
The large variation in adult learning activities and participation among OECD
countries at similar levels of economic development suggests that there are
significant differences in learning cultures, learning opportunities at work and
adult education structures.
7.9. Learning environment and teacher working conditions analysis
Five main indicators have been developed to describe the learning environment and
teachers’ working conditions: instruction time in compulsory education, average class
size and student-teacher ratio, teachers’ salaries, teaching time, and the age and gender
profiles of teachers.
7.9.1. Instruction time
Policy context
Providing instruction in formal classroom settings accounts for a large portion of public
investment in education. Countries make various choices about the duration of
compulsory education, the overall amount of time devoted to instruction and which
subjects are compulsory. These choices reflect national and/or regional priorities and
preferences concerning what material students should be taught and at what age.
Countries usually have statutory or regulatory requirements regarding hours of
instruction. These are most often stipulated as the minimum number of hours of
instruction a school must offer, and are based on the understanding that sufficient
instruction time is required for good learning outcomes. Matching resources with
students’ needs and making optimal use of time are central to education policy. Teachers’
salaries, institutional maintenance and provision of other educational resources constitute
the main costs of education. The length of time during which these resources are made
available to students (as partly shown in this indicator) is an important factor in
determining how funds for education are allocated.
Calculation
Instruction time refers to the number of hours per year of the compulsory and non-
compulsory part of the curriculum that students are entitled to receive in public schools.
Instruction time at primary and/or lower secondary education:
∑ Instruction time at a given level of education
The intended curriculum can be based on regulations or standards of the central (or top-
level) education authorities or may be established as a set of recommendations at the
regional level (see definition of instruction time in Chapter 4, Section 4.3.1).
Limitations and further considerations
Data only cover compulsory education from the first year of primary education
until the end of full-time compulsory education for all students. In grades where
vocational and general programmes co-exist, it only refers to the general
programmes. Pre-primary education programmes, even if compulsory, are not
within the scope of the present data collection.

7 - INDICATOR CONCEPTS AND METHODOLOGIES │ 139
OECD HANDBOOK FOR INTERNATIONALLY COMPARATIVE EDUCATION STATISTICS 2018 © OECD 2018
The compulsory curriculum refers to the amount and allocation of instruction that
has to be provided in almost every public school and must be attended by almost
all public sector students. The compulsory curriculum may be flexible, with local
authorities, schools, teachers and/or pupils having varying degrees of freedom to
choose the subjects and/or the allocation of compulsory instruction time. It does
not show the actual number of hours of instruction that students receive and does
not cover learning outside of the formal classroom setting. The regulatory
minimum hours of instruction and the actual hours of instruction received by
students may differ from country to country.
Non-compulsory instruction time (within compulsory education) could also be
measured but is rare across OECD countries. The non-compulsory part of the
curriculum refers to the total amount of instruction time to which students are
entitled beyond the compulsory hours of instruction and which almost every
public school is expected to provide. Subjects can vary from school to school or
from region to region and take the form of elective subjects. Students are not
required to choose one of the elective subjects, but all public schools are expected
to offer the option.
7.9.2. Average class size and student-teacher ratio
Policy context
Student learning and academic achievement could be improved when fewer students are
participating together in learning activities. The basic rationale is that teachers who have
fewer students can devote more time and attention to each student, including identifying
their specific learning needs, and that the burden of managing large numbers of students
(such as classroom disruptions) is lower. But the predominance of teachers’ salary costs
in educational expenditure means reducing class sizes leads to increases in the costs of
education. Two indicators provide empirical evidence to this debate: student-teacher ratio
and class size.
Calculation
The concept of student-teacher ratio is different from that of class size. Student-teacher
ratio provides information on the level of teaching resources available in a country,
whereas class size measures the average number of students are grouped together in
classrooms.
Average class size:
𝑆𝑡𝑢𝑑𝑒𝑛𝑡𝑠 𝐸𝑑𝑢𝑐𝐿𝑒𝑣𝑒𝑙
𝐶𝑙𝑎𝑠𝑠𝑒𝑠 𝐸𝑑𝑢𝑐𝐿𝑒𝑣𝑒𝑙
Where 𝑆𝑡𝑢𝑑𝑒𝑛𝑡𝑠𝐸𝑑𝑢𝑐𝐿𝑒𝑣𝑒𝑙is the total number of students enrolled at a specific level of
education and 𝐶𝑙𝑎𝑠𝑠𝑒𝑠𝐸𝑑𝑢𝑐𝐿𝑒𝑣𝑒𝑙is the total number of classes at the same level of
education, excluding those taught in subdivisions and excluding special needs classes.
Ratio of students to teaching staff:
𝐹𝑇𝐸 𝑆𝑡𝑢𝑑𝑒𝑛𝑡𝑠 𝐸𝑑𝑢𝑐𝐿𝑒𝑣𝑒𝑙
𝐹𝑇𝐸 𝑇𝑒𝑎𝑐ℎ𝑒𝑟𝑠 𝐸𝑑𝑢𝑐𝐿𝑒𝑣𝑒𝑙

140 │ 7 - INDICATOR CONCEPTS AND METHODOLOGIES
OECD HANDBOOK FOR INTERNATIONALLY COMPARATIVE EDUCATION STATISTICS 2018 © OECD 2018
Where 𝐹𝑇𝐸 𝑆𝑡𝑢𝑑𝑒𝑛𝑡𝑠𝐸𝑑𝑢𝑐𝐿𝑒𝑣𝑒𝑙 is the total number of full-time equivalent students enrolled
at a specific level of education and 𝐹𝑇𝐸 𝑇𝑒𝑎𝑐ℎ𝑒𝑟𝑠𝐸𝑑𝑢𝑐𝐿𝑒𝑣𝑒𝑙is the total number of full-time
equivalent teachers enrolled at the same level (see the definition of FTE in Chapter 4,
Section 4.1.9). Teachers refer to professional personnel directly involved in teaching
students: classroom teachers, special education teachers and other teachers who work with
students as a whole class in a classroom, in small groups in a resource room, or in one-to-
one teaching inside or outside a regular classroom. This does not include teachers’ aides
and other paraprofessional personnel.
Limitations and further considerations
Although one country may have a lower ratio of students to teaching staff than
another, this does not necessarily mean that classes are smaller in the first country
or that students in the first country receive more teaching. The relationship
between the ratio of students to teaching staff and average class size is
complicated by many factors, including differences between countries in the
length of the school year, the annual number of hours for which a student attends
class, the annual time teachers are expected to spend teaching, the grouping of
students within classes and the practice of team teaching.
Calculating the number of classes over the course of a school year can be
complicated if classes subdivide into groups for certain parts of the curriculum. For
example, if a class of 20 students receive tuition together for all but 1 lesson when
the class splits into 2 groups of 10, it would be misleading to give the 2 classes of
10 students equal weight to the single class with 20 students. For simplicity, when
calculating class size at primary and lower secondary, where such splitting of classes
is less prevalent, the advice given is to exclude the subdivisions from the
calculation. On the other hand, at upper secondary level it would be advisable to
weight the subdivisions according to the proportion of the school week they account
for, though a methodology has not yet been established for this.
For the ratio of students to teachers to be meaningful, consistent coverage of
personnel and enrolment data are needed. For instance, if teachers in religious
schools are not reported in the personnel data, then students in those schools must
also be excluded.
Because of the difficulty of constructing direct measures of educational quality,
this indicator is also often used as a proxy for quality, on the assumption that a
smaller ratio of students to teaching staff means better access by students to
teaching resources. However, a low ratio of students to teaching staff does not
necessarily mean better access to teaching and to educational support and may
simply be a symptom of ineffective use of human resources. On the other hand, a
very high ratio of students to teaching staff certainly suggests insufficient
professional support for learning, particularly for students from disadvantaged
home backgrounds. Such inferences need to be made with great care since many
other factors influence learning outcomes. A reduction in the ratio of students to
teaching staff may have to be weighed against higher salaries for teachers, greater
investment in teaching technology, or more widespread use of assistant teachers
and other paraprofessionals, whose salaries are often considerably lower than
those of qualified teachers.
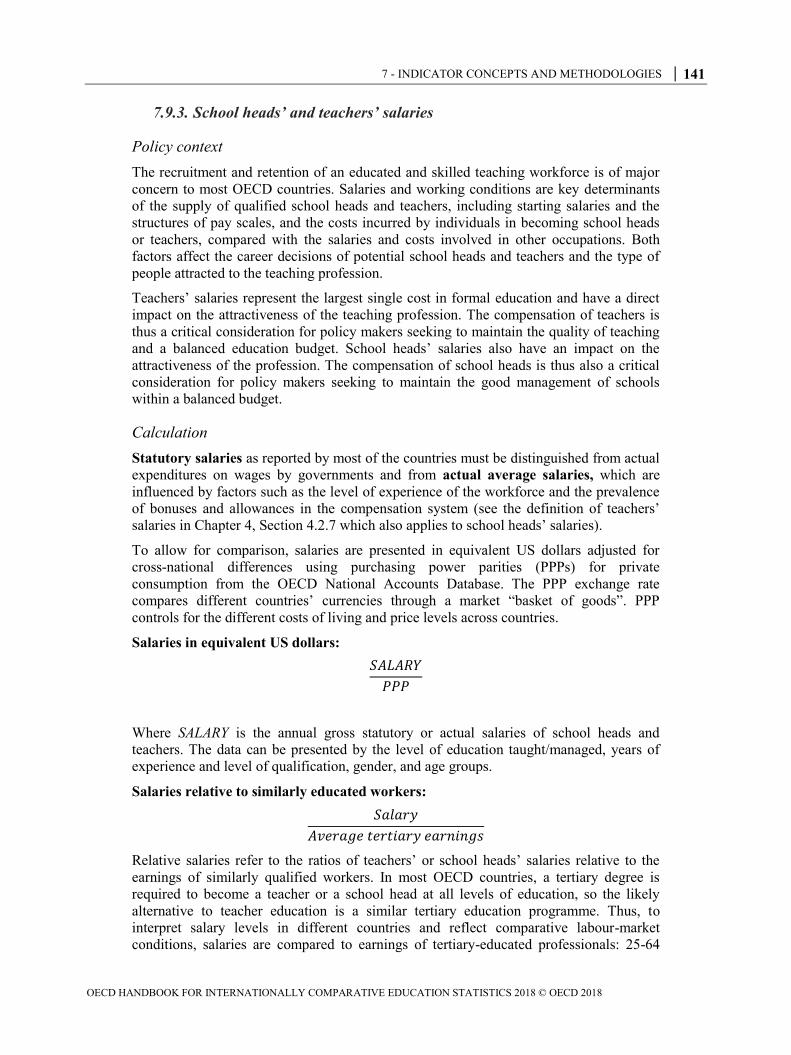
7 - INDICATOR CONCEPTS AND METHODOLOGIES │ 141
OECD HANDBOOK FOR INTERNATIONALLY COMPARATIVE EDUCATION STATISTICS 2018 © OECD 2018
7.9.3. School heads’ and teachers’ salaries
Policy context
The recruitment and retention of an educated and skilled teaching workforce is of major
concern to most OECD countries. Salaries and working conditions are key determinants
of the supply of qualified school heads and teachers, including starting salaries and the
structures of pay scales, and the costs incurred by individuals in becoming school heads
or teachers, compared with the salaries and costs involved in other occupations. Both
factors affect the career decisions of potential school heads and teachers and the type of
people attracted to the teaching profession.
Teachers’ salaries represent the largest single cost in formal education and have a direct
impact on the attractiveness of the teaching profession. The compensation of teachers is
thus a critical consideration for policy makers seeking to maintain the quality of teaching
and a balanced education budget. School heads’ salaries also have an impact on the
attractiveness of the profession. The compensation of school heads is thus also a critical
consideration for policy makers seeking to maintain the good management of schools
within a balanced budget.
Calculation
Statutory salaries as reported by most of the countries must be distinguished from actual
expenditures on wages by governments and from actual average salaries, which are
influenced by factors such as the level of experience of the workforce and the prevalence
of bonuses and allowances in the compensation system (see the definition of teachers’
salaries in Chapter 4, Section 4.2.7 which also applies to school heads’ salaries).
To allow for comparison, salaries are presented in equivalent US dollars adjusted for
cross-national differences using purchasing power parities (PPPs) for private
consumption from the OECD National Accounts Database. The PPP exchange rate
compares different countries’ currencies through a market “basket of goods”. PPP
controls for the different costs of living and price levels across countries.
Salaries in equivalent US dollars:
𝑆𝐴𝐿𝐴𝑅𝑌
𝑃𝑃𝑃
Where SALARY is the annual gross statutory or actual salaries of school heads and
teachers. The data can be presented by the level of education taught/managed, years of
experience and level of qualification, gender, and age groups.
Salaries relative to similarly educated workers:
𝑆𝑎𝑙𝑎𝑟𝑦
𝐴𝑣𝑒𝑟𝑎𝑔𝑒 𝑡𝑒𝑟𝑡𝑖𝑎𝑟𝑦 𝑒𝑎𝑟𝑛𝑖𝑛𝑔𝑠
Relative salaries refer to the ratios of teachers’ or school heads’ salaries relative to the
earnings of similarly qualified workers. In most OECD countries, a tertiary degree is
required to become a teacher or a school head at all levels of education, so the likely
alternative to teacher education is a similar tertiary education programme. Thus, to
interpret salary levels in different countries and reflect comparative labour-market
conditions, salaries are compared to earnings of tertiary-educated professionals: 25-64

142 │ 7 - INDICATOR CONCEPTS AND METHODOLOGIES
OECD HANDBOOK FOR INTERNATIONALLY COMPARATIVE EDUCATION STATISTICS 2018 © OECD 2018
year-old full-time, full-year workers with a similar tertiary education. Two methodologies
are available when considering the average tertiary earnings to be used in the computation
of relative salaries:
The ratios based on weighted averages. This methodology is used to ensure that
the comparison between teachers’ salaries and earnings of tertiary-educated
workers is not distorted by differences between the distribution of teachers by
tertiary attainment and the distribution of tertiary-educated workers by attainment
level. According to this method, the salaries of teachers are compared to a
weighted average of earnings of similarly educated workers. The weighted
average is calculated based on the distribution of teachers with each level of
attainment. This weighted average is then used as the denominator when data are
available on the wages (i.e. the earnings of full-time full-year workers) broken
down by ISCED level of tertiary attainment.
The ratios based on average earnings of all tertiary-educated workers. This
method is used when the distribution of teachers by attainment level is not
available and/or the earnings of tertiary-educated workers by tertiary attainment
are not available.
These methods are used to calculate relative salary of teachers or school heads for
both statutory and actual salaries.
When data on earnings of workers refer to a different reference year than the year used
for teachers’ salaries, a deflator is used to adjust the earnings data to the same reference
year as that of teachers.
Limitations and further considerations
School heads’ and teachers’ salaries refer to salaries in public pre-primary,
primary, lower and upper secondary institutions.
School heads’ and teachers’ salaries can also be presented relative to earnings for
similarly educated workers (based on the two different methods noted above).
Data on workers’ earnings take account of earnings from work of all individuals
during the reference period, including those of teachers. In most countries, the
population of teachers is large and may impact the average earnings of workers.
Teachers’ statutory salaries are given at four different points in their careers to
provide a relative range of earnings: starting salaries, salaries after 10 years of
experience, salaries after 15 years of experience and salaries at the top of the
scale. Statutory salaries are also presented for three qualification levels of
teachers. In addition to salary ranges, most countries use a complex system of
bonuses to increase basic salaries and reward qualifications and performance in
teaching. These additional payments, which are currently not reflected in this
indicator, may explain certain differences between statutory scheduled salaries
and actual average salaries. As a result, the international comparison of basic
salaries will be a biased approximation of actual teachers’ monetary incentives
depending on countries’ relative emphasis on bonuses or base salaries.
Teachers’ salaries per hour of net contact (teaching) time after 15 years of
experience are also given. This provides a measure of statutory salary relative to
the number of hours per year that a full-time teacher teaches a group or class of
students according to the formal policy in that country. However, this does not
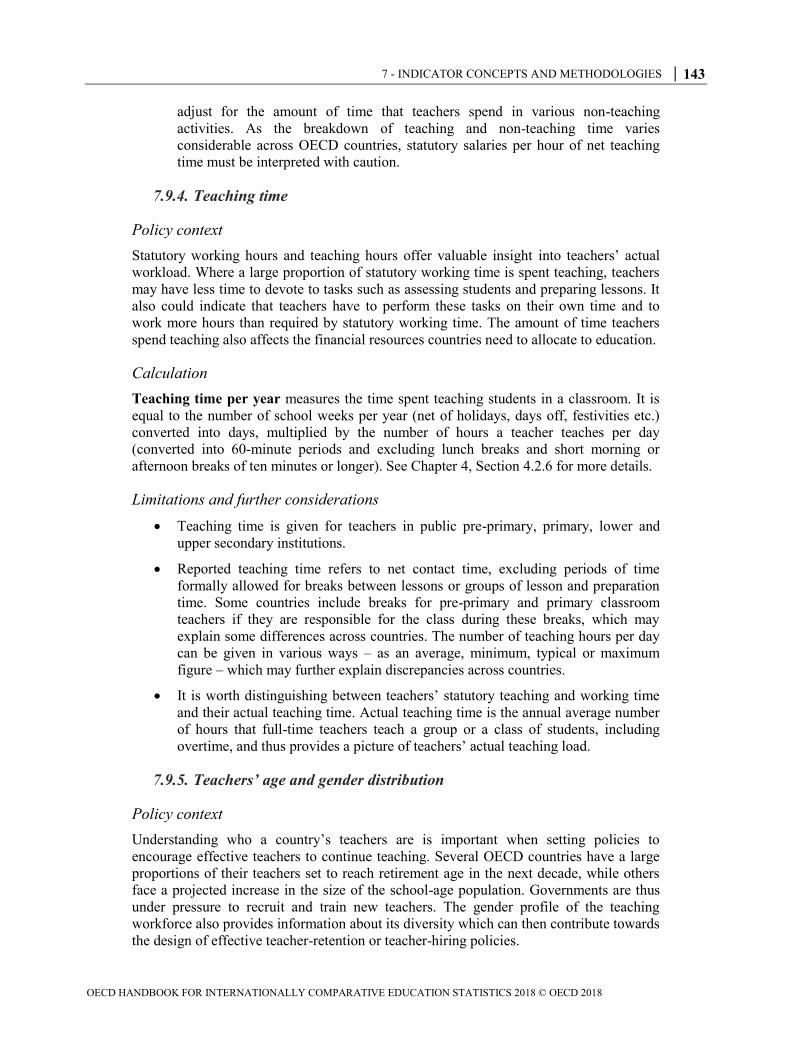
7 - INDICATOR CONCEPTS AND METHODOLOGIES │ 143
OECD HANDBOOK FOR INTERNATIONALLY COMPARATIVE EDUCATION STATISTICS 2018 © OECD 2018
adjust for the amount of time that teachers spend in various non-teaching
activities. As the breakdown of teaching and non-teaching time varies
considerable across OECD countries, statutory salaries per hour of net teaching
time must be interpreted with caution.
7.9.4. Teaching time
Policy context
Statutory working hours and teaching hours offer valuable insight into teachers’ actual
workload. Where a large proportion of statutory working time is spent teaching, teachers
may have less time to devote to tasks such as assessing students and preparing lessons. It
also could indicate that teachers have to perform these tasks on their own time and to
work more hours than required by statutory working time. The amount of time teachers
spend teaching also affects the financial resources countries need to allocate to education.
Calculation
Teaching time per year measures the time spent teaching students in a classroom. It is
equal to the number of school weeks per year (net of holidays, days off, festivities etc.)
converted into days, multiplied by the number of hours a teacher teaches per day
(converted into 60-minute periods and excluding lunch breaks and short morning or
afternoon breaks of ten minutes or longer). See Chapter 4, Section 4.2.6 for more details.
Limitations and further considerations
Teaching time is given for teachers in public pre-primary, primary, lower and
upper secondary institutions.
Reported teaching time refers to net contact time, excluding periods of time
formally allowed for breaks between lessons or groups of lesson and preparation
time. Some countries include breaks for pre-primary and primary classroom
teachers if they are responsible for the class during these breaks, which may
explain some differences across countries. The number of teaching hours per day
can be given in various ways – as an average, minimum, typical or maximum
figure – which may further explain discrepancies across countries.
It is worth distinguishing between teachers’ statutory teaching and working time
and their actual teaching time. Actual teaching time is the annual average number
of hours that full-time teachers teach a group or a class of students, including
overtime, and thus provides a picture of teachers’ actual teaching load.
7.9.5. Teachers’ age and gender distribution
Policy context
Understanding who a country’s teachers are is important when setting policies to
encourage effective teachers to continue teaching. Several OECD countries have a large
proportions of their teachers set to reach retirement age in the next decade, while others
face a projected increase in the size of the school-age population. Governments are thus
under pressure to recruit and train new teachers. The gender profile of the teaching
workforce also provides information about its diversity which can then contribute towards
the design of effective teacher-retention or teacher-hiring policies.

144 │ 7 - INDICATOR CONCEPTS AND METHODOLOGIES
OECD HANDBOOK FOR INTERNATIONALLY COMPARATIVE EDUCATION STATISTICS 2018 © OECD 2018
Calculation
The same methodology is used to estimate age and gender distributions.
The age distribution indicator measures the share of teachers of a given age out of the
total teaching workforce at a given ISCED level (UNESCO-UIS / OECD / EUROSTAT,
2017[2]).
Age distribution of teachers:
𝑇𝑒𝑎𝑐ℎ𝑒𝑟𝑠𝐴𝑔𝑒,𝐸𝑑𝑢𝑐𝐿𝑒𝑣𝑒𝑙
𝑇𝑒𝑎𝑐ℎ𝑒𝑟𝑠𝑇𝑜𝑡𝑎𝑙,𝐸𝑑𝑢𝑐𝐿𝑒𝑣𝑒𝑙
Where 𝑇𝑒𝑎𝑐ℎ𝑒𝑟𝑠𝐴𝑔𝑒,𝐸𝑑𝑢𝑐𝐿𝑒𝑣𝑒𝑙 is the number of teachers in public and private institutions
based on head counts, by age group and by level of education.
𝑇𝑒𝑎𝑐ℎ𝑒𝑟𝑠𝑇𝑜𝑡𝑎𝑙,𝐸𝑑𝑢𝑐𝐿𝑒𝑣𝑒𝑙 is the total number of teachers at that level of education minus
the number of teachers reported as “age unknown”.
This gender distribution indicator measures the share of teachers by gender out of the
total teaching workforce at a given ISCED level.
Gender distribution of teachers:
𝑇𝑒𝑎𝑐ℎ𝑒𝑟𝑠𝐺𝑒𝑛𝑑𝑒𝑟,𝐸𝑑𝑢𝑐𝐿𝑒𝑣𝑒𝑙
𝑇𝑒𝑎𝑐ℎ𝑒𝑟𝑠𝑇𝑜𝑡𝑎𝑙,𝐸𝑑𝑢𝑐𝐿𝑒𝑣𝑒𝑙
Where 𝑇𝑒𝑎𝑐ℎ𝑒𝑟𝑠𝐺𝑒𝑛𝑑𝑒𝑟,𝐸𝑑𝑢𝑐𝐿𝑒𝑣𝑒𝑙 is the number of teachers in public and private
institutions based on head counts, by gender and by level of education.
𝑇𝑒𝑎𝑐ℎ𝑒𝑟𝑠𝑇𝑜𝑡𝑎𝑙,𝐸𝑑𝑢𝑐𝐿𝑒𝑣𝑒𝑙 is the total number of teachers at that level of education.
Limitations and further considerations
If the number of teachers reported as “age unknown” is 30% or more of the total
number of teachers then the age distribution is not calculated.
It would be worth studying the potential impact of gender imbalances in the
teaching profession on student achievement, student motivation and teacher
retention, especially in countries where few men are attracted to the profession,
but there is little evidence that a teacher’s gender has an impact on student
performance.
7.10. Education and work status of young people: The NEET rate
7.10.1. Education and work status of young people: The NEET rate
Policy context
The transition of younger individuals from education to working life varies with
education opportunities and social and economic contexts. The percentage of people
neither employed, nor in education or training (NEET) provides a clear picture of the
labour-market situation of young people across different education pathways.

7 - INDICATOR CONCEPTS AND METHODOLOGIES │ 145
OECD HANDBOOK FOR INTERNATIONALLY COMPARATIVE EDUCATION STATISTICS 2018 © OECD 2018
Calculation
This indicator analyses the situation of young people in transition: whether they are in
education, employed or are neither employed nor in education or training during the
reference period. This includes not only those who have not managed to find a job
(unemployed NEETs), but also those who are not actively seeking employment (inactive
NEETs).
𝑁𝑜𝑡𝐼𝑛𝐸𝑑𝑢𝑐𝑎𝑡𝑖𝑜𝑛𝐴𝑔𝑒,𝐺𝑒𝑛𝑑𝑒𝑟 ∩ [𝑈𝑛𝑒𝑚𝑝𝑙𝑜𝑦𝑒𝑑𝐴𝑔𝑒,𝐺𝑒𝑛𝑑𝑒𝑟 + 𝐼𝑛𝑎𝑐𝑡𝑖𝑣𝑒𝐴𝑔𝑒,𝐺𝑒𝑛𝑑𝑒𝑟]
𝑃𝑜𝑝𝑢𝑙𝑎𝑡𝑖𝑜𝑛𝐴𝑔𝑒,𝐺𝑒𝑛𝑑𝑒𝑟
Where 𝑁𝑜𝑡𝐼𝑛𝐸𝑑𝑢𝑐𝑎𝑡𝑖𝑜𝑛𝐴𝑔𝑒,𝐺𝑒𝑛𝑑𝑒𝑟 ∩ [𝑈𝑛𝑒𝑚𝑝𝑙𝑜𝑦𝑒𝑑𝐴𝑔𝑒,𝐺𝑒𝑛𝑑𝑒𝑟 + 𝐼𝑛𝑎𝑐𝑡𝑖𝑣𝑒𝐴𝑔𝑒,𝐺𝑒𝑛𝑑𝑒𝑟 is
the number of young people of a given age (between 15 and 29 years old) and gender not
in education and unemployed or inactive, and 𝑃𝑜𝑝𝑢𝑙𝑎𝑡𝑖𝑜𝑛𝐴𝑔𝑒,𝐺𝑒𝑛𝑑𝑒𝑟 is the total
population of younger adults of that age and gender.
The sources for these data for most countries are the national labour force surveys (LFSs).
Limitations and further considerations
Data disaggregated by educational attainment may underestimate or overestimate
certain educational levels as a significant share of 15-29 year-olds are still in
education and gaining a higher educational attainment level.
Education status is understood in terms of education and/or training currently
being received in the regular educational system, which could be during the
previous four weeks (including the survey reference week) or over a shorter
period. Some countries may include some people who are not classified as being
in formal education, but who are in training (or education) for employment or for
tertiary entrance examinations.
7.11. Equity in education: Intergenerational mobility indicators
7.11.1. Equity in education: Intergenerational mobility indicators
Policy context
Education opportunities can promote inclusive growth and reduce inequality in societies
through improved employment opportunities, higher earnings and overall wealth.
However, inequalities in educational attainment sometimes persist over generations,
leading to widening inequality. To facilitate social inclusion, mobility and improve socio-
economic outcomes now and for future generations, countries need to assure students
have access to quality education. One way to measure this is through the progress in
educational attainment across different generations, also known as intergenerational
educational mobility.
Calculation
Intergenerational mobility in educational attainment refers to the proportion of
individuals whose highest level of qualification is different (whether higher or lower)
from their parents.
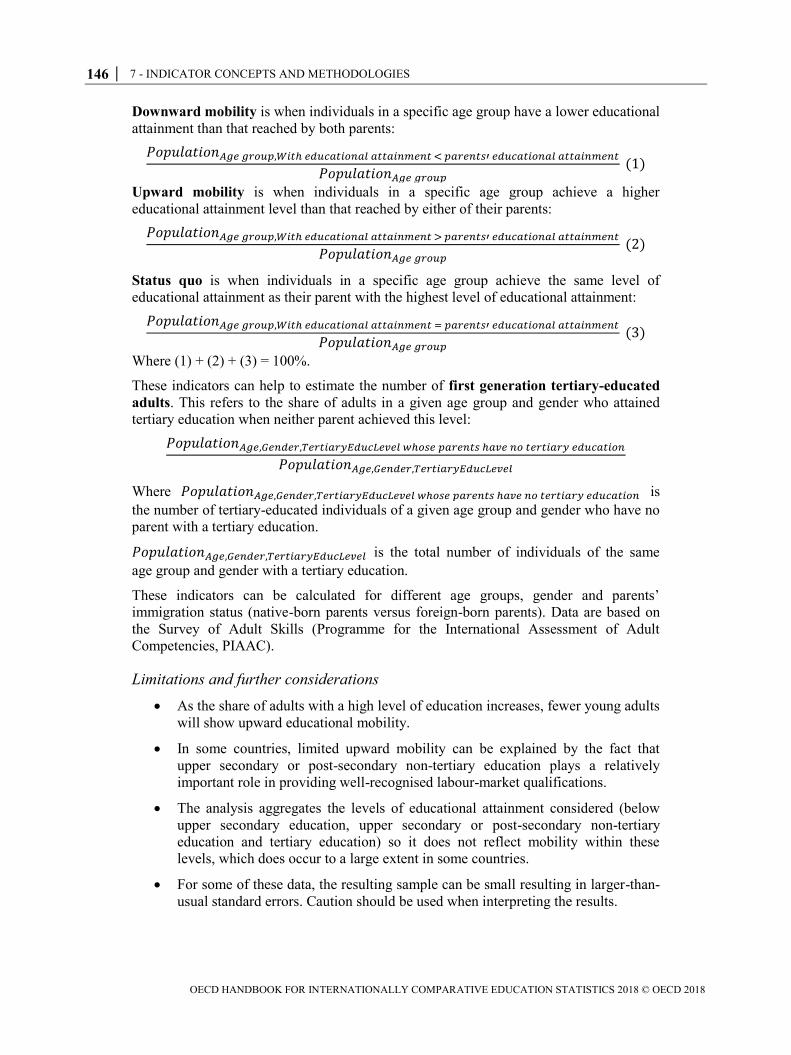
146 │ 7 - INDICATOR CONCEPTS AND METHODOLOGIES
OECD HANDBOOK FOR INTERNATIONALLY COMPARATIVE EDUCATION STATISTICS 2018 © OECD 2018
Downward mobility is when individuals in a specific age group have a lower educational
attainment than that reached by both parents:
𝑃𝑜𝑝𝑢𝑙𝑎𝑡𝑖𝑜𝑛𝐴𝑔𝑒 𝑔𝑟𝑜𝑢𝑝,𝑊𝑖𝑡ℎ 𝑒𝑑𝑢𝑐𝑎𝑡𝑖𝑜𝑛𝑎𝑙 𝑎𝑡𝑡𝑎𝑖𝑛𝑚𝑒𝑛𝑡 < 𝑝𝑎𝑟𝑒𝑛𝑡𝑠′ 𝑒𝑑𝑢𝑐𝑎𝑡𝑖𝑜𝑛𝑎𝑙 𝑎𝑡𝑡𝑎𝑖𝑛𝑚𝑒𝑛𝑡
𝑃𝑜𝑝𝑢𝑙𝑎𝑡𝑖𝑜𝑛𝐴𝑔𝑒 𝑔𝑟𝑜𝑢𝑝 (1)
Upward mobility is when individuals in a specific age group achieve a higher
educational attainment level than that reached by either of their parents:
𝑃𝑜𝑝𝑢𝑙𝑎𝑡𝑖𝑜𝑛𝐴𝑔𝑒 𝑔𝑟𝑜𝑢𝑝,𝑊𝑖𝑡ℎ 𝑒𝑑𝑢𝑐𝑎𝑡𝑖𝑜𝑛𝑎𝑙 𝑎𝑡𝑡𝑎𝑖𝑛𝑚𝑒𝑛𝑡 > 𝑝𝑎𝑟𝑒𝑛𝑡𝑠′ 𝑒𝑑𝑢𝑐𝑎𝑡𝑖𝑜𝑛𝑎𝑙 𝑎𝑡𝑡𝑎𝑖𝑛𝑚𝑒𝑛𝑡
𝑃𝑜𝑝𝑢𝑙𝑎𝑡𝑖𝑜𝑛𝐴𝑔𝑒 𝑔𝑟𝑜𝑢𝑝 (2)
Status quo is when individuals in a specific age group achieve the same level of
educational attainment as their parent with the highest level of educational attainment:
𝑃𝑜𝑝𝑢𝑙𝑎𝑡𝑖𝑜𝑛𝐴𝑔𝑒 𝑔𝑟𝑜𝑢𝑝,𝑊𝑖𝑡ℎ 𝑒𝑑𝑢𝑐𝑎𝑡𝑖𝑜𝑛𝑎𝑙 𝑎𝑡𝑡𝑎𝑖𝑛𝑚𝑒𝑛𝑡 = 𝑝𝑎𝑟𝑒𝑛𝑡𝑠′ 𝑒𝑑𝑢𝑐𝑎𝑡𝑖𝑜𝑛𝑎𝑙 𝑎𝑡𝑡𝑎𝑖𝑛𝑚𝑒𝑛𝑡
𝑃𝑜𝑝𝑢𝑙𝑎𝑡𝑖𝑜𝑛𝐴𝑔𝑒 𝑔𝑟𝑜𝑢𝑝 (3)
Where (1) + (2) + (3) = 100%.
These indicators can help to estimate the number of first generation tertiary-educated
adults. This refers to the share of adults in a given age group and gender who attained
tertiary education when neither parent achieved this level:
𝑃𝑜𝑝𝑢𝑙𝑎𝑡𝑖𝑜𝑛𝐴𝑔𝑒,𝐺𝑒𝑛𝑑𝑒𝑟,𝑇𝑒𝑟𝑡𝑖𝑎𝑟𝑦𝐸𝑑𝑢𝑐𝐿𝑒𝑣𝑒𝑙 𝑤ℎ𝑜𝑠𝑒 𝑝𝑎𝑟𝑒𝑛𝑡𝑠 ℎ𝑎𝑣𝑒 𝑛𝑜 𝑡𝑒𝑟𝑡𝑖𝑎𝑟𝑦 𝑒𝑑𝑢𝑐𝑎𝑡𝑖𝑜𝑛
𝑃𝑜𝑝𝑢𝑙𝑎𝑡𝑖𝑜𝑛𝐴𝑔𝑒,𝐺𝑒𝑛𝑑𝑒𝑟,𝑇𝑒𝑟𝑡𝑖𝑎𝑟𝑦𝐸𝑑𝑢𝑐𝐿𝑒𝑣𝑒𝑙
Where 𝑃𝑜𝑝𝑢𝑙𝑎𝑡𝑖𝑜𝑛𝐴𝑔𝑒,𝐺𝑒𝑛𝑑𝑒𝑟,𝑇𝑒𝑟𝑡𝑖𝑎𝑟𝑦𝐸𝑑𝑢𝑐𝐿𝑒𝑣𝑒𝑙 𝑤ℎ𝑜𝑠𝑒 𝑝𝑎𝑟𝑒𝑛𝑡𝑠 ℎ𝑎𝑣𝑒 𝑛𝑜 𝑡𝑒𝑟𝑡𝑖𝑎𝑟𝑦 𝑒𝑑𝑢𝑐𝑎𝑡𝑖𝑜𝑛 is
the number of tertiary-educated individuals of a given age group and gender who have no
parent with a tertiary education.
𝑃𝑜𝑝𝑢𝑙𝑎𝑡𝑖𝑜𝑛𝐴𝑔𝑒,𝐺𝑒𝑛𝑑𝑒𝑟,𝑇𝑒𝑟𝑡𝑖𝑎𝑟𝑦𝐸𝑑𝑢𝑐𝐿𝑒𝑣𝑒𝑙 is the total number of individuals of the same
age group and gender with a tertiary education.
These indicators can be calculated for different age groups, gender and parents’
immigration status (native-born parents versus foreign-born parents). Data are based on
the Survey of Adult Skills (Programme for the International Assessment of Adult
Competencies, PIAAC).
Limitations and further considerations
As the share of adults with a high level of education increases, fewer young adults
will show upward educational mobility.
In some countries, limited upward mobility can be explained by the fact that
upper secondary or post-secondary non-tertiary education plays a relatively
important role in providing well-recognised labour-market qualifications.
The analysis aggregates the levels of educational attainment considered (below
upper secondary education, upper secondary or post-secondary non-tertiary
education and tertiary education) so it does not reflect mobility within these
levels, which does occur to a large extent in some countries.
For some of these data, the resulting sample can be small resulting in larger-than-
usual standard errors. Caution should be used when interpreting the results.
7 - INDICATOR CONCEPTS AND METHODOLOGIES │ 147
OECD HANDBOOK FOR INTERNATIONALLY COMPARATIVE EDUCATION STATISTICS 2018 © OECD 2018
References
OECD (2018), Education at a Glance 2018: OECD Indicators, OECD Publishing, Paris,
http://dx.doi.org/10.1787/eag-2018-en.
[1]
OECD (2017), Education at a Glance 2017: OECD Indicators, OECD Publishing, Paris,
http://dx.doi.org/10.1787/eag-2017-en.
[3]
OECD (2016), Education at a Glance 2016: OECD Indicators, OECD Publishing, Paris,
http://dx.doi.org/10.1787/eag-2016-en.
[5]
OECD (2016), Technical Report of the Survey of Adult Skills (PIAAC), 2nd Edition, OECD,
Paris,
http://www.oecd.org/skills/piaac/PIAAC_Technical_Report_2nd_Edition_Full_Report.pdf.
[6]
OECD (2015), Taxing Wages 2015, OECD Publishing, Paris,
http://dx.doi.org/10.1787/tax_wages-2015-en.
[4]
UNESCO-UIS / OECD / EUROSTAT (2017), UOE Data Collection on Formal Education.
Manual on Concepts, Definitions and Classifications, UNESCO-UIS / OECD / EUROSTAT,
Montreal, Paris, Luxembourg,
http://uis.unesco.org/sites/default/files/documents/uoe2016manual_11072016_0.pdf.
[2]


ORGANISATION FOR ECONOMIC CO-OPERATIONAND DEVELOPMENT
The OECD is a unique forum where governments work together to address the economic, social andenvironmental challenges of globalisation. The OECD is also at the forefront of efforts to understand and tohelp governments respond to new developments and concerns, such as corporate governance, theinformation economy and the challenges of an ageing population. The Organisation provides a settingwhere governments can compare policy experiences, seek answers to common problems, identify goodpractice and work to co-ordinate domestic and international policies.
The OECD member countries are: Australia, Austria, Belgium, Canada, Chile, the Czech Republic,Denmark, Estonia, Finland, France, Germany, Greece, Hungary, Iceland, Ireland, Israel, Italy, Japan, Korea,Latvia, Lithuania, Luxembourg, Mexico, the Netherlands, New Zealand, Norway, Poland, Portugal, theSlovak Republic, Slovenia, Spain, Sweden, Switzerland, Turkey, the United Kingdom and the United States.The European Union takes part in the work of the OECD.
OECD Publishing disseminates widely the results of the Organisation’s statistics gathering andresearch on economic, social and environmental issues, as well as the conventions, guidelines andstandards agreed by its members.
OECD PUBLISHING, 2, rue André-Pascal, 75775 PARIS CEDEX 16
(91 2018 13 1 P) ISBN 978-92-64-30443-7 – 2018

OECD Handbook for Internationally Comparative Education Statistics 2018CONCEPTS, STANDARDS, DEFINITIONS AND CLASSIFICATIONS
OECD Handbook for Internationally Comparative Education Statistics 2018CONCEPTS, STANDARDS, DEFINITIONS AND CLASSIFICATIONS
For well over two decades, the OECD has developed and published a broad range of comparative indicators published yearly in the fl agship publication Education at a Glance. These provide insights into the functioning of education systems, such as the participation and progress through education, the human and fi nancial resources invested, and the economic and social outcomes associated with educational attainment. Through the set of harmonised indicators and defi nitions, they enable countries to view their education system in the light of other countries’ performance, practices and resources.
Fundamental to the credibility and understanding of these comparisons are the concepts, defi nitions, classifi cations and methodologies that have been developed over the years to underpin the statistics and indicators. This Handbook draws these methodologies together in a single reference volume, complementing and providing an invaluable aid to users of Education at a Glance. In doing so, the Handbook aims to facilitate a greater understanding of the education statistics and indicators produced and so allow for their more effective use in policy analysis. Equally, it provides a ready reference of international standards and conventions for others to follow in the collection and assimilation of educational data.
This edition updates the OECD Handbook for Internationally Comparative Education Statistics, last published in 2017.
ISBN 978-92-64-30443-791 2018 13 1 P
Consult this publication on line at https://doi.org/10.1787/9789264304444-en.
This work is published on the OECD iLibrary, which gathers all OECD books, periodicals and statistical databases.Visit www.oecd-ilibrary.org for more information.
9HSTCQE*daeedh+
OE
CD
Han
db
oo
k for Intern
ation
ally Co
mp
arative Ed
ucation S
tatistics 2018 CO
NC
EP
TS
, STA
ND
AR
DS
, DE
FIN
ITIO
NS
AN
D C
LA
SS
IFIC
AT
ION
S