october 2013 trends - alaska
TRANSCRIPT


2 ALASKA ECONOMIC TRENDS OCTOBER 2013
October 2013Volume 33Number 10ISSN 0160-3345
To contact Trends authors or request a free electronic or print subscription, e-mail trends@
alaska.gov or call (907) 465-4500. Trends is on the Web at labor.alaska.gov/trends.
Alaska Economic Trends is funded by the Employment Security Division of the
Alaska Department of Labor and Workforce Development. It’s published by the Research
and Analysis Section.
Alaska Economic Trends is printed and distributed by Assets, Inc., a vocational
training and employment program, at a cost of $1.37 per copy.
Material in this publication is public information, and with appropriate credit may
be reproduced without permission.
On the cover: The Matchian boys help with their family’s subsistence harvest at the
Ulroan/Matchian family fi sh camp on the Aprun River near Chevak. The boys’ job was
to move the cleaned fi sh to the drying rack. Photo by Brian Hoffman
Sean Parnell, GovernorDianne Blumer, Commissioner
Sam DapcevichCover Artist
Sara WhitneyEditor
Dan RobinsonChief, Research and Analysis
The Yukon-Kuskokwim Delta 4 A look at the Wade Hampton and Bethel census areas
Federal Civilian Jobs in Alaska 8 Small share of employment brings in over $1 billion a year
Personal Transfer Payments 12 Types of income outside regular employment
October Authors
Mali Abrahamson, a Department of Labor economist in Juneau, specializes in the em-ployment and wages of the Southeast and Southwest economic regions. To reach her, call (907) 465-6037 or e-mail her at [email protected].
Caroline Schultz, an Alaska Department of Labor and Work-force Development economist in Juneau, specializes in state-wide employment and wages. To reach her, call (907) 465-6027 or e-mail her at [email protected].
Alyssa Shanks, an economist for the Department of Labor in Anchorage, special-izes in the employ-ment and wages of the Interior, Gulf Coast, and Northern economic regions. To reach her, call (907) 269-4863 or e-mail [email protected].
Paul Martz, a De-partment of Labor economist in Juneau, specializes in industry and occupation pro-jections. to reach him, call (907) 465-6028 or e-mail him at [email protected].

3OCTOBER 2013 ALASKA ECONOMIC TRENDS
Supporting employers and workers with safety training
By Dianne Blumer, Commissioner
This month’s Trends features the Yukon-Kuskokwim Delta in southwestern Alaska. While the region’s population continues its steady growth, 45 of 47 villages have fewer than 1,000 residents.
Both subsistence and commercial fi shing are critical to life in the region. Bethel, the area’s regional hub, provides more service industry jobs and half the region’s jobs are in government service.
Also in this issue is a report on federal civil service jobs in Alaska, which provide more than $1 billion in wages, or about 7.2 per-cent of the state’s total wages. In terms of the number of Alaska workers, the 4.9 per-cent of jobs on the federal payroll is on par with the construction industry.
Given our long and rich history with the American military, it’s no surprise that many federal civilian employees also work to keep our nation secure through the De-partment of Defense. Most of these jobs are in the Anchorage and Fairbanks areas, where military installations are located. The 25 highest-paying jobs average about $20,000 higher than their counterparts in the private sector.
Safety Training Courses
This month’s Safety Minute focuses on training opportunities provided by the Alaska Department of Labor and Work-force Development’s Labor Standards and Safety Division. The two free courses are offered by the divisions’ Alaska Occupa-tional Safety and Health Section, known as AKOSH.
AKOSH safety consultants partnered with Trident Seafoods to develop a 10-Hour Seafood Safety Training Course to help prevent accidents in Alaska’s seafood processing industry, which typically has a high accident rate.
However, training and education to better understand workplace hazards and how to prevent them can help reduce injury and accident rates. The training, which is for fl oor managers, line managers, mainte-nance staff, and plant workers, has been successfully offered in Dillingham, Sand Point, and Kodiak.
The free Seafood Safety Training will be in Anchorage on Oct. 9 and 10 at the Mid-town Job Center at 3301 Eagle Street. The two-day class from 8 a.m. to 4 p.m. will include training on lock out/tag out, emer-gency action plans, and personal protective equipment.
For more information, contact seafood co-ordinator Mike Buck at (907) 269-4946 or [email protected].
AKOSH is also offering another free course — Hazard Communication 2012 Standard Revision — which will provide information needed to meet a new federal requirement imposed by the U.S. Occupa-tional Safety and Health Administration. In 2012, OSHA incorporated the Globally Harmonized System of Classifi cation and Labeling of Hazardous Chemicals as part of the Hazard Communication Standard (29 CFR 1910.1200).
Under the revision, employers are legally required to train employees on the new label elements and safety data sheet format by Dec. 1.
This training will help employees under-stand the updated standard requirement, with the goal of increasing worker compre-hension and improving on-the-job safety.
The Hazard Communication training will be offered in Fairbanks and Juneau on Oct. 15 and in Anchorage on Oct. 23. For more information, contact training specialist Elaine Banda at (907) 269-4951 or [email protected].
4 ALASKA ECONOMIC TRENDS OCTOBER 2013
By MALI ABRAHAMSON
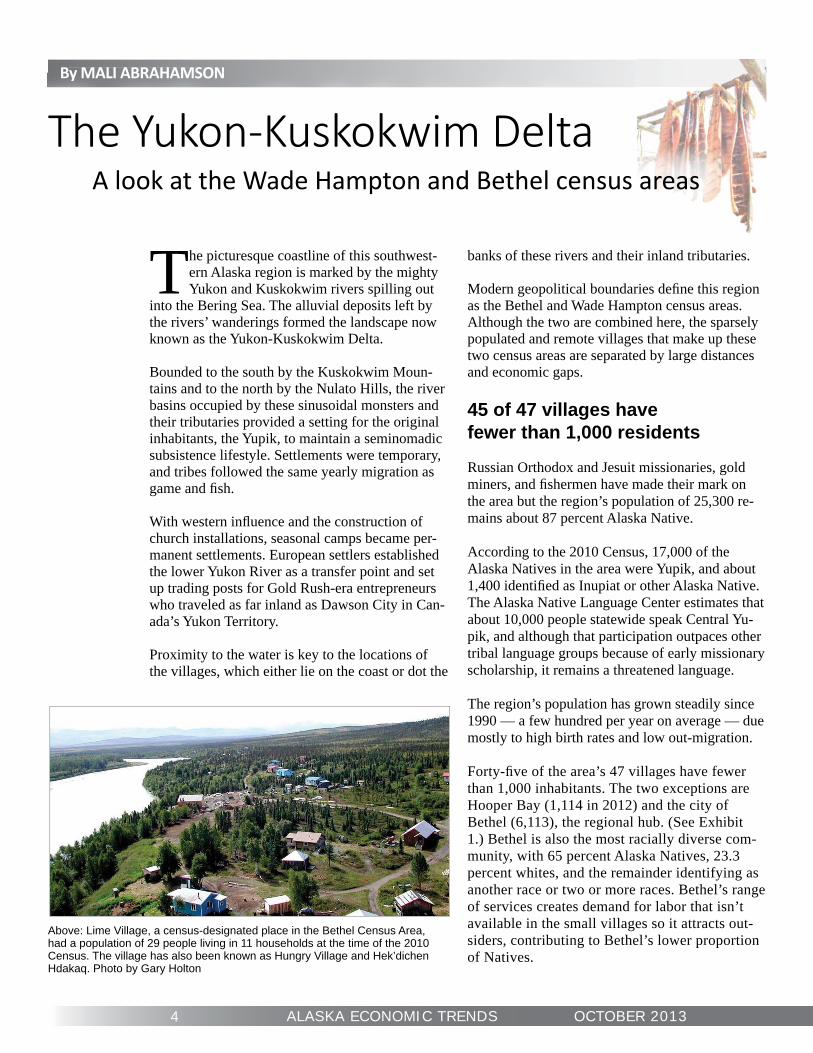
Above: Lime Village, a census-designated place in the Bethel Census Area, had a population of 29 people living in 11 households at the time of the 2010 Census. The village has also been known as Hungry Village and Hek’dichen Hdakaq. Photo by Gary Holton
The picturesque coastline of this southwest-ern Alaska region is marked by the mighty Yukon and Kuskokwim rivers spilling out
into the Bering Sea. The alluvial deposits left by the rivers’ wanderings formed the landscape now known as the Yukon-Kuskokwim Delta.
Bounded to the south by the Kuskokwim Moun-tains and to the north by the Nulato Hills, the river basins occupied by these sinusoidal monsters and their tributaries provided a setting for the original inhabitants, the Yupik, to maintain a seminomadic subsistence lifestyle. Settlements were temporary, and tribes followed the same yearly migration as game and fi sh.
With western infl uence and the construction of church installations, seasonal camps became per-manent settlements. European settlers established the lower Yukon River as a transfer point and set up trading posts for Gold Rush-era entrepreneurs who traveled as far inland as Dawson City in Can-ada’s Yukon Territory.
Proximity to the water is key to the locations of the villages, which either lie on the coast or dot the
banks of these rivers and their inland tributaries.
Modern geopolitical boundaries defi ne this region as the Bethel and Wade Hampton census areas. Although the two are combined here, the sparsely populated and remote villages that make up these two census areas are separated by large distances and economic gaps.
45 of 47 villages havefewer than 1,000 residents
Russian Orthodox and Jesuit missionaries, gold miners, and fi shermen have made their mark on the area but the region’s population of 25,300 re-mains about 87 percent Alaska Native. According to the 2010 Census, 17,000 of the Alaska Natives in the area were Yupik, and about 1,400 identifi ed as Inupiat or other Alaska Native. The Alaska Native Language Center estimates that about 10,000 people statewide speak Central Yu-pik, and although that participation outpaces other tribal language groups because of early missionary scholarship, it remains a threatened language.
The region’s population has grown steadily since 1990 — a few hundred per year on average — due mostly to high birth rates and low out-migration.
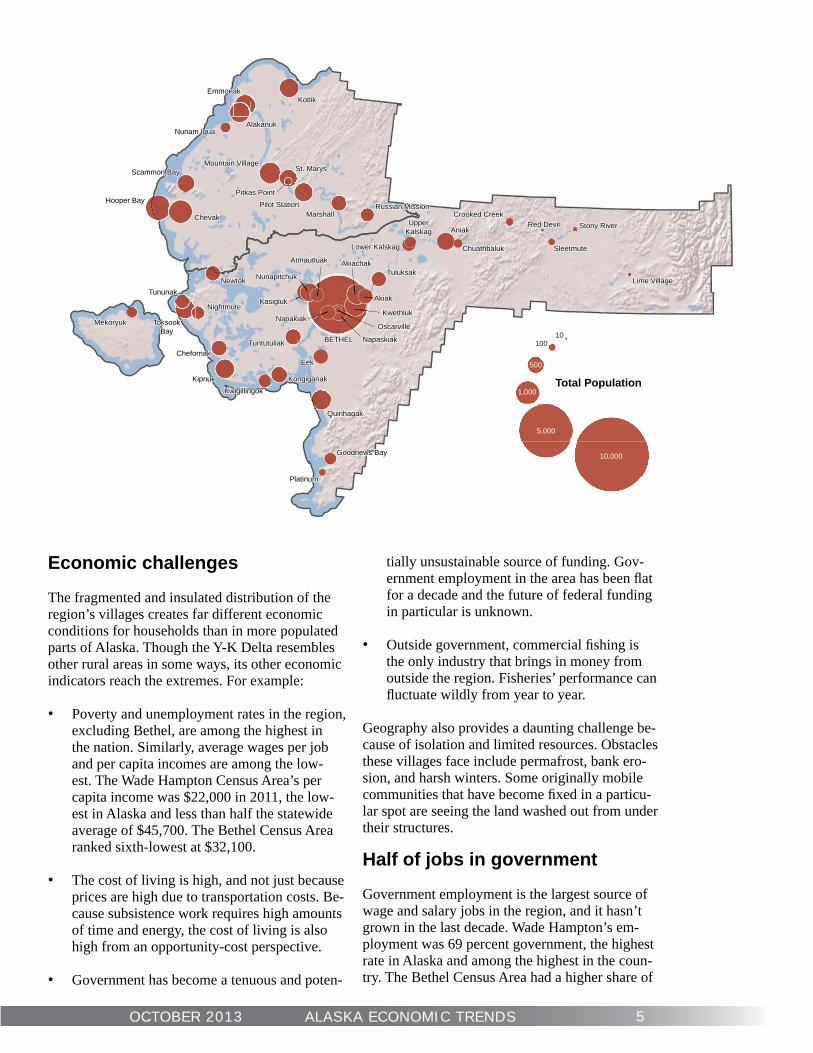
Forty-fi ve of the area’s 47 villages have fewer than 1,000 inhabitants. The two exceptions are Hooper Bay (1,114 in 2012) and the city of Bethel (6,113), the regional hub. (See Exhibit 1.) Bethel is also the most racially diverse com-munity, with 65 percent Alaska Natives, 23.3 percent whites, and the remainder identifying as another race or two or more races. Bethel’s range of services creates demand for labor that isn’t available in the small villages so it attracts out-siders, contributing to Bethel’s lower proportion of Natives.
By MALI ABRAHAMSON
The Yukon-Kuskokwim DeltaA look at the Wade Hampton and Bethel census areas
5OCTOBER 2013 ALASKA ECONOMIC TRENDS
(!!
(!!
(((((((!!!!!!!!!!!!(((((((((((((!!!!!!!!!!!!!!!!!!!!!!!!!!!!!!!!!!!!((((((((((!!!!!!!!!!!!!!!!!!!!!!!!!!!!
((((((((((((!!!!!!!!!!!!!!!!!!!!!!!!!!!!!(((((((((((!!!!!!!!!!!!!!!!!!!!!!!!
(((((((((((((((!!!!!!!!!!!!!!!!!!
(((((((((((((!!!!!!!!!!!!!!!!!!!!!!!!!
(((((((!!!!!!!!!!!!!!!!!!((((((((((((!!!!!!!!!!!!!!!!!!!!!! (((((((((!!
!!!!!!!!!!!!!((((!!!!!
(((((((((((((((!!!!!!!!!!!!!!!!!!!!
(((((((!!!!!!!!!((((((!!!!!!!!!!!!!!!
((((((((((!!!!!!!!!!!!!!!
((!!!!(((((((!!!!!!!!!!!!!!!!!
((((((((((((((((((((((((((((!!!!!!!!!!!!!!!!!!!!!!!!!!!!!!!!!!!!!!(((((((((((((((((((((((!!!!!!!!!!!!!!!!!!!!!!!!!!!!!!!!!!!!!!
((((((((((!!!!!!!!!!!!!!!!!!!!!!!!(((((((((((((((!!!!!!!!!!!!!!!!!!!!!!!!!!!!!
(((((((((!!!!!!!!!!!!!!
!!!(!!!!(((!!!!!!!!!!!!!!!!!((((((((!!!!!!!!!!!!!!!!!!!!!!!!!!!
((((((((!!!!!!!!!!!!!!!
((((((((!!!!!!!!!!!!!!
((((((!
!!!!!!!!!!!(((((((((!
!!!!!!!!!!!!!!!!!!!!!!!!!!!!
(((!!!!!!!
(!!
!(!!
(!!
((!!!!
KotlikEmmonak
AlakanukNunam Iqua
Scammon Bay
Chevak
Hooper Bay
Mekoryuk
Newtok
Platinum
Goodnews Bay
Lime Village
Sleetmute
Stony RiverRed DevilCrooked Creek
Quinhagak
Eek
TuntutuliakChefornak
KipnukKwigillingok
Kongiganak
Mountain Village
Pitkas Point
St. Marys
Pilot StationMarshall
Russian Mission
Aniak
Chuathbaluk
UpperKalskag
Lower Kalskag
Tuluksak
Tununak
Nightmute
ToksookBay
BETHEL
Akiak
Akiachak
KwethlukNapakiak
Napaskiak
Oscarville
Kasigluk
Nunapitchuk
Atmautluak
10,000
5,000
1,000
500
10010
Total Population
Economic challenges
The fragmented and insulated distribution of the region’s villages creates far different economic conditions for households than in more populated parts of Alaska. Though the Y-K Delta resembles other rural areas in some ways, its other economic indicators reach the extremes. For example:
• Poverty and unemployment rates in the region, excluding Bethel, are among the highest in the nation. Similarly, average wages per job and per capita incomes are among the low-est. The Wade Hampton Census Area’s per capita income was $22,000 in 2011, the low-est in Alaska and less than half the statewide average of $45,700. The Bethel Census Area ranked sixth-lowest at $32,100.
• The cost of living is high, and not just because prices are high due to transportation costs. Be-cause subsistence work requires high amounts of time and energy, the cost of living is also high from an opportunity-cost perspective.
• Government has become a tenuous and poten-
tially unsustainable source of funding. Gov-ernment employment in the area has been fl at for a decade and the future of federal funding in particular is unknown.
• Outside government, commercial fi shing is the only industry that brings in money from outside the region. Fisheries’ performance can fl uctuate wildly from year to year.
Geography also provides a daunting challenge be-cause of isolation and limited resources. Obstacles these villages face include permafrost, bank ero-sion, and harsh winters. Some originally mobile communities that have become fi xed in a particu-lar spot are seeing the land washed out from under their structures.
Half of jobs in government
Government employment is the largest source of wage and salary jobs in the region, and it hasn’t grown in the last decade. Wade Hampton’s em-ployment was 69 percent government, the highest rate in Alaska and among the highest in the coun-try. The Bethel Census Area had a higher share of

6 ALASKA ECONOMIC TRENDS OCTOBER 2013
Above, Hooper Bay, a village in the Wade Hampton Census Area, is also known as Naparyarmiut in Central Yupik. Photo by C.T. Liotta
Y-K VillagesPopulation, 20121
Population Regional total 25,300Bethel Census Area 17,600 Akiachak 663 Akiak 361 Aniak 541 Atmautluak 302 Bethel 6,113 Chefornak 434 Chuathbaluk 138 Crooked Creek 90 Eek 339 Goodnews Bay 258 Kasigluk 594 Kipnuk 641 Kongiganak 464 Kwethluk 751 Kwigillingok 317 Lime Village 27 Lower Kalskag 306 Mekoryuk 210 Napakiak 358 Napaskiak 434 Newtok 377 Nightmute 294 Nunapitchuk 549 Oscarville 69 Platinum 74 Quinhagak 689 Red Devil 19 Sleetmute 84 Stony River 42 Toksook Bay 638 Tuluksak 384 Tuntutuliak 420 Tununak 354 Upper Kalskag 214 Balance 52Wade Hampton CA 7,700 Alakanuk 707 Chevak 970 Emmonak 755 Hooper Bay 1,114 Kotlik 628 Marshall 414 Mountain Village 830 Nunam Iqua 185 Pilot Station 597 Pitkas Point 102 Russian Mission 312 St. Mary’s 524 Scammon Bay 536 Balance 26
Source: Alaska Department of Labor and Workforce Development, Research and Analysis Section
private sector jobs, with 45 percent govern-ment employment in 2012, or 3,120 jobs. (See Exhibit 2.) About half the region’s government jobs are in education, with fi ve local school districts and a small Bethel extension of the University of Alaska Fair-banks.
Tribal government jobs numbered 1,040 in 2012. Local councils often provide services that would ordinarily be administered pri-vately, from village utilities to construction to public health clinics.
Private employment increased by 21 per-cent in the region between 2001 and 2003 due to expansion of the Yukon-Kuskokwim Health Corporation, the region’s largest private employer; new seafood process-ing fi rms; and increased construction from bulk-fuel capacity increases and other capi-tal construction projects. After the 2003 peak of 4,600 jobs, private employment slowly declined until 2008 and then began to recover, reaching 4,515 jobs in 2012.
Bethel aids village life
Bethel had more than 60 percent of the region’s private jobs in 2012. The city hosts the region’s large health and social care centers, housing authority, and air transportation headquarters. Breaking down Bethel’s impact as the regional hub
is diffi cult — for instance, the regional health center’s coverage area includes all communities but the jobs and wages are counted in Bethel. The same is true for Grant Air and Hageland Aviation, whose pilots provide essential air transportation between villages.
Plans for a movie theater in the region’s “big city” are in the works, and other cap-ital improvements could result in minor growth for private employment. Some of the boost from construction work would be temporary, however.
Outside Bethel, privatejobs mostly basic services
With the exception of two fi sh plants and a branch of the regional health care cor-poration, few large fi rms generate jobs in the villages outside of Bethel. Most private employment in the villages is con-nected to Native corporations, including many of the general stores.
In 2012, 70 village stores accounted for 745 jobs, and local utility, weatheriza-tion, and construction fi rms had 240 jobs. Crucial bush airlines provide about 75 year-round jobs. The remaining 350 often part-time positions were either related to the corporations or the roughly 20 other small private village enterprises.
7OCTOBER 2013 ALASKA ECONOMIC TRENDS
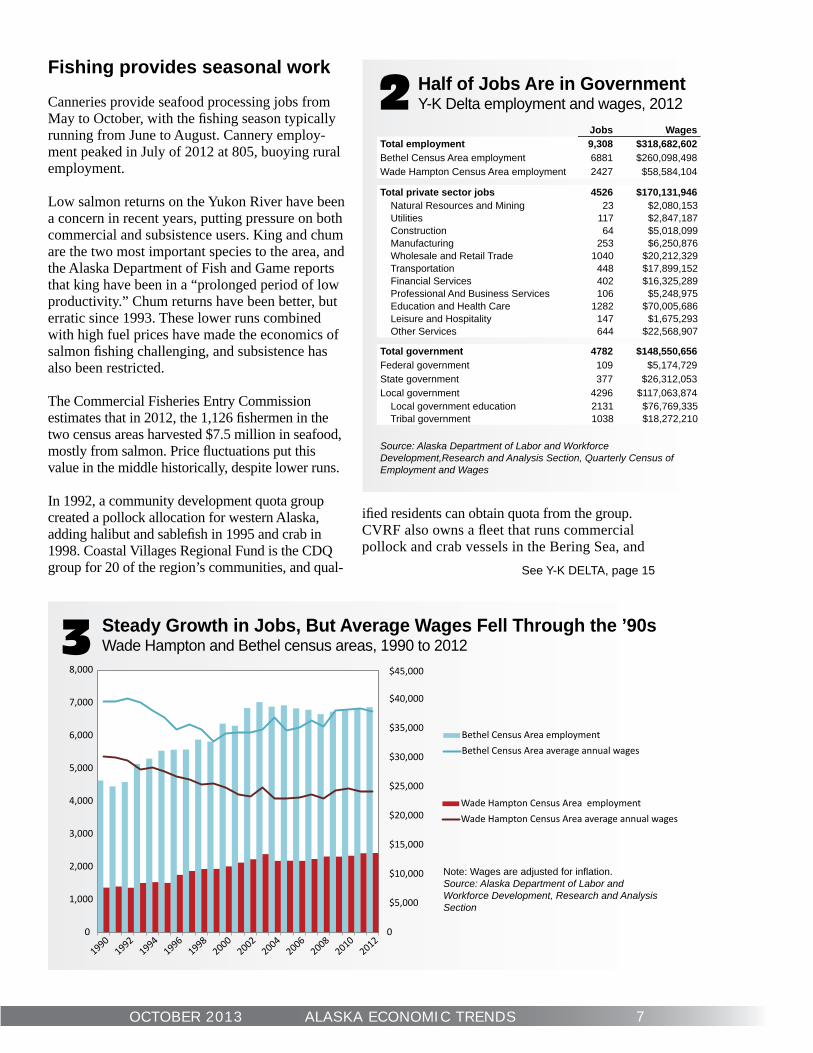
Half of Jobs Are in GovernmentY-K Delta employment and wages, 20122
Jobs WagesTotal employment 9,308 $318,682,602 Bethel Census Area employment 6881 $260,098,498 Wade Hampton Census Area employment 2427 $58,584,104
Total private sector jobs 4526 $170,131,946 Natural Resources and Mining 23 $2,080,153 Utilities 117 $2,847,187 Construction 64 $5,018,099 Manufacturing 253 $6,250,876 Wholesale and Retail Trade 1040 $20,212,329 Transportation 448 $17,899,152 Financial Services 402 $16,325,289 Professional And Business Services 106 $5,248,975 Education and Health Care 1282 $70,005,686 Leisure and Hospitality 147 $1,675,293 Other Services 644 $22,568,907
Total government 4782 $148,550,656 Federal government 109 $5,174,729 State government 377 $26,312,053 Local government 4296 $117,063,874 Local government education 2131 $76,769,335 Tribal government 1038 $18,272,210
Source: Alaska Department of Labor and Workforce Development,Research and Analysis Section, Quarterly Census of Employment and Wages
Fishing provides seasonal work
Canneries provide seafood processing jobs from May to October, with the fi shing season typically running from June to August. Cannery employ-ment peaked in July of 2012 at 805, buoying rural employment.
Low salmon returns on the Yukon River have been a concern in recent years, putting pressure on both commercial and subsistence users. King and chum are the two most important species to the area, and the Alaska Department of Fish and Game reports that king have been in a “prolonged period of low productivity.” Chum returns have been better, but erratic since 1993. These lower runs combined with high fuel prices have made the economics of salmon fi shing challenging, and subsistence has also been restricted.
The Commercial Fisheries Entry Commission estimates that in 2012, the 1,126 fi shermen in the two census areas harvested $7.5 million in seafood, mostly from salmon. Price fl uctuations put this value in the middle historically, despite lower runs.
In 1992, a community development quota group created a pollock allocation for western Alaska, adding halibut and sablefi sh in 1995 and crab in 1998. Coastal Villages Regional Fund is the CDQ group for 20 of the region’s communities, and qual-
ifi ed residents can obtain quota from the group. CVRF also owns a fl eet that runs commercial pollock and crab vessels in the Bering Sea, and
3
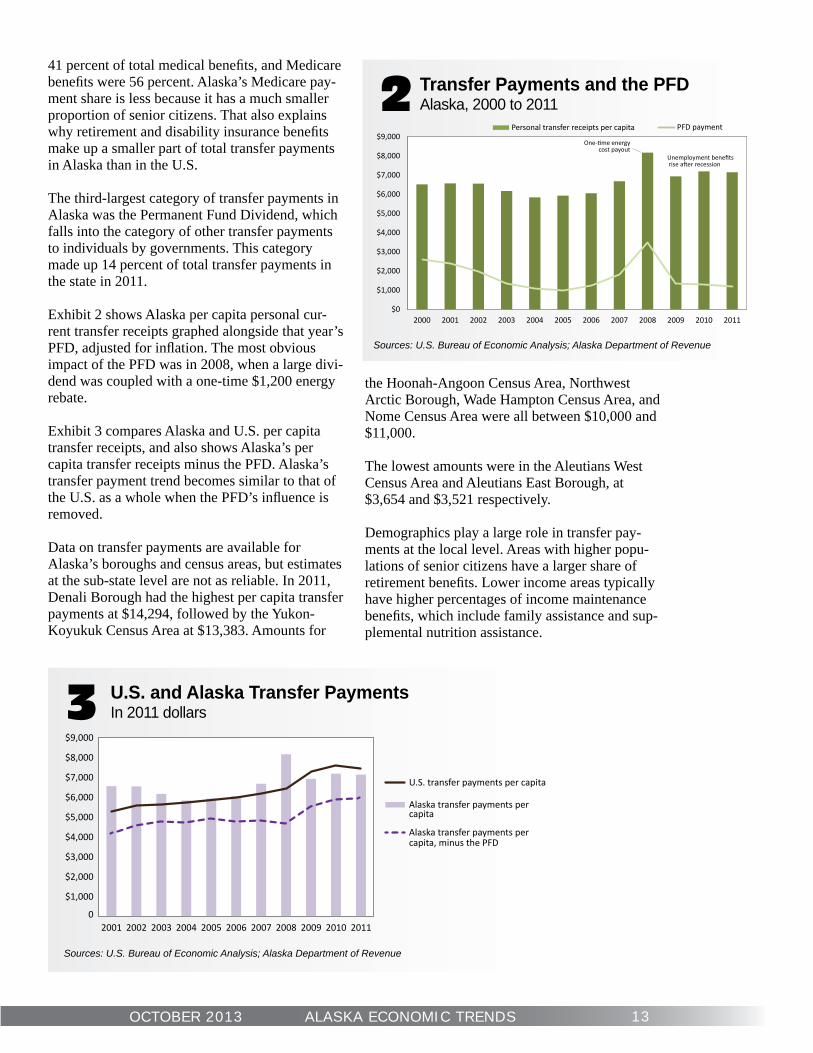
Note: Wages are adjusted for infl ation.Source: Alaska Department of Labor and Workforce Development, Research and Analysis Section
Steady Growth in Jobs, But Average Wages Fell Through the ’90sWade Hampton and Bethel census areas, 1990 to 2012
0
$5,000
$10,000
$15,000
$20,000
$25,000
$30,000
$35,000
$40,000
$45,000
0
1,000
2,000
3,000
4,000
5,000
6,000
7,000
8,000
19901992
19941996
19982000
20022004
20062008
20102012
Bethel Census Area employment
Wade Hampton Census Area employment
Bethel Census Area average annual wages
Wade Hampton Census Area average annual wages
See Y-K DELTA, page 15

8 ALASKA ECONOMIC TRENDS OCTOBER 2013
By ALYSSA SHANKS
Federal Civilian Jobs in AlaskaSmall share of employment brings in over $1 billion a year
The federal government has always played a leading role in Alaska’s economy, espe-cially before statehood when it ran the ter-
ritory. Although the size of the federal workforce has waxed and waned in recent history, the federal government’s presence here in terms of its share of jobs is still fourth-largest in the nation after Wash-ington, D.C.; Maryland; and Hawaii.
The military is big in Alaska, but the smaller civil-ian piece of federal employment is signifi cant on its own. It made up 4.9 percent of Alaska jobs and paid 7.2 percent of wages in 2012 — more than $1 billion. (See the sidebar on the next page for more
on Alaska’s federal workers, including how much they make.)
26 percent are in national security
The military has 23,237 personnel1 in Alaska, and the federal civilian workforce stands at 16,390. But many of those civilian jobs also serve the mili-tary and are directly tied to the state’s bases. Partly because of the large military presence, national security is the largest percentage of federal civil-
1Military positions are not counted in the Department of Labor’s regular wage and salary employment data.
The Federal Government Share of Alaska’s EmploymentIndustries and types of federal civilian work, 20121
Retail Trade 5%
Warehousing 11%
Soc. Assistance
6%
Leisure and Hospitality
8%
3%programs
15%program
11%
security26%
Human Resources
5%Other10%
Natural
5.3%4.2%
Retail 10.7%
Business 8.6%
Health Care9.8%
Hospitality10.0%
4.9%
Other 21.9%
Federal Government
State
7.8%
Local
11.9%
Alaska Industries
7.8%4.9%
Source: Alaska Department of Labor and Workforce Development, Research and Analysis Section

9OCTOBER 2013 ALASKA ECONOMIC TRENDS
Characteristics and salaries of Alaska’s federal workers
Over half make between $40,000 and $79,000
Sources: Alaska Department of Labor and Workforce Development, Research and Analysis Section; and Federal Offi ce of Personnel Management
0
200
400
600
800
1,000
1,200
1,400
1,600
1,800
2,000Employees
0
500
1,000
1,500
2,000
2,500
Under20
20-24 25-29 30-34 35-39 40-44 45-49 50-54 55-59 60-64 65+
Employees
Most are between ages 20 and 49
By PAUL MARTZ
Federal departments in Alaska aren’t required to report their employees’ occupational data, which limits the state’s abil-ity to look at the jobs and demographics of federal workers. However, combining several data sources allowed the Alaska Department of Labor and Workforce Development to produce estimates for federal workers and their characteristics for the fi rst time.
• Of the roughly 13,0481 federal civilian employees in Alaska in 2012, 62 percent were men and 38 percent were wom-en. The largest share, 43 percent, worked in management, business, or administrative support positions. The next larg-est group was life, physical, and social scientists at 16 per-cent, followed by transportation workers at 9 percent.
• Salaries tend to be high: The majority, 51 percent, made between $40,000 and $79,999. The average was $71,775, substantially higher than the 2012 statewide average of $55,272. Part of the reason the federal average is higher
1This value is less than the total employment listed in the main article be-cause of reporting limitations by the U.S. Offi ce of Personnel and Manage-ment. For a full list of coverage, see fedscope.opm.gov.
See FEDERAL WORKERS, page 11
Occupation group CountBusiness and Financial Operations Occupations 3,284Life, Physical, and Social Science Occupations 2,131Offi ce and Administrative Support Occupations 1,459Transportation and Material Moving Occupations 1,168Installation, Maintenance, and Repair Occupations 899Management Occupations 857Architecture and Engineering Occupations 680Protective Service Occupations 651Healthcare Practitioners and Technical Occupations 616Legal Occupations 206Education, Training, and Library Occupations 195Production Occupations 191Construction and Extraction Occupations 173Arts, Design, Entertainment, Sports, and Media Occupations 164Health Care Support Occupations 90Community and Social Services Occupations 85Personal Care and Service Occupations 67Food Preparation and Serving Related Occupations 50Sales and Related Occupations 29Building and Grounds Cleaning and Maintenance Occupations 22Computer and Mathematical Occupations 18Military-Specifi c Occupations 13
Business, fi nance lead occupations
Source: Alaska Department of Labor and Workforce Development, Research and Analysis Section
ian jobs — 26 percent in 2012 — all of which are handled by the largest department, the Department of Defense. (See exhibits 1 and 2.)
The Department of Defense represents 32 percent of civilian federal jobs, followed by the Depart-ment of the Interior — which includes the Bureau of Indian Affairs, U.S. Fish and Wildlife Service, and the Bureau of Land Management — at 16 percent. The Bureau of Land Management is par-ticularly signifi cant in Alaska because 60 percent
of Alaska’s land is federally owned. BLM deals with much of the state’s land conservation, land transfers and management (including trail mainte-nance and campgrounds), fi refi ghting, and oil and gas leasing.
Coming in third and fourth for jobs were the De-partment of Agriculture and the Postal Service, respectively.
The federal government’s various branches spe-

10 ALASKA ECONOMIC TRENDS OCTOBER 2013
Federal Footprint Varies By AreaAlaska, 20123
AreaFederal
employmentTotal
federal wagesFederal %
of total jobsFederal %
of total wagesAlaska 16,390 $1,202,597,441 4.9% 7.2%Aleutians East Borough 21 $1,227,841 1.1% 1.9%Aleutians West Census Area 15 $978,044 0.4% 0.6%Anchorage, Municipality 9,117 $700,369,876 5.9% 8.5%Bethel Census Area 86 $4,480,976 1.3% 1.7%Bristol Bay Borough 59 $3,998,193 4.5% 7.3%Denali Borough 229 $14,814,541 11.9% 17.6%Dillingham Census Area 52 $2,959,904 2.0% 3.0%Fairbanks North Star Borough 3,264 $218,757,177 8.3% 11.7%Haines Borough 10 $1,039,917 1.0% 3.2%Hoonah-Angoon Census Area 109 $6,163,725 15.1% 25.5%Juneau,City and Borough 829 $71,980,772 4.5% 8.3%Kenai Peninsula Borough 389 $28,486,735 1.9% 3.3%Ketchikan Gateway Borough 257 $19,092,708 3.5% 6.0%Kodiak Island Borough 343 $18,497,161 5.3% 6.8%Lake and Peninsula Borough 41 $1,939,087 5.2% 6.5%Matanuska-Susitna Borough 210 $17,712,365 1.0% 2.2%Nome Census Area 65 $3,649,428 1.6% 2.1%North Slope Borough 21 $1,285,481 0.1% 0.1%Northwest Arctic Borough 50 $2,864,970 1.7% 1.5%Petersburg Census Area 107 $7,798,889 6.3% 12.6%Prince of Wales-Hyder CA 95 $6,188,066 4.9% 8.7%Sitka, City and Borough 143 $10,620,801 3.2% 6.0%Skagway, Municipality 54 $3,558,247 6.1% 10.3%Southeast Fairbanks CA 443 $32,029,477 17.7% 21.1%Valdez-Cordova Census Area 159 $10,246,534 3.3% 4.4%Wade Hampton Census Area 24 $693,753 1.0% 1.2%Wrangell, City and Borough 54 $3,344,582 6.6% 11.0%Yakutat, City and Borough 24 $1,616,450 7.7% 14.7%Yukon-Koyukuk Census Area 102 $5,136,870 4.0% 5.2%
Note: An additional 17 jobs have an unknown location.Source: Alaska Department of Labor and Workforce Development, Research and Analysis Section
Defense is the Largest By FarSelect federal agencies in Alaska, 20122
Agency JobsDepartment of Defense (Civilian) 5,175Department of the Interior 2,645Department of Agriculture 1,612Postal Service (USPS) 1,455Federal Aviation Administration 1,278Department of Homeland Security 968Private Retailers on Military bases 843Department of Veterans Affairs 643Army Air Force Exchange Service 527Financial Management Division, Morale/Welfare/Recreation 292Department of Health and Human Services/ Indian Health 245Department of Justice 220United States Courts 123Coast Guard Exchange System, Morale/Welfare/Recreation 121Social Security Administration 63General Services Administration 45Department of Housing and Urban Development 37Environmental Protection Agency 36Offi ce of Personnel Managment 16Small Business Administration 12Source: Alaska Department of Labor and Workforce Development, Research and Analysis Section
cialize in a range of services, such as health care, social services, retail, and tourism. (See Exhibit 1.)
Retail and tourism-related jobs made up 5 and 8 percent of federal employment respectively in 2012. Some of these jobs support the state’s military population while others serve tourists in places such as Denali National Park and Klondike Gold Rush National Historic Park near Skagway.
Jobs all around the state
Every Alaska borough and census area has federal positions, but some rely more on the U.S. government than others. Not surprisingly, Anchorage had the larg-est number of federal jobs — 9,117 in 2012 — but the federal government has a bigger fi nancial impact on many smaller areas and is often a larger percentage of a rural area’s economy. (See Exhibit 3.) For example, the federal government paid over 17 percent of all wages in the Denali Borough and over 25 percent in the Hoonah-Angoon Census Area last year, and none of those jobs were tied to the military. Another area with a large percentage of federal civilians is the small Southeast Fairbanks Census Area, with jobs mainly tied to Fort Greely.
The Haines Borough had the fewest fed-eral jobs at just 10 in 2012. These were mostly with the Postal Service, with a handful in customs and border control.
Federal employment trends
The federal government makes its mark in Alaska’s regional economies of all sizes because of its variety of services, high wages, and broad geographic pres-ence, but its infl uence has fl uctuated over the years. Overall, its employment numbers have been fairly steady since the mid-1990s, but the last two decades have been marked by a couple of major economic changes. (See Exhibit 4.)
Federal employment peaked in the early 1990s when a small increase in the infan-

11OCTOBER 2013 ALASKA ECONOMIC TRENDS
Federal Jobs Down the Past 2 YearsAlaska, 1990 to 20124
5,000
10,000
15,000
20,000
25,000
19901991
19921993
19941995
19961997
19981999
20002001
20022003
20042005
20062007
20082009
20102011
2012
Source: Alaska Department of Labor and Workforce Development, Research and Analysis Section
is the federal government’s larger percentage of high-paying technical occupations, such as those in engineering and health care, which skews its average upward.
• Highest-paying occupations: On average, the salaries of the 25 highest-paying federal occupa-tions in Alaska were about $20,000 higher than the same occupation for a different employer. However, this wasn’t always the case; for exam-ple, the statewide average wage for a petroleum engineer was $234,555 in 2012 — $125,000 more than the federal wage. Also, the wage for a nonfederal podiatrist was about $78,000 greater than the federal counterpart.
• Average ages: About 54 percent of federal civil-ian employees were between 20 and 49 years old, with the remaining 46 percent at age 50 and older. Overall, 28 percent met the minimum feder-al retirement age of 55, though that doesn’t mean all of those workers qualifi ed to retire at that age.
• About half have more than 10 years in: In 2012, 53 percent of federal employees had between one and nine years of service and 47 percent had more than 10 years. Combining the length of service with average age statistics showed that at least 8 percent met the most strin-
FEDERAL WORKERSContinued from page 9
The 25 highest-paying categories
Source: Alaska Department of Labor and Workforce Development, Research and Analysis Section
Occupation title Avg annual salaryMedical and Health Services Managers $204,444Food Scientists and Technologists $155,500Administrative Law Judges, Adjudicators, and Hearing Offi cers
$148,179
Lawyers $129,074Podiatrists $125,924Computer and Information Research Scientists
$122,431
Ship Engineers $121,224Training and Development Managers $113,062Aerospace Engineers $113,000Engineers, All Other $111,741Pharmacists $111,668Electrical Engineers $111,651Air Traffi c Controllers $109,811Petroleum Engineers $109,477Transportation Inspectors $107,882Appraisers and Assessors of Real Estate $105,341Airline Pilots, Copilots, and Flight Engineers $104,656Materials Engineers $104,265Statisticians $103,900Chemists $101,470Computer Hardware Engineers $101,286Life Scientists, All Other $101,286Civil Engineers $100,547Environmental Engineers $100,217
gent minimum retirement qualifi cation, or about 1,084 people, and about 22 percent met the typi-cal qualifi cations for early retirement.
try division at Fort Wainwright and greater con-struction spending created more civilian jobs, but budget cuts in the late ‘90s brought those levels back down.
The sharp losses tapered into more of a slow leak and then evened out until another smaller jump in employment in 2010. This increase came with the creation of temporary positions to conduct the 2010 Census, but those jobs disappeared quickly thereafter and since 2010, federal job levels have continued to decline each year. The 2012 job count of about 16,300 is signifi cantly lower than the 1993 peak of around 20,000.
In 2013, Alaska is forecasted to lose another 300 federal jobs. Some of the recent losses are likely tied to the military — though the size of the state’s active duty military has increased overall since 2000, it too has declined slightly in recent years, resulting in cutbacks to civilian employee budgets on and off military installations.

12 ALASKA ECONOMIC TRENDS OCTOBER 2013
By CAROLINE SCHULTZ
Personal Transfer PaymentsTypes of income outside regular employment
Personal transfer receipts are payments peo-ple receive without performing any current service. These payments are part of a per-
son’s total personal income, which is the amount one takes in each year from all sources, including wages from a job.
Transfer payments are an important source of per-sonal income and are intended to provide a social safety net for people in different circumstances, from old age or illness to losing a job or supporting a family. Examples are retirement and disability payments; medical, income maintenance, unem-ployment, and veterans benefi ts; and federal educa-tion and training assistance. In Alaska, transfer pay-ments also include Permanent Fund Dividends.
Transfer payments can come from governments or private businesses, but the vast majority are payments government makes to individuals. Gov-ernment transfer payments to nonprofi t agencies
make up just 2 percent of the total annually, and payments to individuals from businesses are just over 1 percent. (See Exhibit 1.)
In 2011, the most recent year for which data are available, Alaskans received more than $5 billion in transfer payments, or 16 percent of their total personal income. Nationally, more than $2 trillion was paid out as transfer receipts, making up 18 percent of U.S. personal income. In Alaska and nationwide, 97 percent of these transfer receipts were payments to individuals from governments.
The largest share of government payments were medical benefi ts, both in the state and nationally. (See Exhibit 1). In Alaska, 66 percent of medical benefi t payments were through Medicaid and the Children’s Health Insurance Program — or CHIP — and 31 percent were Medicare benefi ts.
Nationally, Medicaid benefi ts and CHIP made up
U.S. and Alaska Transfer PaymentsIn 2011 dollars1
Source: U.S. Bureau of Economic Analysis
20%
40%12%
5%
5%
1%14%
2% 1%
Re rement and disability Medical bene ts Income maintenance
Unemployment Veterans bene ts
Educa on and training assistance Other (includes the PFD) Other (in
Payments to individuals by businesses
Alaska
Government payments to individuals
Other types of payments
011 d ll1 dollars
32%
42%
12%
5%
3%3%
2% 1%
United States
13OCTOBER 2013 ALASKA ECONOMIC TRENDS
U.S. and Alaska Transfer PaymentsIn 2011 dollars3
Sources: U.S. Bureau of Economic Analysis; Alaska Department of Revenue
0
$1,000
$2,000
$3,000
$4,000
$5,000
$6,000
$7,000
$8,000
$9,000
2001 2002 2003 2004 2005 2006 2007 2008 2009 2010 2011
Alaska transfer payments percapita
Alaska transfer payments percapita, minus the PFD
U.S. transfer payments per capita
Transfer Payments and the PFDAlaska, 2000 to 20112
$0
$1,000
$2,000
$3,000
$4,000
$5,000
$6,000
$7,000
$8,000
$9,000
2000 2001 2002 2003 2004 2005 2006 2007 2008 2009 2010 2011
Personal transfer receipts per capita PFD payment
cost payout
Sources: U.S. Bureau of Economic Analysis; Alaska Department of Revenue
41 percent of total medical benefi ts, and Medicare benefi ts were 56 percent. Alaska’s Medicare pay-ment share is less because it has a much smaller proportion of senior citizens. That also explains why retirement and disability insurance benefi ts make up a smaller part of total transfer payments in Alaska than in the U.S.
The third-largest category of transfer payments in Alaska was the Permanent Fund Dividend, which falls into the category of other transfer payments to individuals by governments. This category made up 14 percent of total transfer payments in the state in 2011.
Exhibit 2 shows Alaska per capita personal cur-rent transfer receipts graphed alongside that year’s PFD, adjusted for infl ation. The most obvious impact of the PFD was in 2008, when a large divi-dend was coupled with a one-time $1,200 energy rebate.
Exhibit 3 compares Alaska and U.S. per capita transfer receipts, and also shows Alaska’s per capita transfer receipts minus the PFD. Alaska’s transfer payment trend becomes similar to that of the U.S. as a whole when the PFD’s infl uence is removed.
Data on transfer payments are available for Alaska’s boroughs and census areas, but estimates at the sub-state level are not as reliable. In 2011, Denali Borough had the highest per capita transfer payments at $14,294, followed by the Yukon-Koyukuk Census Area at $13,383. Amounts for
the Hoonah-Angoon Census Area, Northwest Arctic Borough, Wade Hampton Census Area, and Nome Census Area were all between $10,000 and $11,000.
The lowest amounts were in the Aleutians West Census Area and Aleutians East Borough, at $3,654 and $3,521 respectively.
Demographics play a large role in transfer pay-ments at the local level. Areas with higher popu-lations of senior citizens have a larger share of retirement benefi ts. Lower income areas typically have higher percentages of income maintenance benefi ts, which include family assistance and sup-plemental nutrition assistance.

14 ALASKA ECONOMIC TRENDS OCTOBER 2013
Prelim. RevisedSEASONALLY ADJUSTED 8/13 7/13 8/12United States 7.3 7.4 8.1Alaska Statewide 6.5 6.3 7.0NOT SEASONALLY ADJUSTEDUnited States 7.3 7.7 8.2Alaska Statewide 5.7 5.9 6.2Anchorage/Mat-Su Region 5.1 5.3 5.6 Municipality of Anchorage 4.8 4.9 5.2 Matanuska-Susitna Borough 6.1 6.6 6.9Gulf Coast Region 5.7 5.9 6.4 Kenai Peninsula Borough 6.1 6.1 6.8 Kodiak Island Borough 4.2 5.0 5.3 Valdez-Cordova Census Area 5.6 5.9 5.7Interior Region 5.7 6.0 6.1 Denali Borough 3.5 3.6 3.9 Fairbanks North Star Borough 5.1 5.2 5.5 Southeast Fairbanks Census Area 9.1 10.0 9.4 Yukon-Koyukuk Census Area 12.2 14.3 12.4Northern Region 9.3 9.5 9.7 Nome Census Area 11.7 12.3 11.8 North Slope Borough 4.9 5.1 5.3 Northwest Arctic Borough 13.9 13.8 14.5Southeast Region 4.7 5.0 5.3 Haines Borough 4.7 5.0 4.7 Hoonah-Angoon Census Area 8.3 9.1 9.2 Juneau, City and Borough of 4.0 4.1 4.4 Ketchikan Gateway Borough 4.2 4.6 5.0 Petersburg Census Area1 5.5 5.6 7.9 Prince of Wales-Hyder Census Area
9.9 10.3 11.4
Sitka, City and Borough of 3.9 4.3 4.4 Skagway, Municipality of 2.5 2.2 2.4 Wrangell, City and Borough of 6.3 7.2 6.2 Yakutat, City and Borough of 5.6 6.4 6.9Southwest Region 11.4 11.1 12.0 Aleutians East Borough 9.2 8.5 10.0 Aleutians West Census Area 6.5 7.1 6.9 Bethel Census Area 15.1 16.1 15.7 Bristol Bay Borough 1.9 1.1 2.4 Dillingham Census Area 7.6 7.3 8.3 Lake and Peninsula Borough 4.9 4.3 5.2 Wade Hampton Census Area 20.1 23.7 21.3
3 Unemployment RatesBoroughs and census areas
2 Statewide EmploymentNonfarm wage and salary
Preliminary Revised Year-Over-Year Change
Alaska 8/13 7/13 8/12 8/1290% Confi -
dence Interval
Total Nonfarm Wage and Salary 1 355,200 356,800 357,100 -1,900 -7,977 4,177Goods-Producing 2 58,600 60,300 59,100 -500 -3,466 2,466Service-Providing 3 296,600 296,500 298,000 -1,400 – –Mining and Logging 18,900 18,700 18,200 700 -535 1,935 Mining 18,200 18,000 17,800 400 – – Oil and Gas 14,800 14,700 14,300 500 – –Construction 21,500 20,700 20,100 1,400 -113 2,913Manufacturing 18,200 20,900 20,800 -2,600 -4,959 -241Wholesale Trade 6,200 6,300 6,500 -300 -639 39Retail Trade 37,900 38,200 37,400 500 -284 1,284 Food and Beverage Stores 6,400 6,400 6,500 -100 – – General Merchandise Stores 10,300 10,300 10,100 200 – –Transportation, Warehousing, Utilities 25,100 25,000 24,700 400 -434 1,234 Air Transportation 6,400 6,400 6,400 0 – –Information 6,100 6,100 6,200 -100 -375 175 Telecommunications 4,000 4,000 4,200 -200 – –Financial Activities 14,200 14,300 14,000 200 -667 1,067Professional and Business Services
29,300 29,500 30,200 -900 -2,256 456
Educational 4 and Health Services 46,700 47,000 46,400 300 -835 1,435 Health Care 33,800 34,100 33,200 600 – –Leisure and Hospitality 40,200 40,300 40,500 -300 -2,969 2,369Other Services 12,100 12,200 11,800 300 -521 1,121Government 78,800 77,600 80,300 -1,500 – – Federal Government 5 15,200 15,400 16,800 -1,600 – – State Government6 25,500 25,100 25,600 -100 – – State Government Education 7 6,700 6,000 6,700 0 – – Local Government 38,100 37,100 37,900 200 – – Local Government Education 8 18,700 17,500 19,200 -500 – – Tribal Government 3,600 3,700 4,100 -500 – –
Unemployment RatesJanuary 2003 to August 20131
Source: Alaska Department of Labor and Workforce Development, Research and Analysis; and U.S. Bureau of Labor Statistics
Employment Scene
Sources for Exhibits 1, 2, and 3: Alaska Department of Labor and Workforce Development, Research and Analysis Section; and U.S. Department of Labor, Bureau of Labor Statistics
A dash means confi dence intervals aren’t available at this level.1Excludes the self-employed, fi shermen and other agricultural workers, and private household workers. For estimates of fi sh harvesting employment and other fi sheries data, go to labor.alaska.gov/research/seafood/seafood.htm.2Goods-producing sectors include natural resources and mining, construction, and manufacturing.3Service-providing sectors include all others not listed as goods-producing sectors.4Private education only5Excludes uniformed military
6This number is not a count of state government positions, but the number of people who worked during any part of the pay period that included the 12th of the month (the same measure used for all employment numbers in this table). The numbers can vary signifi cantly from month to month; when attempting to identify trends, annual averages are more useful.7Includes the University of Alaska. Variations in academic calendars from year to year occasionally create temporarily large over-the-year changes.8Includes public school systems. Variations in academic calendars from year to year occasionally create temporarily large over-the-year changes.
The month in numbers
2003 2004 2005 2006 2007 2008 2009 2010 2011 2012
U.S.
Alaska
Seasonally adjusted
4%
6%
8%
10%
12%

15OCTOBER 2013 ALASKA ECONOMIC TRENDS
Safety Minute ,
Seafood safety training available Oct. 9 and 10 in AnchorageThe Alaska Department of Labor and Workforce Development’s Occupational Safety and Health Section will present a 10-hour seafood safety training course in Anchorage Oct. 9 and 10 at the department’s Eagle Street location.
These free classes will be from 8 a.m. to 4 p.m. each day and include the following modules:
The seafood processing industry is a business with a high accident rate where education and training can signifi cantly improve injury statistics. This course, which is a cooperative effort by AKOSH and Trident Seafoods, has been developed to provide fl oor managers, line managers, maintenance personnel, and plant workers with a better understanding of workplace hazards.
Each successful student will receive an AKOSH 10-hour Seafood Safety Training Card, which certifi es completion of the course. It is important to note this training does not satisfy safety requirements for employers to provide training for specifi c programs; these courses are for awareness only.
To apply for this class, contact seafood coordinator Mike Buck at (907) 269-4946 or [email protected]. The offi ce is located at 3301 Eagle St., Anchorage, 99503.
• Introduction to OSHA• Personal Protective
Equipment• Confi ned Space• Lock Out Tag Out• Slips, Trips, and Falls• Machine Guarding• Cuts and Lacerations• Reports and
Investigations• PSM and Ammonia
• Ergonomics• Marine Terminals• Electrical Safety• Material Handling• Emergency Action Plans• Hazard Communications• Sanitation and Chemical
Handling• Health Hazards• Bloodborne Pathogens
Free course will help meet OSHA-required hazard trainingIn 2012, the Occupational Safety and Health Adminis-tration incorporated the Globally Harmonized System of Classifi cation and Labeling of Hazardous Chemicals as part of the Hazard Communication Standard, 29 CFR 1910.1200. Employers are legally required to train employees on the new label elements and safety data sheet format by Dec. 1.
Don’t be caught out of compliance. The Alaska Depart-ment of Labor and Workforce Development’s Occupa-tional Safety and Health Section will offer free training to help employers meet this deadline. The training will include:
• An explanation of GHS• HazCom 2012 and “The Right to Understand”• New chemical labeling system and pictograms• Format of safety data sheets (SDS)
• Important implementation dates
Classes will be held at the following locations on these dates:
For more information, times, and to register, please contact AKOSH training specialist Elaine Banda at (907) 269-4951 or [email protected]. Space is limited, so please register today.
OCT 15:4325 Cinch St.
Fairbanks
OCT. 15:1111 W. 8th St. Room 303
Juneau
OCT. 23:3301 Eagle St. Room 104
Anchorage
owns and operates the Goodnews Bay processing plant and halibut-buying stations in the coastal communities. The plant made news early this year when it announced a $10 hourly starting wage for processors, which is about $3 higher than the industry standard.
Subsistence a key resource
Fish camps are still an iconic image of the river lands, with
Y-K DELTAContinued from page 7
dried salmon hanging on racks and the smell of alder smoke. Salmon and other fi sh are the most common subsistence re-sources in the region, and trapping also plays a part.
The climate also allows delta subsistence users to hunt and gather a wider variety of plants and animals than their northern Inupiat counterparts. Subsistence is essential to augment residents’ diets because of the low availability of jobs and the high cost of food in grocery stores, especially in the smaller villages. Although relocating to a more ur-ban area might mean more available jobs, subsistence is also part of Native cultural heritage, which creates strong ties to the land and its resources.