october 2003 alaska economic trends
TRANSCRIPT
2 ALASKA ECONOMIC TRENDS OCTOBER 2003
Alaska EconomicTrends is a monthly
publication dealingwith a variety of
economic-relatedissues in the state.
Alaska EconomicTrends is funded by
the EmploymentSecurity Division and
published by theDepartment of Labor
and WorkforceDevelopment, P.O. Box21149, Juneau, Alaska
99802-1149.
Printed and distributedby Assets, Inc., a
vocational training andemployment program,at a cost of $1.53 per
copy.
To contact us formore information,
to subscribe, or formailing list changes or
back copies, [email protected]
Material in thispublication is public
information and, withappropriate credit,
may be reproducedwithout permission.
Cover photo © Oakley Cochran/
AlaskaStock.com
Trends is available on the Internet.See URL above.
Contents:
The Global Salmon Industry 3And its impacts in Alaska
Occupational Injury and Illness 12A report on safety in Alaska’s workplaces
Exports and Exchange Rates 20The international see-saw
Employment Scene 21Warmer in JulySeasonal industries lift July’s numbers
October 2003Volume 23Number 10
ISSN 0160-3345
Email Trends authors at: [email protected]
October Trends authors are staffwith the Research and Analysis Section,
Administrative Services Division,Department of Labor and Workforce Development.
Subscriptions:[email protected]
(907) 465-4500
Joanne Erskine, Editor
Cover design by Sam Dapcevich
Frank H. Murkowski, Governor of AlaskaGreg O’Claray, Commissioner of Labor
and Workforce Development
http://almis.labor.state.ak.us

ALASKA ECONOMIC TRENDS OCTOBER 2003 3
And its impacts in Alaska
The Global Salmon Industry byNeal Gilbertsen
Labor Economist
O
1 Value of Alaska Salmon Harvest Ex vessel
'90 '91 '92 '93 '94 '95 '96 '97 '98 '99 '00 '01 '02$0
$100
$200
$300
$400
$500
$600
$700$ millions
Source: Commercial Fisheries Entry Commission (CFEC)
n September 5, 2000, the MarineStewardship Council certified Alaska’sstatewide commercial salmon fisheriesprogram as well managed and
sustainable. Alaska’s was the only salmon fisheryin the world to meet the council’s rigorousenvironmental standards and earn this distinction.Yet even as Alaska’s preeminence in biologicalmanagement was being recognized, Alaska’ssalmon fishermen had fallen on hard times.
Catches remain high through 2003 whenmeasured against historical levels, but the value ofthe salmon harvest has plummeted. Fishermenhave seen the value of their permits and vesselscollapse along with the prices they receive fortheir product. The number of fishermenparticipating in the salmon fisheries has declinedby 37 percent from 1990 to 2002, and many ofthose remaining are facing economic difficulties.In 2003, it is clear that while the fishery isbiologically sustainable, it is no longer economicallyviable for a large number of Alaska’s fishermen.
While perhaps unavoidable, this economic crisiswas predictable under the laws of supply anddemand. Farmed salmon created a major newsource of supply on the world market. As theglobal supply of farmed salmon increased, pricesfell. Alaska’s relative share of the world productiondeclined and its ability to influence pricesretreated. By the late 1990s, the Alaska salmonindustry lacked both the supply and marketdemand to significantly affect prices.
What happened?
In terms of employment, salmon is by far Alaska’slargest fishery. In 1990, according to theCommercial Fisheries Entry Commission (CFEC),72 percent of the 14,587 individuals who ownedand fished monitored permits fished for salmon.By 2002, only 8,823 individuals were still activelyfishing permits, but 74 percent were still fishingfor salmon. While many participated in other

4 ALASKA ECONOMIC TRENDS OCTOBER 2003
Source: Alaska Department of Fish and Game
Source: Commercial Fisheries Entry Commission (CFEC)
2
Alaska Salmon PermitsMarket value
1990 2002$0
$200
$400
$600
$800
$1,000
$1,200
$1,400$ Millions
1988 1988 prices 2002 % Decline % Declineprices in 2002 CPI prices ‘88–’02 ‘88–’02
nominal $ adjusted $ nominal $ nominal value adj. value
Pink $.79 $1.20 $.06 -92% -95%
Sockeye 2.37 3.60 .55 -77% -85%
Chum .86 1.31 .16 -81% -88%
Coho 1.72 2.62 .37 -78% -86%
King 2.69 4.09 1.23 -54% -70%
3
Ex-Vessel Prices Collapse1988 to 2002
fisheries, salmon was usually considered themainstay, and other fisheries were often merelyoff-season supplements to income. In recentyears, this relationship has been changing. (Itshould be noted that these data do not includecrew, but rather represent the number of fishingendeavors. In other words, the number of peopleaffected is larger than the number of permits.)
In 1990, the Alaska wild salmon harvest yielded302,600 metric tons, with fishermen receiving$559 million for their catch. By 2002, the volumeof the harvest was lower at 238,000 metric tons,but the value had fallen to $130 million. The 21percent decline in volume did not approach themuch larger decline in value. Processors, in anattempt to remain competitive with farmed fishon world markets, lowered wholesale prices,which translated into lower prices for fishermen.(See Exhibit 1.)
Over the last decade and a half, the ex-vesselprices (the prices fishermen receive) paid toAlaska fishermen have fallen from record highs in1988 to record lows in 2002. This decline is evenmore dramatic if inflation is taken into account.As operating costs continued to rise, real prices(adjusted for inflation) fell on the order of 85percent or more. (See Exhibit 2.)
As the prices paid for fish collapsed, the value offishermen’s investments in vessels and gearfollowed a similar trajectory. In 1990, CFECestimated the market value of the 12,084 validsalmon limited entry permits at $1.247 billion. By2002, estimates placed the value of the remaining11,421 permits at $204 million. (See Exhibit 3.)This billion-dollar decline in asset valuationamounted to 84 percent, and was probablymatched by a similar trend in vessel valuation.The value of salmon permits varies and theselosses impacted some fisheries more severelythan others; still, the average decline in value ofa generic salmon permit amounted to $91,347.This loss of equity, which for self-employedfishermen is equivalent to retirement accounts,will continue to reverberate throughout the Alaskaeconomy in coming years.

ALASKA ECONOMIC TRENDS OCTOBER 2003 5
Alaska Seafood Processing Average monthly employment
Source: Alaska Department of Labor and Workforce Development,Research and Analysis Section
4
The low prices paid for salmon caused fishingincomes to drop and many fishermen were forcedout of the industry, while others left voluntarily. In1990, 10,487 individual permit holders fished forsalmon in Alaska. By 2001, statewide participationin the fisheries had declined to 6,567 permitholders. This 37 percent decline in fishing effortresulted in fewer fishing opportunities for crewmembers, thus fewer jobs for Alaska’s coastalcommunities. The Alaska Department of Fish andGame reports that the 1990 sale of unduplicatedcrew licenses amounted to 31,607. By 2002,only 16,995 unduplicated licenses were issued.While there are other reasons that partially explainthis decline, reductions in the number of vesselsfishing for salmon and reduced earnings in thefishery are clearly linked to this trend.
Seafood processors have also sought greaterefficiencies through consolidation of operations,plant closings, reductions in fleet size and “just intime” hiring. As a result, many salmon fishermenhave lost markets and Alaska’s average monthlyseafood processing employment has declinedfrom 11,200 in 1992 to 7,400 in 2002. This 22percent decline would have been greater, hadnot the Bering Sea groundfish industry partiallyoffset the jobs lost in the salmon industry. (SeeExhibit 4.)
Some multinational firms, like George WestonLtd. (Nelbro) left the Alaska salmon fisheries toinvest in Chilean and Canadian farms. Others likeNichiro (Peter Pan) retained Alaska operationsbut also invested in Chilean farmed production.Smaller processors, perhaps lacking the financialresources of their multinational competition,struggled to find niche markets or closed theirdoors. Wards Cove Packing Company, one of thelargest and longest operating firms in the state,announced its decision to cease all Alaska salmonoperations in 2002.
Why it happened
Farmed salmon enjoys a number of competitiveadvantages. Unlike seasonal wild harvests, penreared salmon are available fresh on a year round
'92 '93 '94 '95 '96 '97 '98 '99 '00 '01 '020
2
4
6
8
10
12Thousands
basis. Quality control is enhanced when salmonare harvested and processed at the more leisurelypace farms allow. Most importantly, the supply offarmed salmon is predictable, and production canbe planned to meet anticipated demand.
The two major suppliers of farmed salmon to theU.S. market are Canada and Chile. Canadianfarms benefit from their proximity to U.S.population centers and a well-developedtransportation network. In addition, Canada is apartner in the North American Free TradeAgreement (NAFTA), which has removed manytrade barriers to their products.
The competitive advantage Chilean farmed salmonenjoys is largely based on less stringentenvironmental regulation and the low cost oflabor. Over 90 percent of Chile’s salmon industryis located in The Region of the Lakes, one of thepoorest areas in the country. In 2001, the averagewage paid to Chilean workers in the salmonindustry was $199 U.S. per month, with 80 percent

6 ALASKA ECONOMIC TRENDS OCTOBER 2003
Alaska Exports to Foreign Countries20025
Source: U.S. Census Bureau
of the workers averaging $133. In the same yearthe Chilean government’s poverty level for afamily of four was $240. Alaska seafood processingworkers, protected by minimum wage laws,earned an average monthly salary in excess of$2,100 in 2001.
Seafood is important to Alaska
Of Alaska’s direct foreign exports, seafoodaccounted for $1.33 billion in 2002, or 53 percentof Alaska’s $2.5 billion export market. (See Exhibit5.) Though large, this number understates theimportance of the industry, due to the way inwhich the U.S. Census Bureau monitors exports.Unlike Alaska’s mineral and timber resources,which are for the most part shipped directly fromAlaska ports, much of Alaska’s seafood harvest,including most canned and frozen salmon, is firsttransported to Seattle and other Puget Sound areacities before being shipped to foreign countries.As a result, these products of Alaska origin arecounted as Washington exports. U.S. CensusBureau data show that the port of Seattle aloneexported $930 million of fishery products in2001. Much of this (including $142 million offrozen and $150 million of canned salmon) wasmost likely of Alaska origin.
The Japanese connection
In 2002, Japan provided a market for 53 percentof Alaska’s seafood exports. This was down from69 percent in 2000. Much of this was processedby Alaskan affiliates of Japanese firms. Theseincluded Marubini-owned North PacificProcessors, Maruha-owned Western AlaskaSeafoods, Nippon Suisan-owned Unisea, andNichiro-owned Peter Pan. The foreign directinvestment of such companies, which is anotheraspect of globalization, results in processing jobsfor Alaskans as well as markets for Alaska fishermen.
In 2002, Alaska direct seafood sales to Japanamounted to $707.8 million. While this is animpressive figure, it was down considerably fromthe 1990-1995 period when annual sales were
6Sockeye Harvests and Exports Japan accounts for 90%+ of exports
Seafood$1,335M
Zinc, Lead, Gold$380M
Oil/Gas/Coal$281M
Fertilizers$162M
Wood$129M
Other$230M
'94 '95 '96 '97 '98 '99 '000
100
200
300
400Million Lbs.
Source: Alaska Department of Community and Economic Development
Harvest
Export

ALASKA ECONOMIC TRENDS OCTOBER 2003 7
7Sockeye Exported Fresh/Frozen Percent of Harvest
consistently above the $1 billion mark. The peakyear was 1992, when direct seafood sales to Japanreached $1.56 billion. Since that time annualsales have declined 55 percent in value. Thisdecline is largely explained by the globalization ofthe salmon industry, and the displacement ofAlaska’s exports of salmon.
In the early 1990s significant quantities of freshand frozen sockeye salmon were shipped directlyfrom Alaska to Japan, and thus contributed toAlaska’s export total. Indeed, U.S. exports offresh/frozen sockeye salmon slipped from 61percent of the total 1994 harvest of nearly 292million pounds, to only 38 percent of the muchsmaller 2000 harvest of 206 million pounds. (SeeExhibits 6 and 7.)
This was also a period before the Japaneserecession had established a firm hold on theeconomy, and the yen was stronger in relation tothe dollar. Holding a near monopoly on bothproduction and the tastes of the Japaneseconsumer, Alaska sockeye commanded premiumprices. But this was also the period when importsof pen-reared salmon began making inroads inthe increasingly budget conscious Japanese diet.The salmon industry was being globalized!
Globalization of the salmon industry
In the 1970s and 1980s, Alaska enjoyed a dominantposition in the world salmon market. Siberianruns, the only real rival in terms of wild stockharvests, were safely behind the iron curtain, andnot available on free world markets. Japanesehigh seas interceptions of Alaska salmon had beenlargely eliminated. Wild Atlantic harvests wereminiscule, and techniques of pen rearing had notyet been perfected.
In this period when wild salmon harvestsdominated world markets, years of large harvestsled to lower unit prices, while years of low harvestsresulted in higher prices to fishermen. Variationsin catches were at least partially offset by variationsin unit value.
'94 '95 '96 '97 '98 '99 '000%
10%
20%
30%
40%
50%
60%
70%
Source: Alaska Department of Community and Economic Development
Farmed Atlantic & Coho vs.Alaska wild salmon harvest8
Sources: F.A.O. and Alaska Department of Fish and Game
'92 '93 '94 '95 '96 '97 '98 '99 '00 '010
200
400
600
800
1,000
1,200
1,400Thousands metric tons
Farmed
Alaska Wild

8 ALASKA ECONOMIC TRENDS OCTOBER 2003
9
Source: F.A.O.
'93 '94 '95 '96 '97 '98 '99 '00 '01$0
$500
$1,000
$1,500
$2,000
$2,500
$3,000
$3,500$ millions
Farmed Atlantic & Coho SalmonValue of world production
In 1980, farmed salmon amounted to only onepercent of the world’s salmon production. By1991, the output of pen reared salmon exceededthe entire wild stock harvest of the United States.By 1992, it accounted for 32 percent of theworld’s production, and by 2002 it accounted forover 60 percent of the global supply of salmon.(See Exhibits 8 and 9.)
Because farmed salmon has the economicadvantage of predictability, it allows for plannedlevels of harvest. These levels are based uponanticipated demand, and are of such scale as todominate world supplies. This effectively sets theworld price for salmon.
Alaska’s shrinking market share
In the course of two decades, Alaska has fallenfrom world leadership in salmon production to a
marginal position. In 1990, Norwegian farmedsalmon had begun to make inroads into what hadbeen the traditional domestic markets for theAlaska harvest. In September of that year, theU.S. Department of Commerce imposed a 2.96percent anti-dumping duty on fresh and chilledAtlantic salmon from Norway. It later imposedcompany specific dumping margins ranging from15.65 percent to 32.8 percent. As a result, U.S.imports of Norwegian farmed salmon plummetedfrom 9,450 metric tons in 1990 to 1,320 metrictons in 1991. On a broader scale, however, thesemeasures proved ineffective, as Norwegian firmsshifted production to other countries and U.S.imports of farmed salmon continued to grow.
Domestic market
In 2002, the United States imported 213,674metric tons of processed and semi-processedsalmon valued at $920 million. This comparedwith a total Alaska round weight harvest of146,800 metric tons (excluding pink salmon, whichis mostly canned and does not directly competewith farmed salmon). In comparing these volumes,it should be remembered that round weightsshould be adjusted downward by at least 25percent in order to account for weight losses dueto heading and gutting. Moreover, much of theimported salmon was in fillet form, which involvesfar greater weight losses.
By far the greatest part of the U.S. imports,187,357 metric tons, was Atlantic pen rearedsalmon, valued at $818 million. Canada andChile accounted for 94 percent of the total, withChile garnering $384.4 million in revenue,compared to Canada’s $373.4 million. Ironically,Norwegian firms who had seen their Scandinaviansalmon forced off the U.S. market controlled asignificant amount of both countries’ production.The fact that Canada is a NAFTA partner, and thatthe U.S. has just approved a bilateral free tradeagreement with Chile, would seem to indicatethat these imports will continue to grow. (SeeExhibit 10.)

ALASKA ECONOMIC TRENDS OCTOBER 2003 9
As mentioned above, lower priced pink salmonare usually canned and are less directly impactedby pen-raised imports. That is not to say, however,that Alaska pink salmon does not have competitionon the world market. Low cost canned Siberianpink salmon is becoming more available onEuropean markets. In addition, Alaska pinks mustcompete with a sea of low priced canned tuna,mostly from Thailand. While not directlycomparable, there is considerable productsubstitution, with consumers buying two or threecans of tuna rather than a single can of moreexpensive salmon. In 2002, the United Statesimported 171,500 metric tons of canned tunavalued at $399 million. U.S. canned salmonexports in the same year amounted to 41,800metric tons valued at $133 million.
Export market
Just as Alaska salmon has been displaced from itstraditional domestic market, it has suffered severesetbacks in the Japanese market. In 1990, Chilewas a minor player harvesting only 23,313 metrictons of farmed salmon. By 2001, the Chileanfarmed salmon industry had grown to rival that ofNorway, harvesting 404,550 metric tons roundweight compared to Norway’s 426,000. Not onlywas it the largest supplier of fresh Atlantic salmonto the United States, it had made major inroadsinto the Japanese market where inexpensivefarm raised coho displaced Alaska sockeye salmon.
At one time, Alaska supplied 90 percent of thesalmon consumed in Japan. By 2001, Chile wasselling more than 160,000 metric tons to Japanand had captured 70 percent of the market. Inthat year, Japan imported 45 percent of Chile’sfarmed salmon production valued at $435 million,while the United States imported 38 percent ofthe country’s output valued at $364 million. Thisaccounted for 47 percent of the total U.S. importsof farmed salmon valued at $767 million, andmatched the value of farmed salmon importedfrom neighboring Canada. (See Exhibit 11.)
Over the same period, U.S. exports of salmon(mostly of Alaska origin) declined significantly invalue. In 1990, U.S. salmon exports totaled171,000 metric tons valued at $859 million. Japanwas by far the largest consumer, importing 118,000metric tons valued at $644.5 million. By 2001,total U.S. exports of salmon had fallen to 152,000metric tons valued at $547 million, while Japaneseconsumption had fallen to 41,800 metric tonsvalued at $228.7 million.
Companies are international
Multinational companies often have facilities inseveral countries, and base decisions concerningproduction on overall corporate profits.Norwegian firms such as Stolt Seafarms, Cermaqand Fjord Seafood control 40 percent of Chile’ssalmon production. European companies likeMarine Harvest as well as Japanese and NorthAmerican firms also control a significantpercentage.
Processed imports AK round weight harvest0
50
100
150
200metric tons
U.S. Imports of Atlantic SalmonAnd Alaska round weight harvest10
Source: National Marine Fisheries Service and Alaska Department of Fish and Game

10 ALASKA ECONOMIC TRENDS OCTOBER 2003
The growth of the farmed salmon industry and theresulting competition for markets has also led totransnational consolidations. Four large companies,Stolt Sea Farms A/S, Pan Fish ASA, Marine Harvestand Heritage Salmon now produce more thanhalf the farmed salmon sold in North America. Allfour have pen-rearing operations in Europe andCanada, and all except Pan Fish, (which owns allthe farms in Washington state), own farms inChile.
Marine Harvest, the largest, is a subsidiary of theDutch giant Nutreco which operates over 200salmon farms in Norway, Scotland, Ireland, Chile,Canada, and Australia. By various estimates, itaccounts for between 16 and 20 percent of globalfarmed salmon production. Its corporate parent,Nutreco also supplies approximately 40 percentof the world’s salmon feed. More ominously forAlaska’s other fisheries, the company has begunoperations involving pen reared halibut and cod,while others have instigated projects involvingsablefish.
Heritage Salmon, another of the four dominantcompanies, is a division of George Weston Ltd.,a giant Canadian food company that oncedominated the Canadian wild salmon industrywith its subsidiary B.C. Packers. The companyalso operated in Alaska under the name Nelbro.Weston has since divested itself of its wild salmonties, and has instead invested in large scale salmonfarming in Maine, New Brunswick, BritishColumbia and Chile. With the moratorium onBritish Columbia pen rearing sites being lifted, itis expected that Heritage and other B.C. farmswill soon expand these operations.
Alaska resists a global trend
For a variety of political as well as biological andenvironmental reasons, Alaska has adoptedlegislation that prohibits salmon farming. Whilethere remains considerable debate over theenvironmental hazards and health risks posed byfarmed salmon, there is no longer any doubtabout its economic success. With or withoutAlaska’s participation, the industry will continueto grow, and farmed salmon will continue todominate both world markets and prices.
Canada does not
Unlike Alaska, Canada has adopted policiesfostering farms. The economic displacement ofCanadian salmon fishermen has, however, beensomewhat mitigated by a buy-back programcommonly known as the Mifflin Plan. This involvedthe elimination of licenses as well as cash incentivesfor salmon fishermen to leave the fisheries. Whileenvironmental groups, First Nations andneighboring Alaska continue to object, the B.C.Provincial government as well as the Canadiannational government are pursuing policiesintended to enhance salmon farming opportunitiesand increase production, especially in northernB.C. These farms are not only economic rivals tothe Alaska industry, but according to the AlaskaDepartment of Fish and Game, may pose abiological risk to healthy wild stocks in the Provinceas well as Alaska.
Chile47%
Norway4%
Canada47%
UK2%
11Imports of Farmed SalmonMarket share by value
Source: U.S. Department of Commerce, Seafood Market Analyst

ALASKA ECONOMIC TRENDS OCTOBER 2003 11
Can pollock take the place of salmon?
While the recent investment strategies of trans-national corporations have resulted in majordisplacements in Alaska’s salmon industry, theyhave also contributed to the Alaska economy bydeveloping the Bering Sea pollock fishery. This isnow the largest single species food fishery in theworld in terms of volume, and the largest fisheryin the state in terms of value. The collapse of theAtlantic cod fishery played a major role in allowingmarket opportunities that the industry hasexploited and filled. Both Norwegian andJapanese firms were instrumental in thedevelopment of this fishery, and the latter continueto play an important role in onshore processing.
While the volume of the pollock harvest is manytimes that of the salmon fishery, the employmentopportunities in the harvest sector are far morelimited. Unlike the salmon fishery, which hastraditionally relied on a large number of smallboats, the pollock fishery involves a relativelysmall number of large vessels. In 2002, only 262individual vessel operators made landings in theBering Sea trawl fishery, which amounted to anastounding 2.7 billion pounds. If one assumes acrew of six aboard each of these trawl vessels,total harvesting employment would have rangedbetween 1,500 and 1,600. This number is anorder of magnitude smaller than the jobs generatedby the 6,567 salmon permits now remaining. Still,the volume of the pollock catch creates a largenumber of processing jobs.
The economic returns from the salmon fisheryare widely distributed among the small fishingports of Alaska. The pollock fishery, by contrast, isconcentrated in Dutch Harbor, which consistentlyleads the nation in terms of volume of fisherieslandings. Most of the vessels are Seattle based, asare most of the processors.
Although the pollock fishery does not touch asmany Alaskans as the salmon fishery, there havebeen winners. The Community Development
Quota (CDQ) program, which allocates harvestshares of crab as well as groundfish, has producedsignificant economic benefits for Western Alaskavillages bordering the Bering Sea. Not only doesthe CDQ program bring direct funds to thecommunity, it provides employment opportunitiesin both harvesting and processing. This is especiallyimportant to these rural communities, as thetraditional salmon fisheries become less profitable.
Conclusion
The world salmon industry is only one example ofthe ongoing process of globalization. WhileAlaska has suffered an economic shock in thisparticular case, it has also profited from foreigndirect investments in its other industries. Whetherglobalization will ultimately be beneficial ordetrimental to Alaska remains an open question.Whether it will continue to play an ever-largerrole in the state’s economy, does not. Alaska andAlaskans have little choice but to adapt to thisreality, and to carve out a place for themselves inthis new global economy.

12 ALASKA ECONOMIC TRENDS OCTOBER 2003
'72 '73 '74 '75 '76 '77 '78 '79 '80 '81 '82 '83 '84 '85 '86 '87 '88 '89 '90 '91 '92 '93 '94 '95 '96 '97 '98 '99 '00 '01
0
2
4
6
8
10
12
14
16Incidence rates per 100 workers
Occupational Injury and Illness Rates Alaska private sector 1972-2001
Occupational Injury and Illness by Kevin Virden andDean RasmussenLabor Economists
1
Source: Alaska Department of Labor and Workforce Development, Research and Analysis Section
A
A report on safety in Alaska’s workplaces
Without lost workday cases
Lost workday cases
total of 15,500 nonfatal injuries andillnesses occurred in the workplace inAlaska’s private sector in 2001. This isan injury and illness rate of 8.5 casesper 100 full-time equivalent workers.
Injuries were responsible for 14,600 (94 percent)of the cases, and the remaining 900 (6 percent)involved illnesses.
Of the total, 7,500 (48 percent) were lost workdaycases, that is, they required recuperation awayfrom work or restricted duties at work, or both.The remaining 8,000 (52 percent) estimatedinjuries and illnesses did not involve lost workdays.
Nationally, about 5.2 million nonfatal injuries andillnesses occurred in the private sector workplacein 2001. The incident rate across all industriesnationally was 5.7 cases per 100 full-timeequivalent workers.
An occupational injury can be the result of a cut,fracture, sprain, amputation, etc., which results
from a work accident, or from exposure from asingle, or instantaneous, event in the workenvironment. An illness is any abnormal conditionor disorder, other than one resulting from anoccupational injury, caused by prolongedexposure to environmental factors associatedwith employment. It includes acute and chronicillnesses or diseases that may be caused byinhalation, absorption, ingestion, or direct contact.
Historical look at state injury and illnessrates
Alaska’s injury and illness rates dropped abruptlysoon after the passage of the Occupational Safetyand Health Act (OSHA) of 1972. The 1970s wasalso the decade the Trans-Alaska Pipeline wasconstructed. After a high of 14.7 of recordableinjury and illness cases per 100 workers in 1973,the rate dropped to about 10 cases from 1975-1988. In 1989 the Exxon Valdez grounded andspilled 257,000 barrels of oil in Prince WilliamSound. The massive cleanup response appears to

ALASKA ECONOMIC TRENDS OCTOBER 2003 13
Source: Alaska Department of Labor and Workforce Development, Research andAnalysis Section and U.S. Dept. of Labor, Bureau of Labor Statistics
Alaska and U.S. Incidence RatesOccupational injuries and illnesses 1996-20012
have directly increased the rate of injuries andillnesses following the spill. Rates remained above10 incidents per 100 workers through 1993. Thedrop in 1994 to the current average of about 8cases per 100 workers was largely due todecreasing injury and illness rates in theconstruction and service industries, which havemaintained lower incident rates since. (SeeExhibit 1.)
In 2001 Alaska’s private sector injury and illnessrate rose to 8.5 per 100 workers, up from a recordlow of 7.6 in 2000. The rate was fairly steady atabout 8.5 cases per 100 workers from 1994 to1997, and 8 cases or fewer from 1998 to 2000.
The national private sector injury and illness rateof 5.7 cases per 100 workers in 2001 was ahistoric low. Since 1992, the national injury andillness rate has steadily declined while Alaska’s hastracked relatively flat. Alaska’s public sector, thatincludes local and state government, showed littlechange over the past six years. (See Exhibit 2.)Federal government injury and illness statisticswere not collected in this study.
All recordable injuries and illnesses, whether withor without lost workdays, entail one or more ofthe following criteria: medical treatment beyondfirst aid, loss of consciousness, days away fromwork, restricted work activity or job transfer.Injuries and illnesses are also recordable if work-related and deemed “significant,” as defined bythe Occupational Safety and HealthAdministration, the federal agency created toprevent work-related injuries, illnesses, anddeaths.
Injuries and illnesses are costly toAlaska employers
Workplace safety is an important issue foremployers. In a competitive economy, it costs agreat deal of money to attract and retain a skilledemployee. It is costly for the employee to misswork due to a preventable illness or injury. If aworker is injured on the job a worker’s com-
pensation claim will be filed against the employer.
During the 2001 calendar year, a total of $192.7million was paid in workers’ compensationbenefits. This includes payments for medical,disability, and rehabilitation costs. This is anincrease of 16.4 percent over 2000’s total of$165.6 million, and compares to $149.2 millionin 1999, $140.5 million in 1998, and $144.7million in 1997. (See Exhibit 3.)
Financing for workers’ compensation programscomes from employers. The premiums paid byemployers are based on their industry classificationand the occupational classifications of theirworkers. Most large employers are also“experience rated,” which results in higher orlower premiums for employers whose pastexperience demonstrates that their workers areat greater or lesser risk of occupational injuries ordisease than are workers for similar employers inthe same industry.
1996 1997 1998 1999 2000 20010
2
4
6
8
10Incidence rates per 100 workers
U.S. Private Sector
Alaska Private Sector
Alaska Public Sector

14 ALASKA ECONOMIC TRENDS OCTOBER 2003
3Workers’ CompensationTotal Alaska payments 1992–2001
Source: Alaska Department of Labor and Workforce Development, Research andAnalysis Section and Division of Workers Compensation
Injury and illness rates vary by industry
Injury and illness rates are typically analyzed bythe industry in which they occurred. For thissurvey, the Standard Industrial Classification,better known as the SIC, was used to reportincidence rates. (See Exhibit 4.) The SIC providesseveral broad industry divisions, as well assubdivision levels, in which work activity occurs.The major SIC industries in this analysis areMining; Construction; Manufacturing;Transportation, Communication & Utilities;Wholesale & Retail trade; Finance, Insurance,& Real Estate; and Services.
Mining showed the lowest injury and illnessrate of all major industries in Alaska in 2001. Infact, mining, which includes oil and gasextraction, was the only major Alaska industrialsector that had an injury and illness rate belowthat of the national average. Stringent safetypolicies in Alaska’s metal mining and oilextraction industries appear to have helpedcreate a lower incidence rate in the state. Oilcompanies actively promote safety programs
and provide safety training opportunities for theirworkers. Nationally, mining injury/illness rates havedeclined the last few years, but remain higher thanAlaska’s.
Manufacturing and construction
Injury and illness incidence rates in manufacturing,at 17.7 per 100 workers in Alaska, were twice ashigh as nationwide, a fact related to the nature ofAlaska’s manufacturing sector, which is composedlargely of seafood and wood processing. The risksto employees in these industries are greater than intypical manufacturing sectors in the lower 48, wherecontrolled environments and assembly lines are thenorm.
In Alaska’s seafood processing and wood processingindustries, many worker tasks involve extensivemanual labor. Employees work long hours androutinely handle sharp objects such as knives andmachines with cutting edges. Work areas are oftenwet and slippery, sometimes cold, and frequentlynoisy.
Construction had the second highest incidencerate of injuries and illnesses with 12.5 cases per 100workers in 2001 in Alaska. This rate was up from11.1 in 2000, a reversal of the recent five-yeartrend of declining rates in construction. The increasein 2001 was mainly distributed across generalbuilding contractors and special trade contractors,with heavy construction and residential buildingthe only subsectors that saw a rate decline since1996. Alaska’s incidence rate for constructionremains above the national average of 7.9 cases per100 workers for 2001. While the state’s heavyconstruction injury and illness rates are close to thenational rate, incidence rates in general buildingand special trade contractors raise the industry’soverall rate to above the national level.
Alaska’s 2001 incidence rate in transportation,communication and utilities was 10.7 per 100workers. This compared with a national rate of 6.9cases. Although the state rate was up slightly fromthe previous few years, the industry’s overall injuryand illness rate has remained relatively unchangedsince 1996. At the sub-industry level, Alaska’s
'92 '93 '94 '95 '96 '97 '98 '99 '00 '01
0
50
100
150
200
Millions of dollars

ALASKA ECONOMIC TRENDS OCTOBER 2003 15
Source: Alaska Department of Labor and Workforce Development, Research and Analysis Sectionand U.S. Department of Labor, Bureau of Labor Statistics
Incidence Rates1 by Industry Occupational injury and illness
Alaska and U.S.4 Industry 1996 1997 1998 1999 2000 2001 2001
Private Industry2 8.5 8.4 7.8 8.1 7.6 8.5 5.7
Mining3 5.8 4.2 3.2 4.3 3.8 2.7 4.0
Metal mining 5.8 4.9 3.9 3.3 4.3 3.7 4.2
Oil and gas extraction 5.8 4.1 3.2 4.4 3.8 2.6 3.3
Construction 11.9 11.5 11.8 11.0 11.1 12.5 7.9
Manufacturing 16.4 18.8 17.7 15.3 14.8 17.7 8.1
Lumber and wood products 24.9 21.0 16.9 19.5 26.9 21.0 10.6
Food and kindred products 17.3 21.7 21.4 17.4 14.7 19.3 10.9
Canned and cured seafood * 15.3 13.4 15.7 17.5 13.5 *
Fresh or frozen prepared fish 18.1 24.0 23.9 17.8 14.3 21.6 10.4
Transportation, comm & utilities 10.3 10.2 9.8 9.3 9.5 10.7 6.9
Trucking and warehousing 15.6 13.9 13.6 15.9 17.8 16.3 8.4
Water transportation 13.9 10.7 12.4 9.2 12.1 14.6 6.0
Air transportation, scheduled 16.2 16.3 16.9 14.3 15.8 15.5 14.4
Air transportation, nonscheduled * * * 3.4 6.2 6.9 4.2
Communications 3.2 4.8 3.3 5.3 3.0 5.0 2.9
Wholesale and retail trade 7.6 8.1 7.6 8.0 7.1 8.2 5.6
Wholesale trade 8.4 8.4 7.4 9.3 7.0 7.4 5.3
Retail trade 7.4 8.0 7.6 7.7 7.1 8.4 5.7
General merchandise stores 10.1 9.6 8.8 8.5 7.8 9.6 7.8
Food stores 9.5 10.8 10.6 8.2 9.7 8.9 7.5
Eating and drinking places 5.0 6.8 6.6 7.6 5.5 7.4 5.3
Finance, insurance, and real estate 4.5 3.4 4.0 3.7 3.9 4.0 1.8
Services 6.3 5.5 5.0 6.6 6.0 6.6 4.6
Hotels and other lodging places 8.2 7.7 7.4 9.5 8.1 9.5 7.2
Health services 9.5 7.0 7.8 8.6 * 7.8 7.2
Alaska U.S.
1 Injury and illness cases per 100 full-time workers2 Totals include data for industries not shown separately.3 Data from Mine Safety and Health Administration, U.S. Department of Labor.* Not publishable
scheduled air transportation rate is slightlyhigher than the equivalent national rate.Nonscheduled air transportation shows agreater disparity between state and nationalinjury and illness rates. Alaska’s injury andillness rates in trucking and water transportationwere twice the national rates.
Wholesale and retail trade injury and illnessrates rose to 8.2 in 2001 after reaching a lowof 7.1 cases per 100 workers in 2000. Thisincrease was largely due to increases indepartment stores and eating and drinkingplaces. While department stores haveremained relatively unchanged since 1996,eating and drinking places have displayed anupward trend in rates during that period.Wholesale trade has actually had a declininginjury and illness rate since 1996, but thesedeclines were more than offset by increasesin the retail sector. The national rate of 5.6for wholesale and retail trade reflects severalconsecutive years of rate declines. Bothinjury and illness rates for wholesale and retailat the national level remain substantially lowerthan Alaska’s. Trade had the highest numberof injury and illness incidents in Alaska, withapproximately 3,900 total cases.
Finance, insurance, & real estate did not seea big change in 2001, but injury and illnessrates have decreased slightly since 1996.Holding and other investment office ratesdecreased slightly, but this was partially offsetby small rate increases in real estate firms.Alaska’s rate of 4.0 injuries and illnesses per100 workers is more than twice the nationalaverage of 1.8 cases for finance, insurance,and real estate firms. Real estate firms inparticular, have a much higher rate in Alaskathan the rest of the nation.
Services, with the most employment of all themajor industries, showed an increase from itslow of 5.0 cases per 100 workers in 1998 to6.6 in 2001. Still, the 2001 rate is only slightlyabove the 1996 figure of 6.3. The majorityof the increase is due to higher injury andillness rates in hotels and other lodging places.
The national average for services was 4.6, but therelatively high employment numbers in hotels andother lodging places may account for Alaska’s higherrates. Hotels and other lodging places havehistorically had higher injury and illness rates thanother forms of services.

16 ALASKA ECONOMIC TRENDS OCTOBER 2003
6 Days Away from Work CasesBy part of the body affectedAlaska private sector 2001
5Days Away from Work CasesBy nature of injury or illnessAlaska private sector 2001
Studying injuries and illnesses indifferent ways
To learn more about workplace injuries andillnesses, the OSH survey uses four maincharacteristics to study an injury or illness casethat results in days away from work, restrictedduties at work, or both. These are
1) nature of injury or illness; 2) part of body affected; 3) event or exposure; and 4) source of injury or illness.
The nature identifies the physical characteristicsof an injury or illness. A strained muscle orpunctured skin are examples of the nature of aninjury. Carpal tunnel syndrome would be thenature of an illness. Sprains, strains, and tearswere the most common nature identified,accounting for 47.8 percent of all injuries andillnesses. This type of injury was most prominentin the services and retail divisions, althoughmanufacturing and construction also hadsubstantial numbers. (See Exhibit 5). The nexthighest nature was soreness and pain, representing9.3 percent of the total natures. Sprains, strains,and tears resulted in an average of five days awayfrom work, while soreness and pain had an averageof six days away from work.
The part of body identifies the location of themost serious area of injury. Injuries can occur toa part of the body such as a finger, toe, or wrist. Insome instances, more than one part of the bodyis affected. The trunk, or main part of the body,was the most frequently affected by injury, withover 67 percent of all trunk injuries involving theback. (See Exhibit 6). The second most commonlyaffected body area was the lower extremities,including feet, knees, and legs. The upperextremities, hands, elbows, and arms, followed.
The event or exposure is coded to describe whathappened. Did the victim fall down or did amoving object strike him? These questions wouldbe answered by the event characteristics. Themost frequently occurring injury and illness event
Sprains, strains47.8%
Carpal tunnelsyndrome 1.6%
Multiple injuries3.5%
Cuts, lacerations,punctures 5.7%
Fractures6.8%
Bruises,contusions
7.5%
Soreness,pain9.3%
Other17.7%
Trunk39.4%
Other3.5%
Head5.4%
Multiple bodyparts 9.0%
Upper extremities20.8%
Lowerextremities
21.9%
Source: Alaska Department of Labor and Workforce Development, Research and Analysis Sectionand U.S. Department of Labor, Bureau of Labor Statistics
Source: Alaska Department of Labor and Workforce Development, Research and AnalysisSection and U.S. Department of Labor, Bureau of Labor Statistics

ALASKA ECONOMIC TRENDS OCTOBER 2003 17
for 2001 was overexertion, followed by contactwith objects and equipment, and third, falls. (SeeExhibit 7.) Overexertion involves activities suchas lifting, pulling or pushing, throwing, and carryingobjects. These injuries are most common in theretail, transportation, and manufacturing sectors.Injuries where contact with objects andequipment were listed as the event most oftenoccurred when victims were struck by falling,flying, or swinging objects or by being caught in,or compressed by, equipment. Most falls involvedinjury from falling onto the surface that had beensupporting the worker. An example is a workerstumbling and falling to the floor when carrying abox or crate. In a smaller number of falls thevictim landed on a lower level, such as a carpenterfalling off a ladder onto the ground.
Finally, the source of an injury or illness is theobject or substance that directly harmed theworker. If a forklift struck a worker and caused theinjury, then the forklift would be listed as thesource of the injury. The most numerous sourceof injuries in 2001 involved floors, walkways andground surfaces, representing 19.2 percent of allsources, which reflects the relatively high numberof falls. (See Exhibit 8). The second highestsource of injury was containers; more than 1,000of the 6,378 total cases cited containers as thesource that directly caused the injury. These, forexample, can be found in air cargo and seafoodprocessing operations. There were also a highnumber of cases where the injured worker wasactually the source of the injury. This most oftenoccurs when the actual position or motion of theinjured worker causes the injury, such as in caseswhere reaching, twisting, slipping, or walking isinvolved. The injured worker was cited as thesource in 15.4 percent of the cases. Carpal tunnelsyndrome, which is considered an illness forpurposes of the survey, would also be counted inthis category.
Occupations at risk
The occupation with the highest number of injuriesand illnesses in 2001 for Alaska involving daysaway from work was hand packers and packagersat 623 incidents. The vast majority of these
7Days Away from Work Cases By event or exposure
Alaska private sector 2001
8Days Away from Work Cases By source of injury or illness
Alaska private sector 2001
Contact withobject, equipment
24.7%
Overexertion26.6%
Other16.5%
Transportationaccident 2.6%
Slips, trips 2.8%
Exposed to harmfulsubstance 4.4%
Repetitive motion 4.5%
Fall to lower level5.3%Fall on same level
12.6%
Floor, ground surfaces19.2%
Other27.0%
Machinery5.0%
Vehicles6.6%
Parts and materials10.4%Worker motion
or position15.4%
Containers16.2%
Source: Alaska Department of Labor and Workforce Development, Research and AnalysisSection and U.S. Department of Labor, Bureau of Labor Statistics
Source: Alaska Department of Labor and Workforce Development, Research and AnalysisSection and U.S. Department of Labor, Bureau of Labor Statistics
18 ALASKA ECONOMIC TRENDS OCTOBER 2003
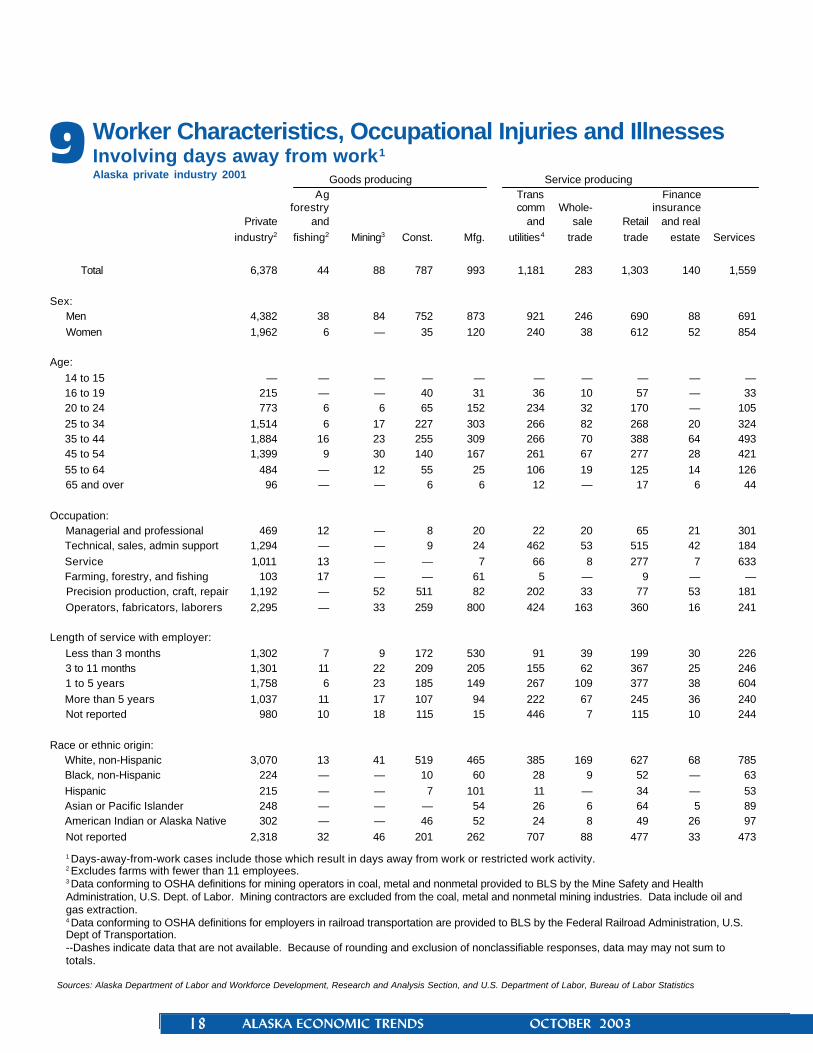
9Worker Characteristics, Occupational Injuries and IllnessesInvolving days away from work1
Alaska private industry 2001
Sources: Alaska Department of Labor and Workforce Development, Research and Analysis Section, and U.S. Department of Labor, Bureau of Labor Statistics
Goods producing Service producingAg Trans Finance
forestry comm Whole- insurancePrivate and and sale Retail and real
industry2 fishing2 Mining3 Const. Mfg. utilities4 trade trade estate Services
Total 6,378 44 88 787 993 1,181 283 1,303 140 1,559
Sex: Men 4,382 38 84 752 873 921 246 690 88 691 Women 1,962 6 — 35 120 240 38 612 52 854
Age: 14 to 15 — — — — — — — — — — 16 to 19 215 — — 40 31 36 10 57 — 33 20 to 24 773 6 6 65 152 234 32 170 — 105 25 to 34 1,514 6 17 227 303 266 82 268 20 324 35 to 44 1,884 16 23 255 309 266 70 388 64 493 45 to 54 1,399 9 30 140 167 261 67 277 28 421 55 to 64 484 — 12 55 25 106 19 125 14 126 65 and over 96 — — 6 6 12 — 17 6 44
Occupation: Managerial and professional 469 12 — 8 20 22 20 65 21 301 Technical, sales, admin support 1,294 — — 9 24 462 53 515 42 184 Service 1,011 13 — — 7 66 8 277 7 633 Farming, forestry, and fishing 103 17 — — 61 5 — 9 — — Precision production, craft, repair 1,192 — 52 511 82 202 33 77 53 181 Operators, fabricators, laborers 2,295 — 33 259 800 424 163 360 16 241
Length of service with employer: Less than 3 months 1,302 7 9 172 530 91 39 199 30 226 3 to 11 months 1,301 11 22 209 205 155 62 367 25 246 1 to 5 years 1,758 6 23 185 149 267 109 377 38 604 More than 5 years 1,037 11 17 107 94 222 67 245 36 240 Not reported 980 10 18 115 15 446 7 115 10 244
Race or ethnic origin: White, non-Hispanic 3,070 13 41 519 465 385 169 627 68 785 Black, non-Hispanic 224 — — 10 60 28 9 52 — 63 Hispanic 215 — — 7 101 11 — 34 — 53 Asian or Pacific Islander 248 — — — 54 26 6 64 5 89 American Indian or Alaska Native 302 — — 46 52 24 8 49 26 97 Not reported 2,318 32 46 201 262 707 88 477 33 473
1 Days-away-from-work cases include those which result in days away from work or restricted work activity.2 Excludes farms with fewer than 11 employees.3 Data conforming to OSHA definitions for mining operators in coal, metal and nonmetal provided to BLS by the Mine Safety and HealthAdministration, U.S. Dept. of Labor. Mining contractors are excluded from the coal, metal and nonmetal mining industries. Data include oil andgas extraction.4 Data conforming to OSHA definitions for employers in railroad transportation are provided to BLS by the Federal Railroad Administration, U.S.Dept of Transportation.--Dashes indicate data that are not available. Because of rounding and exclusion of nonclassifiable responses, data may may not sum tototals.

ALASKA ECONOMIC TRENDS OCTOBER 2003 19
incidents, 612 of the 623 cases, were inmanufacturing. Truck drivers had the secondhighest count, with 387 injuries and illnesses,followed by carpenters with 294. However, theaverage days away from work for hand packersand packagers was four, while truck drivers lost anaverage of 10 days away from work. This wouldindicate that injuries to truck drivers were generallymore severe. Carpenter injuries and illnesseswere slightly more severe than truck drivers, withan average of 11 days away from work. Nationally,truck drivers had the highest number of lost workday injuries and illnesses, followed by nursingaides and non-construction laborers.
Who are Alaska’s injured workers?
A look at the demographic data for cases with daysaway from work reveals which segments of thepopulation are most affected by workplace injuriesand illnesses. While men comprise 60 percent ofAlaska’s workforce, they were injured more thanwomen at a ratio of more than 2-to-1, with thehighest numbers occurring in the manufacturing,construction, and transportation industries. Inmining, all 84 injuries and illnesses where genderwas reported were men. The only private industrysector where women had a higher number ofinjuries and illnesses was services. In services, itwas estimated that 854 women had days awayfrom work compared to 691 men. In general,however, most industries had far more maleincidents than female. (See Exhibit 9.)
The 35-44 age group had the most days awayfrom work cases. Next was the 25-34 age group.The 45-54 age bracket followed. Together, thesethree groups accounted for more than 75 percentof all days away from work cases.
Of race and ethnicity groups reported, the White,non-Hispanic category accounted for about three-of-four injury and illness cases that involved daysaway from work. Black, non-Hispanic workersaccounted for an additional six percent as didAsian or Pacific Islander and American Indian orAlaska Native. Hispanic worker injuries andillnesses accounted for five percent of the totalreported.
Length of service statistics may indicate theimportance of job training and job familiarity.Nearly 70 percent of days away from workinvolved workers with less than five years ofservice with an employer. Of that group, 60percent of the days away from work involvedworkers employed for less than one year.
Additional workplace injury and illness informationis available. Interested individuals are encouragedto contact the Research and Analysis Section ofthe Alaska Department of Labor and WorkforceDevelopment.
Information in this article is derived from the Annual Surveyof Occupational Injuries and Illnesses, conductedcooperatively by the Alaska Department of Labor andWorkforce Development, Research and Analysis Section,and the U.S. Department of Labor, Bureau of Labor Statistics.The survey provides information annually on the number andfrequency of nonfatal injuries and illnesses occurring in theworkplace. The survey also collects information on the casecharacteristics and demographics for the more seriousincidents. The data are used to help develop safety andhealth standards, to control work hazards, and to allocateresources for inspection, training, and consultation activities.

20 ALASKA ECONOMIC TRENDS OCTOBER 2003
1
Source: Federal Reserve Bank, New York
Exports and Exchange Ratesby
Neal Gilbertsen Labor Economist
The international see-saw
Euro $ Canada Yen Yuan0%
2%
4%
6%
8%
10%
12%
14%
Percent Gain Against U.S. DollarSelected foreign currenciesAug 26, 2002 – Aug 26, 2003
s any tourist knows, a weak dollar makesforeign travel more expensive. It alsomakes American goods less expensivefor foreign buyers. Theoretically, a weak
dollar should result in fewer Americans traveling,and more U.S. goods being sold abroad.
Over the last year, the dollar has weakened againstmost major foreign currencies. While the causesmay be complex, the results are relatively simple:the same amount of euros or Canadian dollars in2003 will purchase more U.S. goods than theywould have a year ago. Because American goodsare less expensive, foreign consumers are morelikely to purchase them and sales should increase.
Normally a weakening dollar would meanincreased earnings for Alaska exporters, as
shipments of fish, timber and minerals benefitfrom favorable exchange rates. Unfortunately,this does not seem to be happening. As pointedout in the preceding article on The Global SalmonIndustry, two-thirds of Alaska’s exports are shippedto Asia, and the major Asian currencies have notexperienced much realignment with respect tothe dollar.
The Chinese yuan is not a free-floating currencybut rather is pegged to the U.S. dollar. While thisfixed-rate exchange is a matter of some concernto U.S. negotiators who feel the yuan is under-valued, the situation is not expected to change inthe immediate future. As a result, Chinese exportsto the U.S. will retain their competitive advantage,and U.S. exports will remain expensive on theChinese market.
The Japanese yen is in theory a free-floatingcurrency, but the Japanese government, throughthe Bank of Japan, has intervened heavily inrecent months, spending trillions of yen buyingdollars. The purpose of the intervention has beento keep the yen artificially weak in relation to thedollar. This makes Japanese-made cars lessexpensive to American consumers, but causesAlaska salmon to be more expensive in Japan.
While interventions to maintain a currency’sstrength are rarely successful, Japan’s strategy tomaintain an artificially weak yen seems to beworking. This is good news for Japanese exportersand may help the Japanese economic recovery,which would be good for Alaska in the long run.In the meantime, Alaska’s exports to Asia are notlikely to benefit from the overall weakening of thedollar.
A

ALASKA ECONOMIC TRENDS OCTOBER 2003 21
Employment Warms in JulyAlaska
EmploymentScene
byNeal Fried
Labor EconomistSeasonal industries lift July’s numbers
With employment numbers nearing theiryearly peak, 2003's economicperformance is beginning to take shape.July employment estimates suggest that
Alaska's seasonal industries have performed asexpected so far in 2003. In particular, the fishing,construction, and visitor industries all added asignificant number of summer jobs. Theseindustries also helped lift employment in a numberof other categories, including eating estab-lishments, air carriers, and retailers. Totalemployment in July grew by 8,200 jobs, withseafood processing contributing most to themonthly increase, adding 6,200 jobs.
Seafood down
Salmon harvests nearly always crest in July, andthis year was no different. The difference is thatseafood-processing employment climbed to just13,600 in July, 500 lower than July 2002's level.This marks the fourth consecutive year-to-yeardecline in July's seafood processing jobs, despitea stronger harvest this year than in 2002.
Lower employment levels came as no surprise,considering that the list of processing plant closurescontinues to grow. The most recent closure tookplace in July, when True World Foods of Kodiakclosed its doors. On a more upbeat note, BristolBay's sockeye harvest, the largest in the state,came in a bit higher this year and Southwest
Alaska's seafood processing employment reachedthe same level as in July 2002. Sockeye catchesalso came in stronger in Cook Inlet and pinkcatches were hearty in Prince William Sound andSoutheast Alaska. Prices for the fish, however,remain close to last year's low levels.
Visitor industry murky
The current status of the visitor industry, one ofthe state's other big seasonal employers, is muchless clear. With firm numbers such as bed taxcollections not yet available, the informal consensusis that 2003 will be another soft year. Someparticipants in the industry say that the seasonbegan slowly but has picked up steam in recentmonths. Cruise ship passenger counts are nearlast year's numbers, but because deep discountingwas necessary to fill the ships, some industrywatchers believe that the passengers are spendingless than in past years on land-based activities andin retail shops.
Denali National Park visitation for the first half of2003 was down 7.5 percent. In July the FairbanksConvention and Visitors Bureau surveyed itsmembers about May and June activity andexpectations for July, August, and September.Overall the members were cautiously optimistic.Most felt that activity was up for May and June butwere concerned that by August some of thesegains would slip away because of weaker advancebookings.

22 ALASKA ECONOMIC TRENDS OCTOBER 2003
Employment is up over the year in some of theindustry segments that cater to summer visitors.In the Leisure & Hospitality sector, which largelyconsists of accommodations and food services,employment is running slightly ahead of year-agolevels. (See Exhibit 2.) This does not necessarilymean that the visitor industry is growing, sincesome of the demand for these services is local andsome is from business travelers. Also, a numberof eating and drinking establishments and hotelsopened either late last year or earlier this year,and required staffing.
Air transportation activity often sheds light on thehealth of the visitor industry, and its Julyemployment was running even with year-agolevels. The overall assessment appears to be thatconditions could be better for the visitor industry,but they also could be much worse.
Construction strong
The news is unabashedly upbeat for construction,the other big seasonal player. This could almostbe characterized as an old story since the industryhas enjoyed steady growth for over a decade,growing approximately four percent a year onaverage. July construction employment reached19,600, which was 500 higher than a year ago.Federally funded activity is the dominant force in2003, headed up by massive military constructionactivity in the Interior Region, including the MissileDefense project at Fort Greely. Highway construc-tion is providing an additional boost, as are avariety of other public construction projects.Residential construction also remains strong. Onlythe Northern Region is employing fewerconstruction crews this year than in 2002. Thisreflects the slowdown in oil industry activity onthe North Slope.
Lots of different income pictures aroundthe state
Recently the U.S. Bureau of Economic Analysisreleased 2001 personal income figures for the
state's 27 boroughs and census areas. Thesefigures are calculated by dividing an area's totalpersonal income by its resident population. Thefigures are dated, but still useful. One of theirweaknesses, however, is that they reveal nothingabout income distribution. Demographics alsoinfluence the numbers. Family size, age, or thepresence of a big university student population allaffect per capita income. Despite these caveats,the data still effectively reveal different levels ofeconomic wellbeing around the state.
The urban–rural difference
One of the most obvious differences is betweenrural and urban Alaska. Eight of the nine areaswith per capita incomes of 75 percent or less ofthe statewide and national averages were in ruralAlaska. (See Exhibit 1.) Included in this groupwere the following boroughs and census areas:Aleutians West, Bethel, Lake and Peninsula, Nome,Northwest Arctic, Prince of Wales-OuterKetchikan, Wade Hampton, and Yukon-Koyukuk.Although a number of these areas are home toregional population centers, such as the cities ofBethel, Dillingham, and Nome, they also includesmall communities with few economicopportunities.
The Bethel Census Area, for example, includes37 small communities in addition to the city ofBethel. Without the boost from regional centerssuch as Bethel, incomes would be even lower inthese areas. Wade Hampton lacks a regionalcenter and is thus a good proxy for "village Alaska."Its per capita income of $15,004 was less than halfAlaska's statewide figure. Income figures forthese areas would drop even lower withoutgovernment contributions. In the Wade HamptonCensus Area, 52 percent of all income comes inthe form of government transfer payments. It isimportant to note, however, that many of thesecommunities rely on subsistence hunting andfishing to meet basic needs, and these statistics donot account for the value of subsistence goods.
Not all of rural Alaska has a low per capita income.

ALASKA ECONOMIC TRENDS OCTOBER 2003 23
(continued on page 26) Source: U.S. Department of Commerce, Bureau of Economic Analysis
Percent Percent PercentGrowth of U.S. of Alaska
2000 2001 ‘00-’01 2001 2001
United States $29,760 $30,413 2.2% 100% 98%
Alaska $29,960 $31,027 3.6% 102% 100%
Aleutians East Borough 21,437 27,595 28.7% 91% 89%
Aleutians West Census Area 20,475 19,192 -6.3% 63% 62%
Anchorage, Municipality of 35,307 36,949 4.7% 121% 119%
Bethel Census Area 19,043 20,122 5.7% 66% 65%
Bristol Bay Borough 42,066 42,401 0.8% 139% 137%
Denali Borough 36,536 38,028 4.1% 125% 123%
Dillingham Census Area 25,778 25,534 -0.9% 84% 82%
Fairbanks North Star Borough 28,374 29,307 3.3% 96% 94%
Haines Borough 31,930 32,971 3.3% 108% 106%
Juneau Borough 34,113 34,487 1.1% 113% 111%
Kenai Peninsula Borough 27,867 28,506 2.3% 94% 92%
Ketchikan Gateway Borough 33,438 34,040 1.8% 112% 110%
Kodiak Island Borough 27,094 27,726 2.3% 91% 89%
Lake and Peninsula Borough 20,718 20,745 0.1% 68% 67%
Matanuska-Susitna Borough 19,943 20,261 1.6% 67% 65%
Nome Census Area 21,352 21,484 0.6% 71% 69%
North Slope Borough 29,827 33,571 12.6% 110% 108%
Northwest Arctic Borough 21,178 22,901 8.1% 75% 74%
Prince of Wales-Outer Ketchikan C.A. 21,013 19,936 -5.1% 66% 64%
Sitka Census Area 29,189 29,734 1.9% 98% 96%
Skagway-Hoonah-Angoon C.A. 28,023 29,323 4.6% 96% 95%
Southeast Fairbanks Census Area 22,750 24,089 5.9% 79% 78%
Valdez-Cordova Census Area 30,142 29,728 -1.4% 98% 96%
Wade Hampton Census Area 14,141 15,004 6.1% 49% 48%
Wrangell-Petersburg Census Area 29,241 28,967 -0.9% 95% 93%
Yakutat Borough 27,792 27,414 -1.4% 90% 88%
Yukon-Koyukuk Census Area 19,763 21,216 7.4% 70% 68%
1Per Capita IncomeAlaska Boroughs and Census Areas 2000–2001
Exceptions include the Denali,Haines, Bristol Bay, and NorthSlope boroughs. These areas’common feature is a sizable privatesector source of employment, suchas coal mining, tourism, fishing, oilproduction, and power generation.In Haines, retirement income mayalso be important.
Conversely, not all urban areasenjoy above average incomes. InFairbanks, the state's second largestcity, per capita income actuallycame in slightly below thestatewide average, due partly tolarge student and militarypopulations. The Mat-Su Borough'svery low per capita income–65percent of the statewide average–is suspect and may be due partly todata collection problems ratherthan real economic differences.Other income measures confirmthat the Mat-Su Borough's incomeusually falls below the statewideaverage, but not to the extentreported by these data. Morethan a third of the Mat-Su Valley'slabor force works in Anchorageand elsewhere, and the Bureau ofEconomic Analysis appears to behaving difficulty capturing thatincome.
Per capita income tracksthe fate of industries
The data illustrate some noteworthyyear-to-year trends. For example,in every area where per capitaincome either fell or saw littlechange, either timber or fishingwas a significant part of the localeconomy. All of the boroughs andcensus areas in the Bristol Bay

24 ALASKA ECONOMIC TRENDS OCTOBER 2003
Nonfarm Wage and Salary EmploymentBy place of work2
148,000 147,400 145,600 600 2,400
14,300 14,000 14,500 300 -200133,700 133,500 131,000 200 2,700
2,500 2,600 2,900 -100 -400
2,400 2,500 2,800 -100 -4002,300 2,400 2,700 -100 -400
9,800 9,500 9,500 300 300
2,000 1,900 2,100 100 -10033,200 32,800 33,200 400 0
4,700 4,700 4,800 0 -100
17,600 17,400 17,300 200 3002,500 2,500 2,400 0 100
4,200 4,100 4,500 100 -300
10,800 10,700 11,100 100 -3003,500 3,600 3,400 -100 100
4,800 4,700 4,800 100 0
2,700 2,600 2,900 100 -2008,700 8,600 8,500 100 200
18,100 17,500 17,700 600 400
17,300 17,200 16,400 100 90015,900 15,800 15,200 100 700
6,800 6,900 6,300 -100 500
4,900 4,800 4,600 100 30016,000 16,200 15,500 -200 500
3,600 3,500 3,400 100 200
10,700 10,800 10,300 -100 4006,400 6,100 6,200 300 200
29,200 30,300 28,600 -1,100 600
9,900 9,800 9,700 100 2009,300 9,400 9,100 -100 200
10,000 11,100 9,800 -1,100 200
300 300 300 0 0
319,400 311,200 317,100 8,200 2,30047,500 40,500 48,900 7,000 -1,400
272,000 270,700 268,200 1,300 3,800
10,300 10,300 11,400 0 -1,100800 600 700 200 100
10,100 9,900 10,700 200 -600
8,000 8,000 9,000 0 -1,00019,600 18,800 19,100 800 500
17,600 11,400 18,300 6,200 -700
400 300 400 100 013,600 7,400 14,100 6,200 -500
65,200 64,000 65,800 1,200 -600
6,600 6,200 7,000 400 -40035,900 35,500 35,800 400 100
6,200 6,100 6,100 100 100
9,300 9,000 9,600 300 -30022,700 22,300 23,000 400 -300
6,900 6,800 6,900 100 0
3,100 3,000 3,000 100 1007,200 7,000 7,500 200 -300
4,200 4,000 4,400 200 -200
14,600 14,100 14,100 500 50025,500 24,600 24,800 900 700
32,200 32,300 30,600 -100 1,600
30,100 30,100 28,600 0 1,50013,100 13,200 12,200 -100 900
7,800 7,800 7,600 0 200
35,600 34,900 35,100 700 50010,600 9,800 10,400 800 200
20,400 20,300 20,000 100 400
13,000 12,500 12,700 500 30078,800 81,300 77,600 -2,500 1,200
17,800 17,500 17,500 300 300
23,400 24,100 23,000 -700 40037,700 39,700 37,100 -2,000 600
3,700 3,500 4,000 200 -300
Notes to Exhibits 2, 3, 4, & 6 —1Nonfarm excludes self-employed workers,fishermen, domestics, and unpaid family workers as well as agricultural workers.2Includes employees of publ ic school systems and the University of Alaska.3Excludes uniformed mil i tary.Exhibits 2 & 3—Prepared in cooperation with the U.S. Department of Labor,Bureau of Labor Statistics.Exhibits 4 & 6—Prepared in part with funding from the Employment SecurityD iv i s ion .
Source: Alaska Department of Labor and Workforce Development, Researchand Analysis Section
Municipalityof Anchorage
Hours and EarningsFor selected industries3
Alaska
Average Weekly Earnings Average Weekly Hours Average Hourly Earningsise d
MiningConstructionManufacturing
Seafood ProcessingTrade, Transportation, Utilities Retail TradeFinancial Activities
preliminary revised revised preliminary revised revised preliminary revised revised7/03 6/03 7/02 7/03 6/03 7/02 7/03 6/03 7/02
$1,313.17 $1,296.87 $1,372.84 42.9 41.7 49.1 $30.61 $31.10 $27.961,301.61 1,276.05 1134.20 43.0 43.3 42.8 30.27 29.47 26.50
553.83 505.38 526.40 44.2 39.7 40.0 12.53 12.73 13.16651.66 491.04 418.15 54.9 44.0 39.9 11.87 11.16 10.48543.39 546.98 545.60 34.9 36.2 34.1 15.57 15.11 16.00451.10 462.35 478.88 34.7 35.0 32.8 13.00 13.21 14.60664.52 696.00 650.31 37.0 38.2 31.8 17.96 18.22 20.45
Average hours and earnings estimates are based on data for full-time and part-time production workers (manufacturing) and nonsupervisory workers(nonmanufacturing). Averages are for gross earnings and hours paid, including overtime pay and hours.Benchmark: March 2002Source: Alaska Department of Labor and Workforce Development, Research and Analysis Section
Total Nonfarm Wage & Salary1
Goods ProducingServices ProvidingNatural Resources & Mining
LoggingMiningOil & Gas Extraction
ConstructionManufacturing
Wood Products ManufacturingSeafood Processing
Trade, Transportation, UtilitiesWholesale TradeRetail Trade
Food & Beverage StoresGeneral Merchandise Stores
Trans/Warehousing/UtilitiesAir TransportationTruck Transportation
InformationTelecommunications
Financial ActivitiesProfessional & Business SvcsEducational & Health Services
Health Care/Social AssistanceAmbulatory Health CareHospitals
Leisure & HospitalityAccommodationFood Svcs & Drinking Places
Other ServicesGovernment2
Federal Government3
State Government Local Government
Tribal Government
Total Nonfarm Wage & Salary1
Goods ProducingServices ProvidingNatural Resources & Mining
MiningOil & Gas Extraction
ConstructionManufacturingTrade, Transportation, Utilities
Wholesale TradeRetail Trade
Food & Beverage StoresGeneral Merchandise Stores
Trans/Warehousing/UtilitiesAir Transportation
InformationTelecommunications
Financial ActivitiesProfessional & Business SvcsEducational & Health Services
Health Care/Social AssistanceAmbulatory Health CareHospitals
Leisure & HospitalityAccommodationFood Svcs & Drinking Places
Other ServicesGovernment2
Federal Government3
State Government Local Government
Tribal Government
preliminary revised Changes from:7/03 6/03 7/02 6/03 7/02
preliminary revised Changes from:7/03 6/03 7/02 6/03 7/02

ALASKA ECONOMIC TRENDS OCTOBER 2003 25
37,800 37,450 37,150 350 650
4,500 4,200 4,600 300 -10033,300 33,250 32,550 50 750
950 900 1,050 50 -100
950 900 1,050 50 -1002,950 2,700 2,950 250 0
650 600 600 50 50
7,550 7,500 7,700 50 -1504,200 4,200 4,250 0 -50
950 950 1,150 0 -200
2,850 2,750 2,900 100 -50850 850 900 0 -50
650 650 650 0 0
1,400 1,350 1,300 50 1002,200 2,150 2,050 50 150
3,700 3,750 3,500 -50 200
3,450 3,450 3,250 0 2004,850 4,700 4,600 150 250
1,550 1,500 1,550 50 0
2,750 2,700 2,550 50 2002,200 2,000 2,150 200 50
10,800 11,200 10,600 -400 200
3,500 3,500 3,450 0 504,700 5,050 4,600 -350 100
2,600 2,650 2,550 -50 50
0 0 0 0 0
41,000 38,450 41,300 2,550 -3006,150 4,200 6,200 1,950 -50
34,800 34,250 35,100 550 -300
900 750 800 150 100550 400 500 150 50
300 300 300 0 0
2,000 1,900 1,850 100 1503,300 1,600 3,550 1,700 -250
150 150 200 0 -50
2,850 1,150 3,050 1,700 -2008,300 7,950 8,700 350 -400
4,950 4,800 5,050 150 -100
2,800 2,750 2,950 50 -150500 500 500 0 0
1,350 1,300 1,350 50 0
1,550 1,500 1,600 50 -503,600 3,550 3,450 50 150
3,350 3,350 3,250 0 100
5,000 4,800 5,050 200 -501,900 1,800 1,950 100 -50
1,950 1,900 2,000 50 -50
1,100 1,100 1,150 0 -5013,450 13,550 13,300 -100 150
2,050 2,000 2,100 50 -50
5,600 5,650 5,550 -50 505,800 5,850 5,650 -50 150
650 600 650 50 0
4 Nonfarm Wage and Salary EmploymentBy place of work
FairbanksNorth Star Borough
Southeast Region
Gulf Coast Region
Anchorage/Mat-Su Region
Interior Region
164,000 163,100 160,550 900 3,45016,500 16,050 16,550 450 -50
147,550 147,050 144,000 500 3,5502,550 2,650 2,950 -100 -400
11,650 11,250 11,300 400 3502,250 2,100 2,300 150 -50
37,000 36,700 36,750 300 2505,150 5,100 5,350 50 -2009,400 9,300 9,050 100 350
19,000 18,300 18,450 700 55019,300 19,250 18,400 50 90017,800 17,750 17,200 50 600
6,950 6,650 6,800 300 15032,950 34,100 32,000 -1,150 95010,050 10,000 9,850 50 20010,350 10,500 10,050 -150 30012,550 13,550 12,100 -1,000 450
350 350 350 0 0
45,100 44,850 44,400 250 7005,000 4,650 5,050 350 -50
40,100 40,250 39,350 -150 7501,100 1,000 1,200 100 -1001,050 1,000 1,200 50 -1503,250 2,950 3,200 300 50
700 650 700 50 09,050 9,000 9,150 50 -100
850 850 850 0 01,450 1,450 1,400 0 502,350 2,300 2,200 50 1503,850 3,900 3,650 -50 2006,900 6,700 6,650 200 2502,550 2,150 2,500 400 503,850 3,700 3,650 150 2002,450 2,250 2,400 200 50
13,200 13,850 13,050 -650 1504,050 4,150 4,050 -100 05,000 5,300 4,900 -300 1004,150 4,400 4,100 -250 50
300 250 300 50 0
32,350 30,600 32,750 1,750 -4008,200 6,400 8,400 1,800 -200
24,150 24,250 24,350 -100 -2001,350 1,350 1,450 0 -1001,200 1,200 1,300 0 -1001,950 1,900 1,950 50 04,850 3,100 5,000 1,750 -1504,200 2,500 4,250 1,700 -506,350 6,200 6,800 150 -4503,700 3,700 3,800 0 -1002,300 2,250 2,300 50 0
450 450 450 0 0900 900 900 0 0
1,500 1,450 1,550 50 -501,900 1,900 1,800 0 1001,800 1,800 1,750 0 504,400 4,200 4,350 200 501,750 1,750 1,700 0 502,300 2,200 2,300 100 01,550 1,450 1,450 100 1007,100 7,650 7,000 -550 1001,000 950 950 50 501,550 1,600 1,550 -50 04,550 5,100 4,500 -550 50
400 400 350 0 50
Total Nonfarm Wage & Salary1
Goods ProducingServices ProvidingNatural Resources & Mining
MiningConstructionManufacturingTrade, Transportation, Utilities
Retail TradeGeneral Merchandise StoresTrans/Warehousing/UtilitiesAir Transportation
InformationFinancial ActivitiesProfessional & Business SvcsEducational & Health Services
Health Care/Social AssistanceLeisure & Hospitality
AccommodationFood Svcs & Drinking Places
Other ServicesGovernment2
Federal Government3
State Government Local Government
Tribal Government
Total Nonfarm Wage & Salary1
Goods ProducingServices ProvidingNatural Resources & Mining
LoggingMining
ConstructionManufacturing
Wood Products Mfg.Seafood Processing
Trade, Transportation, UtilitiesRetail Trade
Trans/Warehousing/UtilitiesInformationFinancial ActivitiesProfessional & Business SvcsEducational & Health Services
Health Care/Social AssistanceLeisure & Hospitality
AccommodationFood Svcs & Drinking Places
Other ServicesGovernment2
Federal Government3
State Government Local Government
Tribal Government
Total Nonfarm Wage & Salary1
Goods ProducingServices ProvidingNatural Resources & Mining
MiningConstructionManufacturingTrade, Transportation, UtilitiesInformationFinancial ActivitiesProfessional & Business SvcsEducational & Health ServicesLeisure & Hospitality
AccommodationFood Svcs & Drinking Places
Other ServicesGovernment2
Federal Government3
State Government Local Government
Tribal Government
Total Nonfarm Wage & Salary1
Goods ProducingServices ProvidingNatural Resources & Mining
Oil & Gas ExtractionConstructionManufacturing
Seafood ProcessingTrade, Transportation, Utilities
Retail TradeTrans/Warehousing/Utilities
InformationFinancial ActivitiesProfessional & Business SvcsEducational & Health Services
Health Care/Social AssistanceLeisure & Hospitality
AccommodationFood Svcs & Drinking Places
Other ServicesGovernment2
Federal Government3
State Government Local Government
Tribal Government
Total Nonfarm Wage & Salary1
Goods ProducingServices ProvidingNatural Resources & MiningConstructionManufacturingTrade, Transportation, UtilitiesInformationFinancial ActivitiesProfessional & Business SvcsEducational & Health ServicesLeisure & HospitalityOther ServicesGovernment2
Federal Government3
State Government Local Government
Tribal Government
preliminary revised Changes from:7/03 6/03 7/02 6/03 7/02
preliminary revised Changes from:7/03 6/03 7/02 6/03 7/02

26 ALASKA ECONOMIC TRENDS OCTOBER 2003
5 Unemployment RatesBy region and census area
Not Seasonally Adjusted
Alaska StatewideAnchorage/Mat-Su Region
Municipality of AnchorageMat-Su Borough
Gulf Coast RegionKenai Peninsula BoroughKodiak Island Borough
Valdez-CordovaInterior Region
Denali Borough
Fairbanks North Star BoroughSoutheast FairbanksYukon-Koyukuk
Northern RegionNomeNorth Slope Borough
Northwest Arctic BoroughSoutheast Region
Haines Borough
Juneau BoroughKetchikan Gateway BoroughPrince of Wales-Outer Ketchikan
Sitka BoroughSkagway-Hoonah-AngoonWrangell-Petersburg
Yakutat BoroughSouthwest Region
Aleutians East Borough
Aleutians WestBethelBristol Bay Borough
DillinghamLake & Peninsula BoroughWade Hampton
Seasonally AdjustedUnited States
Alaska Statewide
07/03 06/03 07/02
6.9 7.4 6.95.7 6.0 5.85.2 5.4 5.28.0 8.5 8.38.3 9.9 8.69.6 10.2 9.55.9 10.0 5.66.0 8.1 8.46.3 7.0 6.53.7 4.2 3.75.8 6.5 5.98.5 9.1 10.8
14.4 15.6 15.517.9 17.7 15.417.0 16.8 14.514.9 14.6 12.623.1 23.1 20.76.4 7.1 6.77.4 7.8 7.15.5 5.8 5.36.6 8.0 7.6
11.3 11.2 13.64.8 5.8 4.87.3 6.8 7.77.2 9.2 7.7
11.8 14.9 12.513.0 15.9 12.63.4 4.7 2.37.4 12.9 8.8
14.7 17.5 13.98.4 11.4 7.19.2 12.1 9.8
10.9 13.2 10.225.9 27.7 24.6
6.2 6.4 5.87.9 7.9 8.0
(continued from page 23)
preliminary revised
2002 BenchmarkComparisons between different time periods are not as meaningfulas other time series produced by Research and Analysis. Theofficial definition of unemployment currently in place excludesanyone who has not made an active attempt to find work in thefour-week period up to and including the week that includes the12th of the reference month. Due to the scarcity of employmentopportunities in rural Alaska, many individuals do not meet theofficial definition of unemployed because they have not conductedan active job search. They are considered not in the labor force.
Source: Alaska Department of Labor and Workforce Development,Research and Analysis Section
21,550 18,600 21,550 2,950 0
6,700 4,000 6,950 2,700 -25014,850 14,600 14,650 250 200
6,500 3,800 6,700 2,700 -200
7,300 7,400 7,300 -100 0450 450 400 0 50
600 600 600 0 0
6,300 6,400 6,300 -100 01,450 1,450 1,750 0 -300
Total Nonfarm Wage & Salary1
Goods ProducingServices Providing
Seafood ProcessingGovernment2
Federal Government3
State Government Local Government
Tribal Government
Southwest Region
6 Nonfarm Wage/Salary EmploymentBy place of work
15,350 15,450 16,350 -100 -1,0004,900 4,900 5,700 0 -800
10,450 10,550 10,650 -100 -200
3,900 3,900 4,500 0 -6004,850 4,900 5,000 -50 -150
200 200 200 0 0
350 350 350 0 04,350 4,350 4,500 0 -150
600 550 650 50 -50
Total Nonfarm Wage & Salary1
Goods ProducingServices Providing
Oil & Gas ExtractionGovernment2
Federal Government3 State Government Local Government
Tribal Government
Northern Region
Source: Alaska Department of Labor and Workforce Development, Research and Analysis Section
preliminary revised Changes from:7/03 6/03 7/02 6/03 7/02
region (Lake and Peninsula Borough, Dillingham CensusArea, and Bristol Bay Borough) experienced declines in percapita income, along with a number of areas in SoutheastAlaska. In most of Alaska, however, per capita income grewmore robustly than in the United States as a whole.Preliminary data suggest this was also true in 2002.

ALASKA ECONOMIC TRENDS OCTOBER 2003 27
Employer ResourcesIf your company is facing possible layoffs due to imports from another country, you and youremployees may be eligible for Trade Adjustment Assistance (TAA) benefits. Benefits could includereemployment services, training, job search allowance, relocation allowance, or Trade ReadjustmentAllowance (TRA), a weekly benefit much like unemployment insurance. Visit the TAA website by goingto: http://www.labor.state.ak.us/, clicking on “Job Seekers” at the top, then clicking on “TradeAdjustment Assistance”, or directly to: http://www.jobs.state.ak.us/taa/.