occupancy measurement in building: a litterature review
TRANSCRIPT

Int. J. Metrol. Qual. Eng. 4, 135–144 (2013)c© EDP Sciences 2013DOI: 10.1051/ijmqe/2013044
Occupancy measurement in building: A litteraturereview, application on an energy efficiency researchdemonstrated building
A. Caucheteux1,�, A. Es Sabar1, and V. Boucher1
CETE Ouest/DLRCA, France
Received: 30 May 2013 / Accepted: 16 July 2013
Abstract. Measuring the energy efficiency of buildings and its confrontation with the current BuildingEnergy Simulations now faces knowledge of what is commonly called “occupancy”. This work has beenmade in order to implement a monitoring system on a research demonstrator building at DLRCA in Angers(France). The goals were first to know the occupancy as input data of models but also to build occupancymodels. Occupancy can be defined as all the action of occupants that affect building energy efficiency. Thechosen monitoring deals with its presence, lightning, windows opening and internal gains. It seems that theuse of an Infra- red detector allows a accuracy of 5 min in the detection of presence. The use of dry contactsensors allows the detection of five different rates of slide windows opening that can affect temperaturedecrease. Light sensors seem to be efficient to detect artificial lighting states when correctly configured.
Keywords: Occupancy; monitoring; building energy efficiency; occupant behaviour
1 Introduction
Measuring the energy efficiency of buildings and its con-frontation with the current building energy simulationsnow faces knowledge of what is commonly called “oc-cupancy” [1–12]. Indeed, the influence of user behaviouron building energy consumption is significant and is in-creasing as building performance is high. Influence ofthe occupant can occur through internal gains (heatproduction by human metabolism or electrical devicesuse), solar gains (by the use of blinds), ventilation loss(windows opening), etc.
Then a lot of work deals with the modelling of occu-pancy [13–18] in order to increase accuracy of expectedconsumption evaluated with building energy simulations.
This work has been made in order to implement amonitoring system on a research demonstrator buildingat DLRCA in Angers (France). It has been financed bythe ANR (French National Research Agency) throughthe MEMOIRE project. This project deals with an au-dit method in order to characterize energy efficiency ofexisting building. It has two main objectives: to preciselyidentify parameters that have a great influence on buildingenergy behaviour and to develop a model of occupancy.
This paper therefore proposes to define what is meantby occupancy and try to answer the following questions:what to measure, how and why?
� Correspondence:[email protected]
2 Principle of occupancy in building
2.1 Occupancy, definition
Hoes et al. [3] in 2009 give this definition of occupancy:“the presence of people in the building, but also as theactions users take (or not) to influence the indoor envi-ronment”. We can interpret this definition in relation toour problem of measuring energy performance in build-ings: “all actions of the occupant (including presence) thataffect building energy consumption”.
The different parameters related to the occupancycan be:
– presence of people;– lighting;– open doors and windows;– closing of blinds and shutters;– use of various devices that radiate heat;– use of domestic hot water (DHW);– actions on scenarios (programming heating and
ventilation);– action on set point temperatures;– etc.
The user behaviour in a given building, according to theoccupancy parameters is motivated by several reasons andis most often related to his: visual comfort (open-closeblinds and shutters, turn on the light, etc.), thermal com-fort or physiological welfare (temperature, humidity, CO2,etc.) [18–21] or other well-being such as unpleasant smells.
Article published by EDP Sciences

136 International Journal of Metrology and Quality Engineering
The occupancy therefore depends on many factors: thebuilding itself (design), its location and orientation, thepossibility of the action it offers (window opening con-trol systems), its use (office, housing, commerce, industry,etc.), customs and habits of its users, etc.
The occupancy is then specific to a building, to a site,to a given population and a given use. It seems that anychange to a building can cause changes in the occupancyand therefore its consequences from an energy standpoint.For example, simply adding blinds or curtains can changethe solar gains and then the heat demand. More significantchanges such as the complete retrofitting of the envelope,heating systems and ventilation, should induce changes inoccupancy.
2.2 Why measure occupancy?
Within a context of greenhouse gas emissions reductionand increasing energy costs, assessing buildings energy ef-ficiency becomes more and more essential. It is not onlya matter of customer information, but also of buildingenergy efficiency improvement, energy performance con-tracting or energy expenditure control.
Models to estimate consumption in buildings usuallyuses occupancy scenarios, often based on an estimatedtypical behaviour depending upon the use of the build-ing [22]. In the case of new building design, it is difficultto know in advance exactly what will be the behaviour ofusers. It is therefore logical to rely on standard behaviour.These models can be improved by the knowledge of thestimuli and the creation of behavioural models.
In the case of new buildings, recently delivered, wehave to ensure the proper execution and compare the ac-tual building calculations made during its design.
In the case of existing buildings, knowledge of the be-haviour of occupants is necessary to know the actual char-acteristics of the building with respect to energy efficiency.When we do the heat balance of the building, we have toknow the part due to the occupancy to identify with cer-tainty those due to the quality of the envelope or operatingsystems. It also enables us to assess the future use of therenovated building, assuming no change in behaviour afterthe renovation.
2.3 What to measure?
Several approaches to occupancy monitoring can be fol-lowed depending upon the study purposes. Indeed, theactions of the occupants respond to stimuli (temperature,light, etc.) and the results of the internal gains or loss ofenergy. The decision tree leading to gains/losses of energydue to the occupant can be summarized as follows:
stimuli - - - - -> shares / action - - - - -> energy effect(loss or gain, directly or indirectly).
By direct gains or losses we mean directly trans-formable into energy consumption. For example, the
fact of turning on a light directly generates electric-ity consumption for power, but causes indirect gains forheating by internal inputs. Then, each stimuli/actionor action/effect relationship can be modelled by differ-ent tools: stochastic models, thermodynamic calculations,etc. [13–18]. These models work but must often be con-figured: some are immediately transferable, but for othersit is more difficult. Moreover, they require knowledge of anumber of initial features.
We can therefore choose to measure stimuli, actions ortheir effects, whether direct or indirect, depending uponthe goals of the study and the models used.
3 Methods for measuring occupancy
3.1 Deployment
The deployment of the monitoring system depends uponthe purpose of the measurement and the accuracy we arelooking for. Indeed, it is difficult to be exhaustive in thistype of measurement; the scale of the building and theissue of sampling should arise. We should prefer a cross-sectional survey (many measuring points on rare occa-sions or a longitudinal one (few measuring points, con-tinuously). Depending upon the purpose of the project,“The need for certainty must be carefully balanced withmeasurement and analysis costs” [23].
3.2 Measuring the occupancy with survey
The most common method used to measure parametersoccupancy is survey. The purpose is to ask users to com-plete surveys about their habits with respect to their pres-ence, lighting, open window, blinds, etc. One can vary thefrequency of the surveys to improve the accuracy of themeasurement. This method presents low accuracy, evenwith extensive questionnaires. For example, only 30% ofindividuals correctly estimate the average time of windowopening [24].
In addition, it is possible to ask users to complete atable showing their daily behaviour hour by hour. Thismethod has the advantage of being lightweight and in-expensive instrumentation. But it is cumbersome for theuser. It could present a heavy load in the re-keying of in-formation and is not likely to be very accurate.
For our research objectives of detailed knowledge ofthe occupancy, we can not be satisfied with this kind ofmeasurement. It could just be used for punctual validationof protocols or for short experiments.
3.3 Measuring the presence of the occupant
It is necessary to obtain accurate knowledge of the numberof occupants and their location, firstly because an occu-pant generates power (estimated at 5 W/m2 of an occu-pied building [22]), but also because his presence is thefirst step to all other actions like windows opening. The
A. Caucheteux et al.: Occupancy measurement in building... 137
possibilities of this measurement are numerous. The meth-ods presented here are not necessarily concurrent and canbe complementary.
We have to keep in mind that measuring the presenceof an occupant at his workplace generates an ethical prob-lem: the knowledge of the presence of an employee at hisworkstation can be misunderstood.
3.3.1 Accurate measurement of the presence in each room
A first solution to perform this measurement is a motiondetector like a passive infrared motion detector [25], withan application to automatic triggering alarms or light.This kind of measurement should be more accurate thansurvey, but it still has drawbacks:
– it cannot quantify the number of occupants in a room;– it needs a lot of sensors and furthermore it is expensive;– it could lack accuracy since a person still at his
workstation but not moving, may go undetected.
Then a second kind of detector uses video camera. Thereare cheap solutions using a webcam and available free soft-ware [26]. Accuracy should be increased by using morehigh-performance video cameras and more advanced algo-rithms [27]. However, if the employee is filmed, it couldgenerate supervision problems.
Other solutions are available, using the relationship be-tween a pollutant like CO2 and people presence [28]. Thismeasure should also be used for other purposes like win-dow opening. It is not very accurate either in the numberof people or in time. So this kind of measurement shouldbe crossed with another [29].
One way to achieve accuracy should be the use ofextensive environmental sensors like pollutant (CO andCO2), light, motion and acoustic sensors [29–31].
3.3.2 Setting the number of people present in the buildingby counting the inputs-outputs
Another method to know the number of occupant in abuilding is to count inputs and outputs of an area, placingsensors at strategic locations. This method is often usedfor security purposes [32]. This method has the advan-tage of being lighter in the number of sensors, but not asaccurate: it loses spatial accuracy. We should know howmany people are occupying the building, but not in ev-ery room (office, conference room, break room). It can beimplemented in several ways.
The first and cheaper solution uses an infrared bar-rier. Such a solution makes lots of noise because it is un-able, for example, to detect multiple occupants crossingthe barrier [29, 33].
So other solutions use video cameras [32, 34]. It seemsthat this solution, even it is a little more expensive, canstill be quite cheap as a web camera should be accurateenough.
Finally, once again, the use of multiple sensors shouldincrease the accuracy [33].
3.3.3 Other possible solutions
Depending upon the cost of different methods, the avail-able budget, the expected accuracy, and the building, onecan imagine a method based on systems already in placelike the data employee presence pointing. As a result, wewill then miss, as measurement data, the presence of out-side visitors or for places with several buildings, visitorsfrom one building to others (for meetings, etc.). We cansharpen this information by setting up a list of outsidevisitors, as found in most companies.
At last, some new technologies such as RFID can beused to localise people in a building. All employees andvisitors should wear a badge with an RFID chip. Somedetectors should be installed in the whole building. It canbe very precise and is not as expensive but it presents theproblem of employee survey.
3.4 Measuring the artificial lighting
The artificial lighting state could be known through theposition of the switches [13, 25]. In existing old buildings,all of them need to be changed. However, to do so is likelyto be cumbersome and expensive particularly when geo-graphic accuracy is not necessary.
Another way for overall knowledge of lighting shouldbe global electric consumption measurement, but it de-pends upon the building’s electrical arrangement.
As our work deals with two goals (occupation mod-elling and building energy efficiency), the stimuli will bemeasured. As the stimuli deals with illuminance, the ideais to use this kind of measure to identify if the light is onor not.
3.5 Measure of windows and blinds opening
These two problems are similar in the way they are mea-sured. Many solutions have been identified, whether bymeasuring the stimuli, the action or effect. The stim-uli deals with comfort conditions like illuminance, indoortemperature and humidity. It should be doubled with out-door conditions.
Actions like windows, doors or blinds opening, can bedirectly measure by several means. The first and simpleone is the use of dry contact sensors [24,35]. For example,reed contact sensors react to a magnetic field generated bya magnet. This approach has the disadvantage of not giv-ing any information about opening rates. Other systemsare able to give this rate but are expensive.
We should also measure the effect: this measure is be-ginning to be deployed. It is due to the evolution of thetemperature near the window that we are going to deter-mine if it is open [36].
Presumably the same type of measure for the stateof the blinds can be imagined: by measuring the changein illuminance in the room, possibly matched with theoutside illuminance.

138 International Journal of Metrology and Quality Engineering
Another method uses photographic analysis. For ex-ample, Inkarojrit and Paliaga [37] took four pictures a dayfor 10 days. The analysis of the pictures gives a survey ofthe windows’ state.
3.6 Contributions to the equipment use internal gains
The use of electrical devices directly impact the heatingload of a building as almost all the electrical power con-sumed in the building directly heats it. However, the diver-sity of devices used, attitudes towards these devices andtheir deployment create many unknowns. It is importantto know where the devices are, when they are used andhow they emit heat. The simplest solution should be theuse of power meters to detect the operations and evalu-ation of the dissipated energy by a literature review or aspecific study.
However, a general measure of power consumption foruses other than lighting, ventilation, hot water, etc. shouldallow for a comprehensive understanding of the operationof devices, but no details. Furthermore, this measure issimple in the case of new buildings. It may not be possi-ble in existing buildings based on the building electricalarrangement.
3.7 Adjustment of equipment
The two following topics are developed in the study ofmeasuring the energy efficiency of buildings in general anddo not completely refer to the occupancy.
3.7.1 Temperature set point (heating and cooling)
In general, the temperature set points are set at thecontrol system (the boiler, building automation sys-tem (BAS)) for the whole building. The presence of ther-mostatic valves can be used to refine these adjustmentsroom by room. However, the actual temperature measure-ment provides detailed knowledge of the actual temper-ature, and allows us to establish precise and real heat-ing scenarios. For the design of the instrumentation of anentire building, we must focus on measurement accuracyin each room or place the sensors in order to estimatethe average temperature of the building, taking the as-sumption of repeatability temperatures through use. Forexample, we should measure several office temperatures(north and south), some temperatures in the “common”areas (corridor) and meeting rooms. A statistical studyshould be initially conducted to estimate the variabilityof temperatures depending upon the rooms.
3.7.2 Ventilation scenarios
The action of occupants in terms of ventilation only dealswith the scenario of low and high flow ventilation. In gen-eral, the ventilation unit is common to the whole building
Fig. 1. 3D representation of the monitored building.
or area, and subsequently, its scenario. As for the temper-ature set point scenario, ventilation scenario is set at theBAS and then should be known. A cross-sectional surveyshould be made for a week to confirm the scenario.
3.8 Domestic hot water (DHW)
Typically, domestic hot water consumption has direct andindirect consequences: energy consumption to produce hotwater and grey water energy recovery in the heated vol-ume [38]. The problem of measurement is, therefore, ontwo levels:
– DHW consumed amount;– evaluation of the ensued internal gains.
Typically, metering DHW is generally at the system level(flow + temperature). This gives the consumption for theentire building. We can provide localized meters to sep-arate, for example, needs by accommodation or functionareas (offices/process). The difficulty lies in the interpreta-tion of this provision in internal gains (latent or sensitive).
4 Application for a researchdemonstrator building
In order to validate the MEMOIRE audit method, a com-mercial building has been monitored. More than 150 sen-sors have been deployed through the entire building. Acomprehensive audit has been made thanks to archive doc-uments and thorough visits. Figure 1 presents the buildingwith a 3 dimension drawing. It is 1000 m2 and has severalareas very different from one to another. Some are builtwith blocks, other in wood. Some have single flue ventila-tion and others double. So the building can be divided intoseveral sections. Each section has been defined to presentone construction material, one ventilating system and oneheating system. The first area, we particularly monitored,is made with blocks without insulation and single constantflue ventilated high temperature distributed heating. Asecond area is made with blocks with indoor insulationand double flue ventilated, high temperature distributed

A. Caucheteux et al.: Occupancy measurement in building... 139
heating. A third area is made with wood and spread insu-lation, electrical heater heat and single hygro ventilation.
In order to develop and validate occupancy models, wefocused the monitoring on the first zone which is composedof six offices. We therefore chose to measure the followingparameters:
– presence of occupant;– lighting state;– windows state;– internal gains.
Several solutions can be used for each parameter, wefinally chose:
– illuminance for lightning;– passive infrared (PIR) motion detector for presence;– infrared barrier for entering and exiting;– door and windows state detectors;– electricity uses consumption for internal gains.
Note that temperature and humidity sensors have beenplaced in each room at about 1.5 m high, on an insidewall, far from windows and doors.
The following section deals with the validation of themonitoring results in regards to our needs and evaluationof the accuracy of the measurement protocols.
4.1 Generalities
We used a wireless system. Pulse counter/binary acquisi-tion device with three inputs are used for connecting PIR,dry contact sensors or infrared barriers. Ambient lightsensors are used for light measurements. A gate with anEthernet TCP/IP interface concentrates the data whichare collected by a computer through the TCP/IP network.
4.2 Building occupancy manual acquisitionsystem (BOMAS)
In order to test experimental measurements, a cross-sectional survey has been made in which we have to knowas precisely as possible the occupant behaviour. So wesometimes ask people to note all of their actions. But itappears that it is very cumbersome and not as precise asit needs to be to validate the monitoring conducted. Next,we developed a tool that is called BOMAS (Building Occu-pancy Manual Acquisition System). It consists of a smallprogram installed on an old computer. The occupant justhas to push different switches on the keyboard to note hisactions. For example: “escape” when he leaves, “enter”when he enters into the room: no more need to watchtime, to find a pen, etc. The computer can be placed justnear the door so it becomes very easy for the user not toforget an action. Figure 2 shows the tools: the green but-ton indicates that blinds are open. A label indicates thenumber of people that are present in the room, etc. Theprogram just saves all events. This tool is very helpful fora short experiment (a week). It loses accuracy over timewith use: people forgot to push the switch particularly forblinds.
Fig. 2. The building occupancy manual acquisition system.
Fig. 3. Area inputs/outputs monitoring with InfraredBarriers.
4.3 Inputs/outputs of an area
Measurement of people inputs and outputs for an area hasbeen made by the use of infrared barriers. For each accessof a zone, two barriers have been placed one meter apartfrom each other (Fig. 3).
Each time a barrier is crossed, the counter increaseswith the rising edge of the digital signal. It is saved with a

140 International Journal of Metrology and Quality Engineering
Fig. 4. Inputs and outputs detection with infrared barriers.
step of one second. Then the gap between the two countersgives the way (input or output of the zone).
Figure 4 presents the plots of the saved measurements.Two curves correspond to the two barriers signals, the lastone being the difference between the two counters. Thenwhen nobody came through the barriers, the differencebetween the two counters should be zero. When it is not,the sign (positive or negative) gives the way people go (in-put or output). The hypothesis is made that people camethrough the two barriers within a one-second interval.
As already shown by Ekwevugbe et al. [29] andHutchins et al. [34], the limits of the method are:
– the way the circulation could only be detected if peopledo not come through the two barriers within the samesecond;
– when two people do not come through the barrier atthe same time, the infrared barrier is then cut only onetime;
– people do not have to stop between the two barriers;– people must not go back between the two barriers;– arm movement should give interference in the measure-
ments (it is possible to filter).
4.4 Detection of presence
Passive infra red (PIR) motion sensors have been installedin the six offices in the first area. Tests have then beenperformed to determine whether such a device is robustin detecting presence in the office and to what accuracy.After some detection observation for different locations ofthe sensor, we set up and implemented one of these sensorsclosest to the workstation on a wall (Fig. 5). The measurewas doubled by the BOMAS, allowing a simplified input ofthe presence of occupants in the office. The motion sensoris connected to a pulse counter for detecting the state ofthe detector with both rising and falling edge detection ofthe digital signal. This device was tested from 11 Octoberto 16 October 2012. BOMAS does inventory every 5 minwhether or not there is a presence. A system with PIRmotion detection records events (transition from State 1
Fig. 5. Example of location of the PIR motion detector.
Table 1. Balance differences between PIR and BOMAS.
hh:mm:ss
min 00:00:00
max 00:13:23
Average 00:01:59
Mean bias 00:02:44
Fig. 6. Distribution of temporal accuracy: occurrence as afunction of difference.
to State 0 and vice versa). This is to compare the results ofthe two measurement systems. The comparison principleis as follows:
– at each BOMAS time step lasting 5 min, we look forthe closest event detected by the PIR;
– we calculate the time difference with the nearest eventrecorded by the BOMAS.
Thus, we are able to provide indicative timing of the pres-ence detection by this system in the office. Table 1 showsthe difference in minimum, maximum, average and stan-dard deviation recorded during the test. Figure 6 showsthe distribution of these differences. It is, thus, determinedthat the uncertainty of the presence of one or more occu-pants in an office determined by the PIR sensor is less

A. Caucheteux et al.: Occupancy measurement in building... 141
Fig. 7. Result of monitoring for one office (presence, windowsand temperature).
Fig. 8. Windows monitoring dry contact sensors position.
than 5 min to the tested desktop. It corresponds to ourrecording step.
For example, Figure 7 presents presence, windowsopening and temperature monitoring in one office on theday of 21 November 2012. We can observe the presence ofthe employee in his office from 8:05 a.m. to 12:00 p.m. andfrom 1:10 p.m. to 16:15 p.m. Some presence was seen at0:50 a.m., 5:40 a.m. and 8:40 p.m.: it corresponds to thesecurity employee that makes his patrol rounds.
4.5 Windows
Opening windows sensors were placed on the windows ofZone 1 which consisted of sliding windows. The detectionof the opening of a window is carried out by means ofthree reed contact sensors whose position is shown in Fig-ure 8. The sensors are connected to the three inputs of apulse detector, respectively. The crossing of one of themsends alarms on the state of the three sensors. The posi-tion of the sensors corresponds to the following state ofthe window:
– F1: closed;– F2: 50% opened;– F3: 100% opened.
F1, F2 and F3 are magnets fixed on the frame of thewindow. One magnet is fixed on the sliding part of thewindow. The analyses of the three sensors’ data file allowus to distinguish five positions of the window, dependingupon the position of the movable element: P1 = closed,
Fig. 9. Example of position of a light sensor for lightingdetection.
Fig. 10. Light measured in an office during one working day.
P3 = half-opened, P5 = 100% opened, P2 and P4 inter-mediate positions.
For example, we observed on Figure 7 a window open-ing at 9:50 a.m., 10:55 a.m. and 1:12 p.m. and a suddendecrease of temperature at the same time.
4.6 Lighting
The purpose is to collect information about the artificiallighting state of an office (on or off). We use ambient lightsensors placed next to lamps. Figure 9 present a picture ofan example of position of the sensors. It was placed in thedarkest area of the room. In our configuration, in mostoffices, it appears that in the absence of artificial light,measured illuminance should be under 200 lux. When thelighting is on: it should measure more than 600 lux. Inother offices, it is sometimes necessary to compare it witha measurement from another light sensor in the office orfrom an outdoor light sensor. Figure 10 gives an exampleof measurement made where we easily identify the periodwhere artificial lighting has been used.
142 International Journal of Metrology and Quality Engineering
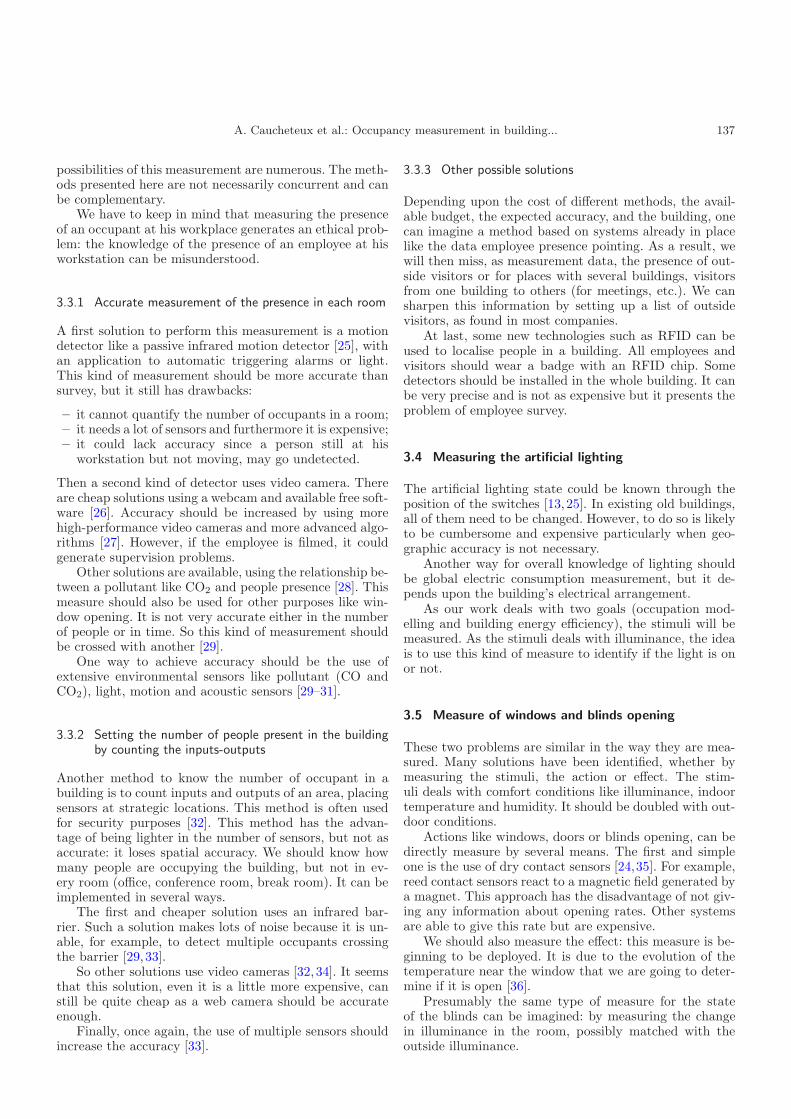
Fig. 11. Video camera system for windows and blindsmonitoring.
Fig. 12. Picture of the building for windows and blindsopening detection, example: open blind.
4.7 Window and blind state by camera
As we have just seen, the chosen monitoring of windowsopening, even if it is quite cheap, is very intrusive and timeconsuming for installation and interpretation for a wholebuilding. So, inspired by the Inkarojrit and Paliaga [37]experiment, we tested a prototypic device. The measure-ment system is based on video camera survey of the frontwall of a building. The system, that is presented in Fig-ure 11, consists of:
– a video camera that takes photographs (1 per s) andtransfers them to the processing unit;
– a processing module which analyzes photographs andcalculates openings. It could be transferred on a stan-dard desktop computer station.
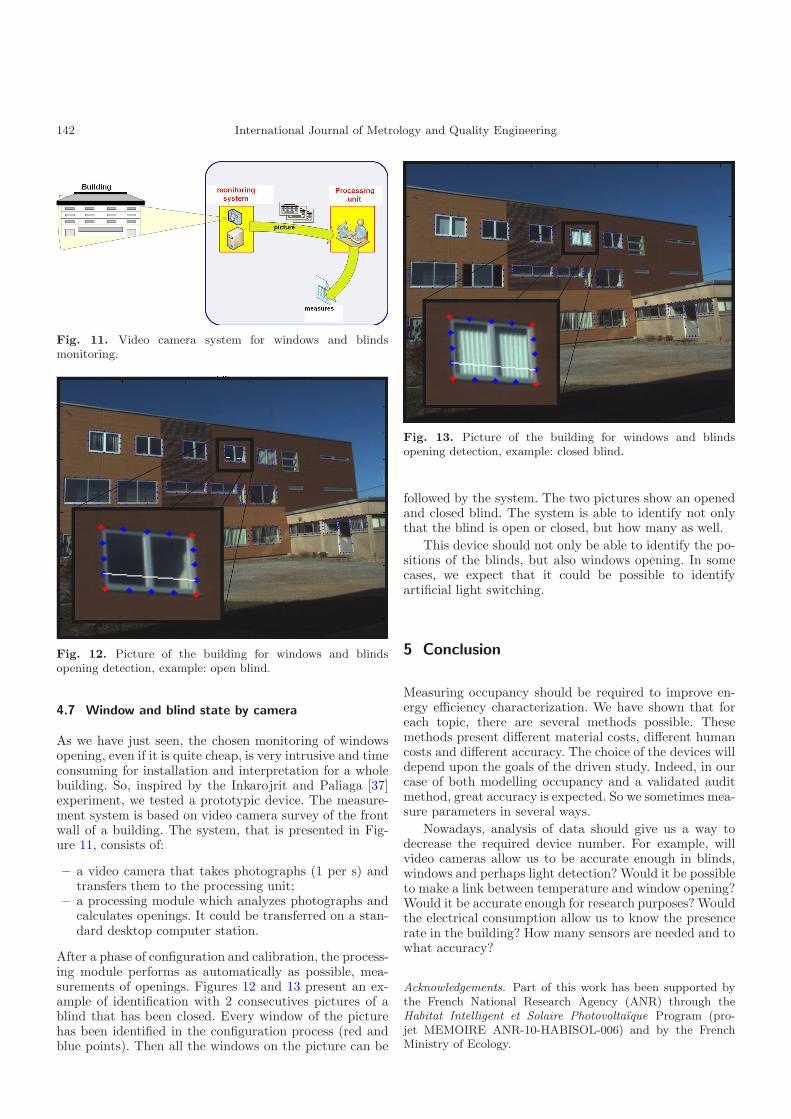
After a phase of configuration and calibration, the process-ing module performs as automatically as possible, mea-surements of openings. Figures 12 and 13 present an ex-ample of identification with 2 consecutives pictures of ablind that has been closed. Every window of the picturehas been identified in the configuration process (red andblue points). Then all the windows on the picture can be
Fig. 13. Picture of the building for windows and blindsopening detection, example: closed blind.
followed by the system. The two pictures show an openedand closed blind. The system is able to identify not onlythat the blind is open or closed, but how many as well.
This device should not only be able to identify the po-sitions of the blinds, but also windows opening. In somecases, we expect that it could be possible to identifyartificial light switching.
5 Conclusion
Measuring occupancy should be required to improve en-ergy efficiency characterization. We have shown that foreach topic, there are several methods possible. Thesemethods present different material costs, different humancosts and different accuracy. The choice of the devices willdepend upon the goals of the driven study. Indeed, in ourcase of both modelling occupancy and a validated auditmethod, great accuracy is expected. So we sometimes mea-sure parameters in several ways.
Nowadays, analysis of data should give us a way todecrease the required device number. For example, willvideo cameras allow us to be accurate enough in blinds,windows and perhaps light detection? Would it be possibleto make a link between temperature and window opening?Would it be accurate enough for research purposes? Wouldthe electrical consumption allow us to know the presencerate in the building? How many sensors are needed and towhat accuracy?
Acknowledgements. Part of this work has been supported bythe French National Research Agency (ANR) through theHabitat Intelligent et Solaire Photovoltaıque Program (pro-jet MEMOIRE ANR-10-HABISOL-006) and by the FrenchMinistry of Ecology.

A. Caucheteux et al.: Occupancy measurement in building... 143
References
1. C.M. Clevenger, J. Haymaker, The impact of the build-ing occupant on energy modeling simulations, in JointInternational Conference on Computing and DecisionMaking in Civil and Building Engineering, Montreal,Canada, 2006, pp. 3637–3646
2. A. Mahdavi, C. Proglhof, User behavior and en-ergy performance in buildings, InternationalenEnergiewirtschaftagung an der TU Wien, IEWT (2009)
3. P. Hoes, J.L.M. Hensen, M.G.L.C. Loomans, B. de Vries,D. Bougeois, User behavior in whole building simulation,Energy Build. 41, 295–302 (2009)
4. W. Parys, D. Saelens, H. Hens, Implementing realis-tic occupant behavior in building energy simulations –the effect on the results of an optimization of officebuildings, in Proceedings of the 10th REHVA WorldCongress Sustainable Energy use in Buildings, Antalya,2010, pp. 1−8
5. D. Bourgeois, J. Hand, I. Mcdonald, C. Reinhart, Addingsub-hourly occupancy prediction, occupancy-sensing con-trol and manual environmental control to ESP-r, inProceeding of Esim 2004, Vancouver, BC, 2004, pp. 119–126
6. K. Roth, P. Engelmann, Impact of user behavior on en-ergy consumption in high performance buildings resultsfrom two case studies (Fraunhofer Center for SustainableEnergy Systems, Denver, CO, 2010)
7. J. Pfafferott, S. Herkel, Statistical simulation of user be-haviour in low energy office buildings, in InternationalConference passive and low energy cooling for the built en-vironment, Santorini, Greece, 2005, pp. 721–726
8. J. Seryak, K. Kissock, Occupancy and behavioural af-fects on residential energy use, in Proceedings of the SolarEnergy Conference, Kohala Coast, Hawaii, 2003
9. D. Lindelof, N. Morel, A field investigation of the interme-diate light swithing by users, Energy Build. 38, 790–801(2006)
10. D. Bourgeois, C. Reinhart, I. Macdonald, Adding advancedbehavioural models in whole building energy simulation:a study on the total energy impact of manual and auto-mated lighting control, Energy Build. 38, 814–823 (2006)
11. D. Bourgeois, C. Reinhart, I. Macdonald, Assessing thetotal energy impact of occupant behavioural response tomanual and automated lighting systems, in Proceedingsof the buildings simulaton 2005, Montreal, Canada, 2005,pp. 1–8
12. F. Nicol, H. Rijal, M. Humphreys, Characterising theuse of windows in thermal simulation, in 2nd PALENCConference and 28th AIVC Conference on building low en-ergy cooling and advanced ventilation technologies in the21st century, Crete Island, Greece, 2007
13. F. Haldi, Towards a unified model of occupants’ behaviourand comfort for building energy simulation, Ph.D. thesis,Ecole polytechnique federale de Lausanne, 2010
14. J. Page, Simulating occupant presence and behaviour inbuildings, Ph.D. thesis, Ecole polytechnique federale deLausanne, 2007
15. G. Zimmermann, Modeling and simulation of individ-ual user behavior for building performance predictions,in Proceedings of the 2007 Summer Computer SimulationConference, SCSC 2007, San Diego, California, 2007,pp. 913–920
16. D. Bourgeois, Detailed occupancy prediction, occupancy-sensing control and advanced behavioural modelling withinwhole building energy simulation, Ph.D. thesis, UniversiteLaval, 2005
17. J.F. Nicol, Characterising occupant behaviour in build-ings: toward a stochastic model of occupant use of win-dows, lights, blinds, heaters and fans, in Proceedings of 7thIBPSA conference, IBPSA 2001, Rio de Janeiro, Brazil,2001, pp. 1073–1078
18. B. Moujalled, Modelisation dynamique du confort ther-mique dans les batiments naturellement ventiles, Ph.D.thesis, INSA, Lyon, 2007
19. P. Tuohy, H.B. Rijal, M.A. Humphreys, J.F. Nicol, A.Samuel, J. Clarke, Comfort driven adaptative windowopening behavior and the influence of building design,in Proceeding of Building Simulation 2007, 10th IBPSAConference, pp. 717–724
20. R. Cantin, B. Moujalled, G. Guarrano, Complexite du con-fort thermique dans les batiments, in 6e congres Europeende science des systemes, Paris, France, 2005
21. F. Thellier, F. Monchoux, M. Endravadan, Prise en comptedu comportement adaptatif de l’etre humain dans la sim-ulation thermique de l’habitat, in Congres Francais deThermique, Ile des Embiez, 2007
22. CSTB. Reglementation thermique 2005, French Code onEnvelope Thermal Performance for Buildings, 2006
23. ASHRAE 2002, Measurement of energy and demand sav-ings, ASHRAE Guideline 14-2002, Atlanta, GA, 2002
24. B. Fleury, P. Niard, Comportement des occupants vis-a-visde l’ouverture des fenetres. Electricite de France, directiondes etudes et recherches, service application de l’electriciteet environnement, departement application de l’electricite,Groupe habitat, novembre 1990
25. D. Delaney, G. O’Hare, A. Ruzzelli, Evaluation of energy-efficiency in lighting systems using sensor networks, inProceedings of the First ACM Workshop, on EmbeddedSensing Systems for Energy Efficiency in Buildings,Berkeley, CA, USA, 2009, pp. 61–66
26. R. Donzel, Low cost energy and occupancy monitoring sys-tem with high time resolution for non weather dependantappliances, Fourth year internship report (INSA Lyon,Berkeley lab.), 2008
27. N. Cordier, Developpement de strategies de controle deventilation appliquees aux locaux de grande dimension,Ph.D. thesis, INSA Lyon, Institut National des SciencesAppliquees, 2007
28. A. Ansanay, Estimating occupancy using indoor car-bon dioxide concentrations only in an office building: amethod and qualitative assessment, CLIMA 2013, in 8thInternational Conference on IAQVEC, 2013 (to appear)
29. T. Ekwevugbe, N. Brown, D. Fan, Using indoor climaticmeasurements for occupancy, monitoring, in Proceedings of4th West Africa, Built Environment Research (WABER)Conference, 2012, Abuja, Nigeria, edited by S. Laryea,S.A. Agyepong, R. Leiringer, W. Hughes, pp. 507–520
30. D. Bing, A. Burton, Sensor based occupancy behav-ioral pattern recognition for energy and confort manage-ment in intelligent buildings, in 11th International IBPSAConference, Glasgow, Scotland, 2009
31. K. Lam, M. Hoynck, B. Dong, B. Andrews, Y. Chiou, R.Zhang, D. Benitez, J. Choi, Occupancy detection throughan extensive environmental sensor network in an open planoffice building, in 11th International IBPSA Conference,Glasgow, Scotland, 2009, pp. 1452–1459

144 International Journal of Metrology and Quality Engineering
32. R. Tomastik, Y. Lin, A. Banaszuk, Video based estima-tion of building occupancy during emergency egress, inProceeding of American control Conference, Washington,USA, 2008
33. V.L. Erickson, Y. Lin, A. Kamthe, R. Brahme, A.Surana, A. Cerpa, M. Sohn, S. Narayanan, Energy effi-cient building environment control strategies using realtime occupancy measurements, in Proceedings of theFirst ACM Workshop on Embedded Sensing Systems forEnergy-Efficiency in Buildings (BuildSys ’09), Berkeley,California, 2009, pp. 19–24
34. J. Hutchins, A. Ihler, P. Smyth, Modeling count datafrom multiple sensors: a building occupancy model, in 2ndIEEE International Workshop on Computational advancesin multi sensor adaptative processing (CAMPSAP), 2007,pp. 241–244
35. E. Lemerrer, E. Cayre, C. Vota, Gestion de l’energie parles contacts de feuillure. Electricite de France, directiondes etudes et recherches, service application de l’electriciteet environnement, departement application de l’electricite,Groupe habitat EDF, juillet 1994
36. H.B. Rijal, P. Tuohy, F. Nicol, M.A. Humphreys, J. Clarke,A window opening algorithm and UK office temperature:fiel results and thermal simulation, Building simulation,2007
37. V. Inkarojrit, G. Paliaga, Indoor climatic influences on theoperation of windows in a naturally ventilated building, in12th Conference on passive and low energy architecture,Eindhoven, The Nederlands, 2004
38. P. Eslami-nejad, M. Bernier, Impact of grey water heatrecovery on the electrical demand of domestic hot waterheaters, in 11th IBPSA Conference, Glasgow, 2009