observational study designs and confounding michael a. kohn, md, mpp 26 august 2008
TRANSCRIPT

ObservationalStudy Designs
andConfounding
Michael A. Kohn, MD, MPP
26 August 2008

Outline
• Single Sentence Study Description
• REVIEW Observational study designs
• Definition of a confounder
• Coping with Confounding
• Examples of observational designs (“Name that Design”) and approaches to the problem of confounding

Single-Sentence Study Description
“The [cute acronym] study is a [DESIGN] study of the association between [predictor] and [outcome] in [study population].”
Exercise for section today: Present your study with a sentence like this.

Study Design
• Not just a matter of semantics
• Weaknesses and strengths associated with each study design
• Different measures of disease association
• Worth getting right or at least thinking about

Study Designs
• Experimental-- Randomized controlled trial (next week)• Observational (today’s topic)-- Cohort -- Double Cohort (risk-no risk; exposure-no
exposure)-- Cross-sectional-- Case-control

Experimental vs. Observational• Predictor = intervention (treatment or therapy):
-- experiment (randomized controlled trial)*
-- observational study
• Predictor = exposure or risk factor:
-- observational study
*Not all treatments require RCTs to prove effectiveness.

OBSERVATIONAL STUDIES
• Usually the only option if the predictor is a potentially harmful exposure or risk factor
• Even if the predictor is an intervention, an RCT may not be feasible
• Confounding always an issue
• Many observational studies also qualify as secondary data analysis
• More intellectually interesting than RCTs?

Note on Figures
The schematics of observational study designs that follow assume that you are studying the association between a risk factor and development of a disease.
• Predictor = Risk Factor
• Outcome = Disease

Cohort Study

Cohort Studies
• Determine predictor status on all patients in a single population (defined by something other than the predictor). Exclude any patients who already have the outcome.
• Follow patients over time and attempt to determine outcome in all subjects
• Can identify individuals lost to follow up• Can measure overall incidence of outcome in
the population (e.g., cases/person-year)• Measure of disease association is the relative
risk (RR) or relative hazard (RH)

Double Cohort Study
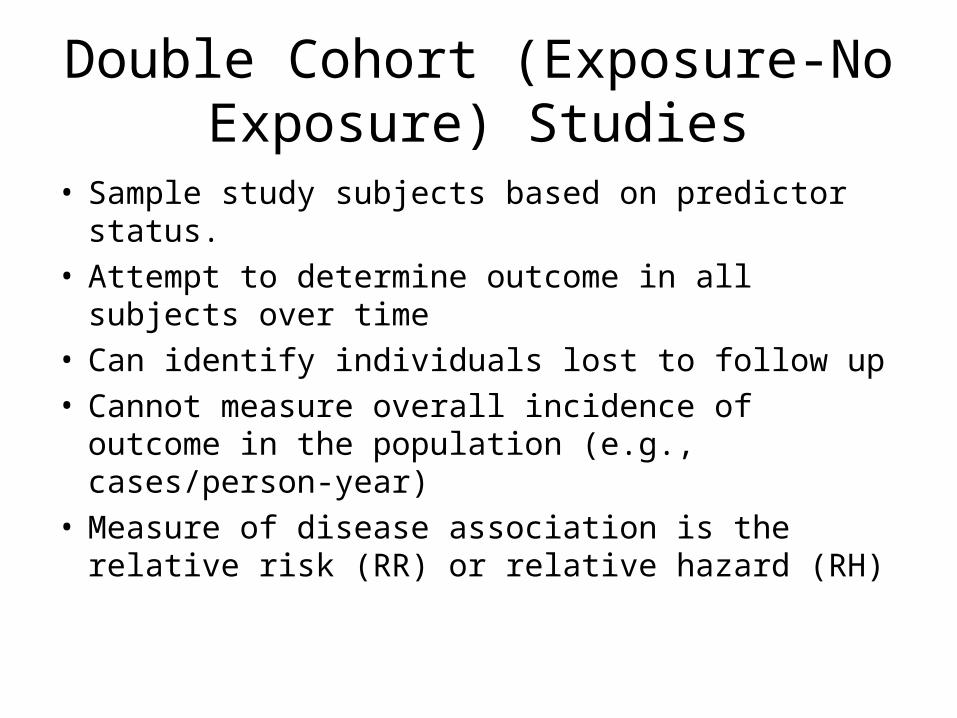
Double Cohort (Exposure-No Exposure) Studies
• Sample study subjects based on predictor status.
• Attempt to determine outcome in all subjects over time
• Can identify individuals lost to follow up• Cannot measure overall incidence of outcome in
the population (e.g., cases/person-year)• Measure of disease association is the relative
risk (RR) or relative hazard (RH)

Cohort Studies: Sampling Frame vs. Time Frame
Time Frame: All cohort studies are longitudinal (follow patients over time).
Sampling Frame:Double cohort study -- samples on predictor
status, i.e. there are separate predictor-positive and predictor-negative samples.
Cohort study -- starts with a cross-sectional sample (a population defined by something other than the predictor variable).

Cohort Studies: Prospective vs. Retrospective
Prospective – Predictor status collected as part of this study
Retrospective – Predictor status collected by someone else in the past (another study, medical records, etc.)
It’s a cohort study if you follow predictor-positive and predictor-negative subjects over time for development of the outcome and if you can identify the subjects lost to follow up. Don’t worry too much about retrospective vs. prospective!
Case-Control Study

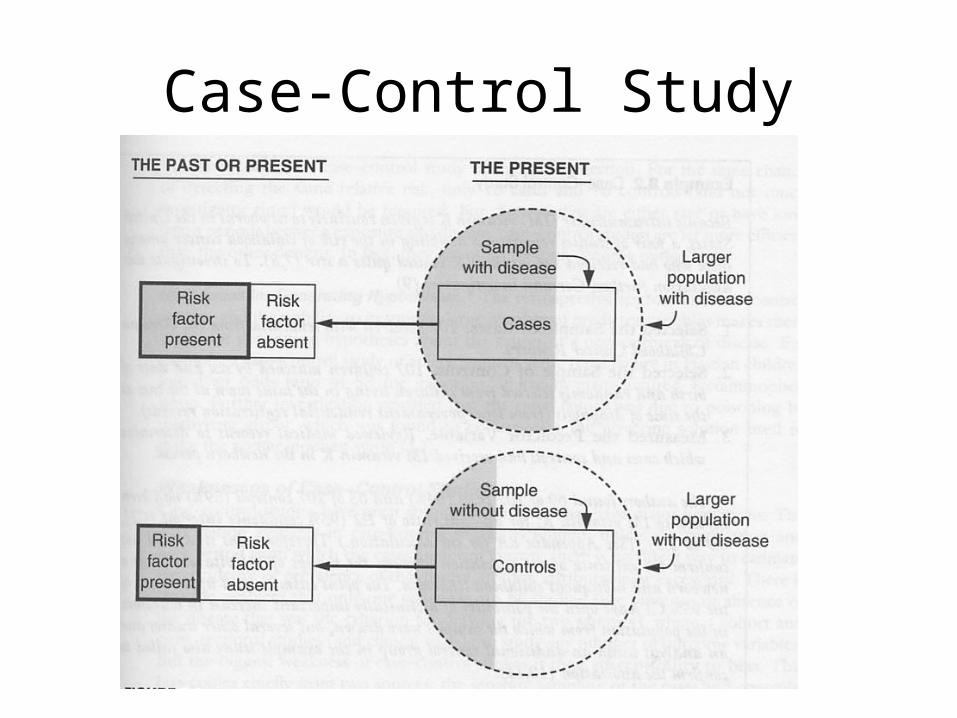
Case-Control Study• Separately sample subjects with the outcome (cases)
and without the outcome (controls)• Attempt to determine predictor status on all subjects in
both outcome groups• Cannot identify individuals lost to follow up (no such
thing as “lost to follow up”, since by definition outcome status is known)
• Cannot calculate prevalence (or incidence) of outcome• Measure of disease association is the Odds Ratio (OR)• Trying to replicate a nested case control study in which
the cases and controls come from the same cohort.

Nested Case-Control Study

Cross-Sectional Study

Cross-Sectional Study• Attempt to determine predictor and outcome
status on all patients in a single population (defined by something other than predictor and outcome).
• Cannot identify individuals lost to follow up (no such thing as “lost to follow up”)
• Can calculate prevalence but not incidence• Measure of disease association is the Relative
Prevalence (RP).• Time frame is the same as for a case-control
study; both discussed in Hulley, Chapter 8

Cohort Studies Start with a Cross-Sectional Study
Eliminate subjects who already have disease

Causal Association Between Predictor and Outcome
• Does predictor cause outcome?
• For now, not interested in studies of diagnostic/prognostic tests. (Test result does not cause outcome. See Ch. 12.)*
• Not interested in descriptive studies.
*How many of you are doing studies of diagnostic/prognostic tests?

Errors in Causal Inference
• Conclude that predictor causes outcome when, in truth, it doesn’t (false positive study)
• Fail to conclude that predictor causes outcome when, in truth, it does (false negative study)
Sources of Error
• Chance
• Bias
• Confounding

Sources of Error: Confounding
Association between predictor and outcome is “real” – but not causal.

Confounding In Observational Studies of a Treatment
Predictor = Treatment

Sources of Error: Confounding
Treatment Outcome
ConfounderReduces RiskAssociation or
Looks Good
Cause
Falsely conclude that treatment improves outcomes

Confounding: Vitamin E
Vitamin E Fewer CAD events
Diet, Exercise, Health Awareness?
True CauseAssociation
False Cause
Cause

Confounding: Suppression or Confounding by Indication
Treatment Outcome
SuppressorWorsensAssociation
Improves
Cause
Falsely conclude that treatment does not improve or even worsens outcome
Appears to Worsen

Confounding by Indication : Diuretic Therapy
Diuretics CVD Mortality
Severity of Disease
IncreasesAssociation
Decreases
Cause
Falsely concluded that diuretics increased CVD mortality
Warram JH, et al. Excess mortality associated with diuretic therapy in diabetes mellitus. Arch Intern Med 1991;151(7):1350-6. Turnbull, F., et al. (2005). "Effects of different blood pressure-lowering regimens on major cardiovascular events in individuals with and without diabetes mellitus.” Arch Intern Med 165(12): 1410-9.
Appears to Worsen
Intermediates
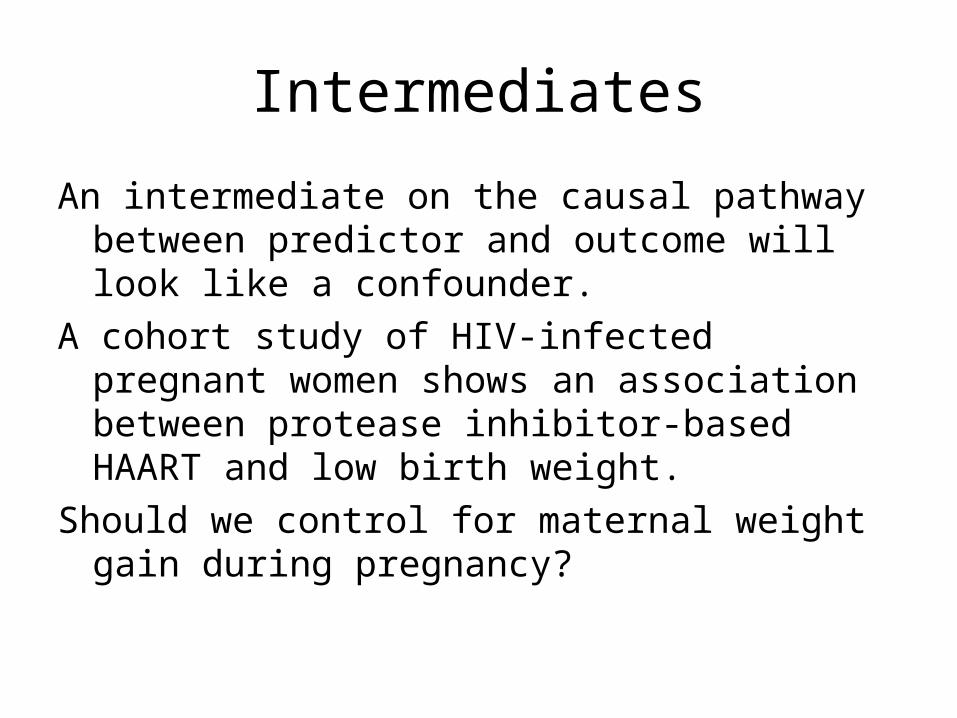
An intermediate on the causal pathway between predictor and outcome will look like a confounder.
A cohort study of HIV-infected pregnant women shows an association between protease inhibitor-based HAART and low birth weight.
Should we control for maternal weight gain during pregnancy?

IS IT THIS?
PI-Based HAART Low Birth Weight
Low maternal weight gain
True CauseAssociation
False Cause
Cause

OR THIS?
PI-Based HAART Low Birth Weight
Low maternal weight gain
CauseCause

Coping with ConfoundingDesign Phase
• Specification
• Matching
• Instrumental Variable– Associated with the predictor of interest but
not independently associated with the outcome
– Look for association between instrumental variable and outcome

Assessing the Importance of Confounding
• Alternative Outcome – Caused by confounders but not by the primary
predictor – If still associated with the primary predictor,
confounding is a problem
• Alternative Predictor– Associated with same confounders as main predictor
but not thought to cause the outcome– If still associated with the outcome, confounding is a
problem

Coping with ConfoundingAnalysis Phase*
• Stratification
• Statistical Adjustment
• Propensity Scores
*Have to measure potential confounders

Examples
Name that observational study design
Address issue of confounding

AZT Prophylaxis after Needlestick in Health Care Workers
The proportion receiving AZT prophylaxis was compared between health care workers who sero-converted after a needlestick and health care workers who did not seroconvert after a needlestick.
Cardo et al. N Engl J Med 1997;337(21):1485-90.
DESIGN?

AZT Prophylaxis after Needlestick in Health Care Workers
Cardo et al. N Engl J Med 1997;337(21):1485-90.
Seroconversion
Yes No
AZTYes 9 (27%) 247 (36%)
No 24 432
33 679
OR = 0.66
(95% CI 0.26 - 1.5)
Confounding?

Suppression: AZT after Needlestick
AZTHIV Sero-conversion
Deep Stick, Visible Blood on Needle
IncreasesAssociation
Decreases
Cause
Unadjusted analysis showed statistically insignificant effect of AZT in reducing
seroconversion
Appears to Increase

AZT Prophylaxis after Needlestick in Health Care Workers
Logistic Regression Model Adjusting for Deep Stick, Visible Blood on Device
Cardo et al. N Engl J Med 1997;337(21):1485-90.
MVOR = 0.14
(95% CI 0.03-0.47)

Enhancing Causal Inference
Statistical Adjustment
(Multivariable Modeling)
Katz, M. H. (2006). Multivariable analysis : a practical guide for clinicians. Cambridge ; New York, Cambridge University Press.

Effect of Flu Vaccination on All-Cause Mortality During the Flu Season
The study population included almost 300,000 subjects at least 65 years old, of whom about 58% were vaccinated. Among vaccinated and unvaccinated subjects, 1.2% and 2.0% respectively died during the flu season.
Nichol et al. N Engl J Med. Apr 3 2003;348(14):1322-1332.
Pooled computerized data from 3 large managed care organizations.
Study Design?

Effect of Flu Vaccination on All-Cause Mortality During the Flu Season
Could confounding explain the association between flu vaccination and decreased risk of death during the flu season?

Effect of Flu Vaccination on All-Cause Mortality During the Flu Season
“Healthy Vaccinee Bias”
Flu Vaccination Death During Flu Season
Better health, better health care, other confounders
DecreasesAssociation
False Effect
Cause

Effect of Flu Vaccination on All-Cause Mortality During the Flu Season
How might you assess the importance of confounding?

If worried about confounding, measure another outcome that could be caused by the confounder but NOT by the predictor of interest. If there is NO association between the predictor of interest and the alternative, causally unrelated outcome, then the relationship between the primary predictor and the outcome is more likely to be causal.
Enhancing Causal InferenceMeasure Alternative Outcome

Effect of Flu Vaccination on All-Cause Mortality During the Flu Season
Flu Vaccination Death During Summer Months
Better health care, other confounders
DecreasesAssociation
Should Not Affect
Cause
If the association of flu vaccination and decreased mortality during the flu season were due to confounding, then vaccination should also appear to reduce death during the summer months.
Appears to Decrease

“Our analysis for evidence of a healthy-vaccinee bias was negative; during the two noninfluenza periods for which we had information, vaccinated and unvaccinated persons had similar risks of hospitalization”
Effect of Flu Vaccination on All-Cause Mortality During the Flu Season
Nichol, K. L., J. D. Nordin, et al. (2007). "Effectiveness of influenza vaccine in the community-dwelling elderly." N Engl J Med 357(14): 1373-81.
Time Period
Adjusted Odds Ratio
95% CI
6/ – 9/1999 1.0 0.78 - 1.28
6/ – 9/2000 0.94 0.74 - 1.19

Health Professionals Follow-up Study
• In 1986, 39,910 male dentists, veterinarians, pharmacists, optometrists, and podiatrists filled out a questionnaire including information about Vitamin E intake (the predictor)
• In 1988 and 1990, vital status was determined and those who were still alive were re-contacted to see if they had developed coronary artery disease (the outcome). Death/disease rates were lower in those who took Vitamin E.
Rimm, E. B., M. J. Stampfer, et al. (1993). "Vitamin E consumption and the risk of coronary heart disease in men." N Engl J Med 328(20): 1450-6.
Design?
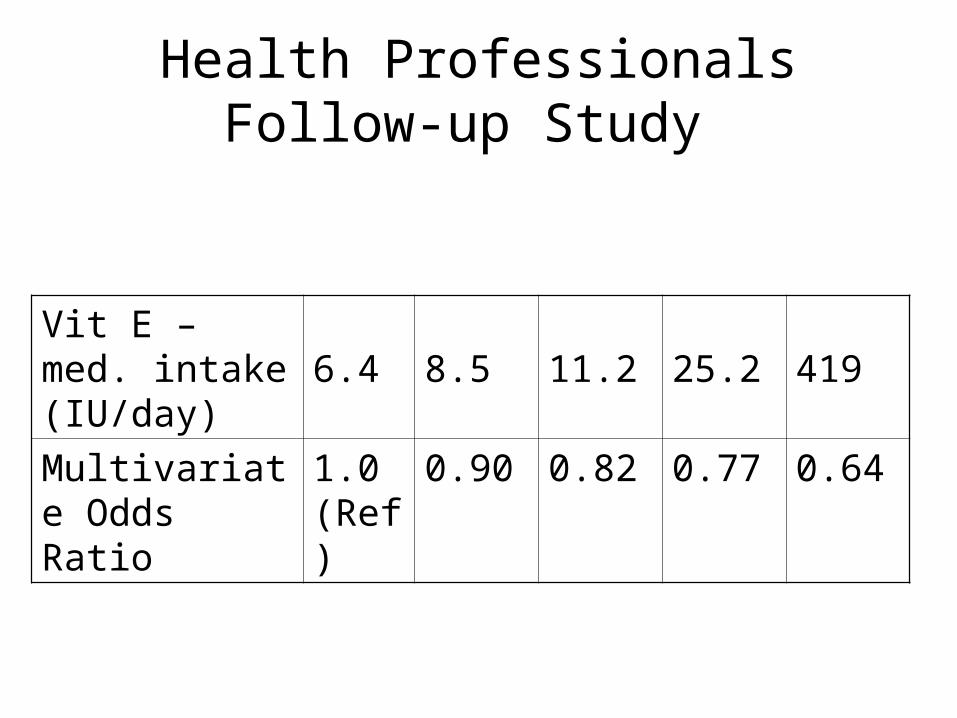
Health Professionals Follow-up Study
Vit E – med. intake (IU/day)
6.4 8.5 11.2 25.2 419
Multivariate Odds Ratio
1.0 (Ref)
0.90 0.82 0.77 0.64

Confounding: Vitamin E
Vitamin E Fewer CAD events
Diet, Exercise, Health Awareness?
True CauseAssociation
False Cause
Cause

Health Professionals Follow-up Study
Vit E – med. intake (IU/day)
6.4 8.5 11.2 25.2 419
Multivariate Odds Ratio
1.0 (Ref)
0.90 0.82 0.77 0.64
Vit C – med. intake (mg/day)
92 149 218 392 1,162
Multivariate Odds Ratio
1.0 (Ref)
1.02 1.15 1.02 0.89

If worried about confounding, measure another predictor that is associated with the same confounders. If this second predictor is NOT associated with the primary outcome, then the relationship between the primary predictor and the outcome is more likely to be causal.
Enhancing Causal InferenceMeasure Alternative Predictor

Confounding: Alternative Predictor
Vitamin C Fewer CAD events
Diet, Exercise, Health Awareness?
True CauseAssociation
False Cause
Cause
If the confounding accounted for the benefits of Vitamin E, then Vitamin C should also appear beneficial.

Randomized Trials “Trump” Observational Results
Combined results of 7 large-scale randomized trials of the effectiveness vitamin E in the treatment and prevention of cardiovascular disease “provide strong support for a lack of statistically significant or clinically important effects of vitamin E on cardiovascular disease.”
Eidelman, R. S., D. Hollar, et al. (2004). "Randomized trials of vitamin E in the treatment and prevention of cardiovascular disease." Arch Intern Med 164(14): 1552-6.
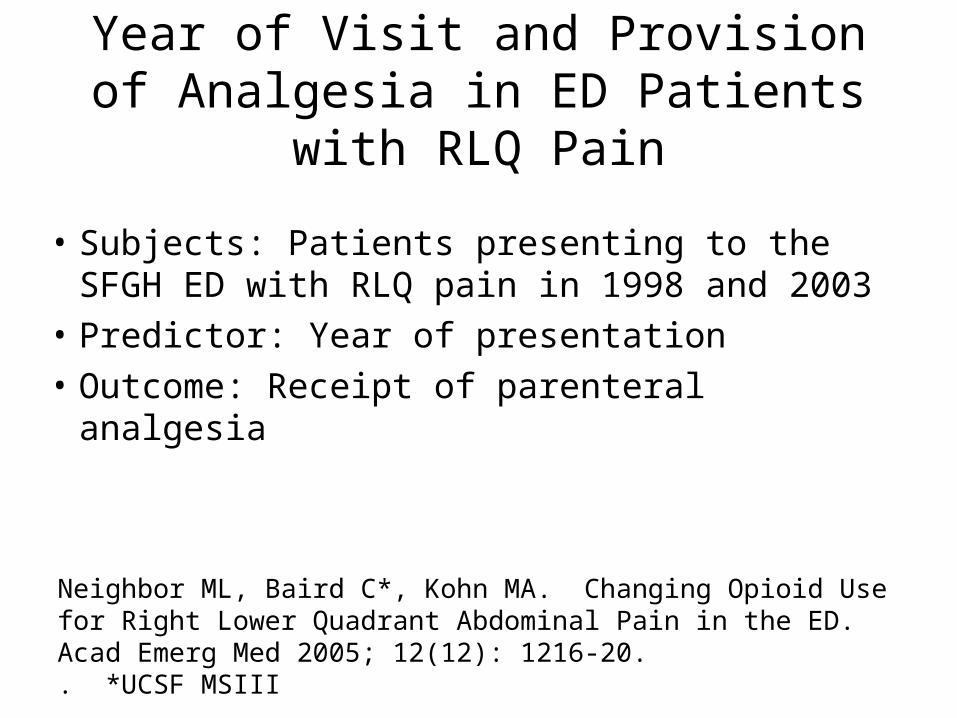
Year of Visit and Provision of Analgesia in ED Patients with RLQ Pain
• Subjects: Patients presenting to the SFGH ED with RLQ pain in 1998 and 2003
• Predictor: Year of presentation
• Outcome: Receipt of parenteral analgesia
Neighbor ML, Baird C*, Kohn MA. Changing Opioid Use for Right Lower Quadrant Abdominal Pain in the ED. Acad Emerg Med 2005; 12(12): 1216-20.. *UCSF MSIII

Year of Visit and Provision of Analgesia in ED Patients with RLQ Pain
Analgesia
Year Yes No Total Prevalence
2003 72 65 137 53%
1998 43 144 187 23%
Relative Prevalence = 2.3
Design?

Year of Visit and Provision of Analgesia in ED Patients with RLQ Pain
1. Patients who get abdominal CTs are much more likely to get analgesia (59% vs. 22%)
2. CTs were much more common in 2003 than in 1998 (56% vs 20%)
Is the increase in analgesia rates between 1998 and 2003 wholly explained by increased CT scanning?
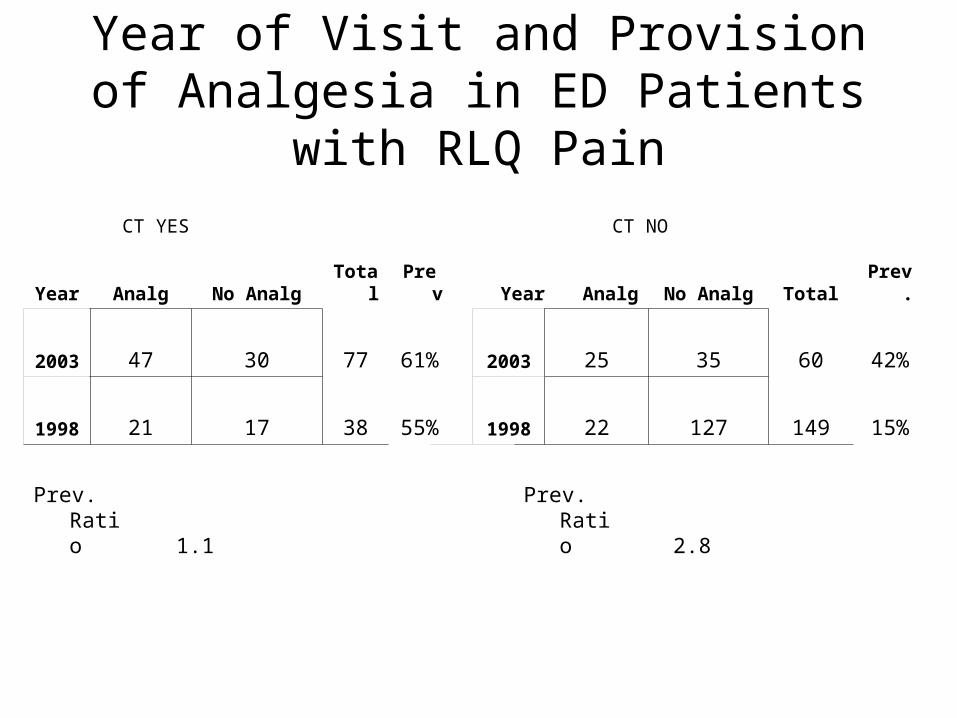
Year of Visit and Provision of Analgesia in ED Patients with RLQ Pain
CT YES CT NO
Year Analg No Analg Total Prev Year Analg No Analg Total Prev.
2003 47 30 77 61% 2003 25 35 60 42%
1998 21 17 38 55% 1998 22 127 149 15%
Prev. Ratio 1.1
Prev. Ratio 2.8

Year of Visit and Provision of Analgesia in ED Patients with RLQ Pain
Is the increase in analgesia rates between 1998 and 2003 wholly explained by increased CT scanning?
NO. In the group that did not receive CTs, analgesia rate was almost 3x higher in 2003 than in 1998.
Enhancing Causal Inference
Stratification
DCR 3rd Ed. Chapter 9 pp. 137.
Also, Appendix 9A
Smoking as a confounder of the relationship between coffee drinking and MI.

JIFeeBabies born at Kaiser with neonatal
hyperbilirubinemia (Bili > 25) are compared with randomly selected “controls” from the same birth cohort.
Outcome measure is IQ and neurologic status at age 5 years.
No difference in IQ or fraction with neurologic disability between the “case” and “control” groups.
Newman, T. B., P. Liljestrand, et al. (2006). "Outcomes among newborns with total serum bilirubin levels of 25 mg per deciliter or more." N Engl J Med 354(18): 1889-900.
Design?

RRISK(Reproductive Risk Factors for
Incontinence at Kaiser)
• Random sample of 2100 women aged 40-69 yo
• Interview, self report, diaries to determine whether they have the outcome, urinary incontinence.
• Chart abstraction of L&D/surgical records to establish predictor status
Design?
RRISK
*There is a longitudinal element in this study, and it was funded with an R01 by the NIDDK as a “retrospective cohort study.”
Can you identify losses to follow up? (e.g., patients who had surgical procedures in the past but for whom outcome status cannot be determined)

HIV Tropism and Rapid Progression*
Is HIV CXCR4 (as opposed to CCR5) tropism a predictor of rapid progression in acutely infected HIV patients?
Molecular tropism assay is “high end” and labor-intensive. Have funding to perform a total of 80 assays.
UCSF OPTIONS cohort follows patients acutely infected with HIV. Has banked serum from near time of acute infection.
* Vivek Jain’s Project

Identify the 40 patients with the most rapid progression (Group 1) and randomly select 40 others from the UCSF Options cohort (Group 2).
Run the tropism assay on banked serum for these 80 patients and compare results between Group 1 and Group 2.
HIV Tropism and Rapid Progression (continued)
Design?

Screening Sigmoidoscopy and Risk of Death from Colon Cancer
Compared rates of previous sigmoidoscopy in patients who had died of colon cancer (of the rectum and distal colon) with sigmoidoscopy rate in patients who had not died of colon cancer. Sigmoidoscopy rates were lower in the group of patients who died of cancer.
Selby JV, et al. N Engl J Med 1992;326(10):653-7.
Design?

Screening Sigmoidoscopy and Risk of Death from Colon Cancer
Selby JV, et al. N Engl J Med 1992;326(10):653-7.
The authors did a second comparison between patients who died of proximal colon cancers and patients who did not die of proximal colon cancers. Sigmoidoscopy rates were the same in both. (See Hulley, Ch 12, page 195.)
Confounding?

Enhancing Causal InferenceMeasure Alternative Outcome
If worried about confounding, measure another outcome that could be caused by the confounder but NOT by the predictor of interest. If there is NO association between the predictor of interest and the alternative, causally unrelated outcome, then the relationship between the predictor and the primary outcome is more likely to be causal.
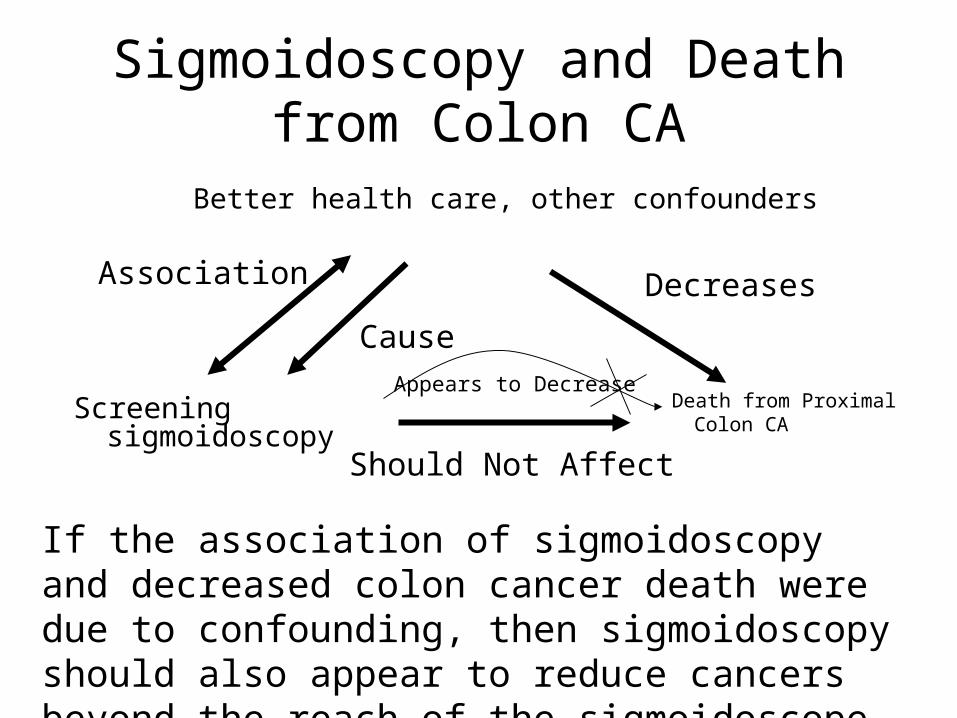
Sigmoidoscopy and Death from Colon CA
Screening sigmoidoscopy
Death from Proximal Colon CA
Better health care, other confounders
DecreasesAssociation
Should Not Affect
Cause
If the association of sigmoidoscopy and decreased colon cancer death were due to confounding, then sigmoidoscopy should also appear to reduce cancers beyond the reach of the sigmoidoscope
Appears to Decrease