observation of low energy raman modes in twisted bilayer graphene
TRANSCRIPT

Observation of Low Energy Raman Modes in Twisted BilayerGrapheneRui He,*,†,¶ Ting-Fung Chung,‡,§,¶ Conor Delaney,† Courtney Keiser,† Luis A. Jauregui,§,∥
Paul M. Shand,† C. C. Chancey,† Yanan Wang,⊥ Jiming Bao,⊥ and Yong P. Chen*,‡,§,∥
†Department of Physics, University of Northern Iowa, Cedar Falls, Iowa 50614, United States‡Department of Physics, §Birck Nanotechnology Center, and ∥School of Electrical and Computer Engineering, Purdue University,West Lafayette, Indiana 47907, United States⊥Department of Electrical and Computer Engineering, University of Houston, Houston, Texas 77204, United States
*S Supporting Information
ABSTRACT: Two new Raman modes below 100 cm−1 areobserved in twisted bilayer graphene grown by chemical vapordeposition. The two modes are observed in a small range oftwisting angle at which the intensity of the G Raman peak isstrongly enhanced, indicating that these low energy modes andthe G Raman mode share the same resonance enhancementmechanism, as a function of twisting angle. The ∼94 cm−1
mode (measured with a 532 nm laser excitation) is assigned tothe fundamental layer breathing vibration (ZO′ mode)mediated by the twisted bilayer graphene lattice, which lackslong-range translational symmetry. The dependence of thismode’s frequency and line width on the rotational angle can beexplained by the double resonance Raman process that is different from the previously identified Raman processes activated bytwisted bilayer graphene superlattice. The dependence also reveals the strong impact of electronic-band overlaps of the twographene layers. Another new mode at ∼52 cm−1, not observed previously in the bilayer graphene system, is tentatively attributedto a torsion mode in which the bottom and top graphene layers rotate out-of-phase in the plane.
KEYWORDS: Bilayer graphene, twisted, Raman, low energy modes
In bilayer graphene (BLG) exfoliated from highly orientedpyrolytic graphite (HOPG) crystals, the top and bottom
graphene layers usually form Bernal (A-B) stacking in whichthe carbon atoms of the B sublattice of the second layer sit ontop of the A sublattice carbon atoms of the first graphene layer.Two parallel parabolic conduction bands situated aboveanother two parallel parabolic valence bands with zero bandgapcharacterizes the low energy (near the charge neutral point)electronic band structure of Bernal-stacked BLG.1−3 However,in twisted BLG (tBLG) in which the second graphene layer isrotated with respect to the first layer, the low-energy electronicband structure can be represented by two Dirac conesseparated by a wavevector that depends on the rotationalangle.4,5 While linear dispersion is maintained in tBLG system,van Hove singularities in the density of states (DOS) aregenerated due to the coupling of the two layers.4 In addition,tBLG exhibits interesting optical features with opticalabsorption bands in the visible range.6,7 Hence, probing thefundamental properties of tBLG is of interest and importance.Phonons play an important role in electron transport in BLG
through electron−phonon interactions.8 Low energy phonons,for example, the layer breathing mode in which the twographene layers vibrate out-of-phase perpendicular to their
planes, facilitate interlayer current conduction in tBLG.9 Ramanspectroscopy is a noninvasive, direct, and sensitive probe ofphonons in graphene layers. It has been shown that theintensity of the G Raman peak and the position, line width, andintensity of the 2D Raman band undergo characteristic changesas a function of twisting angle.4,5 In addition, new Raman lines,for example, R and R′ peaks close to the G band, other linesaround the D peak, and out-of-plane acoustic (ZA) and layerbreathing (ZO′) modes (between 120 and 200 cm−1) areobserved in tBLG due to Raman processes in which finitewavevector phonon scatterings are activated by involving angledependent superlattice wavevectors.10−12
In this paper, we report the observation of new low energyvibrational modes below 100 cm−1 in Raman scattering fromtBLG. For a given laser excitation energy, these modes are onlyobserved in the vicinity of a specific twisting angle at which theG Raman band is strongly enhanced. This observation indicatesthat the resonance enhancement mechanism of the low energymodes is similar to that of the G band enhancement.4,5 In
Received: April 15, 2013Revised: July 12, 2013Published: July 16, 2013
Letter
pubs.acs.org/NanoLett
© 2013 American Chemical Society 3594 dx.doi.org/10.1021/nl4013387 | Nano Lett. 2013, 13, 3594−3601
addition to the resonance enhancement of the intensities of theobserved low energy Raman modes, the intensity of thebackground on which the low energy Raman peaks aresuperimposed is also enhanced near the critical twistingangle. This broad and enhanced background at low energycould be related to electronic excitations in tBLG. The Ramanpeak at ∼94 cm−1 (measured with laser wavelength 532 nm),referred to as (ZO′)L mode in this paper, is assigned to thefundamental layer breathing mode (arising from the out-of-plane relative motions of the two graphene layers). This modecan be explained by the double resonance mechanism and maybe activated by the tBLG lattice that lacks long-rangetranslational symmetry. The dependence of the frequency andline width of this mode on the twisting angle reveals the degreeof overlap of the two Dirac cones that belong to the two layersin tBLG. This fundamental ZO′ mode is also observed at ahigher frequency above 100 cm−1 (here referred to as (ZO′)H)and is understood to be mediated by the tBLG superlattice withwavevector q.13 The coexistence of two fundamental ZO′Raman lines originating from phonons in different parts of the
Brillouin zone (with different phonon wavevectors) suggeststhat although the tBLG system lacks long-range translationalsymmetry, superlattice periodicity can still be defined. Incontrast, in Bernal-stacked BLG, the fundamental layerbreathing (ZO′) mode is known to be spectroscopicallyinactive (silent) and has never been observed previously(only its overtone 2ZO′ was observed).14,15 Our observationindicates that tBLG differs dramatically from Bernal-stackedBLG and highlights that tBLG is a very interesting system thatallows us to probe a broad range of phonon dispersion in theinterior of the Brillouin zone. Another mode at ∼52 cm−1 istentatively assigned to a torsion mode that also appears to beactivated in the tBLG system but not in the Bernal-stackedBLG.Our graphene layers were grown by chemical vapor
deposition (CVD) on Cu foils at ambient pressure16,17
(APCVD) and transferred onto a highly p-doped Si substrate(with ∼300 nm SiO2) for all subsequent measurements. Detailsof the sample growth are shown in the Supporting Information.Figure 1a shows an optical image of CVD graphene on Si/SiO2
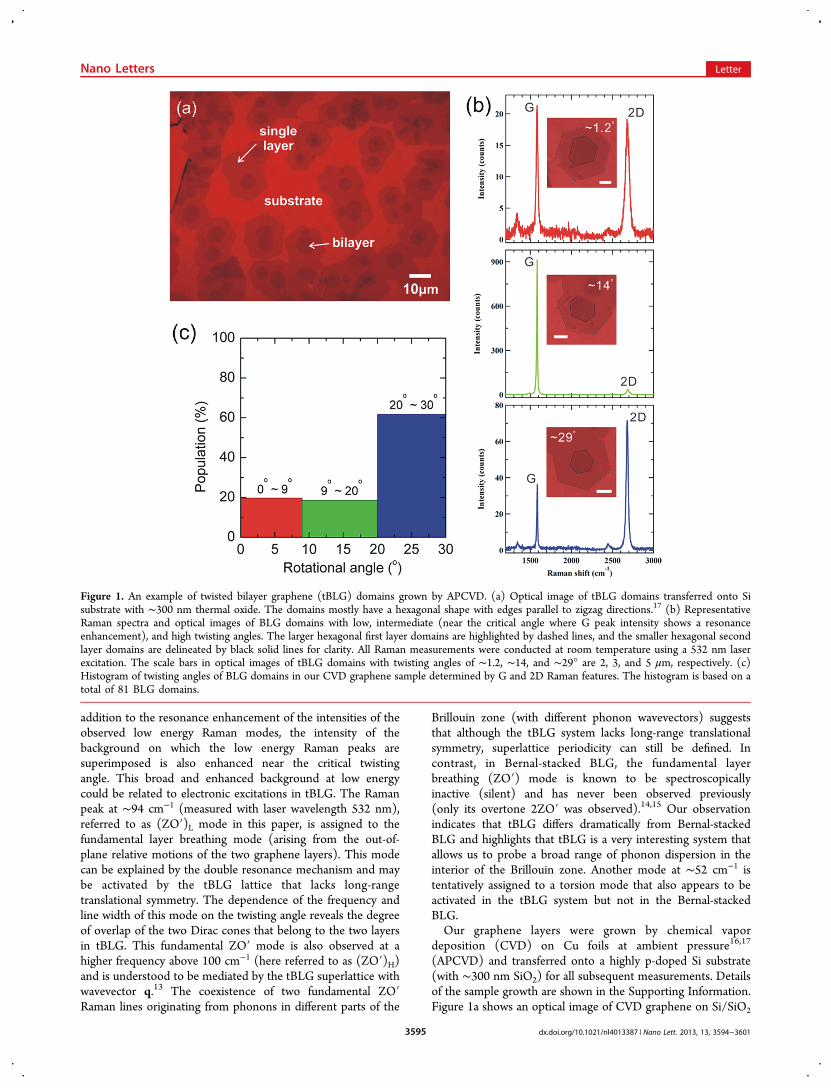
Figure 1. An example of twisted bilayer graphene (tBLG) domains grown by APCVD. (a) Optical image of tBLG domains transferred onto Sisubstrate with ∼300 nm thermal oxide. The domains mostly have a hexagonal shape with edges parallel to zigzag directions.17 (b) RepresentativeRaman spectra and optical images of BLG domains with low, intermediate (near the critical angle where G peak intensity shows a resonanceenhancement), and high twisting angles. The larger hexagonal first layer domains are highlighted by dashed lines, and the smaller hexagonal secondlayer domains are delineated by black solid lines for clarity. All Raman measurements were conducted at room temperature using a 532 nm laserexcitation. The scale bars in optical images of tBLG domains with twisting angles of ∼1.2, ∼14, and ∼29° are 2, 3, and 5 μm, respectively. (c)Histogram of twisting angles of BLG domains in our CVD graphene sample determined by G and 2D Raman features. The histogram is based on atotal of 81 BLG domains.
Nano Letters Letter
dx.doi.org/10.1021/nl4013387 | Nano Lett. 2013, 13, 3594−36013595
substrate. Single layer and bilayer graphene areas can beidentified from the color contrast. It is seen that ∼70−80% ofthe substrate is covered by graphene (polycrystalline consistingof single crystal graphene domains). The first layer domainshave a typical size of ∼20 μm and largely connect withneighboring domains. The second layer domains are oftenlocated near the centers of the first layer domains and have atypical lateral size of a few micrometers. The graphene domainsgrown by our CVD method are mostly hexagonal in shape withedges parallel to zigzag directions of the graphene lattice17
(thus facilitating the determination of the lattice orientationusing these edges; see below). The number of layers isconfirmed by both Raman measurements as well as bymeasurements of the thickness of bilayer domains by atomicforce microscopy (AFM) in a tapping mode (see arepresentative AFM image in the Supporting Information).Figure 1b illustrates three representative Raman spectra
measured from tBLG domains with different twisting angles.From the G and 2D Raman band features,4,5 we can estimatethe twisting angles. The insets display the corresponding opticalimages of each BLG domain. Contours of the single-layer(dashed lines) and bilayer (solid lines) areas have beenincluded as guides to the eye. The twisting (misorientation)angles can also be determined by measuring the angles formedbetween neighboring edges of the first and the second layerdomains.18 Both methods provide consistent estimation oftwisting angles (within ∼2°). Figure 1c summarizes thedistribution of twisting angles determined by the Ramanmethod. A similar histogram of BLG twisting angles is alsoobtained by measuring the relative orientations between theedges of top and bottom graphene layers seen in optical images(see the Supporting Information). The twisting angledistribution suggests that our APCVD growth favors tBLGwith a large twisting angle (20−30°). This is very different fromthe bilayer domains grown by low-pressure (LP) CVD that arelargely in Bernal-stacked configuration (no-twisting).19,20 Thisfinding reveals that the distribution of rotational angles in tBLGdepends on the growth conditions, which influence the growthkinetics of CVD graphene.Figure 2a shows five representative Raman spectra measured
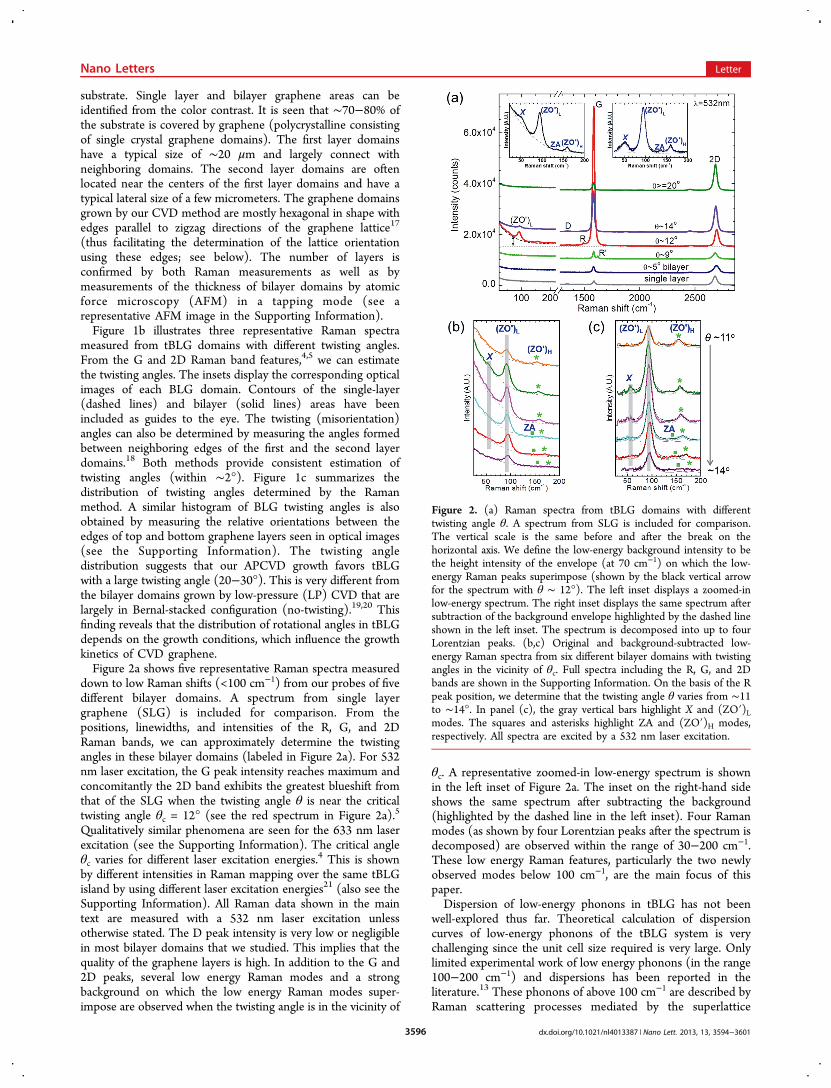
down to low Raman shifts (<100 cm−1) from our probes of fivedifferent bilayer domains. A spectrum from single layergraphene (SLG) is included for comparison. From thepositions, linewidths, and intensities of the R, G, and 2DRaman bands, we can approximately determine the twistingangles in these bilayer domains (labeled in Figure 2a). For 532nm laser excitation, the G peak intensity reaches maximum andconcomitantly the 2D band exhibits the greatest blueshift fromthat of the SLG when the twisting angle θ is near the criticaltwisting angle θc = 12° (see the red spectrum in Figure 2a).5
Qualitatively similar phenomena are seen for the 633 nm laserexcitation (see the Supporting Information). The critical angleθc varies for different laser excitation energies.4 This is shownby different intensities in Raman mapping over the same tBLGisland by using different laser excitation energies21 (also see theSupporting Information). All Raman data shown in the maintext are measured with a 532 nm laser excitation unlessotherwise stated. The D peak intensity is very low or negligiblein most bilayer domains that we studied. This implies that thequality of the graphene layers is high. In addition to the G and2D peaks, several low energy Raman modes and a strongbackground on which the low energy Raman modes super-impose are observed when the twisting angle is in the vicinity of
θc. A representative zoomed-in low-energy spectrum is shownin the left inset of Figure 2a. The inset on the right-hand sideshows the same spectrum after subtracting the background(highlighted by the dashed line in the left inset). Four Ramanmodes (as shown by four Lorentzian peaks after the spectrum isdecomposed) are observed within the range of 30−200 cm−1.These low energy Raman features, particularly the two newlyobserved modes below 100 cm−1, are the main focus of thispaper.Dispersion of low-energy phonons in tBLG has not been
well-explored thus far. Theoretical calculation of dispersioncurves of low-energy phonons of the tBLG system is verychallenging since the unit cell size required is very large. Onlylimited experimental work of low energy phonons (in the range100−200 cm−1) and dispersions has been reported in theliterature.13 These phonons of above 100 cm−1 are described byRaman scattering processes mediated by the superlattice
Figure 2. (a) Raman spectra from tBLG domains with differenttwisting angle θ. A spectrum from SLG is included for comparison.The vertical scale is the same before and after the break on thehorizontal axis. We define the low-energy background intensity to bethe height intensity of the envelope (at 70 cm−1) on which the low-energy Raman peaks superimpose (shown by the black vertical arrowfor the spectrum with θ ∼ 12°). The left inset displays a zoomed-inlow-energy spectrum. The right inset displays the same spectrum aftersubtraction of the background envelope highlighted by the dashed lineshown in the left inset. The spectrum is decomposed into up to fourLorentzian peaks. (b,c) Original and background-subtracted low-energy Raman spectra from six different bilayer domains with twistingangles in the vicinity of θc. Full spectra including the R, G, and 2Dbands are shown in the Supporting Information. On the basis of the Rpeak position, we determine that the twisting angle θ varies from ∼11to ∼14°. In panel (c), the gray vertical bars highlight X and (ZO′)Lmodes. The squares and asterisks highlight ZA and (ZO′)H modes,respectively. All spectra are excited by a 532 nm laser excitation.
Nano Letters Letter
dx.doi.org/10.1021/nl4013387 | Nano Lett. 2013, 13, 3594−36013596

wavevector q that depends only on the twisting angle θ.10,13
The frequency−wavevector relation for these phonons overlapswith the SLG and the ZO′ (layer breathing mode asschematically shown in Figure 4b) phonon dispersion curvesof Bernal-stacked BLG.13 Figure 5 shows low-frequency (below200 cm−1) phonon dispersion.Figure 2b,c shows original and background-subtracted low-
energy Raman spectra from several different bilayer domains.From the R, G, and 2D Raman characteristics (spectra areshown in the Supporting Information), we determined that thetwisting angles θ of these bilayer domains range from ∼11(<θc) to ∼14° (>θc). Two modes highlighted by asterisks andsquares are observed between 130 and 180 cm−1 (see Figure2b,c). The frequencies of these two modes blueshift monotoni-cally with the increase of the twisting angle θ and agree wellwith those reported in ref 13. Hence, these modes highlightedby asterisks and squares are attributed to fundamental layerbreathing (ZO′) and out-of-plane acoustic (ZA) modes,respectively.13 They are activated by the superlattice (Moirepattern) formed in tBLG.10 The momentum conservationcondition is satisfied by the participation of superlatticewavevector q (see Figure 4a). The magnitudes of the scatteredphonons thus equal that of the superlattice wavevector q, whichdepends on the twisting angle θ and is about 0.65/0.54 Å−1 fora twisting angle near θc (≈12°/10°) for 532/633 nm laserexcitation. The points circled in Figure 5 show the frequenciesand wavevectors of these ZO′ and ZA phonons activated by thetBLG superlattice as observed in our work.Figure 2b,c shows that in addition to the modes between 130
and 180 cm−1 two even lower frequency modes are observed.The lowest observed frequency mode (labeled “X”) occurs at∼52 cm−1. The next higher frequency mode is observed at ∼94cm−1, which is close to the frequency of the ZO′ modecalculated for and inferred from the observed overtone (2ZO′)in Bernal-stacked bilayer graphene.15,22,23 Hence, we assign thismode to another fundamental layer breathing mode ZO′ whosephonon wavevector q′ is different from the superlatticewavevector q. Because this ZO′ frequency is lower than thatinduced by the superlattice, we name this ZO′ at 94 cm−1 as(ZO′)L and the ZO′ at higher energy of above 100 cm−1 as(ZO′)H.It has been shown by Kim et al. that the integrated intensity
of the 2D Raman peak of tBLG increases monotonically withthe twisting angle θ in the vicinity of θc.
4 Their studies wereconducted on suspended tBLG by consecutively transferringtwo SLG on a carbon TEM grid where the effects due to thesubstrates (e.g., doping) are minimized. The same relationbetween 2D Raman integrated intensity and twisting angle isalso observed in our samples (see Figures S2−S4 in theSupporting Information). This suggests it is reasonable to usethe integrated intensity of the 2D peak to characterize thetwisting angle of our samples. Therefore, we summarize ourmeasurements of the (ZO′)L mode by plotting the position,bandwidth, and integrated intensities of this mode as a functionof normalized 2D Raman intensity (I2D, normalized to theintensity of SLG, i.e., take the ratio of 2D integrated intensity ofBLG to that of the SLG on the sample). Because the G-peakposition is sensitive to doping,8,24 we also plot the G-peakfrequency as a function of normalized I2D. The G-peakfrequency vs normalized I2D plot (see Supporting Information)is very similar to that obtained in suspended tBLG samplesreported by Kim et al.4 This further confirms that doping by thesubstrate is not a major concern in our studies of the low
energy modes as a function of twisting angle. By comparing theRaman spectra of our SLG domains on the same substrate withprevious Raman studies of strained graphene,25,26 we confirmthat strain is not substantial in our samples.Figure 3a,b displays the evolution of frequency and full width
at half-maximum (fwhm) of the (ZO′)L mode as a function of
normalized I2D. The range from 1.1 to 2.2 of the normalized I2Dcorresponds to a range of twisting angle θ from ∼10 to ∼15°. Itis seen that the frequency of this (ZO′)L mode (ω(ZO′)L)increases with increasing normalized I2D when the normalizedI2D is below 1.5 (or when θ < 12°).4 The frequency ω(ZO′)Lbecomes almost constant after the normalized I2D is greaterthan 1.5 (or when θ > 12°). Figure 3b shows that the fwhm ofthe (ZO′)L mode decreases with increasing normalized I2Dwhen it is below 1.5 (θ < 12°) and that it also becomes nearlyconstant when the normalized I2D is greater than 1.5 (θ > 12°).These results indicate that the dramatic transitions in thefrequency and fwhm of the (ZO′)L mode occur when thetwisting angle θ is near θc. In order to confirm thecharacteristics of the (ZO′)L mode, we also plot (seeSupporting Information) the position and width of this peakas a function of the R mode frequency that decreasesmonotonically with θ.13 Similar trends as those plotted as afunction of normalized I2D are observed.The coexistence of two ZO′ phonons with different
wavevectors is a novel phenomenon. Because the (ZO′)Hphonon’s wavevector is defined by the tBLG superlattice, thefundamental (ZO′)L mode that we observe for the first time inRaman scattering from tBLG must be activated by a differentwavevector that satisfies the momentum conservation require-
Figure 3. (a−c) Frequency, fwhm, and integrated intensity of the(ZO′)L mode as a function of normalized I2D, respectively. Thenormalized I2D is defined as the ratio of the integrated 2D intensity ofeach bilayer domain to that of a single layer. The data are measuredfrom a series of tBLG domains with twisting angle θ ranging from ∼10to ∼15°, which corresponds to normalized I2D ranging from 1.1−2.2.(d,e) Background intensity at 70 cm−1 (see Figure 2a and its caption)and integrated intensity of the G peak as a function of the normalizedI2D, respectively. The horizontal lines in these two panels show therespective values of a single layer. The thick curves in each panel areguides to the eye. All results are obtained using a 532 nm laserexcitation.
Nano Letters Letter
dx.doi.org/10.1021/nl4013387 | Nano Lett. 2013, 13, 3594−36013597
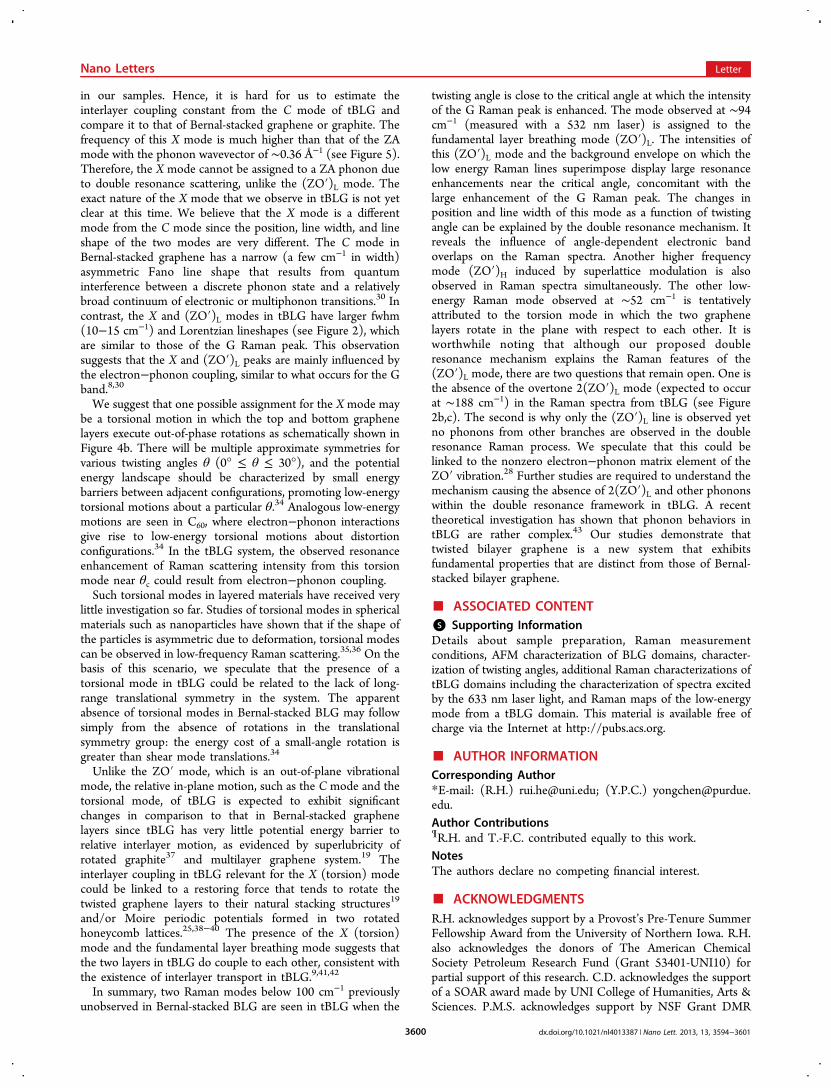
ment. We propose that the (ZO′)L mode at ∼94 cm−1 isfacilitated by the tBLG crystal lattice that lacks translationalsymmetry. The Raman process for this (ZO′)L phonon is anintravalley scattering process15,23 and involves four steps (seeFigure 4c−e): (i) the incident photon creates an electron−holepair; (ii) the electron/hole is scattered by a tBLG crystal lattice(shown by the dashed arrow which provides a momentum q′);(iii) the electron/hole is scattered by a phonon with wavevectork(ZO′)L; and (iv) electron−hole recombination. In k-space, theDirac cones from top and bottom graphene layers (located atKa and Kb) are separated from each other by a distance thatdepends on the twisting angle θ (see Figure 4a).4,10 The largerthe θ, the more separated the Ka and Kb points, and thus moredistant the two Dirac cones are. When θ = θc (see Figure 4d),the incident photon energy ℏωin equals the energy differencebetween the conduction and valence van Hove singularities.4,5
Because tBLG maintains linear electronic dispersion of SLG,that is, E = ℏνFk, where the Fermi velocity vF ≈ 1 × 10⁶ m/sand E = 2.33 eV for a 532 nm photon, we can estimate themagnitude of the phonon wavevector k(ZO′)L = q′ = 0.36 Å−1
under 532 nm laser excitation. In this case, the magnitude ofk(ZO′)L or q′ is roughly half of the superlattice wavevector q andequals the distance between Ka and Kb (as shown in Figure4a,d). The observed phonon frequency (94 cm−1) and thephonon wavevector k(ZO′)L are in excellent agreement with the
ZO′ phonon dispersion in Bernal-stacked BLG (see the twouncircled points in Figure 5 for 532 and 633 nm laserexcitations),23,27−29 which confirms our assignment of thismode to the layer breathing mode (ZO′)L. It is worthwhilenoting that momentum conservation in the Raman process isachieved through an intermediate step shown by the dashed
arrow in Figure 4d. It is unlikely that this step is due to defect-induced scattering since the Raman intensity of the D band isreasonably weak in our samples (see the full Raman spectra inFigure 2a and in the Supporting Information). Therefore, thisintermediate step is likely due to scattering of electrons by thetBLG crystal lattice, which lacks long-range periodicity (latticetranslational symmetry).10,19 This activation process isconfirmed by the absence of the fundamental (ZO′)L modeRaman scattering from Bernal-stacked BLG that has long-range
Figure 4. (a) The first Brillouin zone in the electronic band structure of tBLG with twisting angle θ. Ka and K′a are two adjacent Dirac points of thefirst graphene layer. Kb and K′b are the two adjacent Dirac points of the second layer. q is the wavevector of the tBLG superlattice (Moire pattern).(b) Schematic drawings of motions of atoms in the layer breathing (ZO′) and torsion (X) modes. (c−e) Schematic drawings of Raman processes of(ZO′)L phonon when θ is less, equal to, or greater than the critical angle θc, respectively. ℏωin is the incident photon energy. ℏωout is the scatteredphoton energy. ℏω(ZO′)L is the phonon energy. The dashed arrows show the scattering of electrons by the tBLG crystal lattice. This scattering is
elastic and is characterized by the wavevector q′. k(ZO′)L is the wavevector of the (ZO′)L phonon. The portions of the two Dirac cones (at Diracpoints Ka and Kb) that overlap are shown in blue.
Figure 5. Low-frequency phonon dispersion. Different phononbranches are labeled. While the dispersion curves shown werecalculated for SLG and Bernal-stacked bilayer graphene,13 they areexpected to be similar for tBLG for the relevant modes studied here.All points are determined by Raman measurements in this work.Points determined by a 532 nm laser excitation are shown in green,and those determined from a 633 nm laser excitation are shown in red.
Nano Letters Letter
dx.doi.org/10.1021/nl4013387 | Nano Lett. 2013, 13, 3594−36013598

lattice translational symmetries.15,23,30 In Bernal-stacked BLGin which scattering due to tBLG crystal lattice is absent, thesecond-order (2ZO′) mode in which momentum conservationis satisfied by involving two ZO′ phonons with oppositewavevectors, displays strong Raman intensity.15 In addition, this(ZO′)L phonon in tBLG softens under 633 nm laser excitation(see Supporting Information), which further confirms that thisphonon has a nonzero wavevector and that the scatteringprocess can be explained by the double resonance mechanism.When θ < θc, the two Dirac cones have substantial overlap.
The Raman process accesses the overlapped area (involvingboth Dirac cones at locations Ka and Kb) and allows phononswith wavevector k(ZO′)L less than 0.36 Å−1 to contribute to theRaman spectra (see Figure 4c). In this framework, the fwhm ofthis (ZO′)L mode will increase as θ decreases (as the area ofoverlapped Dirac cones increases), which is supported by ourobservation shown in Figure 3b. In addition, the frequency ofthis (ZO′)L mode should reduce slightly as the twisting angle θdecreases away from θc as the overlapped Dirac cones enable(ZO′)L phonon with wavevector k(ZO′)L less than 0.36 Å−1 tocontribute to the Raman spectra, which would lower thephonon energy (based on the ZO′ phonon dispersionpredicted in BLG23,27−29). Our observation of (ZO′)L phononsoftening and broadening for θ < θc (see Figure 3a,b) confirmsthis interpretation and shows that the phonon wavectors k(ZO′)L(or q′) is not uniquely defined by the twisting angle θ. For θ <θc, k(ZO′)L and q′ can have multiple values depending on thedegree of overlap of the two Dirac cones (see Figure 4(c)).This is very different from the superlattice wavevector q that issolely determined by the twisting angle θ.For θ > θc, the Raman process does not access overlapped
Dirac cones (see Figure 4(e)). Even if the area of Dirac coneoverlap decreases as θ increases, it should not affect the (ZO′)Lphonon wavevector involved in the Raman process. This agreeswell with our observation that the frequency and fwhm of the(ZO′)L mode remain unchanged when the twisting angle θ isgreater than θc, as shown in Figure 3a,b. These results indicatethat the (ZO′)L phonon is not very sensitive to the twisting ofthe two graphene layers for θ ≥ θc. This feature of the (ZO′)Lmode is very different from that of the (ZO′)H and otherRaman modes, for example, R and R′, whose frequencies varymonotonically with the twisting angle θ and are sensitive to θfor both θ > θc and θ < θc.
13 This difference indicates that the(ZO′)L mode does have a different Raman scatteringmechanism from those phonons which are activated by thetBLG superlattice. The double resonance mechanism that weproposed above qualitatively explains the characteristics of the(ZO′)L mode as a function of θ.The tBLG system allows us to probe the dispersion of the
layer breathing mode ZO′ in a broad range off the Brilluoinzone center (see Figure 5). Our measurements show that thedispersion of the ZO′ mode in tBLG is similar to that of Bernal-stacked BLG,15 which indicates that the interlayer out-of-planevibrations of tBLG are comparable to those of Bernal-stackedBLG for θ ∼ θc, consistent with the calculation shown in ref 31.The emergence of this fundamental layer breathing (ZO′)vibration in the twisted BLG system (known to be silent inBernal-stacked BLG and graphite14) implies that the crystalsymmetry that makes the ZO′ silent in Bernal-stacked BLG islifted in tBLG.Figure 3c displays the change of integrated intensity of the
(ZO′)L mode as a function of normalized I2D (and thus as a
function of θ). It is seen that the (ZO′)L mode intensity isstrongly enhanced when the normalized I2D is ∼1.6, consistentwith the critical value of 1.5 found in the changes in thefrequency (Figure 3a) and fwhm (Figure 3b) of this mode. Thenormalized I2D of ∼1.6 corresponds to a twisting angle θ ≈12.5°, which agrees well with the value of θc.
5 This observationindicates that the Raman intensity of the (ZO′)L phonondisplays large resonance enhancement at θc, where the intensityof the G Raman peak is also enhanced (see Figure 3e and refs 4and 5). Our observation suggests that the (ZO′)L and the Gmodes share the same resonance enhancement mechanismarising from van Hove singularities in the DOS in the tBLGsystem.4,5 The ratio of integrated intensities of the (ZO′)L andG peaks reaches a maximum value of ∼7% at resonance. It isvery impressive that when θ overlaps θc the intensity of the(ZO′)L peak is comparable to that of the G band (offresonance), and that it is much stronger than the intensities ofZA, (ZO′)H, R, and R′ peaks, as shown in Figure 2. Thisdifference in resonance enhancement between the (ZO′)L andother modes further confirms that the Raman scatteringmechanisms of these modes are different. The (ZO′)L modethat involves optical transitions between the conduction andvalence van Hove singularities (see Figure 4d) are stronglyenhanced, whereas the ZA, (ZO′)H, R, and R′ modes due tosuperlattice scattering are not subject to the same enhance-ment. When θ differs from θc significantly (θ < 10° or >15°),this (ZO′)L mode is not observed, likely due to its intensitybecoming too weak to be detected.Another striking feature of the θ-dependent Raman spectra
from tBLG is the large enhancement of the backgroundintensity of low energy Raman modes at the critical twistingangle θc. The background envelope on which the low-energyRaman lines superimpose (as highlighted by dashed lines inFigure 2b) is steepest for θ ∼ θc. We define the height intensityof this background envelope at 70 cm−1 as the low-energybackground intensity (as illustrated by the vertical arrow for thespectrum with θ ∼ 12° in Figure 2a). Figure 3d shows thechange of this low-energy background intensity as a function ofthe normalized I2D (and thus as a function of θ). It is seen thatthis low-energy background intensity also reaches maximum atθc (when the normalized I2D is ∼1.6), similar to the resonanceenhancements of the (ZO′)L and G Raman peaks. We speculatethat this broad low-energy background envelope, which isstrongly enhanced at the critical angle θc, could be related toelectronic excitations such as plasmons in tBLG.32,33 Furtherinvestigations are needed to understand the origin of thisenhanced low energy background.Figure 2 shows that in addition to the two ZO′ modes and
ZA mode, an even lower energy mode around 52 cm−1 (Xmode) is observed for θ ∼ θc. This “X” mode appears to exhibitsimilar resonance enhancement as the (ZO′)L and G modes donear the critical twisting angle θc and may be too weak to beseen when θ is off θc. Like the two ZO′ modes, this X mode isalso only observed in tBLG and is not observed in Bernal-stacked BLG.30 On the other hand, previous experiments onBernal-stacked BLG observed a shear mode (i.e., the C mode,occurring at ∼31 cm−1) that originates from the relative in-plane sliding of the two graphene layers.30 An interlayercoupling strength of ∼12.8 × 10¹⁸ Nm−3 is estimated from theposition of the C mode in Bernal-stacked graphene layers.30 Inour measurements of tBLG, the rising background below 50cm−1 (see Figure 2a,b) makes it very challenging to resolve andinvestigate the C mode (usually very weak in bilayer graphene)
Nano Letters Letter
dx.doi.org/10.1021/nl4013387 | Nano Lett. 2013, 13, 3594−36013599
in our samples. Hence, it is hard for us to estimate theinterlayer coupling constant from the C mode of tBLG andcompare it to that of Bernal-stacked graphene or graphite. Thefrequency of this X mode is much higher than that of the ZAmode with the phonon wavevector of ∼0.36 Å−1 (see Figure 5).Therefore, the X mode cannot be assigned to a ZA phonon dueto double resonance scattering, unlike the (ZO′)L mode. Theexact nature of the X mode that we observe in tBLG is not yetclear at this time. We believe that the X mode is a differentmode from the C mode since the position, line width, and lineshape of the two modes are very different. The C mode inBernal-stacked graphene has a narrow (a few cm−1 in width)asymmetric Fano line shape that results from quantuminterference between a discrete phonon state and a relativelybroad continuum of electronic or multiphonon transitions.30 Incontrast, the X and (ZO′)L modes in tBLG have larger fwhm(10−15 cm−1) and Lorentzian lineshapes (see Figure 2), whichare similar to those of the G Raman peak. This observationsuggests that the X and (ZO′)L peaks are mainly influenced bythe electron−phonon coupling, similar to what occurs for the Gband.8,30
We suggest that one possible assignment for the X mode maybe a torsional motion in which the top and bottom graphenelayers execute out-of-phase rotations as schematically shown inFigure 4b. There will be multiple approximate symmetries forvarious twisting angles θ (0° ≤ θ ≤ 30°), and the potentialenergy landscape should be characterized by small energybarriers between adjacent configurations, promoting low-energytorsional motions about a particular θ.34 Analogous low-energymotions are seen in C60, where electron−phonon interactionsgive rise to low-energy torsional motions about distortionconfigurations.34 In the tBLG system, the observed resonanceenhancement of Raman scattering intensity from this torsionmode near θc could result from electron−phonon coupling.Such torsional modes in layered materials have received very
little investigation so far. Studies of torsional modes in sphericalmaterials such as nanoparticles have shown that if the shape ofthe particles is asymmetric due to deformation, torsional modescan be observed in low-frequency Raman scattering.35,36 On thebasis of this scenario, we speculate that the presence of atorsional mode in tBLG could be related to the lack of long-range translational symmetry in the system. The apparentabsence of torsional modes in Bernal-stacked BLG may followsimply from the absence of rotations in the translationalsymmetry group: the energy cost of a small-angle rotation isgreater than shear mode translations.34
Unlike the ZO′ mode, which is an out-of-plane vibrationalmode, the relative in-plane motion, such as the C mode and thetorsional mode, of tBLG is expected to exhibit significantchanges in comparison to that in Bernal-stacked graphenelayers since tBLG has very little potential energy barrier torelative interlayer motion, as evidenced by superlubricity ofrotated graphite37 and multilayer graphene system.19 Theinterlayer coupling in tBLG relevant for the X (torsion) modecould be linked to a restoring force that tends to rotate thetwisted graphene layers to their natural stacking structures19
and/or Moire periodic potentials formed in two rotatedhoneycomb lattices.25,38−40 The presence of the X (torsion)mode and the fundamental layer breathing mode suggests thatthe two layers in tBLG do couple to each other, consistent withthe existence of interlayer transport in tBLG.9,41,42
In summary, two Raman modes below 100 cm−1 previouslyunobserved in Bernal-stacked BLG are seen in tBLG when the
twisting angle is close to the critical angle at which the intensityof the G Raman peak is enhanced. The mode observed at ∼94cm−1 (measured with a 532 nm laser) is assigned to thefundamental layer breathing mode (ZO′)L. The intensities ofthis (ZO′)L mode and the background envelope on which thelow energy Raman lines superimpose display large resonanceenhancements near the critical angle, concomitant with thelarge enhancement of the G Raman peak. The changes inposition and line width of this mode as a function of twistingangle can be explained by the double resonance mechanism. Itreveals the influence of angle-dependent electronic bandoverlaps on the Raman spectra. Another higher frequencymode (ZO′)H induced by superlattice modulation is alsoobserved in Raman spectra simultaneously. The other low-energy Raman mode observed at ∼52 cm−1 is tentativelyattributed to the torsion mode in which the two graphenelayers rotate in the plane with respect to each other. It isworthwhile noting that although our proposed doubleresonance mechanism explains the Raman features of the(ZO′)L mode, there are two questions that remain open. One isthe absence of the overtone 2(ZO′)L mode (expected to occurat ∼188 cm−1) in the Raman spectra from tBLG (see Figure2b,c). The second is why only the (ZO′)L line is observed yetno phonons from other branches are observed in the doubleresonance Raman process. We speculate that this could belinked to the nonzero electron−phonon matrix element of theZO′ vibration.28 Further studies are required to understand themechanism causing the absence of 2(ZO′)L and other phononswithin the double resonance framework in tBLG. A recenttheoretical investigation has shown that phonon behaviors intBLG are rather complex.43 Our studies demonstrate thattwisted bilayer graphene is a new system that exhibitsfundamental properties that are distinct from those of Bernal-stacked bilayer graphene.
■ ASSOCIATED CONTENT*S Supporting InformationDetails about sample preparation, Raman measurementconditions, AFM characterization of BLG domains, character-ization of twisting angles, additional Raman characterizations oftBLG domains including the characterization of spectra excitedby the 633 nm laser light, and Raman maps of the low-energymode from a tBLG domain. This material is available free ofcharge via the Internet at http://pubs.acs.org.
■ AUTHOR INFORMATIONCorresponding Author*E-mail: (R.H.) [email protected]; (Y.P.C.) [email protected] Contributions¶R.H. and T.-F.C. contributed equally to this work.NotesThe authors declare no competing financial interest.
■ ACKNOWLEDGMENTSR.H. acknowledges support by a Provost’s Pre-Tenure SummerFellowship Award from the University of Northern Iowa. R.H.also acknowledges the donors of The American ChemicalSociety Petroleum Research Fund (Grant 53401-UNI10) forpartial support of this research. C.D. acknowledges the supportof a SOAR award made by UNI College of Humanities, Arts &Sciences. P.M.S. acknowledges support by NSF Grant DMR
Nano Letters Letter
dx.doi.org/10.1021/nl4013387 | Nano Lett. 2013, 13, 3594−36013600

1206530. J.M.B. acknowledges the support from NationalScience Foundation (ECCS-1240510 and DMR-0907336) andthe Robert A Welch Foundation (E-1728). Y.P.C. thanks A. C.Ferrari and M.-Y. Chou for helpful discussion. Y.P.C.acknowledges partial supports from NSF, DTRA, and C. F.Day & Associates for the graphene synthesis and character-izations.
■ REFERENCES(1) Ho, Y. H.; Wu, J. Y.; Chiu, Y. H.; Wang, J.; Lin, M. F. Philos.Trans. R. Soc. London, Ser. A 2010, 368, 5445−5458.(2) Novoselov, K. S.; McCann, E.; Morozov, S. V.; Fal’ko, V. I.;Katsnelson, M. I.; Zeitler, U.; Jiang, D.; Schedin, F.; Geim, A. K. Nat.Phys. 2006, 2, 177−180.(3) Zhang, Y. B.; Tang, T. T.; Girit, C.; Hao, Z.; Martin, M. C.; Zettl,A.; Crommie, M. F.; Shen, Y. R.; Wang, F. Nature 2009, 459, 820−823.(4) Kim, K.; Coh, S.; Tan, L. Z.; Regan, W.; Yuk, J. M.; Chatterjee,E.; Crommie, M. F.; Cohen, M. L.; Louie, S. G.; Zettl, A. Phys. Rev.Lett. 2012, 108, 246103.(5) Havener, R. W.; Zhuang, H. L.; Brown, L.; Hennig, R. G.; Park, J.Nano Lett. 2012, 12, 3162−3167.(6) Wang, Y. Y.; Ni, Z. H.; Liu, L.; Liu, Y. H.; Cong, C. X.; Yu, T.;Wang, X. J.; Shen, D. Z.; Shen, Z. X. ACS Nano 2010, 4, 4074−4080.(7) Robinson, J. T.; Schmucker, S. W.; Diaconescu, C. B.; Long, J. P.;Culbertson, J. C.; Ohta, T.; Friedman, A. L.; Beechem, T. E. ACS Nano2013, 7, 637−644.(8) Yan, J.; Henriksen, E. A.; Kim, P.; Pinczuk, A. Phys. Rev. Lett.2008, 101, 136804.(9) Perebeinos, V.; Tersoff, J.; Avouris, P. Phys. Rev. Lett. 2012, 109,236604.(10) Carozo, V.; Almeida, C. M.; Ferreira, E. H. M.; Cancado, L. G.;Achete, C. A.; Jorio, A. Nano Lett. 2011, 11, 4527−4534.(11) Gupta, A. K.; Tang, Y. J.; Crespi, V. H.; Eklund, P. C. Phys. Rev.B 2010, 82, 241406.(12) Righi, A.; Costa, S. D.; Chacham, H.; Fantini, C.; Venezuela, P.;Magnuson, C.; Colombo, L.; Bacsa, W. S.; Ruoff, R. S.; Pimenta, M. A.Phys. Rev. B 2011, 84, 241409.(13) Campos-Delgado, J.; Canca̧do, L. G.; Achete, C. A.; Jorio, A.;Raskin, J.-P. Nano Res. 2013, 6, 269−274.(14) Ferrari, A. C.; Basko, D. M. Nat. Nanotechnol. 2013, 8, 235−46.(15) Lui, C. H.; Heinz, T. F. Phys. Rev. B 2013, 87, 121404.(16) Wu, W.; Jauregui, L. A.; Su, Z. H.; Liu, Z. H.; Bao, J. M.; Chen,Y. P.; Yu, Q. K. Adv. Mater. 2011, 23, 4898−4903.(17) Yu, Q. K.; Jauregui, L. A.; Wu, W.; Colby, R.; Tian, J. F.; Su, Z.H.; Cao, H. L.; Liu, Z. H.; Pandey, D.; Wei, D. G.; Chung, T. F.; Peng,P.; Guisinger, N. P.; Stach, E. A.; Bao, J. M.; Pei, S. S.; Chen, Y. P. Nat.Mater. 2011, 10, 443−449.(18) Wang, Y.; Su, Z.; Wu, W.; Nie, S.; Xie, N.; Gong, H.; Guo, Y.;Lee, J. H.; Xing, S.; Lu, X.; Wang, H.; Lu, X.; McCarty, K.; Pei, S.-S.;Robles-Hernandez, F.; Hadjiev, V. G.; Bao, J. arXiv 2013, 1301, 4488http://arxiv.org/abs/1301.4488, (accessed Jan 18, 2013).(19) Brown, L.; Hovden, R.; Huang, P.; Wojcik, M.; Muller, D. A.;Park, J. Nano Lett. 2012, 12, 1609−1615.(20) Yan, K.; Peng, H. L.; Zhou, Y.; Li, H.; Liu, Z. F. Nano Lett. 2011,11, 1106−1110.(21) Kalbac, M.; Frank, O.; Kong, J.; Sanchez-Yamagishi, J.;Watanabe, K.; Taniguchi, T.; Jarillo-Herrero, P.; Dresselhaus, M. S.J. Phys. Chem. Lett. 2012, 3, 796−799.(22) Araujo, P. T.; Mafra, D. L.; Sato, K.; Saito, R.; Kong, J.;Dresselhaus, M. S. Sci. Rep. 2012, 2, 1017.(23) Lui, C. H.; Malard, L. M.; Kim, S.; Lantz, G.; Laverge, F. E.;Saito, R.; Heinz, T. F. Nano Lett. 2012, 12, 5539−5544.(24) Das, A.; Pisana, S.; Chakraborty, B.; Piscanec, S.; Saha, S. K.;Waghmare, U. V.; Novoselov, K. S.; Krishnamurthy, H. R.; Geim, A.K.; Ferrari, A. C.; Sood, A. K. Nat. Nanotechnol. 2008, 3, 210−215.(25) He, R.; Zhao, L. Y.; Petrone, N.; Kim, K. S.; Roth, M.; Hone, J.;Kim, P.; Pasupathy, A.; Pinczuk, A. Nano Lett. 2012, 12, 2408−2413.
(26) Huang, M. Y.; Yan, H. G.; Chen, C. Y.; Song, D. H.; Heinz, T.F.; Hone, J. Proc. Natl. Acad. Sci. U.S.A. 2009, 106, 7304−7308.(27) Borysenko, K. M.; Mullen, J. T.; Li, X.; Semenov, Y. G.; Zavada,J. M.; Nardelli, M. B.; Kim, K. W. Phys. Rev. B 2011, 83, 161402.(28) Sato, K.; Park, J. S.; Saito, R.; Cong, C. X.; Yu, T.; Lui, C. H.;Heinz, T. F.; Dresselhaus, G.; Dresselhaus, M. S. Phys. Rev. B 2011, 84,035419.(29) Yan, J. A.; Ruan, W. Y.; Chou, M. Y. Phys. Rev. B 2008, 77,125401.(30) Tan, P. H.; Han, W. P.; Zhao, W. J.; Wu, Z. H.; Chang, K.;Wang, H.; Wang, Y. F.; Bonini, N.; Marzari, N.; Pugno, N.; Savini, G.;Lombardo, A.; Ferrari, A. C. Nat. Mater. 2012, 11, 294−300.(31) Jiang, J. W.; Wang, B. S.; Rabczuk, T. Appl. Phys. Lett. 2012, 101,023113.(32) Grigorenko, A. N.; Polini, M.; Novoselov, K. S. Nat. Photonics2012, 6, 749−758.(33) Bostwick, A.; Speck, F.; Seyller, T.; Horn, K.; Polini, M.; Asgari,R.; MacDonald, A. H.; Rotenberg, E. Science 2010, 328, 999−1002.(34) Chancey, C. C.; O’Brien, M. C. M. The Jahn-Teller Effect in C60and other Icosahedral Complexes; Princeton University Press: Prince-ton, NJ, 1997.(35) Ovsyuk, N. N.; Novikov, V. N. Phys. Rev. B 1996, 53, 3113−3118.(36) Duval, E. Phys. Rev. B 1992, 46, 5795−5797.(37) Dienwiebel, M.; Verhoeven, G. S.; Pradeep, N.; Frenken, J. W.M.; Heimberg, J. A.; Zandbergen, H. W. Phys. Rev. Lett. 2004, 92,126101.(38) Ohta, T.; Robinson, J. T.; Feibelman, P. J.; Bostwick, A.;Rotenberg, E.; Beechem, T. E. Phys. Rev. Lett. 2012, 109, 186807.(39) Bistritzer, R.; MacDonald, A. H. Proc. Natl. Acad. Sci. U.S.A.2011, 108, 12233−12237.(40) Meng, L.; Chu, Z. D.; Zhang, Y. F.; Yang, J. Y.; Dou, R. F.; Nie,J. C.; He, L. Phys. Rev. B 2012, 85, 235453.(41) Lee, D. S.; Riedl, C.; Beringer, T.; Castro Neto, A. H.; vonKlitzing, K.; Starke, U.; Smet, J. H. Phys. Rev. Lett. 2011, 107, 216602.(42) Morell, E. S.; Vargas, P.; Chico, L.; Brey, L. Phys. Rev. B 2011,84, 195421.(43) Cocemasov, A. I.; Nika, D. L.; Balandin, A. A. Phys. Rev. B 2013,88, 035428.
Nano Letters Letter
dx.doi.org/10.1021/nl4013387 | Nano Lett. 2013, 13, 3594−36013601