obr coronavirus financial budget 2020 forecast scenario ... · coronavirus lockdown to deliver...
TRANSCRIPT

1
Commentary on the
OBR coronavirus reference scenario
14 April 2020
Coronavirus lockdown to deliver large (but hopefully temporary) shock to the economy and public finances
In addition to its impact on public
health, the coronavirus outbreak will
substantially raise public sector net
borrowing and debt, primarily reflecting
economic disruption. The Government’s
policy response will also have substantial
direct budgetary costs, but the measures
should help limit the long-term damage
to the economy and public finances –
the costs of inaction would certainly
have been higher. This note describes
one illustrative economic scenario and
its consequences for the public finances.
Deficit: Reference scenario versus Budget forecast
Key assumptions and results
• We do not attempt to predict how long the economic lockdown will last – that is a matter for the
Government, informed by medical advice. But, to illustrate some of the potential fiscal effects,
we assume a three-month lockdown due to public health restrictions followed by another three-
month period when they are partially lifted. For now, we assume no lasting economic hit.
• Real GDP falls 35 per cent in the second quarter, but bounces back quickly. Unemployment rises
by more than 2 million to 10 per cent in the second quarter, but then declines more slowly than
GDP recovers. Policy measures support households and companies’ finances through the shock.
• Public sector net borrowing increases by £218 billion in 2020-21 relative to our March Budget
forecast (to reach £273 billion or 14 per cent of GDP), before falling back close to forecast in
the medium term. That would be the largest single-year deficit since the Second World War.
• The sharp rise in borrowing this year largely reflects the impact of economic disruption on
receipts (with smaller effects from policy measures like the business rates holidays) and policy
measures that add to public spending (with smaller effects from higher unemployment).
• Public sector net debt rises sharply in 2020-21 thanks to lower GDP, higher borrowing and the
accounting consequences of the Bank of England’s policy measures. It surpasses 100 per cent of
GDP during the year, but ends it at 95 per cent (versus 77 per cent in the Budget forecast) as the
economy recovers. It remains 10 per cent of GDP above the Budget forecast in 2024-25.
0
5
10
15
2007-08 2010-11 2013-14 2016-17 2019-20 2022-23
Per
cen
t of
GD
P
Budget 2020 forecast
Reference scenario
Outturn
Financial crisis
Source: ONS, OBR
Scenariohorizon
2
Introduction
1.1 This note provides an initial exploration of the possible impact of the coronavirus outbreak
on the public finances. There are few relevant precedents to inform any assessment of the
outlook, which will in any case depend on how successful the public health measures are in
containing the outbreak. So this note should not be viewed as a central forecast of what is
most likely to happen. It is instead an illustrative scenario, based on particular assumptions
regarding the duration of the measures and their economic impact, that shines a light on
the channels through which the economic disruption and the Government’s policy response
are likely to affect the public finances. The duration and scale of the economic disruption
are both highly uncertain, but most – not all – the fiscal effects described here are broadly
scalable and provide a starting point for estimating outcomes under alternative scenarios.
1.2 To construct the scenario, we have made the following underlying assumptions:
• Public health measures result in a large share of economic activity ceasing for three
months, with the restrictions on people’s movement and activity assumed to be lifted
progressively over the subsequent three months. (But this should not be taken to imply
that this is or should be Government policy.) This is the main driver of a sharp fall in
GDP. For simplicity, the hit from the full lockdown is assumed to take place entirely in
the second quarter of 2020 rather than falling partly in March (as in practice). For
now, we have not assumed the shock has lasting economic consequences.
• Fiscal and monetary support measures offset little of the loss in GDP, but they do
mean that the associated loss in total hours worked is concentrated in average hours
per worker rather than lower employment and also that private sector incomes fall by
less than private sector output and expenditure. They will also help to limit the adverse
impact on potential output and thus future GDP once the crisis has passed.
• The consequences for the budget deficit and public debt have been estimated using
our established ready reckoners, adjusted where necessary to capture distinctive
features of this particular shock. We have also incorporated ballpark estimates of the
effects of the authorities’ fiscal and monetary policy measures.
1.3 We have characterised this exercise as a ‘reference’ scenario for two main reasons. First, we
intend to use it as a reference point against which to monitor incoming data and other
information. Second, the economic scenario plays a similar role in providing a baseline
against which to cost the Government’s policy response. (Our Budget forecast published on
11 March is clearly no longer relevant for either purpose.) But, as noted, the scenario
should not be taken as our view of the most likely path for the economy and public finances.
We are not yet in a position to form any such judgement, as we have no basis for knowing
how long the most stringent public health measures will remain in place. By the same token,
this should not be seen as a scenario around which risks are evenly balanced – the standard
criterion that we use for describing our forecasts as ‘central’. Again, we are not yet in a
position to form a judgement regarding the risks to either side of the scenario.

3
1.4 As discussed below, we compare the outlook for the economy and the public finances under
this scenario with that in our March Budget forecast. This shows a significant budgetary hit
both from the economic disruption and the direct cost of policy measures. But it should be
borne in mind that the short- and medium-term outlook for the economy and the public
finances would be very much worse without any fiscal and monetary response. The policy
actions that have been implemented will directly help to support the incomes of individuals
and businesses while the public health restrictions are in place, as well as improving the
availability of finance. They should also help to limit any long-term economic ‘scarring’ – for
example, due to cancelled business investment, widespread business failures and the
unemployed losing contact with the labour market. Such scarring would both harm future
living standards and increase the structural budget deficit.
1.5 Clearly, many other scenarios are possible. For now, we have confined ourselves to
presenting simple ready-reckoners showing the possible implications for the public finances
if the duration of the restrictions were longer or shorter. It is quite possible that at some
duration the marginal economic and fiscal consequences of the public health measures may
change, but at this stage we cannot say either when, or how significant, that might be.
1.6 We have focused on the short-term effects of the crisis in this note, but the medium-term
consequences will be important too. Public debt will be higher over the medium term than in
pre-coronavirus forecasts. But what matters for fiscal sustainability is what happens to the
structural primary (i.e. non-interest) budget deficit. If the policy measures that have been
implemented are successful in keeping businesses (and their employees) afloat until
economic normality returns, then the structural primary deficit might be expected to return to
something close to pre-crisis expectations. That said, if debt-servicing costs turn out to be
higher – which could be the case, depending on what happens to interest rates – then the
primary deficit would need to be smaller than previously thought sustainable. Of greater
consequence would be the impact of any longer-term economic scarring on the public
finances; the longer the economic disruption lasts, the greater such effects are likely to be.
1.7 The views expressed in this note are those of the OBR’s independent Budget Responsibility
Committee, but we are very grateful to our own staff and to those of other departments for
their input and hard work under very difficult circumstances. We have benefited from very
constructive engagement with Treasury officials and the Chairman of the OBR discussed the
findings of the analysis with the Chancellor of the Exchequer by phone on 7 April.
Context
Evidence from previous flu pandemics
1.8 To calibrate some of our assumptions we have drawn on the Resolution Foundation’s survey
of evidence from previous pandemics.1 The key insight is that most (perhaps 80 to 90 per
cent) of the short-term economic impact comes not from people falling ill, but rather from
the disruption to economic activity associated with the public health restrictions and social
1 Hughes, R., Safeguarding governments’ financial health during coronavirus: What can policymakers learn from past viral outbreaks? Resolution Foundation, March 2020.

4
distancing required to control the spread of the disease. Of course, the reason why most of
the short-term economic impact comes from these measures is that they are successful in
limiting the spread of the disease. If the measures were not stringent enough to control the
disease, then the economic impact from illness would be that much greater.
1.9 The differences between the effects on output of Spanish Flu, SARS and Ebola arose less
from differences in the severity of the disease (measured in either infection or mortality
rates) and more from differences in the severity of the measures taken to contain the disease
and the response of citizens to the perceived risks. In 2008, the World Bank published a
simulation of the potential economic impact of a pandemic flu similar to Spanish Flu, but
with a SARS-type public health and societal response.2 It concluded that just 12 per cent of
the total economic costs were likely to arise from higher mortality, while 28 per cent came
from higher levels of worker illness and absenteeism, and 60 per cent as a result of
voluntary or mandatory efforts by people to avoid infection. Given the relatively low
mortality rate from coronavirus, one would therefore expect the bulk of the economic effects
to stem from the public health measures taken to contain the outbreak.
1.10 As the Resolution Foundation notes, coronavirus-related public health restrictions have been
swifter, stricter, and more widespread than in response to any previous epidemic. It argued
that annual output losses should therefore be at least as big as the high single or double-
digit peak losses seen during Spanish Flu and Ebola rather than the much smaller ½ to 1
per cent losses in annual GDP experienced following the SARS outbreak.
External estimates of the economic impact of this outbreak
1.11 There is an increasing number of external estimates of the potential impact of the outbreak
on UK GDP. The most recent, which are more likely to reflect the latest restrictions on
economic activity, point to double-digit falls in GDP – consistent with our reference scenario.
But, not surprisingly, the range of estimates is large (Table 1.1). The French statistical
institute, INSEE, has estimated that the similar restrictions in place in France are likely to
reduce economic activity there by around 35 per cent.3 Similarly, the President of the
Federal Reserve Bank of St Louis produced a ‘rough initial estimate’ that US real GDP might
fall by up to 50 per cent during the period of full economic lockdown,4 while his staff have
published a ‘back-of-the-envelope’ estimate that the US unemployment rate could rise from
3½ per cent in February to 32 per cent by June.5
2 Brahmbhatt, M. and Dutta, A., On SARS-type Economic Effects during Infectious Disease Outbreaks, Policy Research Working Paper 4466, World Bank, January 2008. 3 INSEE, Point de conjoncture, 26 March 2020. 4 Bullard, J., Expected U.S. Macroeconomic Performance during the Pandemic Adjustment Period, 23 March 2020. 5 Faria e Castro, M., Back-of-the-Envelope Estimates of Next Quarter’s Unemployment Rate, 24 March 2020.

5
Table 1.1: Selected external estimates of GDP impact of coronavirus
1.12 The OECD has provided estimates of the initial impact of coronavirus containment
measures on GDP and household consumption for six major advanced economies
(including the UK), calculated by aggregating the conjectured impact on individual sectors
and expenditure categories. On average, they suggest that output could fall by around a
quarter and that consumer spending could fall by a third, with the corresponding figures for
the UK being 26 per cent and 37 per cent respectively (Chart 1.1).6
Chart 1.1: OECD estimates of initial GDP and private consumption losses
6 OECD, Evaluating the initial impact of COVID-19 containment measures on economic activity, 26 March 2020.
2020
(annual)
H1
2020
Q1
(Q-on-Q)
Q2
(Q-on-Q)KPMG (main scenario) (23 March) -2.6 -1.2 -2.1
KPMG (downside scenario) (23 March) -5.4 -1.6 -3.9
Morgan Stanley (23 March) -5.1
Bloomberg (4 weeks lockdown) (24 March) -0.7 -9
Bloomberg (6 weeks lockdown) (24 March) -14
Capital Economics (24 March) -15
OECD1 (26 March) -26
CEBR (30 March) -0.5 -15
OBR coronavirus reference scenario -13 -17 -35
Goldman Sachs (20 March) -24
Morgan Stanley (23 March) -30
OECD1 (26 March) -25
OECD1 (26 March) -26
INSEE2 (26 March) -35
2 Estimated loss of activity linked to lockdown measures (difference between estimated economic activity for the last week of March
and activity for a “normal” week).
US
Percentage change on previous period Percentage
change in
level
UK
France
1 The potential initial impact on activity of partial or complete shutdowns on activity.
-60
-50
-40
-30
-20
-10
0
US Canada France Germany Italy UK
Per ce
nt o
f G
DP
Other personal serv icesProfessional and real estate servicesHotels, restaurants and air travelRetail and wholesale tradeConstructionTransport manufacturingTotal
Source: OECD
-60
-50
-40
-30
-20
-10
0
US Canada France Germany Italy UK
Per ce
nt o
f pri
vate
consu
mption
Other personal serv icesArts and recreationHotels, restaurants and package holidaysClothing & footwearHousehold equipmentTransport expenditureTotal
GDP Private consumption

6
Recent UK economic indicators
1.13 The latest UK data have already turned sharply downwards. The UK composite purchasing
managers’ index (PMI) came in at a record low of 36.0 in March, down from 53.0 in
February. This is estimated to be consistent with GDP falling at a quarterly rate of 1½ to 2
per cent. However, the data were collected between 12 and 27 March, so largely before the
latest restrictions were imposed. A British Chambers of Commerce survey found that
revenues had fallen for around 75 per cent of firms in the week to the 27 March.
1.14 The Office for National Statistics (ONS) has launched a new business survey to assess the
impact of the coronavirus outbreak. The first results – for the period from 9 March to 22
March (before the Government imposed limitations on people’s movements and ordered
the closure of schools and non-essential shops) – showed almost half of firms reporting
lower than expected turnover, while a quarter had already reduced staffing levels.7 The
SMMT reported that new car registrations in March fell 44 per cent on a year earlier, but
that even more dramatic falls were witnessed in Italy (85 per cent), France (72 per cent) and
Spain (69 per cent), where full economic lockdowns were imposed earlier than in the UK.8
1.15 The surveys will no doubt fall further – the collapse in the Italian services PMI to just 17.4 in
March may be a foretaste of what is to come. But interpreting them is likely to be difficult,
because they are based on the proportion of firms reporting falling output, not the extent to
which output is falling in each firm. It will be especially difficult to capture the experience of
firms where output has fallen to zero. Consequently, applying historical metrics may give
misleading results when many businesses have suffered very large falls in activity.
1.16 DWP has reported that 950,000 new claims for universal credit were made between 16 and
31 March, suggesting that a sharp rise in unemployment has already taken place (although
some of these claims will also relate to people experiencing a temporary drop in income
without having lost their job or closed their business).
Economic scenario
1.17 We have constructed the economic side of our reference scenario by assessing the possible
impact of the public health measures on output in each sector of the economy and then
cross-checking this against an assessment of the possible impact on the expenditure
components of demand. To a first approximation, the fall in output is determined by the
assumed reduction in labour supply in each sector. Consistent with the World Bank
simulations, we assume that the public health restrictions are responsible for around 90 per
cent of the hit, rather than the direct effects from contracting the virus. So the depth and
duration of the fall in GDP is very largely determined by the length and coverage of these
restrictions (which will, of course, be influenced heavily by the progress of the disease itself).
7 ONS, Coronavirus, the UK economy and society, faster indicators, 2 April 2020. 8 SMMT, UK new car registrations fall -44.4% in March as coronavirus crisis hits market, 6 April 2020.
7
Real GDP
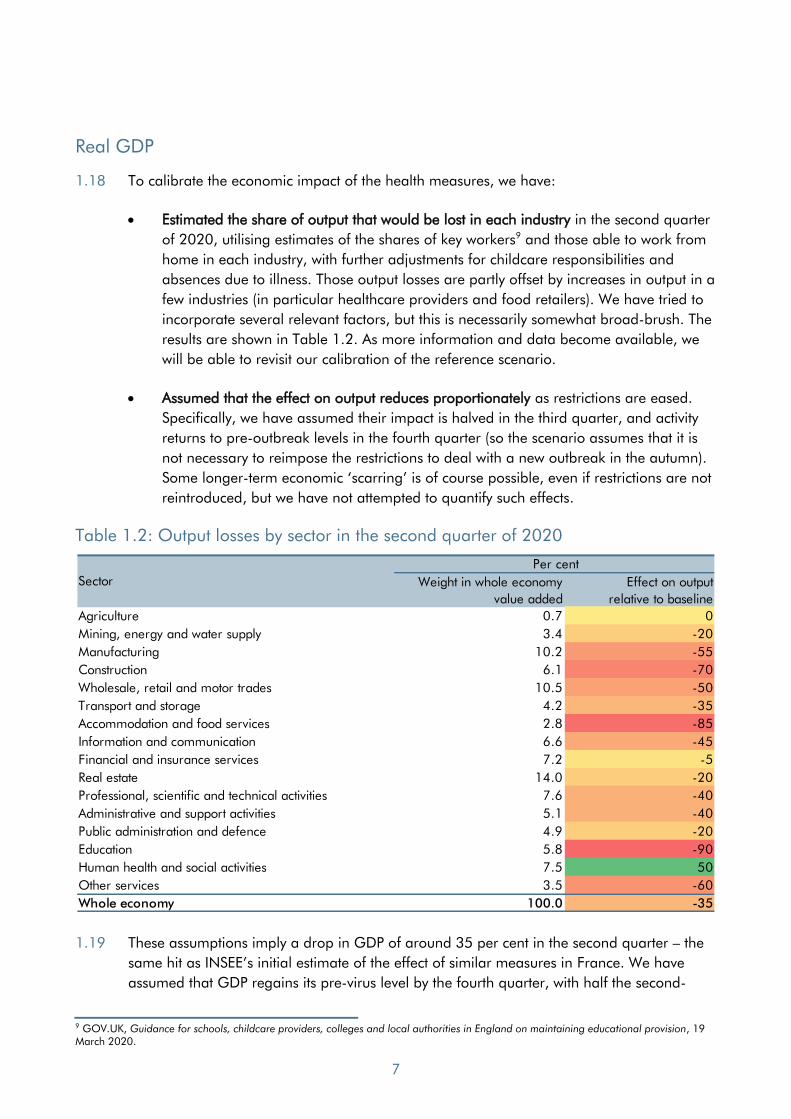
1.18 To calibrate the economic impact of the health measures, we have:
• Estimated the share of output that would be lost in each industry in the second quarter
of 2020, utilising estimates of the shares of key workers9 and those able to work from
home in each industry, with further adjustments for childcare responsibilities and
absences due to illness. Those output losses are partly offset by increases in output in a
few industries (in particular healthcare providers and food retailers). We have tried to
incorporate several relevant factors, but this is necessarily somewhat broad-brush. The
results are shown in Table 1.2. As more information and data become available, we
will be able to revisit our calibration of the reference scenario.
• Assumed that the effect on output reduces proportionately as restrictions are eased.
Specifically, we have assumed their impact is halved in the third quarter, and activity
returns to pre-outbreak levels in the fourth quarter (so the scenario assumes that it is
not necessary to reimpose the restrictions to deal with a new outbreak in the autumn).
Some longer-term economic ‘scarring’ is of course possible, even if restrictions are not
reintroduced, but we have not attempted to quantify such effects.
Table 1.2: Output losses by sector in the second quarter of 2020
1.19 These assumptions imply a drop in GDP of around 35 per cent in the second quarter – the
same hit as INSEE’s initial estimate of the effect of similar measures in France. We have
assumed that GDP regains its pre-virus level by the fourth quarter, with half the second-
9 GOV.UK, Guidance for schools, childcare providers, colleges and local authorities in England on maintaining educational provision, 19 March 2020.
Weight in whole economy
value added
Effect on output
relative to baseline
Agriculture 0.7 0
Mining, energy and water supply 3.4 -20
Manufacturing 10.2 -55
Construction 6.1 -70
Wholesale, retail and motor trades 10.5 -50
Transport and storage 4.2 -35
Accommodation and food services 2.8 -85
Information and communication 6.6 -45
Financial and insurance services 7.2 -5
Real estate 14.0 -20
Professional, scientific and technical activities 7.6 -40
Administrative and support activities 5.1 -40
Public administration and defence 4.9 -20
Education 5.8 -90
Human health and social activities 7.5 50
Other services 3.5 -60
Whole economy 100.0 -35
Per cent
Sector

8
quarter fall unwinding in the third quarter. (Arithmetically, this means that GDP grows by
around 25 per cent in the third quarter, and by around 20 per cent in the final quarter of
2020). The resulting 13 per cent fall in annual GDP in 2020 would comfortably exceed any
of the annual falls around the end of each world war or in the financial crisis (Chart 1.2).
Chart 1.2: GDP decline in historical perspective
1.20 It would not require particularly large changes to the highly uncertain assumptions about
prospects for individual sectors to alter the estimated fall in GDP significantly and it is quite
plausible that the impact could be materially smaller or larger than in our reference
scenario. However, for the purpose of evaluating the consequences of such outcomes, at
least as a first approximation, one can scale the scenario. So, for instance, if one wished to
assume a fall in GDP of 25 per cent rather than 35 per cent, in line with the recent OECD
analysis, but were willing to keep other aspects of the scenario (such as the duration of the
restrictions) unchanged, then other variables could in principle be scaled proportionately.
1.21 Since the GDP loss in effect hits immediately, this figuring in broad terms implies that each
month of full economic lockdown reduces monthly output by 35 per cent (relative to a
baseline with no restrictions) and therefore takes around 3 per cent off a full year’s real
GDP (assuming the restrictions continue to be unwound over three months).10 It is unlikely,
of course, that these effects would be entirely linear, but that would seem a reasonable
starting point for evaluating the economic consequences of a shorter or longer lockdown.
1.22 The ONS faces a huge challenge in capturing a sudden change in economic activity of this
magnitude in its measures of GDP. So early estimates may be more liable to revision than
usual and even mature ones may fail to capture the underlying reality as accurately as
10 This is not the same as saying it takes a further 3 percentage points off annual GDP growth, since arithmetically it matters when in the year that happens – but that is, of course, second order.
-15
-10
-5
0
5
10
15
20
25
1908 1918 1928 1938 1948 1958 1968 1978 1988 1998 2008 2018
Perc
enta
ge c
hange o
n a
year earl
ier
Budget 2020 forecast
Reference scenario
Outturn
Spanish flu WWII Financial crisis
Source: Bank of England, ONS, OBR
Scenario horizon
WWI

9
would normally be the case. It is also worth remembering that while we are trying here to
evaluate the potential fiscal consequences of the crisis based on illustrative assumptions
about its economic impact, the ONS’s mature outturn estimates of economic activity will in
part be guided by fiscal outturns like recorded tax receipts.
1.23 One extension of this work would be to quantify potential long-term supply impacts that
would lead to a more persistent effect on output. These would include the temporary period
of lower investment permanently lowering the capital stock and productivity, as well as the
consequence of significant numbers of business failures. To the extent that such effects
emerge, they would compound any pressures on fiscal sustainability.
Labour market
1.24 The sharp fall in GDP is accompanied by a steep rise in the unemployment rate to 10 per
cent in the second quarter, equivalent to an increase in unemployment of 2.1 million (to a
total of 3.4 million). As with GDP, the rise in unemployment is likely to be very fast, as the
sharp rise in new claims for UC already attests. Indeed, we might expect almost all the rise
to happen within the first month. The precise level of unemployment consistent with a 35 per
cent fall in GDP is of course hugely uncertain – and that is compounded by uncertainty over
the extent to which the coronavirus job retention scheme (CJRS) and self-employed income
support scheme (SEISS) will cushion the blow. We have assumed that these schemes result in
more of the fall in output being reflected in average hours worked than in fewer heads
employed. We have then assumed that the subsequent decline in unemployment lags the
rebound in GDP, with the initial recovery concentrated in the recall of furloughed workers.
Specifically, around a quarter of the rise in unemployment unwinds in each of the
subsequent two quarters, with the rest coming through gradually thereafter (Chart 1.3).
Chart 1.3: Real GDP and unemployment: reference scenario versus Budget forecast
1.25 Table 1.3 summarises the results of the economic scenario.
-40
-30
-20
-10
0
10
20
30
40
Q4 Q12019
Q2 Q3 Q4 Q12020
Q2 Q3 Q4 Q12021
Q2 Q3 Q4
Perc
enta
ge c
hange o
n a
quart
er earl
ier
Budget 2020 forecastReference scenario
Source: ONS, OBR
Scenario horizon
0
2
4
6
8
10
12
Q4 Q12019
Q2 Q3 Q4 Q12020
Q2 Q3 Q4 Q12021
Q2 Q3 Q4
Per ce
nt r
ate
Scenario horizon
Real GDP Unemployment

10
Table 1.3: Key economic variables: reference scenario versus Budget forecast
Macroeconomic policy response
1.26 The policy response by the Government and the Bank of England is likely to have only a
limited effect through the normal aggregate demand channels, as the fall in output is
largely the by-product of the impact of the health measures on the supply of, and demand
for, goods and services. In such circumstances, the impact of the policy response instead lies
mainly in moderating the impact of the fall in output on private sector incomes and in
preventing lasting damage to the economy’s supply capacity. Key actions include:
• Monetary and financial policy. The Bank of England has made several interventions,
including: lowering Bank Rate; additional gilt purchases; a reduction in the counter-
cyclical capital buffer; the introduction of a new Term Funding Scheme focused on
SMEs; and the introduction of a new Covid Corporate Financing Facility for larger
firms. These should facilitate the flow of finance to households, businesses and the
Government, and limit the adverse impact of the sharp near-term downturn on the
economy’s longer-term supply capacity by reducing business failures and job losses.
• Fiscal policy. The CJRS and SEISS are probably the most significant fiscal interventions,
potentially underwriting a significant fraction of private sector employment earnings
and thus supporting household incomes. Business rates holidays should also help
many firms to cover other fixed costs. Other fiscal measures – such as the business
interruption loan schemes – also help to limit business failures and job destruction.
2019 2020 2021 2022 2023 2024
Gross domestic product (GDP) 1.4 -12.8 17.9 1.5 1.3 1.4
GDP levels (2019=100) 100.0 87.2 102.8 104.3 105.7 107.1
CPI inflation 1.8 1.2 2.3 2.4 2.3 2.2
RPI inflation 2.6 1.8 2.9 3.4 3.2 3.0
Employment (millions) 32.8 31.8 32.3 33.0 33.3 33.4
Average earnings 2.8 -7.3 18.3 1.6 2.5 3.1
Unemployment (millions) 1.3 2.5 2.1 1.6 1.4 1.4
Unemployment rate (per cent) 3.8 7.3 6.0 4.5 4.0 4.1
Gross domestic product (GDP) -13.8 16.1 0.0 0.0 0.0
GDP levels (2019=100) -13.8 0.0 0.0 0.0 0.0
CPI inflation -0.2 0.5 0.4 0.2 0.1
RPI inflation -0.4 0.1 0.3 0.2 0.1
Employment (millions) -1.2 -0.8 -0.2 0.0 0.0
Average earnings -10.6 14.7 -1.8 -0.7 0.0
Unemployment (millions) 1.2 0.8 0.2 0.0 0.0
Unemployment rate (per cent) 3.5 2.2 0.6 0.0 0.0
Scenario horizon
Percentage change on a year earlier, unless otherwise stated
Differences from Budget 2020 forecast

11
1.27 The effect of the health and economic measures together is greatly to restrict consumption
and production, but to limit the associated falls in income (especially of households). Private
sector savings consequently rise, mirroring the large increase in public borrowing. Since all
the UK’s trading partners have been afflicted by coronavirus, we assume there is no effect
on the trade balance, though exports and imports are both likely to fall sharply.
Inflation
1.28 Despite the very sharp fall in GDP, we have assumed that the effect on inflation is modest,
reflecting several conflicting forces:
• The coronavirus shock reduces both demand and supply, but to varying degrees in
different markets. Some markets will be in a state of (possibly considerable) excess
supply, whereas others will be in a state of (possibly considerable) excess demand.
Consequently, there will be downward pressure on some prices and upward pressure
on others, but it is not at all clear which would dominate overall. Nor is it clear
whether prices would respond to such changes in the way that is usually assumed
given the nature of the disruption to economic activity. We have not therefore
incorporated any adjustment for the pressure of demand on inflation.
• While this is a global shock, sterling has also fallen significantly. This will increase
import prices – although the pass-through to consumer prices is likely to be limited,
and absorbed in firms’ margins, at least while the trading restrictions remain in place.
• Oil prices have fallen sharply, which will lower petrol prices. This reduces inflation this
year and raises it next year when we assume that they bounce back.
1.29 The net result of these effects is a temporary drop in CPI inflation to 0.7 per cent in the
second quarter of 2020, followed by a rise to 2.7 per cent a year later, which eases back
slowly towards the Bank of England’s 2 per cent target by the scenario horizon. RPI inflation
is also affected by lower mortgage interest payments and lower house prices.
Financial market assumptions
1.30 As in our Economic and fiscal outlook (EFO) forecasts, for the reference scenario we need to
make several conditioning assumptions about financial market variables. These are largely
drawn from the position in markets as of 31 March, plus assumptions about how far and
how fast they will return to previously assumed levels, if at all (Table 1.4). Specifically:
• Bank Rate. The market curve returns to 0.25 per cent during 2022-23 and remains
well below our March forecast assumption throughout the next five years.
• Equity prices are around 15 per cent lower in 2020-21 than assumed in our March
forecast, but return to the March forecast level over the following two years.
• The sterling oil price falls to £27 a barrel in 2020-21 (assuming it recovers from its
current level through the year) compared to £41 a barrel in our March forecast.

12
Table 1.4: Market-derived conditioning assumptions
Fiscal implications
1.31 The fiscal implications of the scenario sketched out above will reflect both the fiscal
consequences of the fall in activity and the costs of the policy measures being undertaken.
Our standard approach to quantifying such effects is to consider what would happen to the
economy absent any policy measures, then add on the direct cost of measures, and finally
incorporate any indirect effects on the public finances from their general economic impact.
That approach is unlikely to be fruitful in present circumstances, given the difficulty of
identifying what would have happened to economic activity had there been no policy
response at all. So instead we simply compare the fiscal outturns under the scenario with the
fiscal forecast that we published alongside the Chancellor’s Budget on 11 March.
1.32 For simplicity, and in line with our economic assumptions, we have assumed that the
implications for the public finances start to be felt from the beginning of 2020-21, whereas
clearly in some areas receipts and spending in 2019-20 will already have been affected.
1.33 The fiscal scenario results have been compiled using the established ready-reckoners that
underpin our Fiscal risks report stress tests and our EFO scenarios, with a handful of
adjustments to capture distinctive features of the current setting. There is of course
enormous uncertainty around these estimates, both in respect of the economic scenario itself
and because ready-reckoners are more suitable for considering the effects of small
departures from baseline assumptions rather than the large ones considered here. And
there are several issues that we have not yet explored – for example, the effect on local
authorities’ and public corporations’ finances and the costs associated with guarantees on
business interruption loans. We will address these issues for future updates.
1.34 Table 1.5 reports the high-level results for receipts, spending, borrowing and debt (which
should only be read as indicating the broad orders of magnitude involved):
• Receipts in 2020-21 are £130 billion (15 per cent) lower than assumed in the Budget,
falling 12 per cent relative to 2019-20. That compares with the 3.4 per cent fall
2019-20 2020-21 2021-22 2022-23 2023-24 2024-25
Bank Rate (per cent)
Budget 2020 forecast 0.75 0.75 0.75 0.75 0.75 0.75
Reference scenario 0.74 0.11 0.20 0.26 0.31 0.34
Difference -0.01 -0.64 -0.55 -0.49 -0.44 -0.41
Equity prices (FTSE All-share index)
Budget 2020 forecast 4065 4245 4408 4565 4718 4889
Reference scenario 3963 3587 4166 4524 4718 4889
Difference -102 -658 -242 -41 0 0
Sterling oil prices (£ per barrel)
Budget 2020 forecast 49.2 41.1 40.5 40.8 41.4 42.0
Reference scenario 48.0 26.5 36.9 43.0 44.8 45.4
Difference -1.2 -14.6 -3.7 2.2 3.4 3.4

13
between 2007-08 and 2009-10 as a result of the financial crisis and subsequent
recession. Relative to GDP, the fall is more modest because receipts and GDP are both
lower. Receipts rebound in 2021-22, returning to roughly the Budget forecast by
2024-25. In 2020-21, the hit is dominated by the consequences of the downturn. With
all but the cost of business rates holidays broadly scalable with the duration of the
shock, each additional month of full lockdown might add around a further £25 billion
to the deficit, with a similar reduction for each month if the lockdown were to be
shorter (assuming no change in the period over which the lockdown eases and
ignoring within-year timing effects associated with deferred tax payments).
• Spending in 2020-21 is £88 billion (9 per cent) higher than the Budget forecast, rising
15 per cent from 2019-20, matching the 15 per cent rise between 2007-08 and
2009-10. With spending up sharply and GDP down sharply, spending rises to 52 per
cent of GDP – comfortably its highest since the Second World War. Spending also falls
back in 2021-22 and returns to roughly the Budget forecast by 2024-25. The rise in
2020-21 is dominated by the cost of policy measures, with higher welfare spending
largely offset by lower debt interest costs (despite much higher borrowing). If a
material proportion of the policy costs were scalable with the period of disruption,
each additional month of full lockdown might add a further £10 to £20 billion. But
unlike receipts, this effect should not be pro-rated for shorter periods of lockdown
since the cost of some policy measures would not be reduced in those circumstances.
• Borrowing therefore rises to £273 billion (14 per cent of GDP) in 2020-21 – the
highest deficit since the Second World War, and well above the financial crisis peak.
That would be £218 billion higher than the Budget forecast, with policy measures
accounting for £100 billion of the rise. The deficit falls back quickly in 2021-22 as
temporary policy costs end and the economy recovers, returning to the Budget forecast
thereafter. Each additional month of lockdown might add £35 billion to £45 billion to
this figure, while each month less would reduce it by a somewhat smaller amount.
• Debt rises sharply in 2020-21. Higher cash debt reflects higher borrowing, but also
the Bank of England’s additional quantitative easing and the new Term Funding
Scheme. Debt at the end of 2020-21 is £384 billion higher than the Budget forecast.
GDP is also lower, but because the denominator in the debt-to-GDP ratio is – by ONS
convention – the sum of nominal GDP over the four quarters straddling the end of the
financial year, the sharp falls in GDP in the second and third quarters of 2020 affect
the denominator in 2019-20 rather than 2020-21. With activity assumed to return to
around its pre-crisis level by the fourth quarter of 2020, the denominator for debt at
the end of 2020-21 is virtually unchanged from the Budget forecast. So, the increase
in the debt-to-GDP ratio in 2020-21 is due to higher cash debt, taking it 17 per cent
of GDP higher than predicted at the Budget to 95 per cent of GDP. (The scenario
would be consistent with the debt-to-GDP ratio topping 100 per cent of GDP during
2020-21.) As the rise in the deficit is only temporary, absent Bank of England
interventions, debt remains relatively stable beyond 2020-21, albeit at a higher level.
This contrasts with the financial crisis, after which a large structural deficit persisted
and debt continued to rise as a share of GDP until 2016-17. By 2024-25, net debt is

14
10 per cent of GDP above the Budget forecast. This result is, of course, particularly
sensitive to the assumption that the economy returns swiftly to its pre-virus path rather
than to a persistently lower one as a result of economic scarring.
Table 1.5: Key fiscal aggregates: reference scenario versus Budget forecast
1.35 Charts 1.4 and 1.5 place the scenario results in the context of the paths for borrowing and
debt since before the First World War, including the less discernible effects of Spanish flu.
Chart 1.4: Public sector net borrowing: reference scenario versus Budget forecast
Outturn
2018-19 2019-20 2020-21 2021-22 2022-23 2023-24 2024-25
Public sector current receipts 813 839 743 902 946 981 1019
Total managed expenditure 851 887 1016 978 1008 1041 1077
Public sector net borrowing 38 47 273 76 63 61 59
Public sector net debt 1774 1799 2203 2285 2359 2428 2291
Public sector current receipts 0 -130 -8 -4 -4 -4
Total managed expenditure 0 88 1 -2 -3 -3
Public sector net borrowing 0 218 9 1 0 1
Public sector net debt 0 384 457 459 459 260
Public sector current receipts 37.5 37.8 37.8 37.7 38.2 38.3 38.4
Total managed expenditure 39.3 39.9 51.7 40.9 40.7 40.7 40.6
Public sector net borrowing 1.8 2.1 13.9 3.2 2.5 2.4 2.2
Public sector net debt 80.6 92.8 94.6 93.8 93.6 93.2 84.9
Public sector current receipts 0.1 -0.1 -0.4 -0.1 -0.2 -0.1
Total managed expenditure 0.1 11.4 0.0 -0.1 -0.1 -0.1
Public sector net borrowing 0.0 11.5 0.4 0.1 0.0 0.0
Public sector net debt 13.3 17.2 18.8 18.2 17.6 9.6
Difference from Budget 2020 forecast
£ billion
Scenario horizon
Per cent of GDP
Difference from Budget 2020 forecast
-10
-5
0
5
10
15
20
25
30
1908-09 1918-19 1928-29 1938-39 1948-49 1958-59 1968-69 1978-79 1988-89 1998-99 2008-09 2018-19
Per ce
nt o
f G
DP
Budget 2020 forecast
Reference scenario
Outturn
Spanish flu WWII Financial crisis
Source: Bank of England, ONS, OBR
Scenariohorizon
WWI

15
Chart 1.5: Public sector net debt: reference scenario versus Budget forecast
1.36 The following sections explain the figuring that underpins the results in Table 1.5, focusing
particularly on the effects in 2020-21. We look first at how the cost of fiscal policy
interventions has been estimated, before describing the ready-reckoned scenario results
across the main receipts and spending lines.
1.37 It is important not to place undue weight on the precise estimates. We present them to the
nearest billion pounds to ‘show our working’ and ensure that each line is consistent with the
economic scenario and that they also sum appropriately. But that does not imply that the
impact on any particular tax head or spending line can be estimated with such precision.
Policy costings
1.38 The standard approach in our forecasts is to evaluate the cost (or yield) from new policies
against a pre-measures baseline. That is not feasible in the current circumstances. Instead,
we present the costs relative to a scenario baseline that already (implicitly) captures the
effect of policy interventions on economic activity. Given the urgency of the need to support
the economy and the resulting pace at which the Treasury and other departments have been
working to develop the necessary policies, we have not gone through our standard iterative
scrutiny processes to generate policy costings. Instead, the costs assumed in the scenario
draw on the Treasury’s published estimates for some measures and our own broad-brush
estimates for those that have not been costed. Where possible we have cross-checked our
estimates against those presented by other organisations. We have made assumptions
about how new policies will be recorded in the public finances, but these too are subject to
uncertainty until the ONS has decided how they should be recorded.
1.39 Table 1.6 presents all the costs that have been included in the reference scenario. At this
stage, we have focused only on their costs in 2020-21, but we will need to consider what
0
50
100
150
200
250
300
1908-09 1918-19 1928-29 1938-39 1948-49 1958-59 1968-69 1978-79 1988-89 1998-99 2008-09 2018-19
Per ce
nt o
f G
DP
Budget 2020 forecast
Reference scenario
Outturn
Spanish flu WWII Financial crisis
Source: Bank of England, ONS, OBR
Scenariohorizon
WWI

16
they imply for future years too. Notably, the grants paid to companies and the self-
employed are taxable, so will affect tax receipts too (often with a lag). We will update these
cost estimates as further measures are announced and as we refine existing estimates.
1.40 For 2020-21 we have assumed:
• Additional DEL spending: the Chancellor announced on Budget day that the NHS
would receive whatever extra resources it needed to cope with coronavirus. The initial
estimate of this funding was up to £5 billion. There has been no official update on this
figure, but it seems likely that it will have been exceeded by the cost of subsequent
announcements – for example, the purchase of treatment of coronavirus patients at
private hospitals. For the purposes of this scenario we have therefore simply doubled
the Budget figure and included £10 billion in additional DEL spending. (On 13 April
the Chancellor announced that this figure has in fact now reached £14½ billion – this
came after we had closed the scenario, so it has not been incorporated.)
• Coronavirus Job Retention Scheme (CJRS): the Government will pay employers a
taxable grant worth 80 per cent of an employee’s wage cost, up to £2,500 a month,
plus the associated employer NICs and the minimum auto-enrolment employer
pension contribution on the subsidised wage. The scheme is open to all UK employers
for a minimum of three months. Its cost will be determined by the number of
employees whose jobs are furloughed and for how long, plus the level of the wage
subsidy. The first two elements are subject to the same enormous uncertainties as the
economic scenario. The latter is bounded by the eligibility criteria of the scheme. We
have tried to estimate a cost that is consistent with the assumptions underpinning the
economic scenario. Doing so implies that around 30 per cent of employees will be
covered at a cost of £42 billion (equivalent to almost 15 per cent of total employee
compensation in the baseline).11 We estimate that around a fifth of that returns to the
Exchequer in income tax and NICs – an effect that is captured implicitly via the fiscal
ready-reckoning rather than explicitly here. The first payments are expected this month.
• Self-employed income support scheme: the Government will provide a taxable grant to
self-employed individuals and members of partnerships. The grant will be worth 80
per cent of average monthly profits in 2016-17, 2017-18 and 2018-19, again up to
£2,500 a month, and will initially operate for three months. Eligibility requires that
trading profits do not exceed £50,000 and that more than half of recipients’ total
income is derived from self-employment. The grant is expected to be paid from June
onwards. Its cost is dependent on the same factors as the CJRS, and with the same
underlying uncertainties, plus an additional concern the Government has raised
around the potential for fraudulent claims. We have yet to estimate the cost of this
measure, but external analysis suggests a three-month cost of around £10 billion.12
11 Based on our March forecast of compensation of employees in the second quarter of 2020. 12 See Emmerson, C. and Stockton, I., The economic response to coronavirus will substantially increase government borrowing, Institute for Fiscal Studies, March 2020, and Bell, T. et al., Unprecedented support for employees’ wages last week has been followed up by equally significant, and even more generous, support for the self-employed. But gaps remain., Resolution Foundation, March 2020.

17
• Statutory sick pay (SSP) support: individuals self-isolating or unable to work as a result
of coronavirus are now able to access SSP from their first day off. Employers with fewer
than 250 employees will be able to reclaim up to two weeks’ SSP costs for any
employee who has claimed it as a result of coronavirus. The Treasury estimated in the
Budget that this could cost £2 billion, but as that estimate preceded the subsequent
announcement of the more generous CJRS, we have used a figure of half that amount.
• Welfare measures: the Government has announced a £20 a week increase in the
standard allowance of universal credit and the basic element of working tax credits,
plus several other changes to employment and support allowance, disability benefits
and means-tested support for renters and the self-employed. The Treasury has
estimated the cost of these measures at £7 billion in 2020-21.
• Local authority funding to support vulnerable people: this £0.5 billion of new grant
funding for local authorities in England was announced on Budget day.
• Small business grant schemes: businesses will receive grant funding of either £10,000
or £25,000 depending on the rateable value of their properties. Based on the
amounts already transferred to English local authorities for this scheme, plus Barnett
consequentials for the devolved administrations, we estimate this will cost around £15
billion in 2020-21. The grants will apply to approximately 1 million properties.
• Business rates package: the Government has announced a 12-month business rates
holiday for all retail, hospitality, leisure and nursery businesses. Our initial estimate is
that this will cost around £13 billion in 2020-21.
• Off-payroll working: the Government announced on 18 March that it would delay
implementation of reforms to off-payroll working rules for the private sector by a year
to 6 April 2021. Our Budget forecast assumed this measure would yield £1.2 billion in
2020-21, so for now we have simply assumed that delaying it will cost the same.

18
Table 1.6: Policy cost estimates in 2020-21 under the reference scenario
Other measures
1.41 There are several measures that we have not estimated costs for yet. These include:
• Coronavirus business interruption loan scheme and the Covid Corporate Financing
Facility: the business interruption loan scheme was announced as up to £330 billion of
support for businesses. These loans will be provided by commercial lenders, with 80
per cent of the loan guaranteed by the Government. To the extent that borrowers
default on these loans and lenders call the guarantees, this will add to public
spending. In addition, the Government will pay interest and any lender-levied fees for
the first 12 months. There is considerable uncertainty around take-up and the share of
loans that default. We have not estimated the potential cost of this scheme yet. The
Covid Corporate Financing Facility will purchase commercial paper from firms
experiencing severe disruptions to cashflows. It is unclear how this will be recorded in
the public finances and therefore whether it will affect borrowing.
• Tax deferrals and use of the time-to-pay service: VAT payments due between 20 March
and 30 June 2020 can be deferred until 31 March 2021. Income tax self-assessment
payments due on 31 July 2020 can also be deferred until January 2021. As payments
remain due during the 2020-21 financial year, we have not included an impact on
receipts for these deferrals yet, but it is likely that not all payments will be received due
to business failures in the intervening period. We will consider how best to capture
such effects in the scenario and update it as necessary. The Government also
announced scaling up of the time-to-pay service, which could shift receipts between
years and is subject to the same uncertainties over any costs due to business failures.
Head Costing (£ billion) Source
Public services
1 NHS: additional funding and other additional spending Spend -10.0 OBR
Employment support
2 Coronavirus job retention scheme Spend -42.0 OBR
3 Self-employed income support scheme Spend -10.0 IFS/RF1
Other support for households
4 Statutory sick pay support Spend -1.0 OBR
5 Welfare measures Spend -7.0 Treasury
6 Local authority funding to support vulnerable people Spend -0.5 Treasury
Business support
7 Small business grant schemes Spend -15.0 OBR
8 Business rates package Receipts -13.0 OBR
9 Off-payroll working: delay extension to private sector by 1 year Receipts -1.2 OBR
Direct effect of Government decisions -99.7
of which:
Spending -85.5
Receipts -14.21 Estimates from Institute for Fiscal Studies (IFS) and Resolution Foundation (RF).Note: The presentation of these numbers is consistent with the usual scorecard treatment, with negative signs implying an Exchequer
loss and a positive an Exchequer gain.

19
• Suspension of rail franchise agreements: these have been suspended for the next six
months. We have not yet estimated the impact that this will have on borrowing.
• Exemptions from import duties on medical products: NHS suppliers will be exempted
from paying customs duty and import VAT on specific medical items from outside the
EU. The cost will depend on the volume of imports of these products.
Receipts
1.42 Receipts are 15 per cent below the Budget forecast in 2020-21 (Table 1.7). In particular:
• Policy measures lower receipts by £14 billion. This is dominated by the cost of business
rates holidays and the extension of other business rates reliefs.
• Income tax and NICs are down 16 per cent, similar to the fall in annual GDP.
Typically, income tax and NICs would be expected to fall more than GDP owing to
fiscal drag, but support to wages and salaries from the CJRS and to self-employment
income from the SEISS tempers the effect. As noted, deferred self-assessment tax
payments are for now all assumed to be recouped in-year. We have not yet considered
second-order effects such as the lower path for interest rates reducing savings income
or rent holidays reducing property income. Nor have we considered the effect of
cashflow problems at firms leading to PAYE liabilities not being paid over to HMRC,
which could be material given the likely extent of such problems.
• VAT and excise duties are down 21 per cent. They fall more than total receipts and
GDP, reflecting lower consumer expenditure, which we assume will be concentrated in
standard-rated goods and those liable to excise duties, plus increases in VAT debt (as
we saw in the financial crisis). Air passenger duty receipts are hit particularly hard.
• Corporation tax receipts are down 18 per cent thanks to lower profits and lower oil
prices. One lesson from the financial crisis was that losses can cast a long shadow on
future receipts. With loss restriction measures now in place, the depressing effect from
the use of past losses to offset future profits should be smaller but longer-lasting. We
have not modelled that effect for this scenario given the complexity of doing so.
• Capital taxes are down 28 per cent thanks to the sharp falls in equity prices and
property transactions (including the effect on 2020-21 capital gains tax liabilities that
will largely be paid in 2021-22 due to the self-assessment payment lag). The fall is
greater than the fall in GDP, echoing what happened during the financial crisis.
• Interest and dividend receipts are down by 9 per cent reflecting lower interest rates
and the fact that RBS (like other banks) will not be paying dividends this year.

20
Table 1.7: Receipts in 2020-21: reference scenario versus Budget forecast
Spending
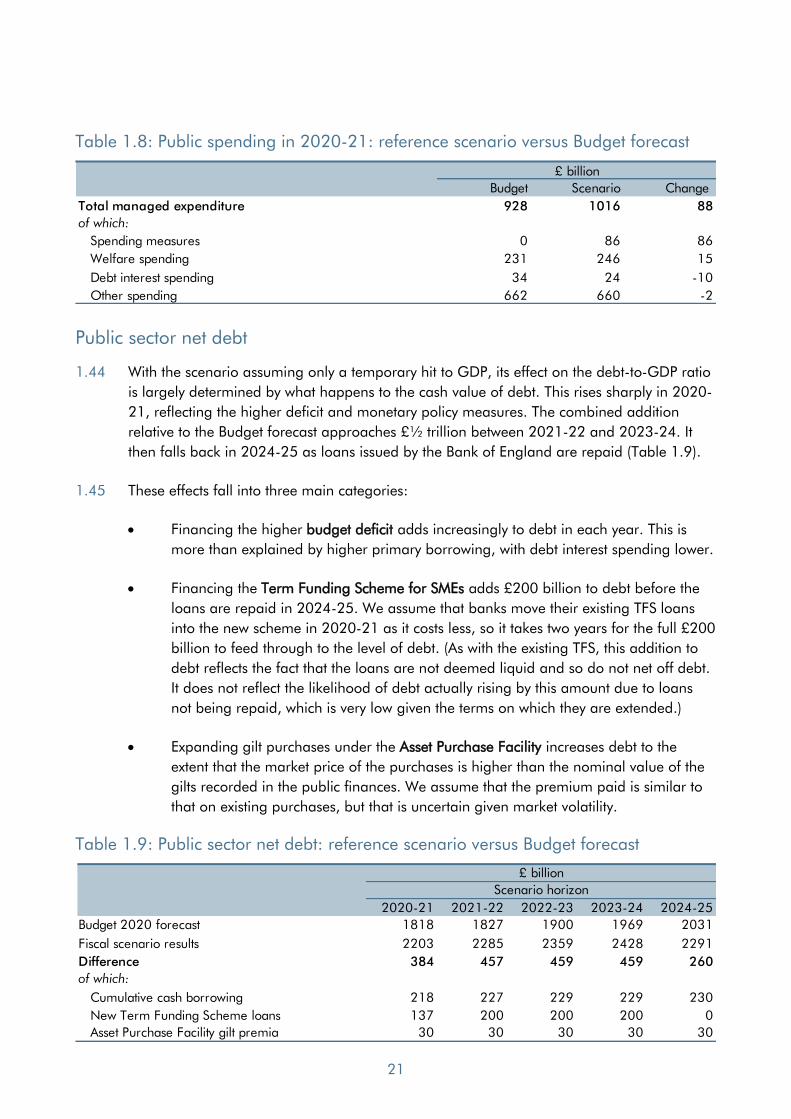
1.43 Spending is 9 per cent above the Budget forecast in 2020-21 (Table 1.8). That reflects:
• Policy measures adding £86 billion in 2020-21. As shown in Table 1.6, the largest
element is the assumed £42 billion cost of the CJRS (gross of its effects on tax receipts).
Grants to small firms cost £15 billion, while additional DEL spending (for the NHS and
other things) and the SEISS each add a further £10 billion.
• Welfare spending rising by 6 per cent, excluding measures, thanks to the 1.4 million
rise in unemployment on average over the year, plus the effect of lower earnings. We
assume all the extra unemployed will claim out-of-work benefits. Adding the cost of
measures, welfare spending is 10 per cent higher than in the Budget forecast.
• Departmental capital budgets being underspent by £2 billion more than we assumed
in the Budget. This is an illustrative 50 per cent increase to our Budget assumption, to
reflect some capital projects being postponed due to the public health measures, and
less than the full spending shortfall being made up during the remainder of the year.
• Debt interest is 30 per cent lower, despite the central government financing
requirement increasing by around £220 billion. That reflects lower Bank Rate (which
increases the saving associated with the £435 billion of gilts that were already in the
APF pre-coronavirus) and the £200 billion of additional quantitative easing (which, in
effect, refinances £200 billion of gilts at Bank Rate). Lower gilt yields and lower RPI
inflation also reduce spending in 2020-21 relative to the Budget forecast. Only the
additional financing from the scenario adds to debt interest, but with gilt yields so low
that generates only a modest offset. While debt interest is lower in this scenario than in
the Budget forecast, the sensitivity of spending and the deficit to increases in Bank Rate
is further increased. Once quantitative easing has been fully unwound – which could
be far into the future – higher debt would be expected to increase debt servicing costs.
Budget Scenario Change
Public sector current receipts 873 743 -130of which:
Income tax and NICs 358 300 -57
VAT 141 111 -30
Corporation tax 58 48 -10
Excise duties 52 42 -10
Capital taxes1 34 28 -6
Interest and dividends 28 25 -3
Others 202 202 0
Receipts measures 0 -14 -141 Total reduction is £10 billion across 2020-21 and 2021-22, reflecting the lags in payment of liabilities.
£ billion
21
Table 1.8: Public spending in 2020-21: reference scenario versus Budget forecast
Public sector net debt
1.44 With the scenario assuming only a temporary hit to GDP, its effect on the debt-to-GDP ratio
is largely determined by what happens to the cash value of debt. This rises sharply in 2020-
21, reflecting the higher deficit and monetary policy measures. The combined addition
relative to the Budget forecast approaches £½ trillion between 2021-22 and 2023-24. It
then falls back in 2024-25 as loans issued by the Bank of England are repaid (Table 1.9).
1.45 These effects fall into three main categories:
• Financing the higher budget deficit adds increasingly to debt in each year. This is
more than explained by higher primary borrowing, with debt interest spending lower.
• Financing the Term Funding Scheme for SMEs adds £200 billion to debt before the
loans are repaid in 2024-25. We assume that banks move their existing TFS loans
into the new scheme in 2020-21 as it costs less, so it takes two years for the full £200
billion to feed through to the level of debt. (As with the existing TFS, this addition to
debt reflects the fact that the loans are not deemed liquid and so do not net off debt.
It does not reflect the likelihood of debt actually rising by this amount due to loans
not being repaid, which is very low given the terms on which they are extended.)
• Expanding gilt purchases under the Asset Purchase Facility increases debt to the
extent that the market price of the purchases is higher than the nominal value of the
gilts recorded in the public finances. We assume that the premium paid is similar to
that on existing purchases, but that is uncertain given market volatility.
Table 1.9: Public sector net debt: reference scenario versus Budget forecast
Budget Scenario Change
Total managed expenditure 928 1016 88
of which:
Spending measures 0 86 86
Welfare spending 231 246 15
Debt interest spending 34 24 -10
Other spending 662 660 -2
£ billion
2020-21 2021-22 2022-23 2023-24 2024-25
Budget 2020 forecast 1818 1827 1900 1969 2031
Fiscal scenario results 2203 2285 2359 2428 2291
Difference 384 457 459 459 260
of which:
Cumulative cash borrowing 218 227 229 229 230
New Term Funding Scheme loans 137 200 200 200 0
Asset Purchase Facility gilt premia 30 30 30 30 30
£ billion
Scenario horizon

22
1.46 By convention, the ONS calculates the debt-to-GDP ratio using an ‘end-March centred’
measure of GDP. This means that for the debt-to-GDP ratio in 2019-20, the March 2020
stock of debt is divided by the sum of nominal GDP in the four quarters from 2019Q4 to
2020Q3. As the shock to GDP in the scenario comes in the second quarter of 2020, it is
reflected almost entirely in the denominator of the 2019-20 debt-to-GDP ratio rather than
the 2020-21 ratio where the effect on cash debt first hits. As Table 1.10 shows, debt would
rise to over 100 per cent of GDP in 2020-21 if the denominator were instead based on
financial year GDP. Indeed, since the scenario assumes that the economic and fiscal hit is
concentrated in the first half of 2020-21, this implies that debt will rise well above 100 per
cent of GDP for a period this year, and only fall below that level again when GDP recovers.
Table 1.10: Debt-to-GDP ratios using different time periods for the denominator
Next steps
1.47 Resources permitting, we will continue to expand our scenario analysis and to refine the
assumptions used in the reference scenario as new data become available and on the basis
of feedback from stakeholders and discussions with forecasters across government.
1.48 A non-exhaustive list of things that we hope to consider includes:
• Refining aspects of the reference economic scenario. For now, we have assumed no
lasting economic hit, but this will need to be revisited. The fiscal implications of an
economic shock also depend not just on its scale but also its composition. We have so
far made only very broad-brush assumptions about how the expenditure and income
composition of GDP will be affected. There would also be value in considering further
how the output shock and the policy response will affect the labour market.
• Refining the fiscal ready reckoners. We have largely relied on ready-reckoners drawn
from individual tax and spending forecast models to derive the scenario results.
Bottom-up modelling of this sort is inevitably somewhat partial, so we plan to look at
top-down alternatives too. In addition, there are numerous areas where it will be
possible to refine specific assumptions in individual taxes or spending lines following
discussion with stakeholders. For example, we have not yet considered what the
current crisis will mean for local authorities’ finances or whether any guarantees or
other contingent liabilities will crystallise.
• Testing the extent to which the fiscal implications of different economic scenarios can
be scaled. Assuming effects to be scalable seems a reasonable starting point, but it
seems unlikely that this would apply precisely or equally in all cases.
Outturn
2018-19 2019-20 2020-21 2021-22 2022-23 2023-24 2024-25
End-March centred GDP denominator 80.6 92.8 94.6 93.8 93.6 93.2 84.9
Financial year GDP denominator 81.8 80.9 112.0 95.4 95.2 94.8 86.3
Difference due to denominator time period -1.2 11.8 -17.4 -1.7 -1.6 -1.6 -1.5
Per cent of GDP
Scenario horizon

23
• Refining policy costings in the reference scenario. As well as refining assumptions
underpinning individual costings, we will consider how they interact with each other.
1.49 We would be pleased to receive feedback on any aspect of this scenario analysis or our
planned next steps to [email protected].