obj. 4.02 understand charts and graphs used in business. · whereas spreadsheet data is often...
TRANSCRIPT
Obj. 4.02 Understand charts and graphs used in business.
Purpose of Charts and Graphs
Charts and graphs are used in business to communicate and clarify spreadsheet information.
Charts and graphs emphasize and categorize spreadsheet information into a format
that can be quickly and easily analyzed.
4.02 Understand charts/graphs used in business Slide 2

Why do you need to learn about charts?
Can you answer these questions?
(1) Why might you use a chart to present
spreadsheet information?
(2) What does a chart or graph do that a
spreadsheet does not?
4.02 Understand charts/graphs used in business Slide 3
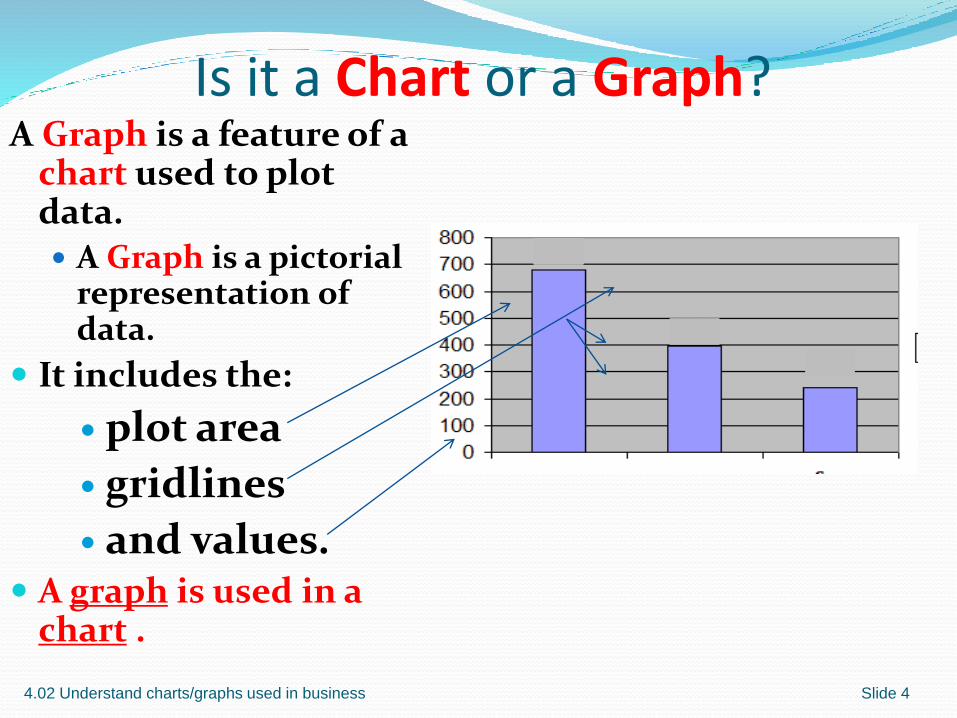
Is it a Chart or a Graph?A Graph is a feature of a
chart used to plot data. A Graph is a pictorial
representation of data.
It includes the:
plot area
gridlines
and values. A graph is used in a
chart .
4.02 Understand charts/graphs used in business Slide 4
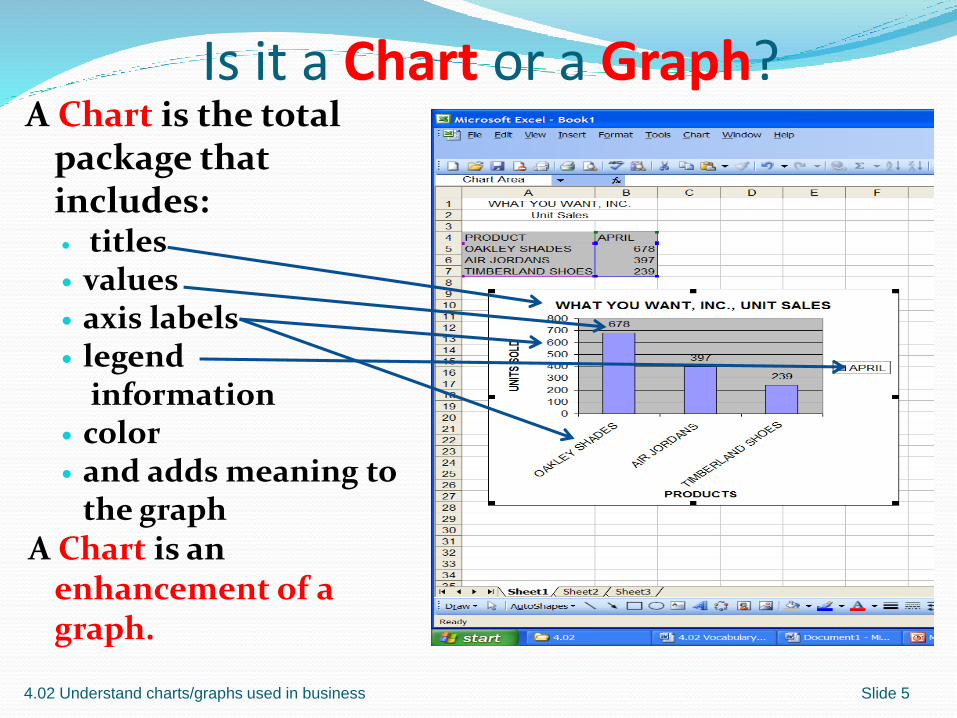
Is it a Chart or a Graph?A Chart is the total
package that includes: titles values axis labels legend
information color and adds meaning to
the graph A Chart is an
enhancement of a graph.
4.02 Understand charts/graphs used in business Slide 5
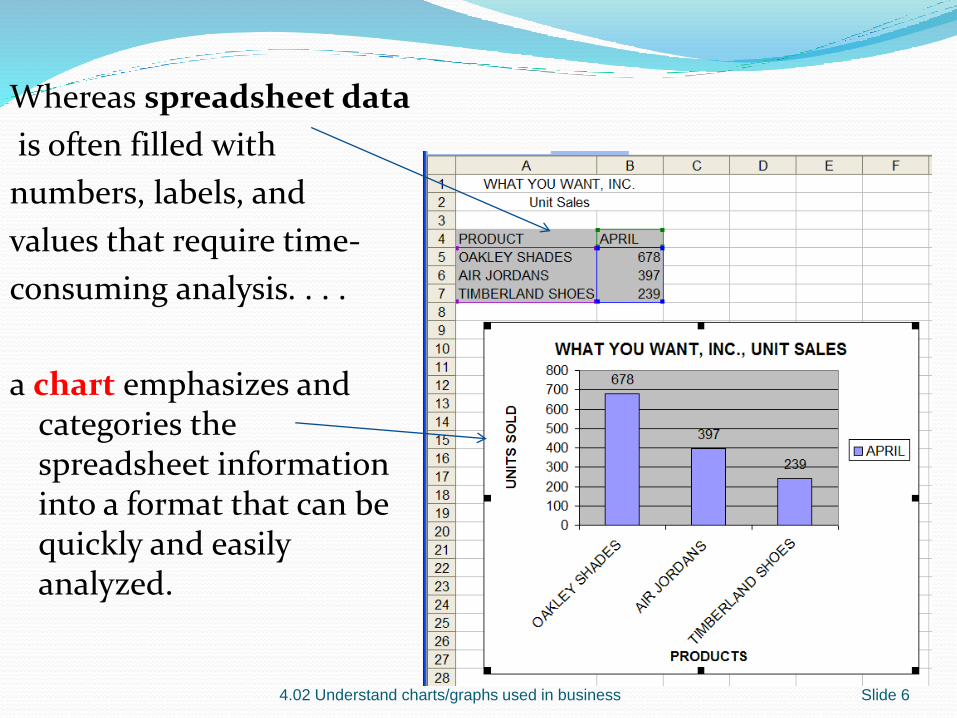
Whereas spreadsheet data
is often filled with
numbers, labels, and
values that require time-
consuming analysis. . . .
a chart emphasizes and categories the spreadsheet information into a format that can be quickly and easily analyzed.
4.02 Understand charts/graphs used in business Slide 6
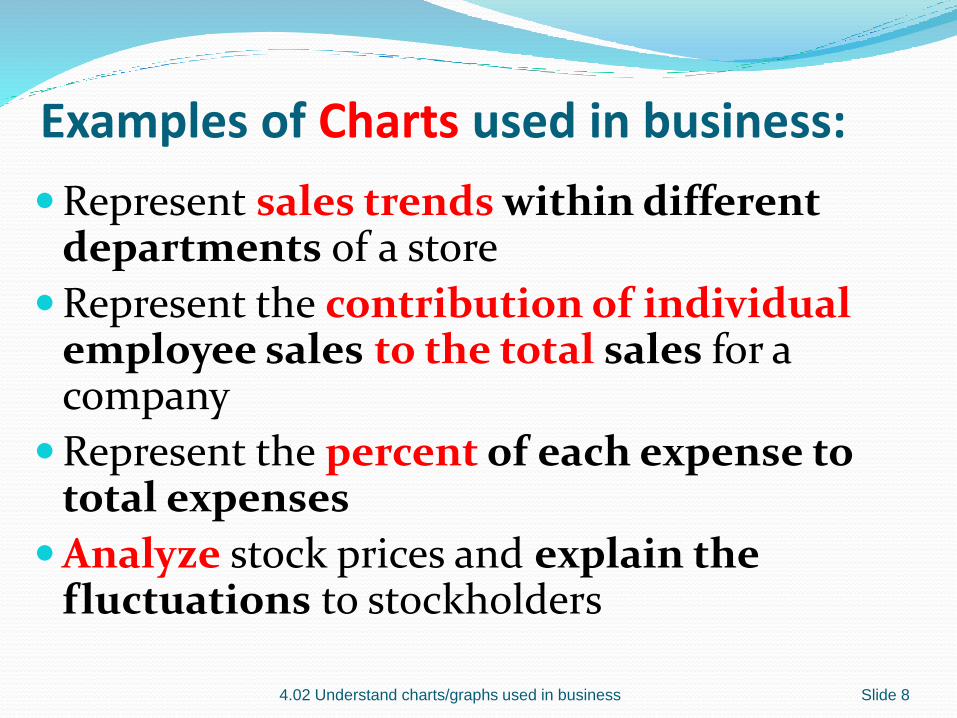
Examples of Charts used in business:
Represent sales trends within different departments of a store
Represent the contribution of individual employee sales to the total sales for a company
Represent the percent of each expense to total expenses
Analyze stock prices and explain the fluctuations to stockholders
4.02 Understand charts/graphs used in business Slide 8
Components of Graphs
Y-axis
X-axis
Data markers
Data series
Gridline
Plot area
Tick mark
Slide 104.02 Understand charts/graphs used in business
4.02 Understand charts/graphs used in business Slide 11
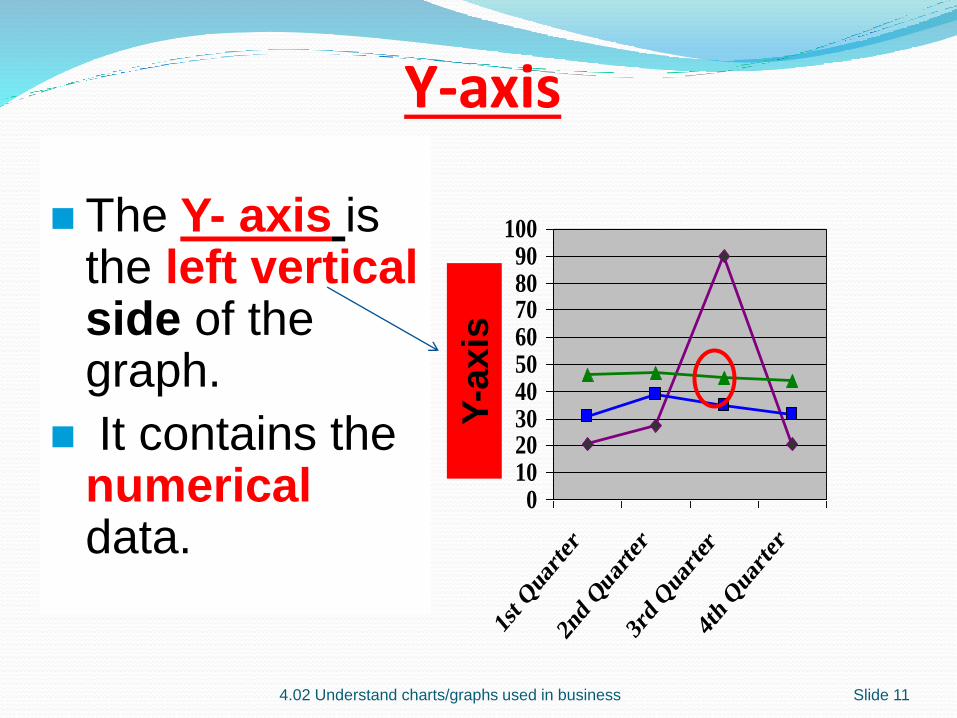
The Y- axis isthe left vertical side of the graph.
It contains the numericaldata.
0102030405060708090
100
1st Q
uart
er
2nd Q
uarte
r
3rd
Qua
rter
4th
Qua
rter
Y-a
xis
Y-axis
4.02 Understand charts/graphs used in business Slide 12
0102030405060708090
100
1st Q
uart
er
2nd Q
uarte
r
3rd
Qua
rter
4th
Qua
rter
Y-a
xis
X-axis
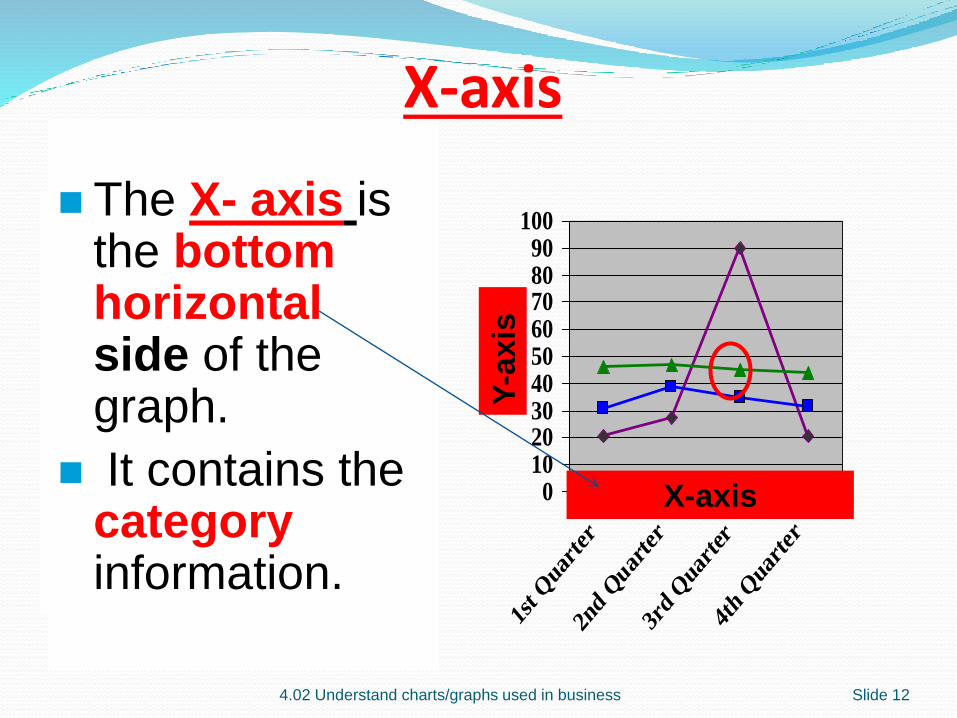
The X- axis isthe bottom horizontal side of the graph.
It contains the category information.
X-axis
4.02 Understand charts/graphs used in business Slide 13
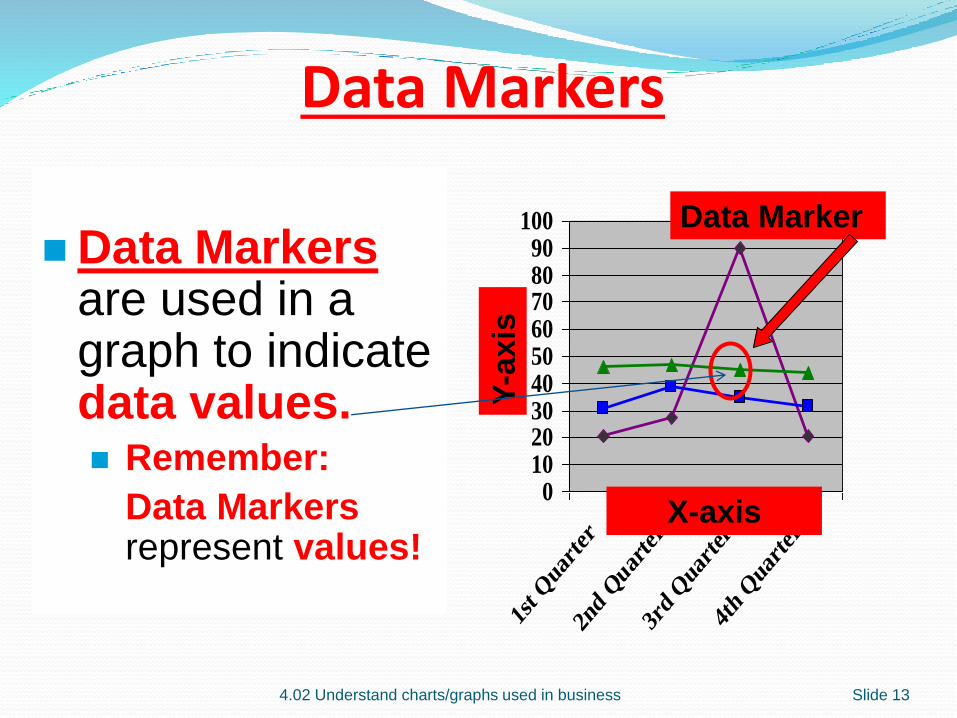
Data Markers are used in a graph to indicate data values. Remember:
Data Markers represent values!
0102030405060708090
100
1st Q
uart
er
2nd Q
uarte
r
3rd
Qua
rter
4th
Qua
rter
Y-a
xis
X-axis
Data Marker
Data Markers
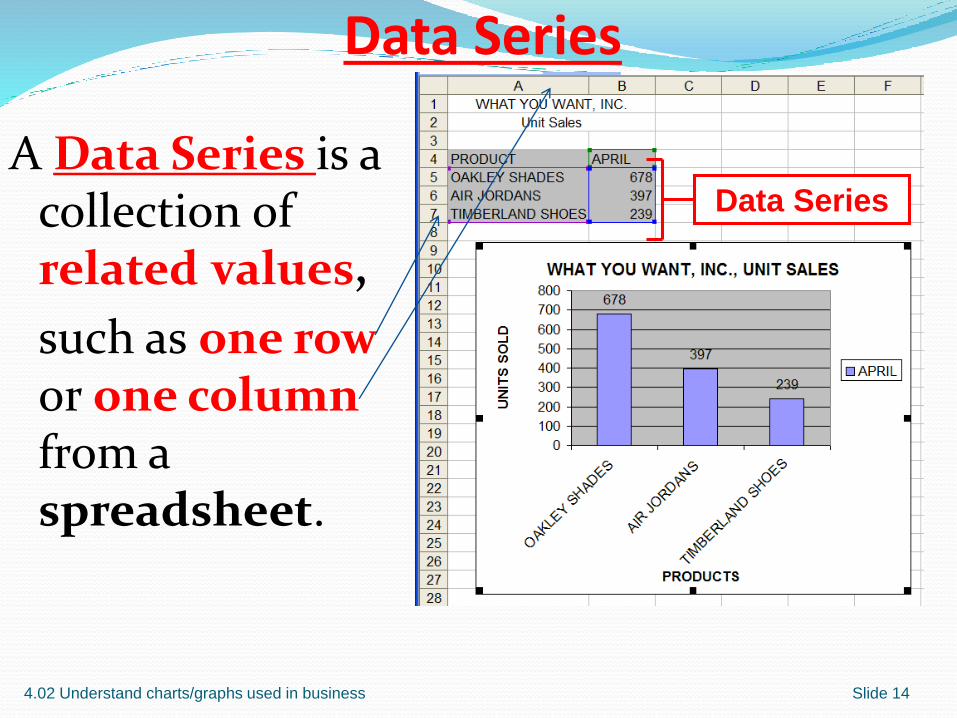
A Data Series is a collection of related values,
such as one rowor one columnfrom a spreadsheet.
4.02 Understand charts/graphs used in business Slide 14
Data Series
Data Series
Gridline
4.02 Understand charts/graphs used in business Slide 15
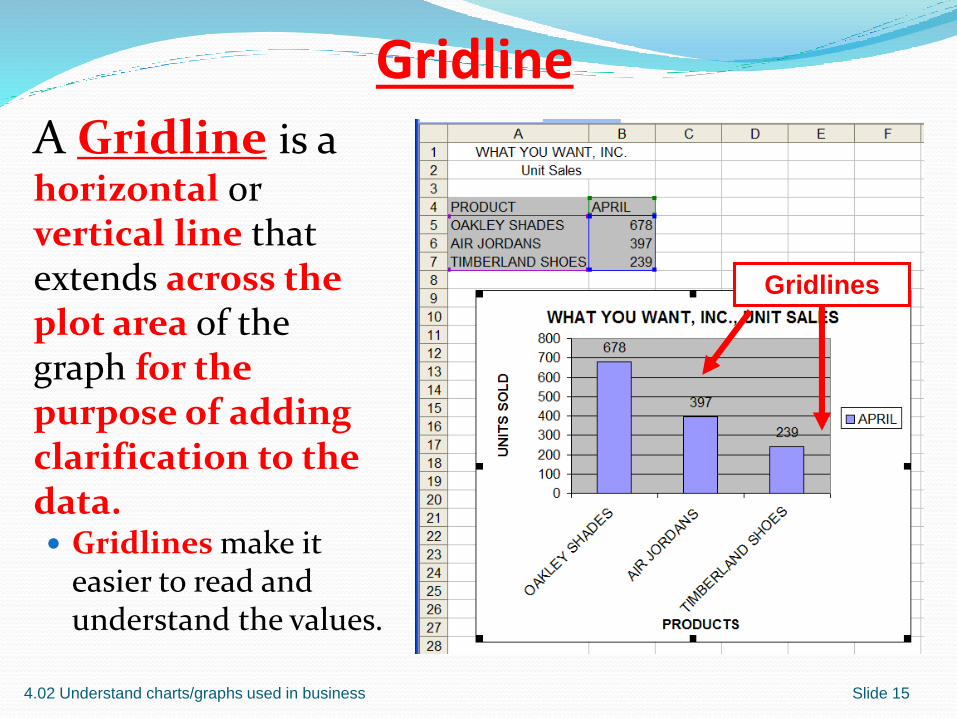
Gridlines
A Gridline is a horizontal or vertical line that extends across the plot area of the graph for the purpose of adding clarification to the data. Gridlines make it
easier to read and understand the values.
Example
4.02 Understand charts/graphs used in business Slide 16
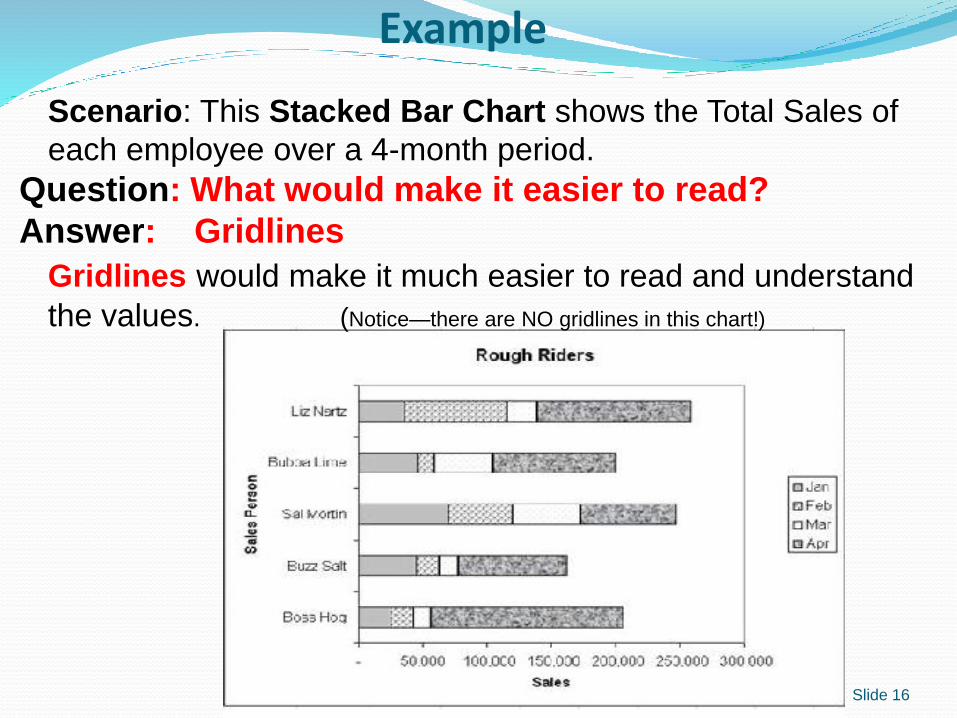
Scenario: This Stacked Bar Chart shows the Total Sales of
each employee over a 4-month period.
Question: What would make it easier to read?
Answer: Gridlines
Gridlines would make it much easier to read and understand
the values. (Notice—there are NO gridlines in this chart!)
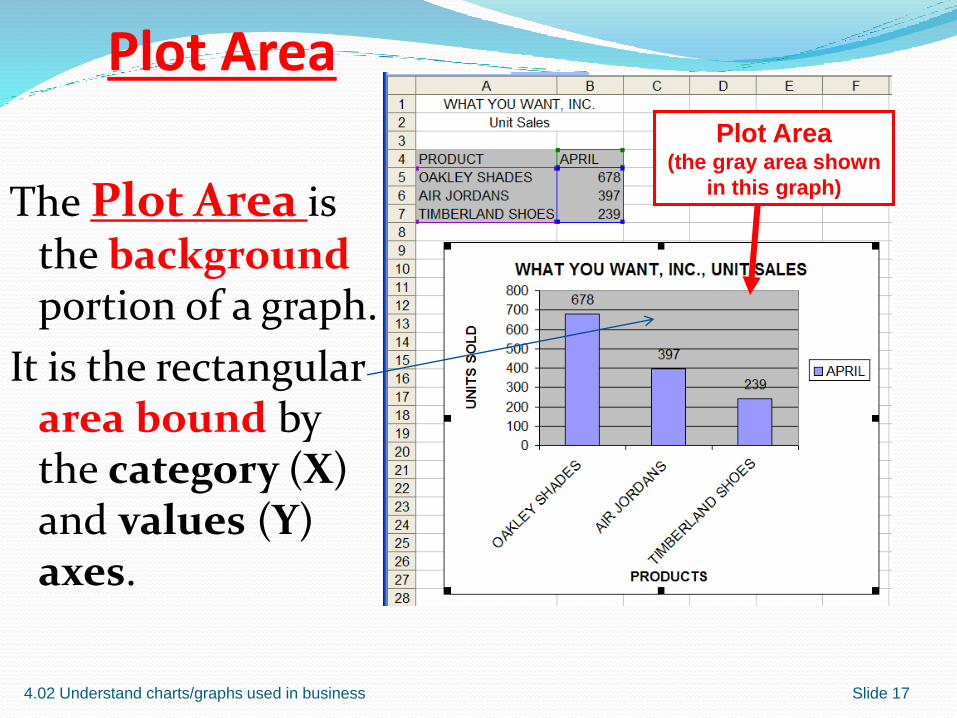
Plot Area
The Plot Area is the backgroundportion of a graph.
It is the rectangular area bound by the category (X) and values (Y) axes.
4.02 Understand charts/graphs used in business Slide 17
Plot Area(the gray area shown
in this graph)
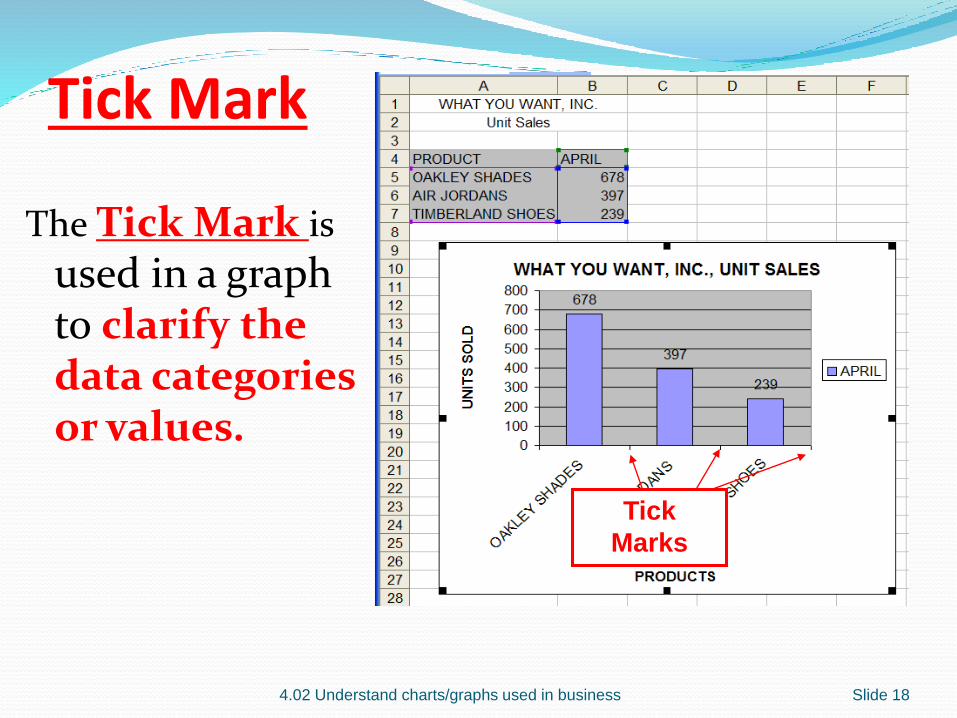
Tick Mark
The Tick Mark is
used in a graph to clarify the data categories or values.
4.02 Understand charts/graphs used in business Slide 18
Tick
Marks
Components of Charts
Legend
Data Label
Chart Title
X-Axis Title
Y-Axis Title
Slide 194.02 Understand charts/graphs used in business
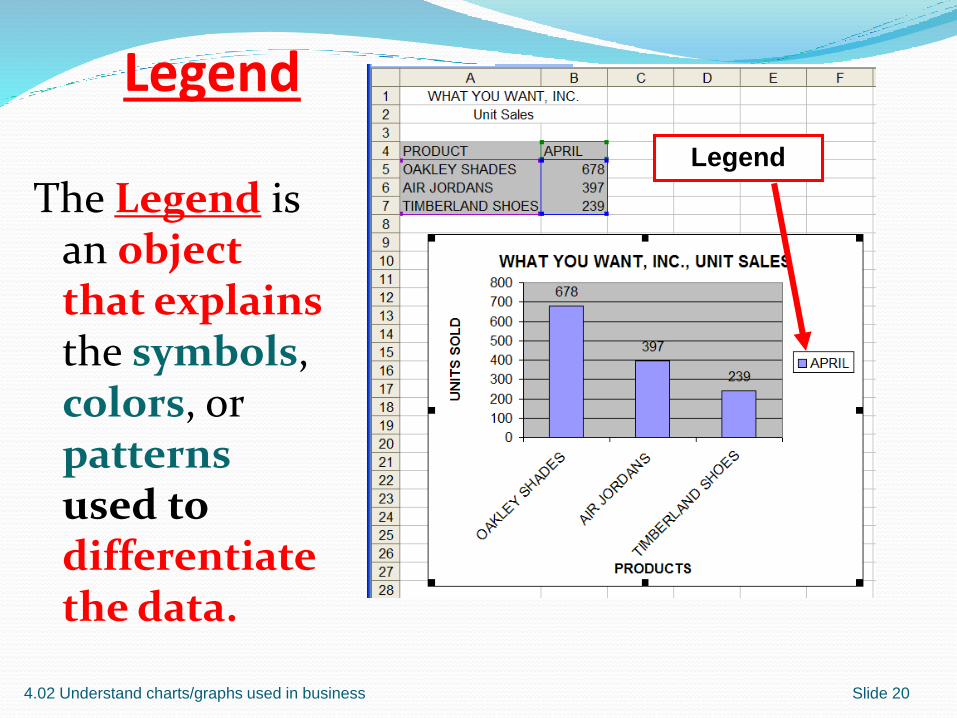
Legend
The Legend is an objectthat explainsthe symbols, colors, or patternsused to differentiate the data.
4.02 Understand charts/graphs used in business Slide 20
Legend
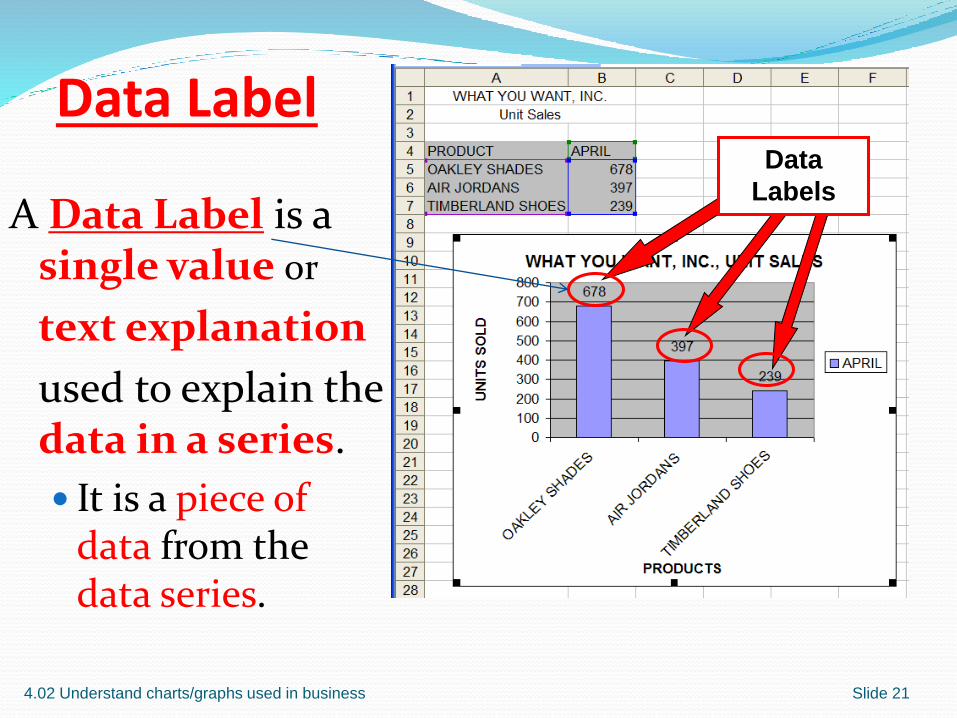
Data Label
A Data Label is a single value or
text explanation
used to explain the data in a series.
It is a piece of data from the data series.
4.02 Understand charts/graphs used in business Slide 21
Data
Labels
Example
4.02 Understand charts/graphs used in business Slide 22
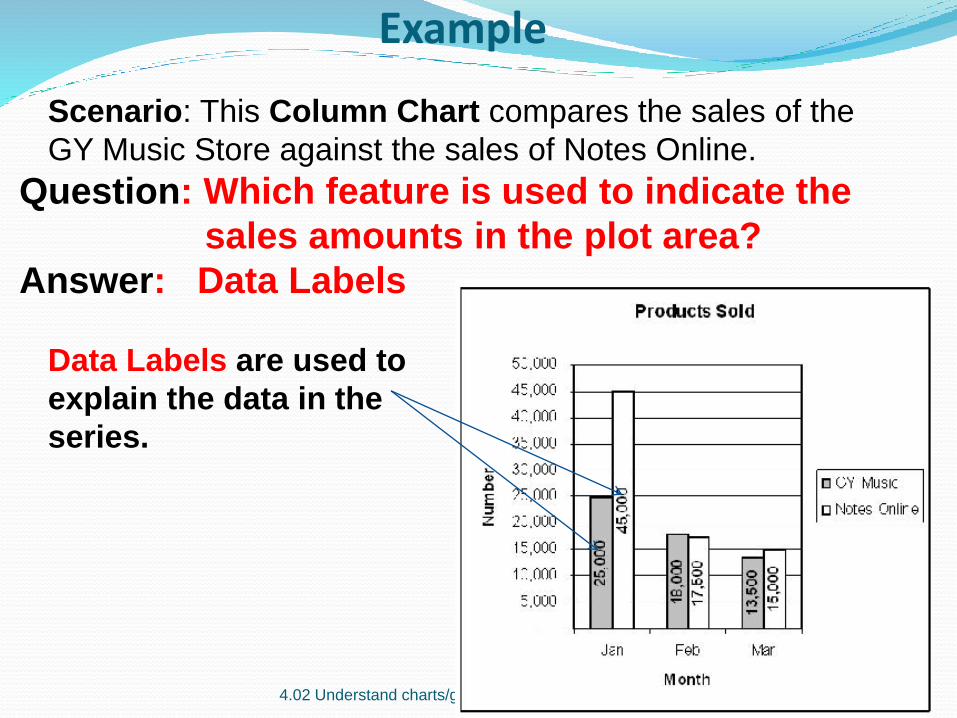
Scenario: This Column Chart compares the sales of the
GY Music Store against the sales of Notes Online.
Question: Which feature is used to indicate the
sales amounts in the plot area?
Answer: Data Labels
Data Labels are used to
explain the data in the
series.
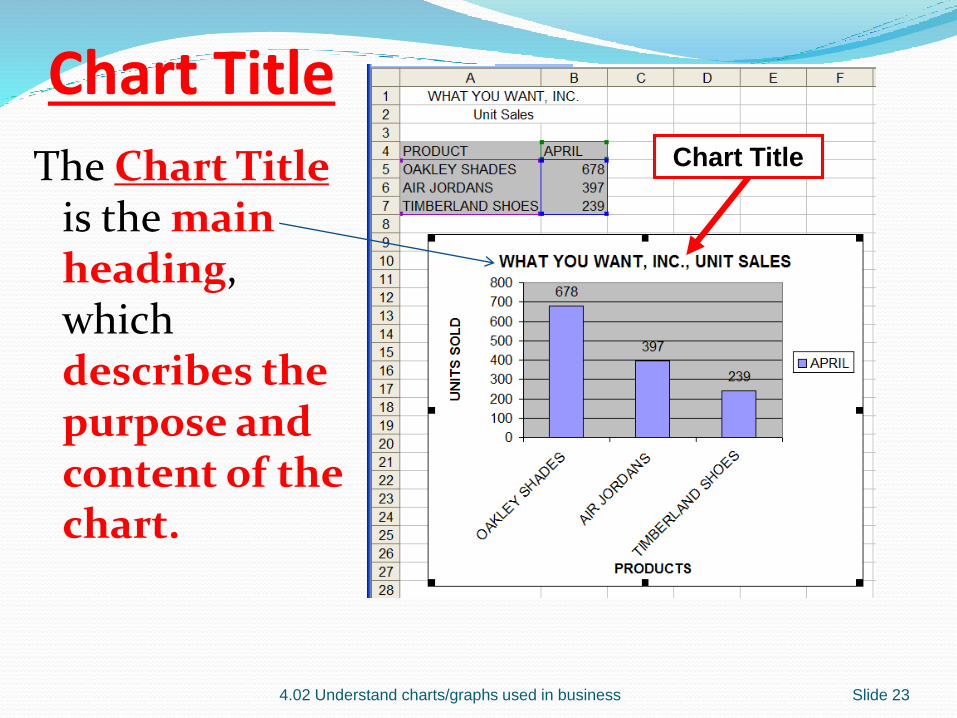
Chart Title
The Chart Title is the mainheading, which describes the purpose and content of the chart.
4.02 Understand charts/graphs used in business Slide 23
Chart Title
Example
4.02 Understand charts/graphs used in business Slide 24
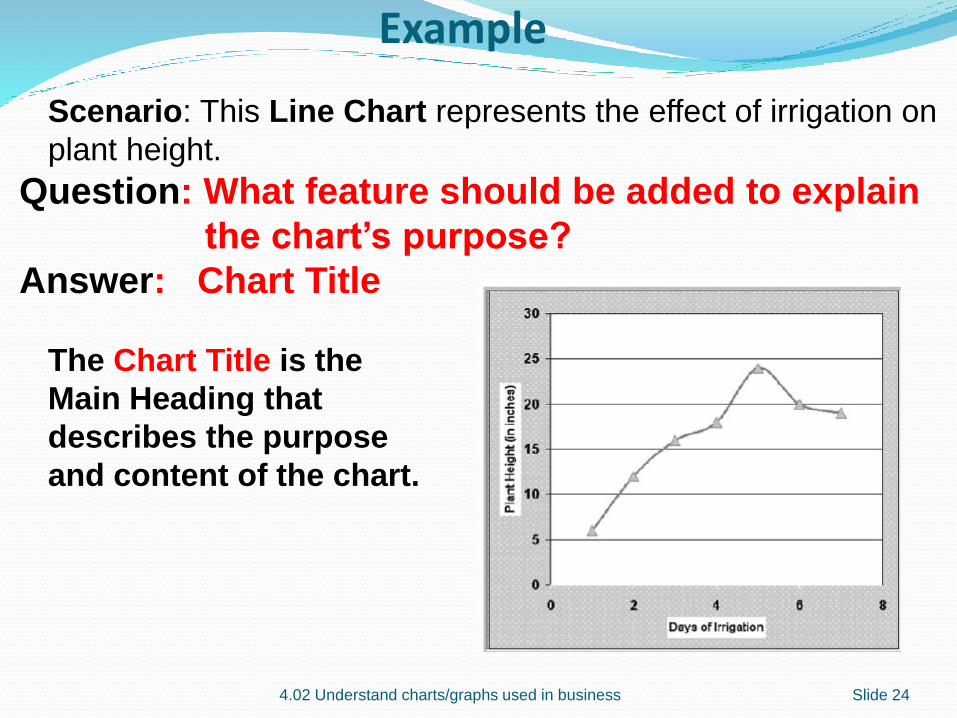
Scenario: This Line Chart represents the effect of irrigation on
plant height.
Question: What feature should be added to explain
the chart’s purpose?
Answer: Chart Title
The Chart Title is the
Main Heading that
describes the purpose
and content of the chart.
Axis Titles
4.02 Understand charts/graphs used in business Slide 25
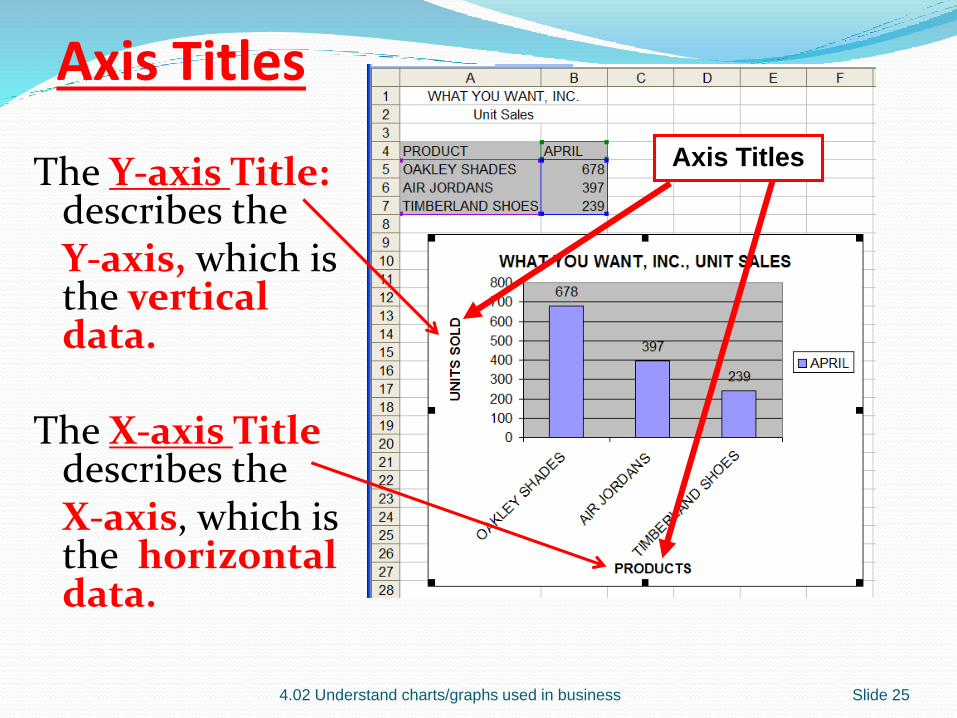
Axis TitlesThe Y-axis Title: describes the Y-axis, which is the vertical data.
The X-axis Title describes theX-axis, which is the horizontal data.
4.02 Understand charts/graphs used in business Slide 26
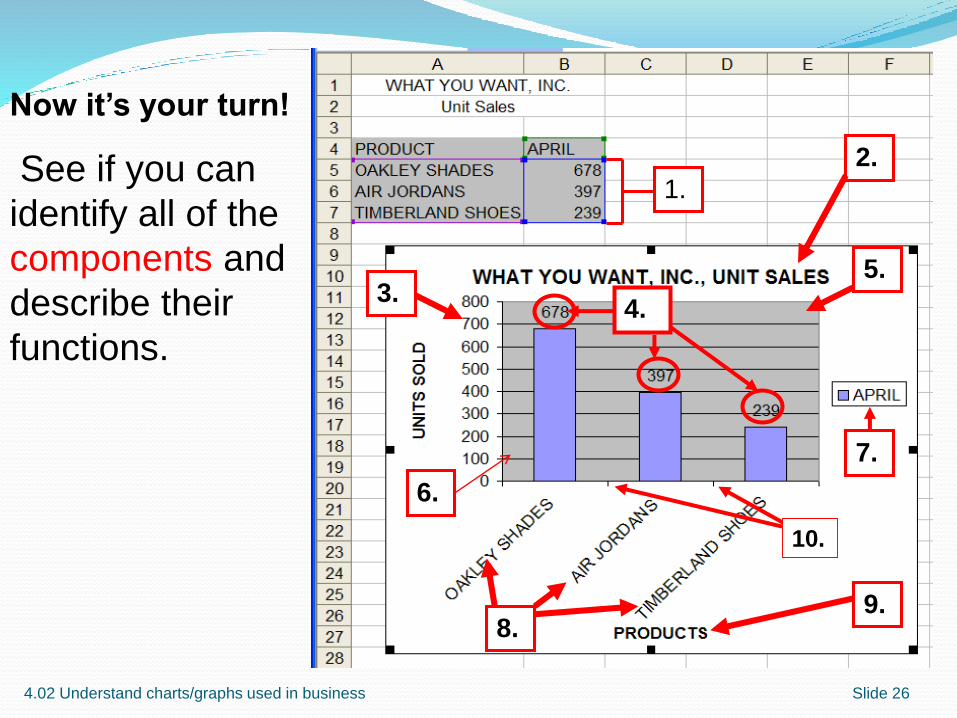
Now it’s your turn!
See if you can
identify all of the
components and
describe their
functions.
7.
4.
1.
6.
5.
8.
3.
2.
9.
10.
4.02 Understand charts/graphs used in business Slide 27
7.
1.
6.
8.
5.3.
2.
9.
4.
10.
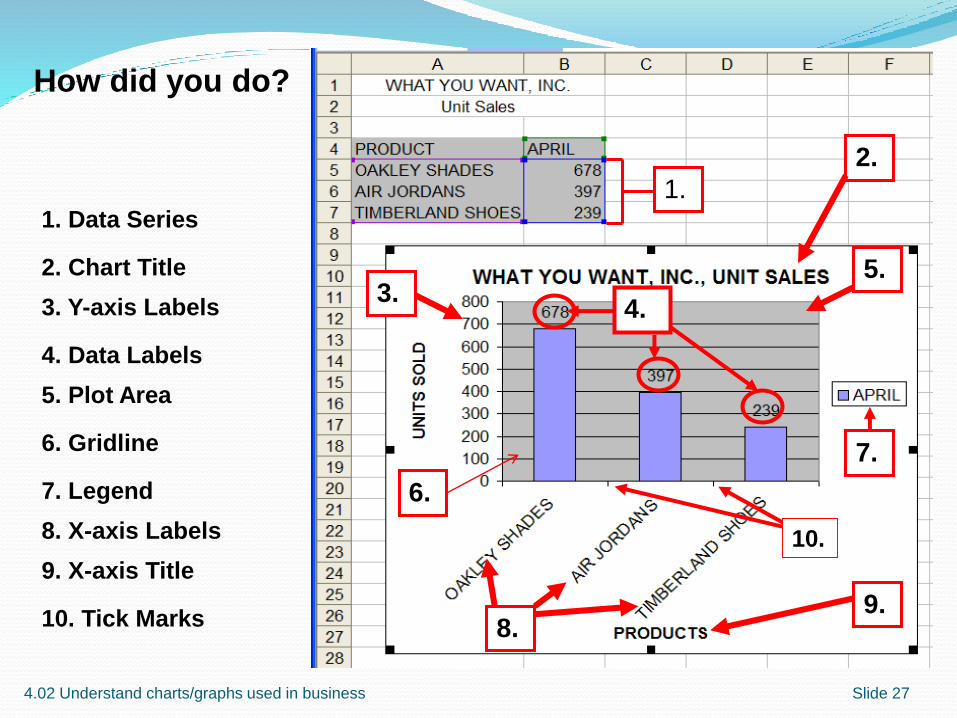
How did you do?
1. Data Series
2. Chart Title
3. Y-axis Labels
4. Data Labels
5. Plot Area
6. Gridline
7. Legend
8. X-axis Labels
9. X-axis Title
10. Tick Marks
Embedded Chart or a
Separate Chart
An Embedded chart is one that appears on the same sheet as the spreadsheet/worksheet it represents.
otherwise, it is referred to as a separate chart.
A Separate chart is one that does not appear on the same sheet as the spreadsheet/worksheet it represents.
4.02 Understand charts/graphs used in business Slide 28
Linked Chart
A Linked chart is one that will change to reflect changes made to the spreadsheet it represents.
4.02 Understand charts/graphs used in business Slide 29