oberbank at a glance
TRANSCRIPT


1
Oberbank at a Glance
Income statement in € m
HY1 2020 Change HY1 2019
Net interest income 169.8 -0.8% 171.1
Profi t from entities accounted for by the equity method
-45.0 >-100% 23.4
Charges for losses on loans and advances -9.5 >-100% 0.9
Net commission income 86.7 8.1% 80.2
Administrative expenses -147.5 3.6% -142.4
Profi t/loss for the period before tax 37.2 -73.9% 142.8
Profi t/loss for the period after tax 17.4 -85.3% 118.4
Balance sheet in €m 30/6/2020 Change 31/12/2019
Total assets 24,203.4 6.0% 22,829.0
Loans and advances to customers 17,159.1 2.3% 16,772.2
Primary funds 14,844.9
4.8% 14,166.0
of which savings deposits
2,675.2
-0.8% 2,697.4 of which securitised liabilities
incl . subordinated debt capital 2,272.1 4.0% 2,185.4
Equity 2,944.4 -0.5% 2,960.5
Customer funds under management 29,772.2 -1.8% 30,314.8
Own funds purs. to CRR in € m 30/6/2020 Change 31/12/2019
Common equity tier 1 capital (CET 1) 2,460.2 -7.5% 2,659.0
Tier 1 capital 2,510.2 -7.3% 2,709.0
Own funds 2,846.6 -6.9% 3,058.1
CET 1 ratio in % 16.03 -1.56% ppt 17.59
Tier 1 capital ratio in % 16.36 -1.56% ppt 17.92
Tota l capital ratio in % 18.55 -1.68% ppt 20.23
Regulatory liquidity indicators 30/6/2020 Change 31/12/2019
Liquidity Coverage Ratio in % 136.57 -33.81% ppt 170.38
Net Stable Funding Ratio in % 121.85 2.60% ppt 119.25
Leverage ratio in % 9.60 -1.34% ppt 10.94
Performance indicators HY1 2020 Change HY1 2019
Cost/income ratio in % 75.96 -25.88% ppt 50.08
Return on equity before tax in % 2.56 -7.54% ppt 10.10
Return on equity after tax in % 1.20 -7.18% ppt 8.37
Risk/earnings ratio (credit risk/net interest) in % 5.57 6.11% ppt -0.54
Resources 30/6/2020 Change 31/12/2019
Average number of staff (weighted) Number of s taff
2,167 17 2,150
Number of branches 177 0 177

2
Development of Business of the Oberbank Group in HY1 2020
Core business develops stably during corona crisis, good second quarter supports moderate profit, stronger equity
Stable operating business
Credit ri sk stays low
Significantly higher commission income
Income on equity investments positive in again in Q2
Stronger equity base
Dear Readers,
Oberbank closed the first half of 2020 with satisfactory results despite the turmoil caused by the coronavirus. The solid
trend in Q2 compensated the poor performance of the first quarter, helping Oberbank return to profitable territory.
The corona crisis and the impact on our customers meant that our s taff worked at maximum capacity to process the
numerous applications for loan deferrals and bridge financing. More than 25,000 interviews with customers were
conducted, and some 15,000 loans deferrals and bridge financing applications were processed with a volume of roughly
EUR 450 mi l l ion.
In addition to these exceptional challenges, we were also confronted with constant attacks from UniCredit on Oberbank’s
independence. All court rulings up to now have confirmed Oberbank’s legal standpoint.
Oberbank’s core business performed satisfactorily in HY1 2020.
Net interest income – boosted by a 4.6% rise in credit volume – was only slightly l ower than the excellent result attained
in the first half of the preceding year. Net fee and commission income rose again. The total of net interest income and net
commission income was higher than in the same period of the preceding year. Administrative e xpenses rose moderately,
and the historically low credit risk increased only marginally. The key performance ratios are s ti l l exceptional ly good.
Net interest income decreased s lightly by 0.8% to EUR 169.8 mi llion
Net commission income rose by 8.1% to EUR 86.7 million
Credit volume went up by 4.6% to EUR 17.2 bi llion
Primary deposits expanded by 5.5% to EUR 14.8 billion
Equity increased by 1.7% to EUR 2.9 bi llion. The tier 1 capital ratio was 16.4% and the total capital ratio was
18.6%, which is excellent i n Austrian and European comparison.
The highly satisfactory net interest income shows the stability of the core business of Oberbank. We have a proven and
sound business model which is also capable of withstanding hardship in times of crisis.
Income from equity investments, which plunged in the first quarter due to the corona crisis, was positive again in the
second quarter.
The losses of the first quarter (EUR -81.7 million) were reduced by EUR 36.7 million in the second quarter. The income
from equity investments was EUR -45.0 million at mid-year. This positive development was due largely to the contributions
from voesta lpine and our partner banks .
The solid earnings in the second quarter of 2020 were a clear improvement over the negative result of the first quarter
2020, enabling the bank to achieve a moderate profit after tax of EUR 17.4 million for the first half-year.
In the past years, Oberbank has achieved a strong level of capital adequacy backed by i ts excellent earnings and successful
capital increases. In the fi rs t ha l f of the year, equity increased by 1.7% to EUR 2.9 bi llion year on year.

3
The tier 1 capital ratio of 16.4% and the total capital ratio of 18.6% are excellent both in comparison within Austria and
within Europe despite the deteri orated results of the fi rs t quarter.
The excellent capital base of the bank ensures its capacity to supply corporate and retail customers with the funding
they need – also in difficult times.
Risk costs at low level
Impairment charges on loans and advances, which were at an a ll-time low at the end of the year and also in the first
quarter, increased slightly in the second quarter. A volume of EUR 9.5 million was allocated to impairment charges. This is
a minor amount compared to the credit volume of EUR 17 billion. We expect defaults on loans due to the corona crisis to
increase in the second hal f of the year and, above a l l , in the coming year.
The NPL ratio, which is the ratio of non-performing loans to total credit volume, was 2.05% at mid -year – a reassuringly
low ratio. For the ful l year 2019, i t was 1.96%.
Expansion of branch network continues
Oberbank stands by i ts growth s trategy and will continue opening new branches as planned. We have scheduled the
opening of s ix new branches in 2020 of which four in are Germany and one each in Hungary and Slovakia .
Small and medium-sized companies need advisory services for liquidity and finance structuring, and also regarding the
many subsidised loan schemes – especially now. They benefit from access to local branches. We are happy that advisory
services are valued and appreciated by customers again.
In these highly challenging times for businesses and individuals, we are seeing a renaissance of loyalty to one’s principal
bank.
CEO Franz Gasselsberger

4
The Oberbank share
The price of Oberbank’s ordinary share as well as the price of Oberbank’s preference share exhibited relative s tability in
the fi rst half of 2020 compared to the overall market. The performance of the ordinary shares was -12.53% and that of
preference shares was -8.17%. The overall market (ATX) by contrast dropped by 29.14%. European banking shares even
plunged by around 34%.
Oberbank shares – key figures HY1 2020 HY1 2019
Number of ordinary no-par shares 32,307,300 32,307,300
Number of preference shares 3,000,000 3,000,000
High (ordinary/preference share) in € 96.00/91.00 95.40/93.00
Low (ordinary/preference share) in € 83.00/75.50 89.80/83.00
Close (ordinary/preference share) in € 83.80/82.00 95.40/93.00
Market capita l i zation in € m 2,953.35
3,361.12 IFRS earnings per share in € annual ised 0.99* 6.71
P/E ratio, ordinary shares 84.6 14.22
P/E ratio, preference shares 82.8 13.86
*Earnings per share annualised. They are calculated as follows: profit for the period after tax in HY1 2020 (EUR 17,437,000)
divided by the average number of ordinary and preference shares in ci rculation (35,125,812) multiplied by two (figure
projected for the ful l year).
Oberbank ordinary and preference shares vs. ATX and the European banking index
Period: 6/30/2010 to 6/30/2020
Source: Refinitv Datastream, 6/30/2020
The chart comparison shows the development of the Oberbank ordinary share, the Oberbank preference share, the Austrian stock index ATX, and the European banking index STOXX Europe 600 Banks. The prices have been adjusted in the chart by indexing the daily closing prices of the
relevant stock and the indices to 100. This means the starting prices were all set to 100% at the starting time. Therefore, the chart presents the relative percentage development.
The figures given refer to the past. These cannot be used to derive future trends.

5
Segment Developments in HY1 2020
Corporate and Business Banking
Corporate and Business Banking in € m HY1 2020 HY1 2019 + / - in % + / - in %
Net interest income 130.2 127.9 2.4 1.9%
Charges for losses on loans and advances -5.3 4.4 -9.7 >-100%
Net commission income 44.6 42.8 1.8 4.2%
Net trading income 1.0 -0.1 1.0
Administrative expenses -80.9 -77.1 -3.8 4.9%
Other operating income 4.2 -3.4 7.7
Profi t/loss for the period 93.8 94.5 -0.6 -0.7%
Risk equivalent 10,583.0 10,012.6 570.4 5.7%
Average a llocated equity 1,702.5 1,623.1 79.4 4.9%
Return on equity before tax (RoE) 11.0% 11.6% -0.6% ppt
Cost/income ratio 44.9% 46.1% -1.2% ppt
Earnings in Corporate and Business Banking
Profi t in the Corporate and Business Banking segment was EUR 93.8 mi llion, which i s EUR 0.6 mi llion or 0.7% lower year
on year.
Net interest income rose by EUR 2.4 mi l l ion or 1.9% to EUR 130.2 mi l l ion.
Charges for losses on loans and advances increased from a positive EUR 4.4 mi llion by EUR 9.7 mi llion to a negative EUR
5.3 mi l l ion.
Net commiss ion income was up by EUR 1.8 mi l l ion or 4.2% to EUR 44.6 mi l l ion over the preceding year.
Adminis trative expenses were higher by EUR 3.8 mi l l ion or 4.9% at EUR 80.9 mi l l ion.
Other operating income increased from negative EUR 3.4 mi l l ion by EUR 7.7 mi l l ion to EUR 4.2 mi l l ion.
RoE in the Corporate and Business Banking segment dropped by 0.6%-points from 11.6% to 11.0%, while the
cost/income ratio improved by 1.2%-points from 46.1% to 44.9%
Commercial loans
Oberbank’s commercial lending volume continued to rise and expanded by EUR 539.4 mi llion or 4.1% from EUR 13,020.9
mi l l ion to EUR 13,560.3 mi l l ion.
Commercial loans YoY change
As at 30/6/2020 As at 30/6/2019 absolute in %
€ 13,560.3 mi l l ion € 13,020.9 mi l l ion € 539.4 mi l l ion 4.1%
Investment finance
The number of applications submitted in the first half-year 2020 in Austria, Germany, Czech Republic and Hungary and
Slovakia for subsidised loans and innovation projects and to secure liquidity was a total of 1,741 projects or 125.0% higher
than the already very high level of the preceding year. This significant rise in the number of applications submitted is largely
due to the coronavirus financial a id schemes launched in March. The volume of subsidised finance granted through
Oberbank amounted to EUR 1.205 bi l l ion as at 30 June 2020, which i s a lmost as high as in the previous year.
Investment finance YoY change
As at 30/6/2020 As at 30/6/2019 absolute in %
€ 9,893.9 mi l l ion € 9,410.2 mi l l ion € 483.7 mi l l ion 5.1%

6
Leasing
At EUR 433.8 mi llion in new business, the volume increased year-on-year again. The activation of real estate projects fully
compensated the decl ine in the movables bus iness .
Leasing receivables from customers YoY change
As at 30/6/2020 As at 30/6/2019 absolute in %
€ 2,441.9 mi l l ion € 2,355.6 mi l l ion € 86.3 mi l l ion 3.7%
Trade finance and international business
After the slowing of global economic activi ty at the start of the year, th e corona crisis, which was initially l imited to China,
developed into a worldwide pandemic. OeNB published a s tudy predicting the s teepest plunge in economic activity since
the founding of the Second Republic. The effects of the corona crisis are affecting a ll areas of l ife. OeNB expects exports
to shrink in 2020 by some 11.0% and imports to d ecrease by 10.0%.
The interruption of global trade flows, the difficulties in serving delivery documents , and the increasing international
competition in a shrinking market pose higher risks for companies with international operations. Companies that see the
cris is as an opportunity for future business have a positive outlook. Digitalisation, sustainability and new sales markets
offer countless possibilities. The advisory competence of Oberbank in matters relating to letters of credit, documentary
col lection and guarantees has proven va luable also in times of crisis. Traditional hedge transactions for trade deals were
the ideal risk protection for global trade, also within Europe. Oberbank retained its positioning as a safe haven and reliable
partner for exporters as shown by the market shares of Oberbank for revolving export subsidy loans of 11.4% (export
finance for SMEs under the ‘OeKB Exportfonds’) and 10.7% (export finance for large corporates (‘KRR’ OeKB credit line) as
at 30 June 2020. The volume stabilised significantly at over EUR 1.5 billion supported by OeKB’s subsidised loans for export-
based domestic investments. Based on the swift and uncomplicated availability of OeKB bridge loans, Oberbank remains
a rel iable partner for the exporting sector.
Factoring
In the year 2016, Oberbank expanded i ts product portfolio for Austria and Germany by adding factoring services, and ever
s ince, customers have been able to choose from the complete range of working capital finance options. In the first half of
2020, the factoring volume increased by 10.0% over the same period of the preceding year.
Syndicated loans and international lending
In the second quarter, the effects of the shutdown on businesses and consequently on banks was clearly felt. Several
large-volume bridge loan with Austrian and German export loan credit institutions were s igned and will be available for
payout in the coming months; further transactions are being prepared. Additionally, projects already prepared in the
preceding months are now being finalized. The segment of borrowers’ notes i s still very subdued due to the current
s i tuation.
Payment services
On 30 June 2020, i ncome on payment services in the corporate segment was 0.9% higher year on year. The entire second
quarter 2020 was severely affected by the consequences of the corona crisis. Maintaining payment services for corporate
customers in home office mode was one of the main i ssues. Oberbank excelled with i ts advisory offers and with services
for s table systems and mobi le solutions .
Structured finance
Demand for structured finance increased again slightly compared to the preceding year. The total number of projects
processed rose 12.0% year on year and the project volume even expanded by around one third.
Substantial increases were seen with respect to both project volume and number of projects from the segments of real
estate and acquisition financing. Additionally, there was a surge in inquiries from new customers for traditional corporate
loans and also larger project volumes. The tourism sector was severely affected by the corona crisis, and new inquiries for
7
tourism projects dropped s teeply. Therefore, the total number of tourism projects processed in the fi rst half of 2020 was
25.0% lower year on year. However, one has to bear in mind that volumes are s till at a very high level and tourism still
ranks second after rea l estate projects as regards demand for s tructured loans .
Oberbank Opportunity Fund
In the fi rst half of the year 2020, the Oberbank Opportunity Fund reported 71 queries, which is exactly the same level as
in the preceding year, with the fi rst quarter being especially s trong. The Oberbank Opportunity Fund completed five
transactions in the first half of 2020. Since the inception of the Oberbank Opportunity Fund, 85 transactions for equity
and/or mezzanine capital or high-yield capital have been supported financially (plus external capital loans) and ten
supplementary financing projects have been finalized. The volume of committed capital as at 30 June 2020 was EUR 231
mi l l ion and breaks down into equity, mezzanine capita l and high -yield capita l .
International network of partner banks and institutions
The trend in international business triggered by the corona vi rus continued in the second quarter of 2020 as well. Apart
from the restrictions caused by the diverse lockdowns in some countries and the related interruptions of global supply
chains, the main driver behind the heightened risk awareness was widespread insecurity. The consequences included a
s teep drop in international foreign trade revenues and higher demand for hedge transactions to secure trade deals.
Furthermore, banks that offer payment services for transactions significantly tightened their audit requirements and due
di l igence obl igations .
Primary deposits
Despite the turmoil caused by the corona crisis, primary deposits increased by 4.8% in the fi rst half of 2020 as compared
to year-end 2019. The main driver behind this development was the higher volume of sight deposits in the corporate and
reta il segments. Moreover, the volume of savings deposits expanded steeply in the first half -year 2020. These are all
consequences of the ECB’s monetary policy which i s s till supporting extremely high l iquidity with a ll of the entailing
consequences .
Currency risk management
After a rather subdued start into the year, volatility on currency markets was high, above a ll, in March and April. The
recession that affected all major economic reigons resulted in wider fluctuations on currency markets. The strong currency
fluctuations and the market turmoil posed a major challenge for companies engaged in international business. Payments
were delayed or were made only partially on the due dates. It became clear during this phase that customer advice
provided by experts was extremely va luable. During this period, customers advised directly were interested, above all, in
class ica l hedge products for foreign currency transactions .
8
Personal Banking
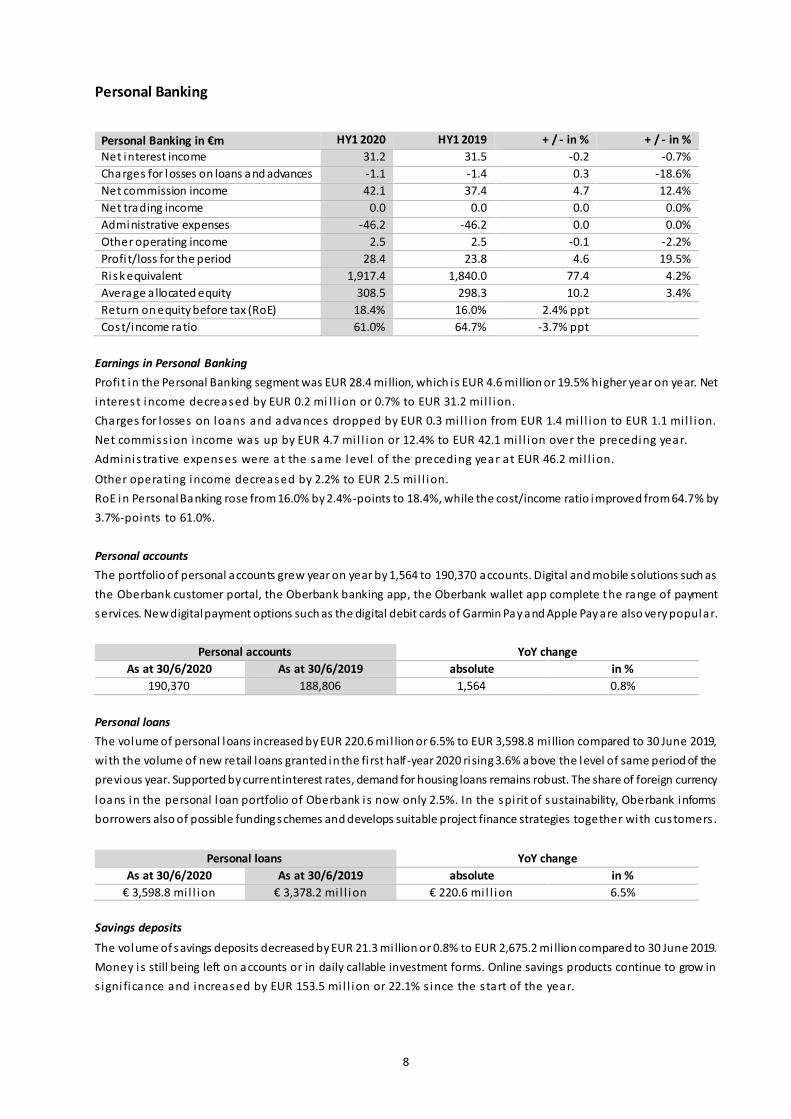
Personal Banking in €m HY1 2020 HY1 2019 + / - in % + / - in %
Net interest income 31.2 31.5 -0.2 -0.7%
Charges for losses on loans and advances -1.1 -1.4 0.3 -18.6%
Net commission income 42.1 37.4 4.7 12.4%
Net trading income 0.0 0.0 0.0 0.0%
Administrative expenses -46.2 -46.2 0.0 0.0%
Other operating income 2.5 2.5 -0.1 -2.2%
Profi t/loss for the period 28.4 23.8 4.6 19.5%
Risk equivalent 1,917.4 1,840.0 77.4 4.2%
Average a llocated equity 308.5 298.3 10.2 3.4%
Return on equity before tax (RoE) 18.4% 16.0% 2.4% ppt
Cost/income ratio 61.0% 64.7% -3.7% ppt
Earnings in Personal Banking
Profi t in the Personal Banking segment was EUR 28.4 mi llion, which i s EUR 4.6 mi llion or 19.5% higher year on year. Net
interest income decreased by EUR 0.2 mi l l ion or 0.7% to EUR 31.2 mi l l ion.
Charges for losses on loans and advances dropped by EUR 0.3 mi l l ion from EUR 1.4 mi l l ion to EUR 1.1 mi l l ion.
Net commiss ion income was up by EUR 4.7 mi l l ion or 12.4% to EUR 42.1 mi l l ion over the preceding year.
Adminis trative expenses were at the same level of the preceding year at EUR 46.2 mi l l ion.
Other operating income decreased by 2.2% to EUR 2.5 mi l l ion.
RoE in Personal Banking rose from 16.0% by 2.4%-points to 18.4%, while the cost/income ratio improved from 64.7% by
3.7%-points to 61.0%.
Personal accounts
The portfolio of personal accounts grew year on year by 1,564 to 190,370 accounts. Digital and mobile solutions such as
the Oberbank customer portal, the Oberbank banking app, the Oberbank wallet app complete the range of payment
services. New digital payment options such as the digital debit cards of Garmin Pay and Apple Pay are also very popular.
Personal accounts YoY change
As at 30/6/2020 As at 30/6/2019 absolute in %
190,370 188,806 1,564 0.8%
Personal loans
The volume of personal loans increased by EUR 220.6 mi l lion or 6.5% to EUR 3,598.8 mi llion compared to 30 June 2019,
with the volume of new retail loans granted in the fi rst half-year 2020 rising 3.6% above the level of same period of the
previous year. Supported by current interest rates, demand for housing loans remains robust. The share of foreign currency
loans in the personal loan portfolio of Oberbank is now only 2.5%. In the spirit of sustainability, Oberbank informs
borrowers also of possible funding schemes and develops suitable project finance strategies together with customers .
Personal loans YoY change
As at 30/6/2020 As at 30/6/2019 absolute in %
€ 3,598.8 mi l l ion € 3,378.2 mi l l ion € 220.6 mi l l ion 6.5%
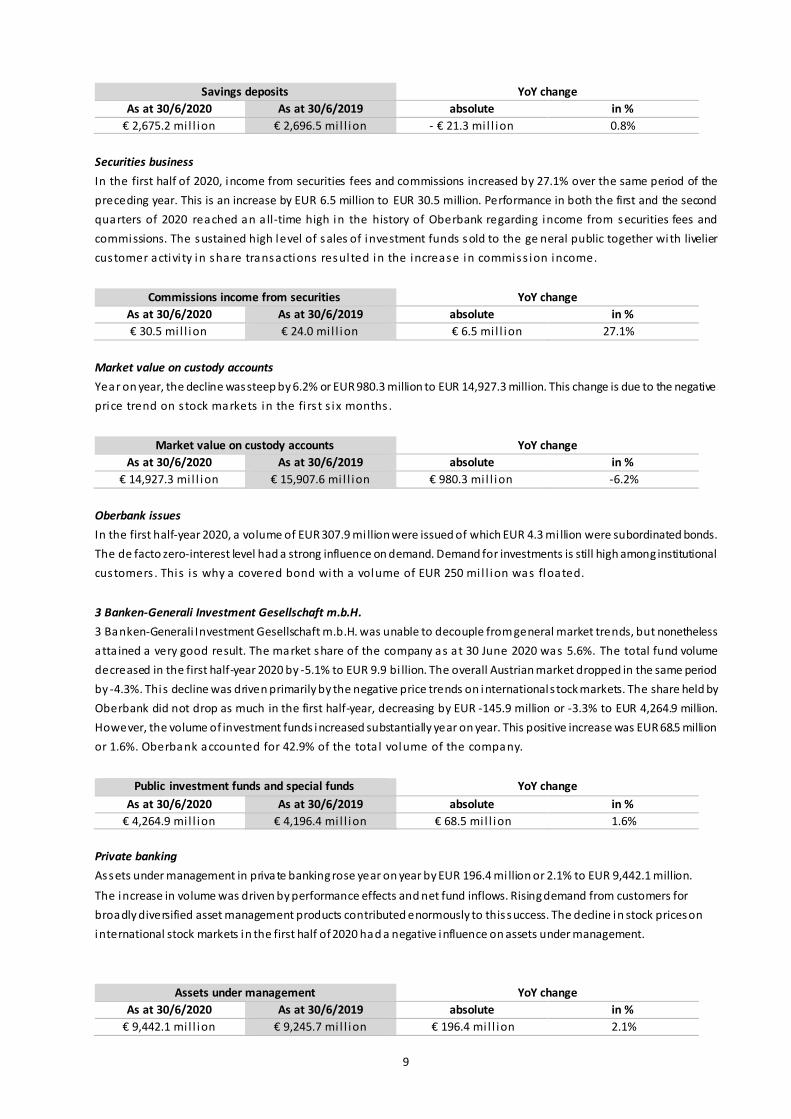
Savings deposits
The volume of savings deposits decreased by EUR 21.3 mi llion or 0.8% to EUR 2,675.2 mi llion compared to 30 June 2019.
Money is still being left on accounts or in daily callable investment forms. Online savings products continue to grow in
s igni ficance and increased by EUR 153.5 mi l l ion or 22.1% s ince the s tart of the year.
9
Savings deposits YoY change
As at 30/6/2020 As at 30/6/2019 absolute in %
€ 2,675.2 mi l l ion € 2,696.5 mi l l ion - € 21.3 mi l l ion 0.8%
Securities business
In the first half of 2020, income from securities fees and commissions increased by 27.1% over the same period of the
preceding year. This is an increase by EUR 6.5 million to EUR 30.5 million. Performance in both the first and the second
quarters of 2020 reached an a ll-time high in the history of Oberbank regarding income from securities fees and
commissions. The sustained high level of sales of investment funds sold to the ge neral public together with livelier
customer activi ty in share transactions resulted in the increase in commiss ion income.
Commissions income from securities YoY change
As at 30/6/2020 As at 30/6/2019 absolute in %
€ 30.5 mi l l ion € 24.0 mi l l ion € 6.5 mi l l ion 27.1%
Market value on custody accounts
Year on year, the decline was steep by 6.2% or EUR 980.3 million to EUR 14,927.3 million. This change is due to the negative
price trend on s tock markets in the fi rs t s ix months .
Market value on custody accounts YoY change
As at 30/6/2020 As at 30/6/2019 absolute in %
€ 14,927.3 mi l l ion € 15,907.6 mi l l ion € 980.3 mi l l ion -6.2%
Oberbank issues
In the first half-year 2020, a volume of EUR 307.9 mi llion were issued of which EUR 4.3 mi llion were subordinated bonds.
The de facto zero-interest level had a strong influence on demand. Demand for investments is still high among institutional
customers . This i s why a covered bond with a volume of EUR 250 mi l l ion was floated.
3 Banken-Generali Investment Gesellschaft m.b.H.
3 Banken-Generali Investment Gesellschaft m.b.H. was unable to decouple from general market trends, but nonetheless
atta ined a very good result. The market share of the company as at 30 June 2020 was 5.6%. The total fund volume
decreased in the first half-year 2020 by -5.1% to EUR 9.9 bi llion. The overall Austrian market dropped in the same period
by -4.3%. This decline was driven primarily by the negative price trends on international s tock markets. The share held by
Oberbank did not drop as much in the first half-year, decreasing by EUR -145.9 million or -3.3% to EUR 4,264.9 million.
However, the volume of investment funds increased substantially year on year. This positive increase was EUR 68.5 million
or 1.6%. Oberbank accounted for 42.9% of the tota l volume of the company.
Public investment funds and special funds YoY change
As at 30/6/2020 As at 30/6/2019 absolute in %
€ 4,264.9 mi l l ion € 4,196.4 mi l l ion € 68.5 mi l l ion 1.6%
Private banking
Assets under management in private banking rose year on year by EUR 196.4 mi llion or 2.1% to EUR 9,442.1 million.
The increase in volume was driven by performance effects and net fund inflows. Rising demand from customers for
broadly diversified asset management products contributed enormously to this success. The decline in stock prices on
international stock markets in the first half of 2020 had a negative influence on assets under management.
Assets under management YoY change
As at 30/6/2020 As at 30/6/2019 absolute in %
€ 9,442.1 mi l l ion € 9,245.7 mi l l ion € 196.4 mi l l ion 2.1%

10
Building and loan associations
In the first half of 2020, Oberbank brokered 4,860 building and loan association contracts, which is 18.5% or 1,105 contracts
less than the result of preceding year. This also reflects the general market situation. With respect to Wüstenrot loans,
Oberbank was clearly above projections in the first half-year 2020 with a volume of EUR 18.1 million in brokered loans .
Insurance services
In the insurance business, total production (life insurance and non-life insurance) declined by 5.3% year on year. The effects
of the corona cris i s were clear.
Insurance contracts - premium volume YoY change
As at 30/6/2020 As at 30/6/2019 absolute in %
€ 57.9 mi l l ion € 61.0 mi l l ion - € 3.1 mi l l ion 5.3%

11
Financial Markets
Financial Markets in € m HY1 2020 HY1 2019 + / - in % + / - in %
Net interest income 8.3 11.7 -3.5 -29.4%
Profi t from entities accounted for by the
equity method -45.0 23.4 -68.4 >-100%
Charges for losses on loans and advances -3.0 -2.1 -0.9 43.6%
Net commission income 0.0 -0.1 0.1 -100.0%
Net trading income -0.2 4.5 -4.7 >-100%
Administrative expenses -5.0 -4.8 -0.2 3.9%
Other operating income -11.1 17.8 -28.9 >-100%
Profi t/loss for the period -56.1 50.5 -106.5 >-100%
Risk equivalent 5,585.5 5,596.8 -11.3 -0.2%
Average a llocated equity 898.6 907.3 -8.7 -1.0%
Return on equity before tax (RoE) n.a . 11.1% n.a .
Cost/income ratio n.a . 8.4% n.a . n.a. = not applicable
Earnings in the Financial Markets segment
The result in Financial Markets dropped by EUR 106.5 mi llion from a positive 50.5% to a negative EUR 56.1 million.
Net interest income decreased by EUR 3.5 mi l l ion or 29.4% to EUR 8.3 mi l l ion.
Income from equity investments decreased from positive EUR 23.4 million by EUR 68.4 million to negative EUR 45.0 million.
Impairment charges increased by EUR 0.9 mi l l ion from EUR 2.1 mi l l ion to EUR 3.0 mi l l ion.
Net trading income decreased by EUR 4.7 mi l l ion from a pos i tive EUR 4.5 mi l l ion to a negative EUR 0.2 mi l l ion.
At EUR 5.0 mi l l ion, adminis trative expenses were EUR 0.2 mi l l ion higher year on year.
Other operating income decreased by EUR 28.9 million from a positive EUR 17.8 million to a negative EUR 11.1 million.
Both RoE and the cost/income ratio are not indicative due to the segment result.
Proprietary trading
The fi rst half of the year 2020 will go down in history as one of the most turbulent periods ever on financial markets. If one
compares stock prices at the start of the year with the prices at the end of the half -year, it does not look like there was
much movement. Nonethless, the fi rst half year was marked by massive plunges on stock markets and distortions of
exchange rates due to the corona crisis. However, in the second quarter, i t was possible to compensate most losses on
s tock markets and foreign exchange markets. Goverment financial aid schemes, liquidity injections by central banks and
hopes of swift economic recovery moti vated investors to take more risks aga in.
This trend is also reflected in the results for the Financial Market segment. In the first quarter of 2020, contributions were
negative from the valuations of existing positions and of the trading book. The decline was largely offset in the second
quarter of 2020.
Liquidity
The current over-liquidity on markets was aggravated by the massive volumes pumped into the market by central banks
in the first half-year 2020. As these funds exceeded demand for loans, the large volumes deposited with the central banks
remained unused and were penalized in Europe with a negative interest rate of -0.5%. This burden impacts banks,
therefore, it is necessary to pass these costs on to customers who hold large volumes on deposit. The volume of customer
deposits increased again in the second half of the year 2020 and the rise in sight deposits reached almost EUR 800 million.
This clearly exceeded demand for loans and further increased over-l iquidi ty, which i s driving up costs .

12
Own funds
Own funds stood at EUR 2,846.6 million as at 30 June 2020, which is a ratio of 18.55%. Tier 1 capital was EUR 2,510.2
mi l lion and the tier 1 capital ratio was 16.36%. Common equity tier 1 capital was EUR 2,460.2 mi llion, which corresponds
to a ratio of 16.03%.
Risk
Oberbank’s ri sk policy takes into account the ri sk s ituation of a ll business areas including the new markets. Risk
management focuses on keeping customer funds entrusted to Oberbank safe, conserving own funds and guaranteeing
l iquidi ty.
The most important ri sk category i s counterparty ri sk. This ri sk is accounted for by recognizing the corresponding
impairment charges on the balance sheet.
When assessing creditworthiness and in col lateral policy, Oberbank can rely on decades of know -how. Moreover, its
bus iness model as a regional bank, professional credit management and a balanced distribution of overall debt across
customer segments helped to contain the threat to Oberbank’s overall result from this risk exposure. Therefore, it may be
ass umed that there wi l l not be any extraordinary counterparty ri sk events in the ful l year 2020.
The other ri sk categories are equity ri sk (risk of loss in va lue or foregone profits in the equity portfolio), market risk (risk
of losses due to fluctuating interest rates, foreign exchange rates or equity prices), operational risk and liquidity risk. These
ri sks are also covered by the corresponding funds in line with the principle of conservatism. In the case of liquidity risk, the
sound position of Oberbank is also supported by the fact that it can refinance the entire credit volume of EUR 17.2 billion
(as at 30 June 2020) with the primary deposits of customers, own issues and deposits from ‘Förderbanken’ (OeKB, LfA,
KfW) amounting to EUR 17.5 bi llion (as at 30 June 2020). Additionally, Oberbank has a permanent ri sk controlling system
in place as well as a strict process management process and other efficient control and management instruments .
Outlook 2020
At present, it is not possible to give an outlook for the development of the bank for the full year. There is no reliable
outlook. Nonetheless, we are confident because Oberbank has an excellent foundation: a solid equity base and a sound
business model.

13
Consolidated Interim Financial Statements pursuant to IFRS for 1/1/2020 to 30/6/2020
Consolidated income statement in €k 1/1 to
30/6/2020
1/1 to 30/6/201
9
Change
in €k
Change
in %
1. Interest and similar income 210,202 222,542 -12,340 -5.5
a ) Interest income based on the effective interest rate method
199,675 206,465 -6,790 -3.3
b) Other provisions for liabilities and charges 10,527 16,077 -5,550 -34.5
2. Interest and similar expenses -40,441 -51,476 11,035 -21.4 Net interest income (1) 169,761 171,066 -1,305 -0.8
3. Profi t from entities accounted for by the equity method (2) -44,980 23,422 -68,402 >-100.0
4. Charges for losses on loans and advances (3) -9,462 925 -10,387 >-100.0
5. Net commission income 97,313 88,751 8,562 9.6 6. Net commission expenses -10,604 -8,561 -2,043 23.9 Net commission income (4) 86,709 80,190 6,519 8.1
7. Net trading income (5) 726 4,409 -3,683 -83.5
8. Administrative expenses (6) -147,500 -142,396 -5,104 3.6
9. Other operating income (7) -18,035 5,223 -23,258 > 100.0 a ) Net income from financial assets - FV/PL -10,786 15,989 -26,775 >-100.0
b) Net income from financial assets - FVOCI -211 208 -419 >-100.0
c) Net income from financial assets - AC 160 1,617 -1,457 -90.1
d) Other operating income -7,198 -12,591 5,393 -42.8 Profi t/loss for the period before tax 37,219 142,839 -105,620 -73.9
10. Income taxes (8) -19,782 -24,390 4,608 -18.9
Profi t/loss for the period after tax 17,437 118,449 -101,012 -85.3 of which attributable to the owners of the parent company and the owners of additional equity components
16,902 117,995 -101,093 -85.7
of which attributable to non-controlling interests
535 454 81 17.8
Other comprehensive income in €k 1/1 to
30/06/2020 1/1 to
30/06/2019
Profi t/loss for the period after tax 17,437 118,449
Items not reclassified to profit or loss for the year 2,911 5,667
+/- Actuarial gains/losses IAS 19 438 -3,795
+/- Deferred taxes on actuarial gains/losses IAS 19 -109 949 +/- Share from entities recognised using the equity method 5,111 -6,866
+/- Va lue changes in own credit risk recognised in equity IFRS 9 38,885 2,350
+/- Deferred tax on changes recognised in equity for own credit risk IFRS 9 -9,721 -587
+/- Va lue changes in equity instruments recognised in equity IFRS 9 -42,260 18,155
+/- Deferred tax on value changes in equity instruments recognised in equity IFRS 9 10,567 -4,539
Items reclassified to profit or loss for the year -15,050 2,908
+/- Va lue changes recognised in equity for debt securities IFRS 9 -2,741 -733
Amounts recognised in equity -2,756 -633
Reclassification adjustments 15 -100
+/- Deferred tax on value changes recognised in equity for debt securities IFRS 9 685 183
Amounts recognised in equity 689 158
Reclassification adjustments -4 25
+/- Exchange differences -4,173 130
+/- Share from entities recognised using the equity method -8,821 3,328

14
1/1 to 30/6/2020 1/1 to 30/6/2019
Total income and expenses recognised directly in equity -12,139 8,575
Total comprehensive income for the period from net profit and income/expenses
not recognised in profit or loss
5,298 127,024
of which attributable to the owners of the parent company and the owners of additional equity components
4,763 126,570
of which attributable to non-controlling interests 535 454
Performance indicators 1/1 to 30/6/2020 1/1 to 30/6/2019
Cost/income ratio in %1) 75.96 50.08
Return on equity before tax in %2) 2.56 10.10
Return on equity after tax in %3) 1.20 8.37
Risk/earnings ratio (credit risk/net interest income) in %4) 5.57 -0.54
Earnings per share in €5)6) 0.99 6.71 1) Administrative expenses in relation to net interest income, equity method, net fee and commission income and net trading income and other
operating income 2) Profit/loss for the year before tax in relation to average shareholders' equity
3) Profit/loss for the year after tax in relation to average shareholders' equity 4) Impairment charge on loans and advances in relation to net interest income 5) Profit/loss for the year after tax in relation to average number of shares in circulation 6) Since no financial instruments with diluting effect were issued, diluted earnings per share were identical with undiluted earnings per share.
Earnings per share were the same for both ordinary and preference shares.

15
Consolidated Interim Financial Statements pursuant to IFRS for 1/4/2020 to 30/06/2020
Consolidated income statement in €k 1/1 to
30/06/2020
1/1 to
30/06/2019
Change in €k
Change in %
1. Interest and similar income 101,114 112,338 -11,224 -10.0 a ) Interest income based on the effective interest rate
method 96,495 103,856 -7,361 -7.1
b) Other provisions for liabilities and charges 4,619 8,482 -3,863 -45.5
2. Interest and similar expenses -17,367 -26,637 9,270 -34.8 Net interest income (1) 83,747 85,701 -1,954 -2.3
3. Profi t from entities accounted for by the equity method (2) 36,700 20,975 15,725 75.0
4. Charges for losses on loans and advances (3) -4,453 -719 -3,734 > 100.0
5. Net commission income 44,733 43,727 1,006 2.3
6. Net commission expenses -4,421 -4,328 -93 2.1
Net commission income (4) 40,312 39,399 913 2.3 7. Net trading income (5) 3,163 3,513 -350 -10.0
8. Administrative expenses (6) -74,657 -72,524 -2,133 2.9 9. Other operating income (7) 27,388 7,037 20,351 > 100.0
a ) Net income from financial assets - FV/PL 23,369 6,686 16,683 > 100.0 b) Net income from financial assets - FVOCI -221 155 -376 >-100.0
c) Net income from financial assets - AC 160 0 160
d) Other operating income 4,080 196 3,884 > 100.0 Profi t/loss for the period before tax 112,200 83,382 28,818 34.6
10. Income taxes (8) -21,039 -13,393 -7,646 57.1 Profi t/loss for the period after tax 91,161 69,989 21,172 30.3
of which attributable to the owners of the parent company and the owners of additional equity components
90,965 69,781 21,184 30.4
of which attributable to non-controlling interests
196 208 -12 -5.8

16
Other comprehensive income in €k 1/4 to
30/06/2020 1/4 to
30/06/2019
Profi t/loss for the period after tax 91,161 69,989
Items not reclassified to profit or loss for the year 4,950 -4,504
+/- Actuarial gains/losses IAS 19 438 -3,795
+/- Deferred taxes on actuarial gains/losses IAS 19 -109 949
+/- Share from entities recognised using the equity method 4,610 -4,088
+/- Va lue changes in own credit risk recognised in equity IFRS 9 9,440 760
+/- Deferred taxes on changes recognised in equity for own credit ri sk IFRS 9 -2,360 -190
+/- Va lue changes in equity instruments recognised in equity IFRS 9 -9,425 2,480
+/- Deferred tax on value changes in equity instruments recognised in equity IFRS 9 2,356 -620
Items reclassified to profit or loss for the year -12,139 1,912
+/- Va lue changes recognised in equity for debt securities IFRS 9 723 -886
Amounts recognised in equity 702 -842
Reclassification adjustments 21 -44
+/- Deferred tax on value changes recognised in equity for debt instruments IFRS 9 -181 221
Amounts recognised in equity -175 210
Reclassification adjustments -6 11
+/- Exchange differences -5,260 -72
+/- Share from entities recognised using the equity method -7,421 2,649
1/4 to 30/06/2020 1/4 to 30/06/2019
Total income and expenses recognised directly in equity -7,189 -2,592
Total comprehensive income for the period from net profit and income/expenses not recognised in profit or loss
83,972 67,397
of which attributable to the owners of the parent company and the owners of additional equity components
83,776 67,189
of which attributable to non-controlling interests 196 208

17
Consolidated balance sheet as at 30/6/2020 / Assets
in €k 30/6/2020 31/12/2019 Change
in €k Change
in %
1. Cash and balances at central banks (10) 1,984,607 371,557 1,613,050 > 100
2. Loans and advances to credit institutions
(11) 782,017 1,522,984 -740,967 -48.7
3. Loans and advances to customers (12) 17,159,131 16,772,172 386,959 2.3
4. Loan loss provisions (13) -205,497 -203,669 -1,828 0.9
5. Trading assets (14) 50,196 40,949 9,247 22.6
6. Financial investments (15) 3,716,090 3,644,639 71,451 2.0
a ) Financial assets - FVPL 574,459 533,355 41,104 7.7
b) Financial assets - FVOCI 432,343 498,185 -65,842 -13.2
c) Financial assets - AC 1,842,036 1,699,022 143,014 8.4
d) Interest in entities accounted for
us ing the equity method
867,252 914,077 -46,825 -5.1
7. Intangible assets (16) 1,680 1,673 7 0.4
8. Property, plant and equipment (17, 18) 414,617 414,794 -177 0.0
a ) Investment property 91,198 92,739 -1,541 -1.7
b) Other property, plant and equipment
323,419
322,055 1,364 0.4
9. Other assets (19) 300,604 263,930 36,674 13.9
a ) Deferred tax assets 31,849 25,367 6,482 25.6
b) Pos itive fair va lues of closed out derivatives in the banking book
148,536 118,657 29,879 25.2
c) Other 120,219 119,906 313 0.3
Total assets 24,203,445 22,829,029 1,374,416 6.0
Consolidated balance sheet as at 30/6/2020 / Equity and liabilities
in €k 30/6/2020 31/12/2019 Change
in €k Change
in %
1. Amounts owed to credit institutions (20) 5,480,144 4,795,833 684,311 14.3
a ) Refinance allocated for customer loans 2,683,200 2,561,437 121,763 4.8
b) Other amounts owed to credit institutions
2,796,944 2,234,396 562,548 25.2
2. Amounts owed to customers (21) 12,572,783 11,980,651 592,132 4.9
3. Securitised liabilities (22) 1,803,359 1,662,863 140,496 8.4
4. Provis ions for liabilities and charges (23) 380,719 381,362 -643 -0.2
5. Other l iabilities (24) 553,294 525,268 28,026 5.3
a ) Trade liabilities (25) 42,880 38,092 4,788 12.6
b) Tax l iabilities 25,696 3,997 21,699 > 100
ba) Current tax liabilities 21,522 250 21,272 > 100
bb) Deferred tax liabilities 4,174 3,747 427 11.4
c) Negative fair values of closed out derivatives in the banking book
33,588 35,030 -1,442 -4.1
c) Other 451,130 448,149 2,981 0.7
6. Subordinated debt capital (26) 468,732 522,515 -53,783 -10.3
7. Equity (27) 2,944,414 2,960,537 -16,123 -0.5
a ) Equity after minorities 2,886,751 2,901,840 -15,089 -0.5
b) Share of non-controlling shareholders 7,663 8,697 -1,034 -11.9
c) Additional equity capital components 50,000 50,000 0 0.0
Total equity and liabilities 24,203,445 22,829,029 1,374,416 6.0

18
Consolidated statement of changes in equity as at 30/6/2020 Revaluation reserve
in €k S
ub
sc
rib
ed
ca
pit
al
Ca
pit
al r
es
erv
es
Re
tain
ed
ea
rnin
gs
Ex
ch
an
ge
dif
fere
nc
es
Re
cla
ss
ifie
d d
eb
t
se
cu
riti
es
IFR
S 9
Eq
uit
y in
str
um
en
ts
IFR
S 9
no
t re
cla
ss
ifie
d
Ch
an
ge
in o
wn
cre
dit
ris
k IF
RS
9 n
ot
rec
las
sif
ied
Ac
tua
ria
l ga
ins
/los
se
s
un
de
r IA
S 1
9
As
so
cia
tes
Eq
uit
y a
fte
r m
ino
riti
es
Sh
are
s o
f n
on
-
co
ntr
olli
ng
sh
are
ho
lde
rs
Ad
dit
ion
al e
qu
ity
ca
pit
al c
om
po
ne
nts
Sh
are
ho
lde
rs' e
qu
ity
As at 01/01/2019 105,769 505,523 1,441,376 -769 2,337 112,535 -11,189 -32,580 618,457 2,741,459 6,437 50,000 2,797,896
Consolidated net profit 103,996 130 -550 13,616 1,763 -2,846 10,461 126,570 454 127,024
Net profit/loss for the year 103,996 13,999 117,995 454 118,449
Other comprehensive income 130 -550 13,616 1,763 -2,846 -3,538 8,575 8,575
Dividend distribution -38,811 -38,811 -38,811
Coupon payments on additional equity components
-1,725 -1,725 -1,725
Capital increase
Issuance of additional equity
components
Repurchased own shares 69 1,776 1,845 1,845
Other changes not recognised in income
-434 8,588 8,154 -260 7,894
As at 30/6/2019 105,838 505,523 1,506,178 -639 1,787 126,151 -9,426 -35,426 637,506 2,837,491 6,631 50,000 2,894,122
As at 1/1/2020 105,844 505,523 1,605,472 -1,365 1,414 126,729 -9,522 -48,552 616,297 2,901,840 8,697 50,000 2,960,537
Consolidated net profit 65,989 -4,173 -2,056 -31,693 29,164 329 -52,797 4,763 535 5,298
Net profit/loss for the year 65,989 -49,087 16,902 535 17,437
Other comprehensive income -4,173 -2,056 -31,693 29,164 329 -3,710 -12,139 -12,139
Dividend distribution -529 -529 -529
Coupon payments on additional
equity components
-1,725 -1,725 -1,725
Capital increase
Issuance of additional equity components
Repurchased own shares -668 -17,863 -18,531 -18,531
Other changes not recognised in
income
851 82 933 -1,569 -636
As at 30/6/2020 105,176 505,523 1,652,195 -5,538 -642 95,036 19,642 -48,223 563,582 2,886,751 7,663 50,000 2,944,414
19
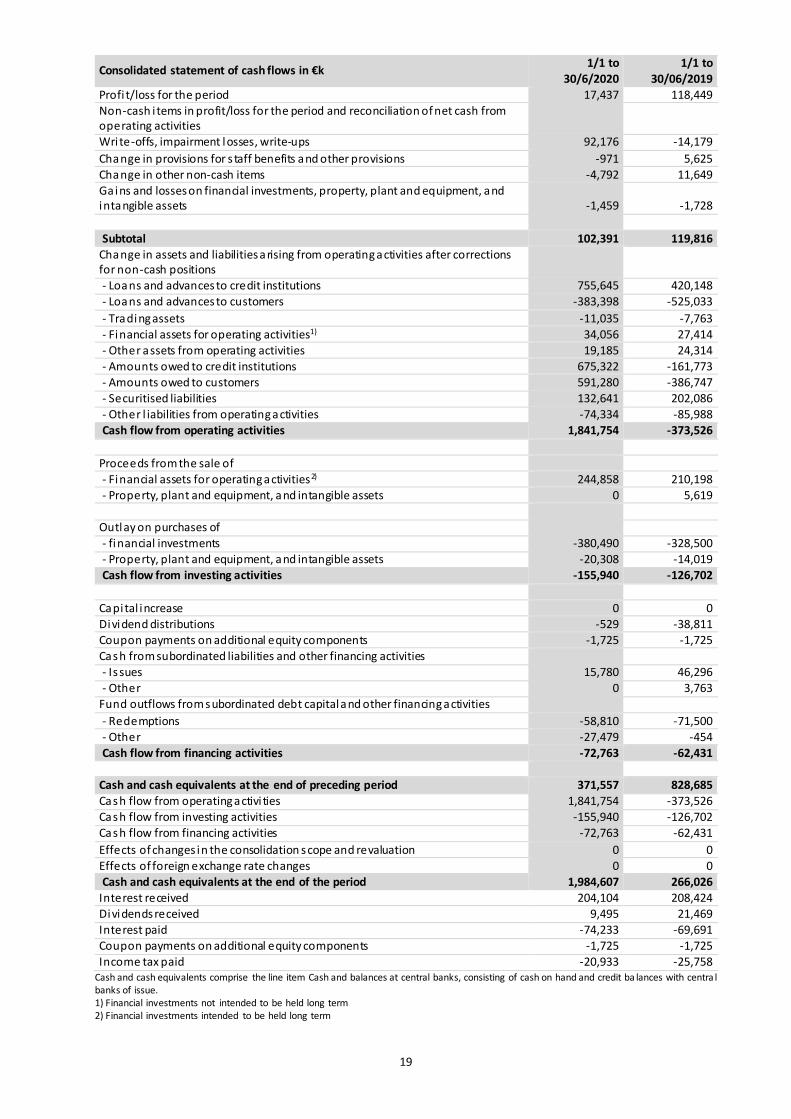
Cash and cash equivalents comprise the line item Cash and balances at central banks, consisting of cash on hand and credit ba lances with centra l banks of issue. 1) Financial investments not intended to be held long term 2) Financial investments intended to be held long term
Consolidated statement of cash flows in €k 1/1 to
30/6/2020 1/1 to
30/06/2019
Profi t/loss for the period 17,437 118,449 Non-cash i tems in profit/loss for the period and reconciliation of net cash from operating activities
Wri te-offs, impairment losses, write-ups 92,176 -14,179
Change in provisions for s taff benefits and other provisions -971 5,625 Change in other non-cash items -4,792 11,649
Gains and losses on financial investments, property, plant and equipment, and intangible assets
-1,459
-1,728
Subtotal 102,391 119,816 Change in assets and liabilities arising from operating activities after corrections for non-cash positions
- Loans and advances to credit institutions 755,645 420,148
- Loans and advances to customers -383,398 -525,033
- Trading assets -11,035 -7,763
- Financial assets for operating activities1) 34,056 27,414 - Other assets from operating activities 19,185 24,314
- Amounts owed to credit institutions 675,322 -161,773 - Amounts owed to customers 591,280 -386,747 - Securitised liabilities 132,641 202,086
- Other l iabilities from operating activities -74,334 -85,988 Cash flow from operating activities 1,841,754 -373,526 Proceeds from the sale of
- Financial assets for operating activities2) 244,858 210,198 - Property, plant and equipment, and intangible assets 0 5,619
Outlay on purchases of
- financial investments -380,490 -328,500 - Property, plant and equipment, and intangible assets -20,308 -14,019 Cash flow from investing activities -155,940 -126,702
Capital increase 0 0
Dividend distributions -529 -38,811 Coupon payments on additional equity components -1,725 -1,725
Cash from subordinated liabilities and other financing activities - Is sues 15,780 46,296
- Other 0 3,763 Fund outflows from subordinated debt capital and other financing activities
- Redemptions -58,810 -71,500 - Other -27,479 -454
Cash flow from financing activities -72,763 -62,431 Cash and cash equivalents at the end of preceding period 371,557 828,685
Cash flow from operating activi ties 1,841,754 -373,526 Cash flow from investing activities -155,940 -126,702
Cash flow from financing activities -72,763 -62,431
Effects of changes in the consolidation scope and revaluation 0 0
Effects of foreign exchange rate changes 0 0 Cash and cash equivalents at the end of the period 1,984,607 266,026
Interest received 204,104 208,424 Dividends received 9,495 21,469
Interest paid -74,233 -69,691 Coupon payments on additional equity components -1,725 -1,725
Income tax paid -20,933 -25,758
20
Notes to the consolidated financial statements
Summary of accounting policies
The consolidated financial statements of Oberbank AG have been prepared in accordance with the Interna tional Financial
Reporting Standards (IFRS) published by the International Accounting Standards Board (IASB) as in force and as adopted
by the EU and the interpretations thereof by the International Financial Reporting Interpretations Committee (IFRIC). The
consolidated financial statements cover the first half-year 2020 (1 January 2020 until 30 June 2020) and compare the
results with the corresponding period of the preceding year. This interim report for the first quarter of 2020 complies with
IAS 34 (“Interim Reports”). The abbreviated interim report has not been audited. We have not applied s tandards and
interpretations that wi l l take effect as of the financia l year 2021 or later.
Changes to accounting policies 2020
This interim report of Oberbank AG has been drafted using the same recognition and measurement policies applied as at
31 December 2019. An exception are the s tandards and interpretations that apply to financial years that start on or after
1 January 2020. Only those new standards and interpretations are presented that are relevant for the operating activities
of Oberbank.
The fol lowing s tandards and interpretations , as amended, have been mandatory s ince January 2020.
Conceptual Framework – Revised References to the Conceptual Framework in the IFRS Standards
Amendments to IAS 1 and IAS 8 – Defini tion of ‘materia l ’
Amendment to IFRS 9, IAS 39 and IFRS 7 – Interest Rate Benchmark Reform
Amendment to IFRS 3 - Defini tion of a bus iness
IASB (International Accounting Standards Board) published a revised Conceptual Framework for Financial Reporting in
March 2018. The revised Conceptual Framework for Financial Reporting consists of a new Chapter ‘Status and purpose of
the conceptual framework’ as well as eight further chapters. This does not result in any material effects on the consolidated
financia l s tatements of Oberbank.
With the amendment to IAS 1 and IAS 8, a uni form and precise definition of materiality of information in financial
s tatements was created that aims to harmonise the conceptual framework for financial reporting, IAS 1 and IAS 8 as well
as the IFRS practice statement on ‘Making Materiality Judgements’. This d oes not result in any material effects on the
consol idated financia l s tatements of Oberbank.
The amendments to IFRS 9, IAS 39 and IFRS 7 refer, in particular, to certain easements with respect to hedge accounting
rules that are mandatory for all hedging contracts affected by the reform of the reference interest rate. Moreover, further
information must be provided as to the extent the amendment affects the hedging contracts of the company. This does
not result in any materia l effects on the consol idated financia l s tatements of Oberbank.
The amendment to IFRS 3 refers to the change to the defini tion of a bus iness .
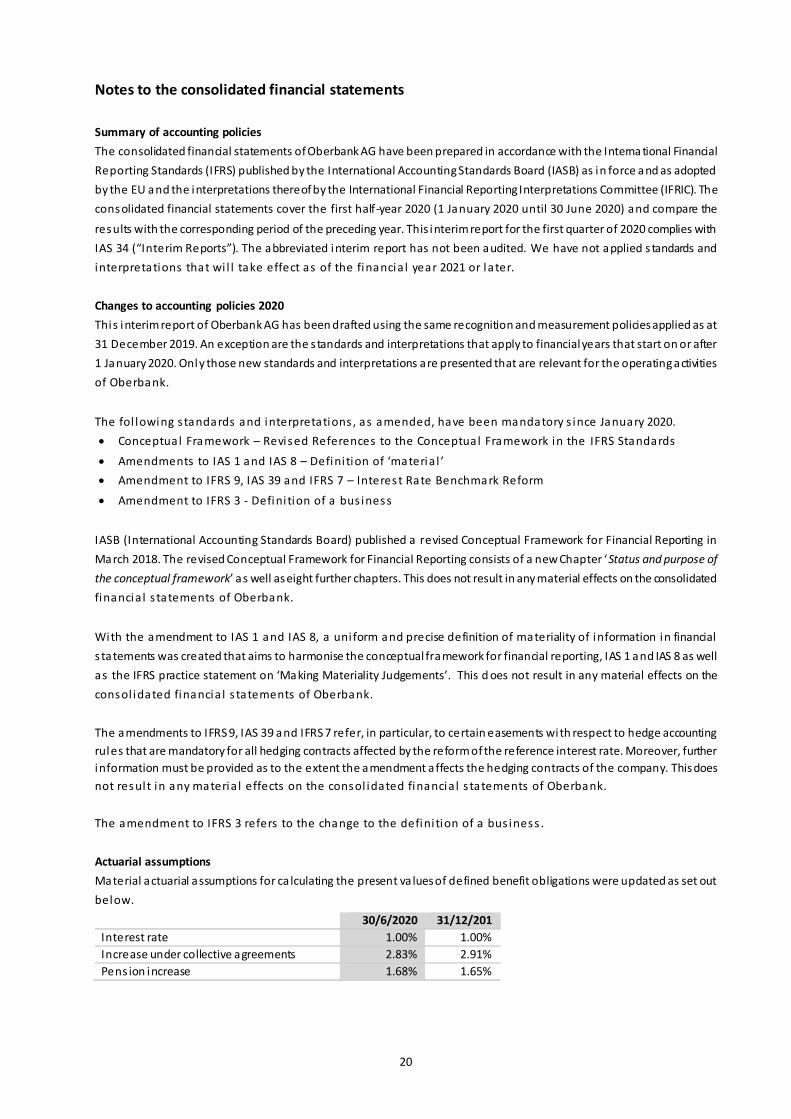
Actuarial assumptions
Material actuarial assumptions for ca lculating the present va lues of defined benefit obligations were updated as set out
below.
30/6/2020 31/12/2019 Interest rate 1.00% 1.00%
Increase under collective agreements 2.83% 2.91%
Pens ion increase 1.68% 1.65%
21
Oberbank group of consolidated companies
The Group consolidated companies as at 30 June 2020 included, apart from Oberbank AG, 29 Austrian and 18 foreign
subs idiaries . Compared to 31 December 2019, the group of consol idated companies did not change.
Effects of the coronavirus pandemic on the interim results of the Group
1) Background
The coronavirus pandemic has been a predominant theme for months with curfews, closed restaurant and shops as well
as production standstills that have caused as of yet inconceivable, severe changes to the public and private lives of people
in Austria and worldwide. Hardly anyone can reliably assess the effects of this global crisis at present. Many companies
are affected by collapsing sales markets despite the meanwhile eased restrictions. In many countries, various measures
have been initiated and a id packages adopted to support the economy and private households as best as possible during
this crisis that is threatening their existence. The following explanations present updated information and the key aspects
of the current effects of the coronavirus pandemic on the interim financia l s tatements of Oberbank AG.
2) Discretionary decisions, assumptions and estimates
These consolidated financial statements contain values whose amounts were arrived at based on discretionary decisions,
assumptions and estimates. These assumptions and estimates are based on past experience, budgets and forecasts of
future events that appear l ikely from our current perspective.
Due to the currently unpredictable global consequences of the coronavirus pandemic, these estimates and discretionary
decisions are subject to a high degree of uncertainty. The amounts actually reported may differ from the estimates and
discretionary decisions. Such changes may have material effects on the consolidated financial s tatements. The updated
estimates and discretionary decisions took into cons ideration a l l ava ilable information on the probable further
development of the economy.
Updated discretionary decisions, assumptions and estimates contained in these consolidated financial s tatements
genera l ly refer to the fol lowing i tems:
Risk provisions
The measurement of risk provisions depends mainly on expectations regarding future loan losses and the structure and
quality of the loan portfolio. In addition, the calculation of any future charges for impairment losses requires estimates of
the amounts and dates of future cash flows. Further deta i l s are given in 3) Risks of financia l instruments .
Fair value of financial instruments
Where the fair va lue of financial assets and financial l iabilities cannot be measured using current s tock market prices
because no publicly quoted market prices are available, model va lues are used. The va luation models, input parameters,
the fa ir value hierarchy and the fair va lues of financial instruments are described in detail in Note 32 Fair va lue of financial
instruments and other i tems regarding reconci l iation as at 30 June 2020.
Impairment losses on investments accounted for using the equity method
If there is objective evidence for impairment of an investment accounted for using the equity method, a value in use is
ca lculated on the basis of the estimated future cash flows. Details regarding the effects of the coronavirus pandemic are
given in 3) Risks of financia l instruments .
3) Risk of financial instruments
Effects of the coronavirus pandemic on the impairment model for financial instruments pursuant to IFRS 9
The rapid spread of COVID-19 throughout Europe and the effects on the European economy have motivated both national
as well as European authorities to take a number of measures to ensure that banks will be able to continue providing funds
to the rea l economy.
22
Despite widespread uncertainty with respect to the duration and depth of the crisis for the real economy, it is clear that a
s ignificant downturn of the economy lies ahead, which, among other things, will result in reduced credit quality, and
therefore, ra ise the level of impairment charges to be recognised.
The measures taken, especially by national governments, also include far-reaching payment deferrals passed into law. The
European Banking Authori ty (EBA) clari fied the fol lowing points in i ts Guidel ines :
The government-declared payment moratoria in response to COVID-19 pandemic are not to be automatically
classified as forbearance.
The broad sectoral private measures are not to be classified as forbearance if they meet the criteria of the EBA
Guidelines.
With these clarifications, the national and European supervisory authorities provide banks with eased conditions as a way
to avoid excessive pro-cyclicity when a llocating ri sk provisions. In a l l other instances, a case-by-case examination is
conducted to check if forbearance is given, and consequently, a qualitative trigger for an ECL stage transfer model. Before
this backdrop, the payment deferrals applicable due to the COVID-19 cris is mostly do not trigger any SICR events
(Signi ficant Increase in Credit Risk) at Oberbank.
Furthermore, EBA and ESMA have also stated that payment defaults in connection with the COVID-19 measures do not
necessarily represent a qualitative trigger event for a s tage transfer. In fact, when modifications to payment terms are
agreed with borrowers, this automatically results in a new payment plan. Only i f these new payment modalities are
breached would the trigger “30-day payment default” of the s tage transfer model become effective.
The third material aspect refers to the consideration of “forward-looking information” (FLI) in the impairment model. The
substantial downward corrections of economic forecasts by many institutions automatically resulted in effects on the
point-in-time default probabilities (PIT-PD). The macroeconomic forecasts were revised downwards several times during
the COVID-19 crisis and are now indicating a deep recession for the economic year 2020, however, with a clear recovery
for the coming year. Therefore, after the government support measures expire, we expect a significant influence on the
default rates , a lbei t with a certa in delay, in the overa l l portfol io in the coming 12 months .
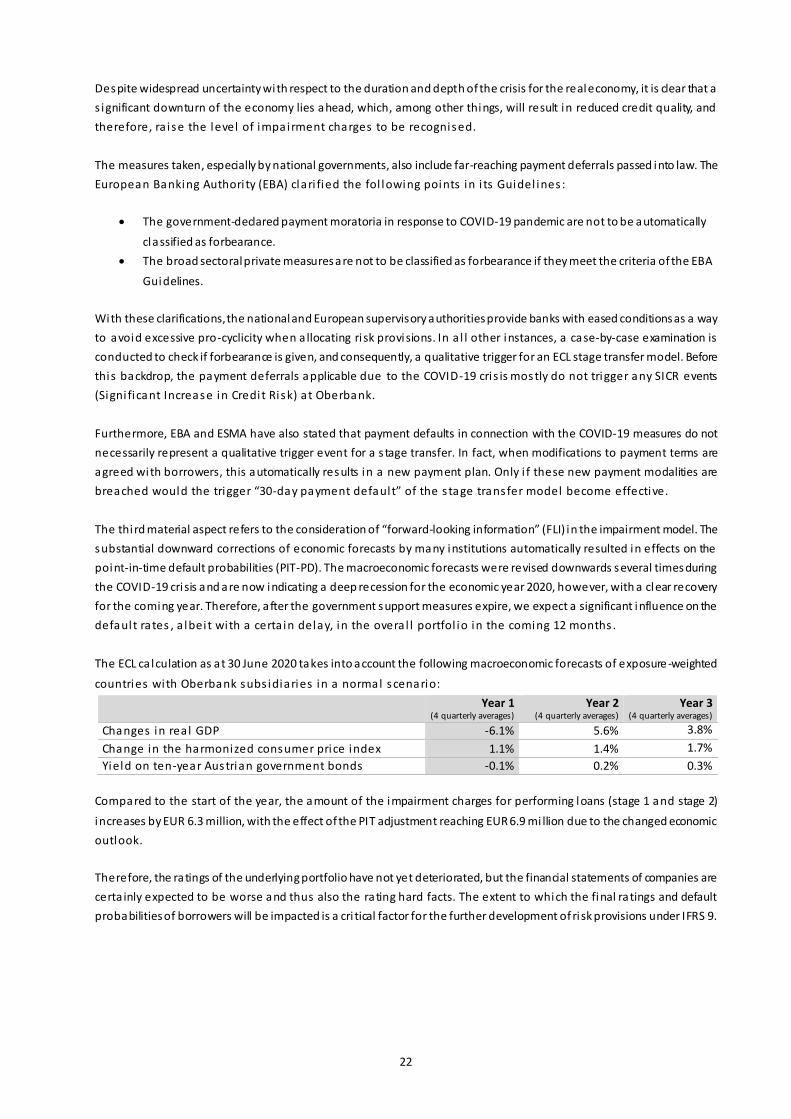
The ECL ca lculation as at 30 June 2020 takes into account the following macroeconomic forecasts of exposure-weighted
countries with Oberbank subs idiaries in a normal scenario:
Year 1
(4 quarterly averages) Year 2
(4 quarterly averages) Year 3
(4 quarterly averages)
Changes in rea l GDP -6.1% 5.6% 3.8%
Change in the harmonized consumer price index 1.1% 1.4% 1.7%
Yield on ten-year Austrian government bonds -0.1% 0.2% 0.3%
Compared to the start of the year, the amount of the impairment charges for performing loans (stage 1 and stage 2)
increases by EUR 6.3 million, with the effect of the PIT adjustment reaching EUR 6.9 mi llion due to the changed economic
outlook.
Therefore, the ratings of the underlying portfolio have not yet deteriorated, but the financial statements of companies are
certa inly expected to be worse and thus also the rating hard facts. The extent to which the final ratings and default
probabilities of borrowers will be impacted is a cri tical factor for the further development of ri sk provisions under IFRS 9.
23
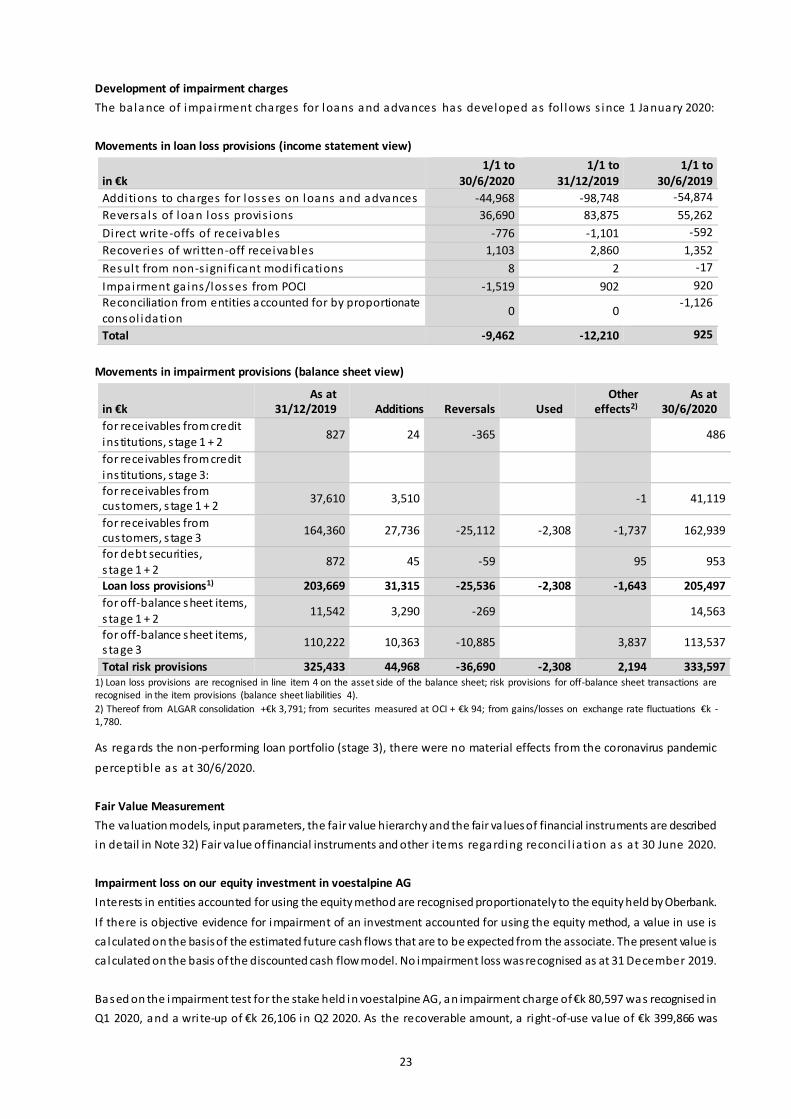
Development of impairment charges
The balance of impairment charges for loans and advances has developed as fol lows s ince 1 January 2020:
Movements in loan loss provisions (income statement view)
in €k 1/1 to
30/6/2020 1/1 to
31/12/2019 1/1 to
30/6/2019
Additions to charges for losses on loans and advances -44,968 -98,748 -54,874
Reversa ls of loan loss provis ions 36,690 83,875 55,262
Direct wri te-offs of receivables -776 -1,101 -592
Recoveries of wri tten-off receivables 1,103 2,860 1,352
Result from non-s igni ficant modifications 8 2 -17
Impairment ga ins/losses from POCI -1,519 902 920
Reconciliation from entities accounted for by proportionate consol idation
0 0 -1,126
Total -9,462 -12,210 925
Movements in impairment provisions (balance sheet view)
in €k As at
31/12/2019 Additions Reversals Used Other
effects2) As at
30/6/2020
for receivables from credit
institutions, s tage 1 + 2 827 24 -365 486
for receivables from credit
institutions, s tage 3:
for receivables from customers, s tage 1 + 2
37,610 3,510 -1 41,119
for receivables from customers, s tage 3
164,360 27,736 -25,112 -2,308 -1,737 162,939
for debt securities, s tage 1 + 2
872 45 -59 95 953
Loan loss provisions1) 203,669 31,315 -25,536 -2,308 -1,643 205,497
for off-balance sheet items,
s tage 1 + 2 11,542 3,290 -269 14,563
for off-balance sheet items, s tage 3
110,222 10,363 -10,885 3,837 113,537
Total risk provisions 325,433 44,968 -36,690 -2,308 2,194 333,597 1) Loan loss provisions are recognised in line item 4 on the asset side of the balance sheet; risk provisions for off-balance sheet transactions are recognised in the item provisions (balance sheet liabilities 4).
2) Thereof from ALGAR consolidation +€k 3,791; from securites measured at OCI + €k 94; from gains/losses on exchange rate fluctuations €k -1,780.
As regards the non-performing loan portfolio (stage 3), there were no material effects from the coronavirus pandemic
perceptible as at 30/6/2020.
Fair Value Measurement
The va luation models, input parameters, the fair value hierarchy and the fair va lues of financial instruments are described
in detail in Note 32) Fair va lue of financial instruments and other i tems regarding reconci l iation as at 30 June 2020.
Impairment loss on our equity investment in voestalpine AG
Interests in entities accounted for using the equity method are recognised proportionately to the equity held by Oberbank.
If there is objective evidence for impairment of an investment accounted for using the equity method, a value in use is
ca lculated on the basis of the estimated future cash flows that are to be expected from the associate. The present value is
ca lculated on the basis of the discounted cash flow model. No impairment loss was recognised as at 31 December 2019.
Based on the impairment test for the stake held in voestalpine AG, an impairment charge of €k 80,597 was recognised in
Q1 2020, and a wri te-up of €k 26,106 in Q2 2020. As the recoverable amount, a right-of-use va lue of €k 399,866 was
24
recognised as at 30 June 2020 (31 March 2020: €k 372,377) as the higher va lue from the comparison of the right-of-use
va lue and the fair value minus cost of sale. The determination of the right-of-use value is based on the present value of
the expected payment flows l ikely to be earned by voestalpine AG. The discount rate used as at 30 June 2020 in the
terminal value is the WACC (Weighted Average Cost of Capital) of 7.47% (31 March 2020: 7.67%; 31 Dec. 2019: 6.50%). A
change to the discount rate by +/- 25 basis points would result in a reduction in the right-of-use value by 7.84% or an
increase by 8.51%, while a change to the discount interest rate by +/- 50 basis points would reduce the right-of-use value
by 15.10% or increase i t by 17.78%.
The determination of the capital cost as at the reporting date 31 March 2020 revealed the higher degree of insecurity
caused by the coronavirus pandemic which also resulted in equity investors and lenders demanding higher yields which
were subsequently reduced again until the end of June 2020. In addition to the volatile capital costs, the insecurity caused
by the coronavirus was a lso seen in the expected payment flows l ikely to be earned by voesta lpine AG.
4) Impairment losses for non-financial assets and deferred tax assets on loss carryforwards
Oberbank has non-financial assets in intangible assets; property, plant and equipment; investment property; and right-of-
use assets on leased objects. Assets are accounted for at amortised costs. There were no indications for impairment losses
such as branch closures, declining demand for banking products, s ignificant changes to right-of-use assets and
reassessment of usable life. The fair va lue of investment property was €k 104,920 (31 Dec. 2019: €k 107,450). The decline
i s due to the depreciation over time. Currently there are no signs of additional market adjustments on the real estate
market due to the effects of the coronavirus pandemic.
Oberbank AG capitalised deferred tax assets on loss carryforwards to a minor extent of around €k 697 (31 Dec. 2019: €k
740). The coronavirus pandemic has not changed the earnings situation of the group companies from which the loss
carryforwards result. The tax loss carryforwards remain unchanged.
The rel ief measures issued by IASB in May 2020 on the application of IFRS 16 granting lessees accounting concessions in
the case of, for example, lease payment deferrals and rent reductions, which are directly related to the coronavirus
pandemic, are not of relevance for Oberbank at present. The Oberbank as the lessee has not made use of the options of
lease payment deferrals or rent reductions. The final adoption of the relief measures regarding the application of IFRS 16
in EU law is s ti l l pending.
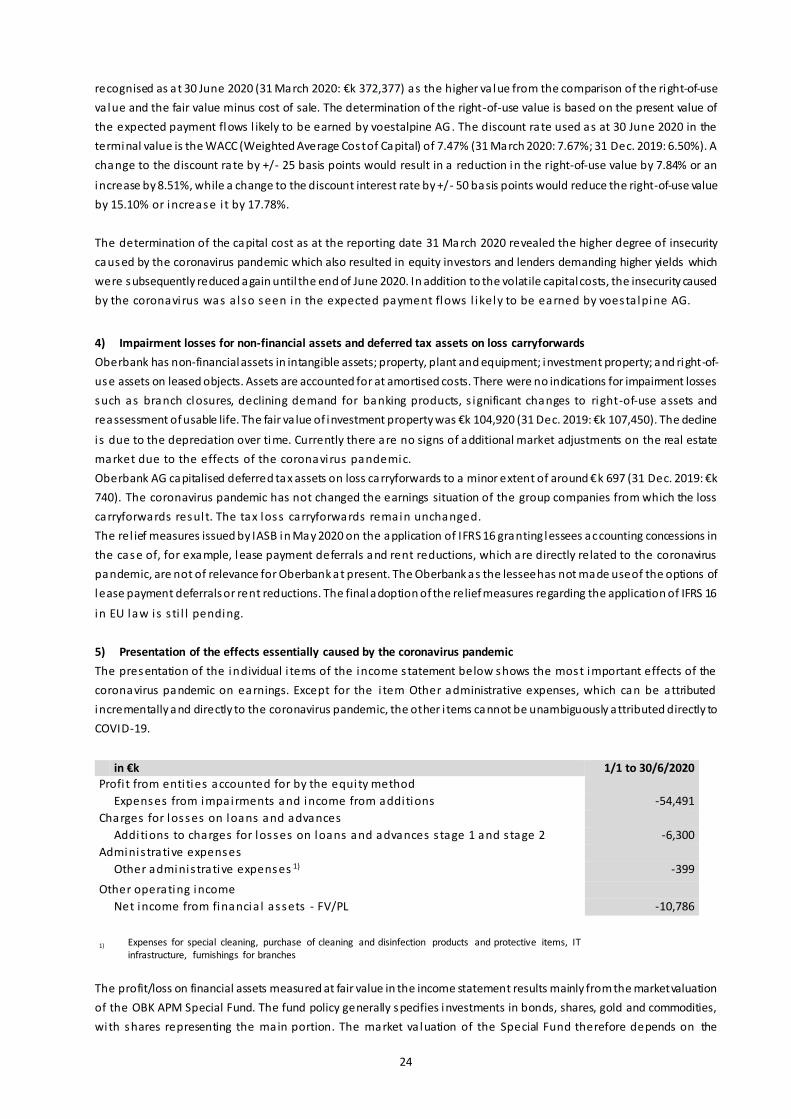
5) Presentation of the effects essentially caused by the coronavirus pandemic
The presentation of the individual i tems of the income statement below shows the most important effects of the
coronavirus pandemic on earnings. Except for the i tem Other administrative expenses, which can be attributed
incrementally and directly to the coronavirus pandemic, the other i tems cannot be unambiguously attributed directly to
COVID-19.
in €k 1/1 to 30/6/2020 Profi t from enti ties accounted for by the equity method
Expenses from impairments and income from additions -54,491
Charges for losses on loans and advances Additions to charges for losses on loans and advances s tage 1 and s tage 2 -6,300
Adminis trative expenses Other adminis trative expenses 1) -399
Other operating income Net income from financia l assets - FV/PL -10,786
1) Expenses for special cleaning, purchase of cleaning and disinfection products and protective items, IT infrastructure, furnishings for branches
The profit/loss on financial assets measured at fair value in the income statement results mainly from the market valuation
of the OBK APM Special Fund. The fund policy generally specifies investments in bonds, shares, gold and commodities,
with shares representing the main portion. The market va luation of the Special Fund therefore depends on the

25
development of stock markets, which have suffered heavy losses since 24 February 2020 due to the global coronavirus
pandemic (start of plunging prices on international capital markets). Thus, for example, the Austrian leading index, ATX,
lost around 38% in the course of 2020 unti l 31 March 2020 and around 30% unti l 30 June 2020.
Moreover, reduced dividend distributions from equity investments are expected for which the reductions due to the
coronavirus cannot be clearly quanti fied.
6) Material events since the close of the financial year
No events of materia l s igni ficance occurred after the reporting date 30 June 2020.

26
Details of the income statement in €k
1) Net interest income 1/1 to 30/6/2020 1/1 to 30/6/2019
Interest income from
Credit and money market operations 181,196 183,027
Shares and other variable-yield securities 1,870 3,260
Other equity investments 3,190 5,814
Subsidiaries 328 2,971
Fixed-interest securities and bonds 23,618 27,470
Interest and similar income 210,202 222,542
Interest expenses for
Deposits -22,850 -30,522
Securitised liabilities -9,479 -10,535
Subordinated liabilities -8,112 -10,419
Interest and similar expenses -40,441 -51,476
Net interest income 169,761 171,066
2) Income from entities recognised using the equity method 1/1-30/6/2020 1/1-30/6/2019
Net amounts from proportionately recognised income 4,592 23,422
Expenses from operating leases -80,597 0
Income from write-ups 26,106 0
Income from write-ups due to purchases 4,919 0
Profi t from entities accounted for by the equity method -44,980 23,422
3) Charges for losses on loans and advances 1/1 to 30/6/2020 1/1 to 30/6/2019
Additions to charges for losses on loans and advances -44,968 -56,000
Direct write-offs -776 -592
Reversals of charges for losses on loans and advances 36,690 55,262
Recoveries of written-off receivables 1,103 1,352
Result of non-significant modifications 8 -17
Result of POCI financial instruments -1,519 920
Charges for losses on loans and advances -9,462 925
4) Net commission income 1/1 to 30/6/2020 1/1 to 30/6/2019
Net commission income:
Payment services 29,817 30,488
Securities business 34,748 27,923
Foreign exchange, foreign bank notes and precious metals 8,062 8,231
Credit operations 20,200 19,939
Other service and advisory business 4,486 2,170
Tota l net commission income 97,313 88,751
Net commission expenses:
Payment services 2,095 2,349
Securities business 4,262 3,863
Foreign exchange, foreign bank notes and precious metals 290 271
Credit operations 2,338 1,848
Other service and advisory business 1,619 230
Tota l commission expenses 10,604 8,561
Net commission income 86,709 80,190
5) Net trading income 1/1-30/6/2020 1/1-30/6/2019
Gains/losses on interest rate contracts -376 941
Gains/losses on foreign exchange, foreign bank note and coins 3,068 3,923
Gains/losses on derivatives -1,966 -455
Net trading income 726 4,409

27
6) Administrative expenses 1/1 to 30/6/2020 1/1 to 30/6/2019
Staff costs 88,521 86,368
Other administrative expenses 44,188 42,116
Write-offs and impairment allowances 14,791 13,912
Administrative expenses 147,500 142,396
7) Other operating income 1/1 to 30/6/2020 1/1 to 30/6/2019
a) Net income from financial assets - FVTPL -10,786 15,989
thereof from designated financial instruments 2,690 3,674
thereof financial instruments with mandatory measurement at FVPL -13,476 12,315
b) Net income from financial assets - FVOCI -211 208
thereof from the measurement of debt instruments -321 32
thereof from the sale and derecognition of debt instruments 110 176
c) Net income from financial assets - AC 160 1,617
d) Other operating result -7,198 -12,591
Other operating income 24,501 18,520
Income from operational risks 6,752 1,351
Gains from the sale of land and buildings 289 0
Income from private equity investments 2,496 1,035
Income from operating leases 7,891 8,662
Other income from the leasing sub-group 3,167 3,075
Brokerage fees from third parties 2,216 2,078
Other 1,690 2,319
Other operating expenses -31,699 -31,111
Expenses from operational risks -2,013 -4,242
Stability tax -3,009 -2,354
Contributions to the resolution fund and deposit protection scheme Expenses from operating leases
-14,230 -12,392
Expenses from operating leases -5,881 -7,591
Other income from the leasing sub-group -4,006 -3,418
Other -2,560 -1,114
Balance of other operating income net/other operating expenses -18,035 5,223
8) Income taxes 1/1 to 30/6/2020 1/1 to 30/6/2019
Current income tax expense 24,296 16,463
Deferred income tax expenses (income) -4,514 7,927
Income taxes 19,782 24,390
9) Earnings per share in € 1/1 to 30/6/2020 1/1 to 30/6/2019
Number of shares as at 30/6 35,307,300 35,307,300
Average number of shares in issue 35,125,812 35,284,286
Profi t/loss for the period after tax 17,437 118,449
Earnings per share in € 0.50 3.36
Annualised values 0.99 6.71
Since no financial instruments with diluting effect were issued, diluted earnings per share were identical with undiluted earnings per share. Earnings per share were the same for both ordinary and preference shares .
Details of the balance sheet in €k
10) Cash and balances at central banks 30/6/2020 31/12/2019
Cash in hand 103,358 98,007 Credit balances with central banks of issue 1,881,249 273,550
Cash and balances with central banks 1,984,607 371,557
11) Loans and advances to credit institutions 30/6/2020 31/12/2019
Loans and advances to Austrian credit institutions 217,579 130,624
Loans and advances to foreign credit institutions 564,438 1,392,360
Loans and advances to credit institutions 782,017 1,522,984
28
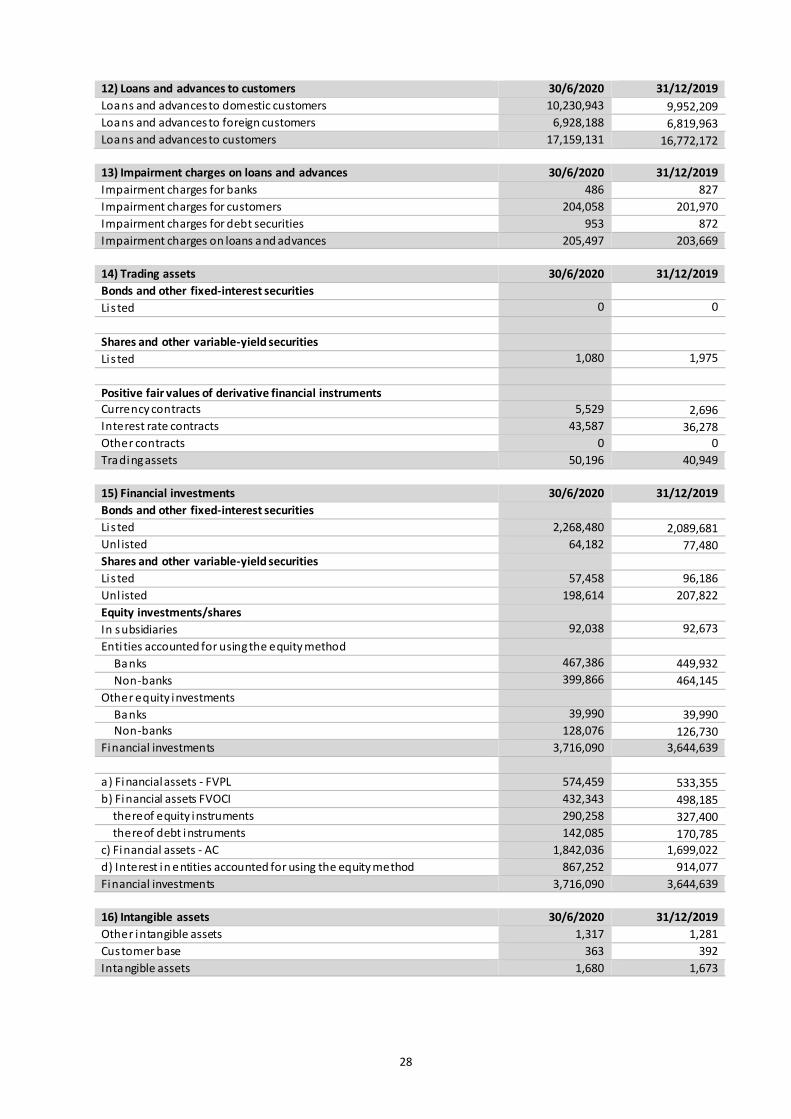
12) Loans and advances to customers 30/6/2020 31/12/2019
Loans and advances to domestic customers 10,230,943 9,952,209
Loans and advances to foreign customers 6,928,188 6,819,963 Loans and advances to customers 17,159,131 16,772,172
13) Impairment charges on loans and advances 30/6/2020 31/12/2019
Impairment charges for banks 486 827
Impairment charges for customers 204,058 201,970
Impairment charges for debt securities 953 872
Impairment charges on loans and advances 205,497 203,669
14) Trading assets 30/6/2020 31/12/2019
Bonds and other fixed-interest securities
Li s ted 0 0
Shares and other variable-yield securities
Li s ted 1,080 1,975
Positive fair values of derivative financial instruments
Currency contracts 5,529 2,696 Interest rate contracts 43,587 36,278
Other contracts 0 0
Trading assets 50,196 40,949
15) Financial investments 30/6/2020 31/12/2019
Bonds and other fixed-interest securities
Li s ted 2,268,480 2,089,681
Unl isted 64,182 77,480 Shares and other variable-yield securities
Li s ted 57,458 96,186
Unl isted 198,614 207,822
Equity investments/shares
In subsidiaries 92,038 92,673
Enti ties accounted for using the equity method
Banks 467,386 449,932
Non-banks 399,866 464,145
Other equity investments
Banks 39,990 39,990
Non-banks 128,076 126,730 Financial investments 3,716,090 3,644,639
a ) Financial assets - FVPL 574,459 533,355
b) Financial assets FVOCI 432,343 498,185 thereof equity instruments 290,258 327,400
thereof debt instruments 142,085 170,785 c) Financial assets - AC 1,842,036 1,699,022
d) Interest in entities accounted for using the equity method 867,252 914,077
Financial investments 3,716,090 3,644,639
16) Intangible assets 30/6/2020 31/12/2019
Other intangible assets 1,317 1,281
Customer base 363 392
Intangible assets 1,680 1,673

29
17) Property, plant and equipment 30/6/2020 31/12/2019
Investment property 91,198 92,739
Land and buildings 95,019 93,212
Bus iness equipment and furnishings 59,642 63,067
Other property, plant and equipment 18,657 25,193
Right of use for leased objects 150,101 140,583
Property, plant and equipment 414,617 414,794
18) Lease contracts in which Oberbank is lessee
The lease contracts entered into by Oberbank relate mainly to rentals for branch premises and office space as well as to bui lding rights and tenancy right for plots of land, garages, business equipment and furnishings, and vehicles. The leasing
contracts do not involve any s ignificant restrictions or commitments. There were no sale-and-leaseback transactions. The results in the consolidated balance sheet, consolidated income statement and consolidated statement of cash flows for
Oberbank as a lessee are presented below for the fi rs t ha l f -year 2020/as at 30 June 2020:
Leasing in the consolidated balance sheet 30/6/2020 31/12/2019
Property, plant and equipment 150,101 140,583
Right of use for land and buildings 145,063 135,800
Right of use for business equipment and furnishings 612 534
Right of use for other property, plant and equipment 1,225 1,530
Right of use in investment property 3,200 2,719
Other l iabilities
Leasing liabilities 150,746 140,991
Additions to rights of use in the first half-year of 2020 were €k 20,718. Cash outflows for leasing liabilities amounted to €k
7,722.
Leasing in the consolidated income statement 1/1 to
30/6/2020 1/1 to
30/6/2019
Interest expenses for leasing liabilities 432 430
Administrative expenses 7,530 8,485
Depreciation/amortisation for rights of use to land and buildings 6,707 6,319
Depr./amort. for rights-of-use to business equipment and furnishings 123 119
Depr./amort. for rights-of-use to other property, plant and equipment 381 411
Depreciation/amortisation for rights of use and investment property 319 300
Other expenses from lease contracts 733 1,336
Other operating income
Income from subleasing rights of use 400 418
Leasing in the consolidated statement of cash flows 1/1 to
30/6/2020
1/1 to 30/6/2019
Repayment of leasing liabilities from finance activities -7,722 -7,370
Interest expenses for leasing liabilities from operating activities 432 430
19) Other assets 30/6/2020 31/12/2019
Deferred tax assets 31,849 25,367
Other assets 116,471 112,406
Pos i tive fair va lues of closed out derivatives in the banking book 148,536 118,657
Deferred i tems 3,748 7,500
Other assets 300,604 263,930
20) Amounts owed to credit institutions 30/6/2020 31/12/2019
Amounts owed to Austrian banks 3,714,233 2,824,684
Amounts owed to foreign banks 1,765,911 1,971,149
Amounts owed to credit institutions 5,480,144 4,795,833

30
21) Amounts owed to customers 30/6/2020 31/12/2019
Savings deposits 2,675,205 2,697,443
Other 9,897,578 9,283,208
Amounts owed to customers 12,572,783 11,980,651
22) Securitised liabilities 30/6/2020 31/12/2019
Bonds issued 1,789,840 1,649,309
Other securitised liabilities 13,519 13,554
Securitised liabilities 1,803,359 1,662,863
23) Provisions for liabilities and charges 30/6/2020 31/12/2019
Provis ions for termination benefits and pensions 197,110 199,541
Provis ions for anniversary bonuses 15,075 14,962
Provis ions for credit risks 128,100 121,764 Other provisions 40,434 45,095
Provis ions for liabilities and charges 380,719 381,362
24) Other assets 30/6/2020 31/12/2019
Trading l iabilities 42,880 38,092
Tax l iabilities 25,696 3,997 Current tax l iabilities 21,522 250
Deferred tax liabilities 4,174 3,747 Leasing liabilities 150,746 140,991
Other l iabilities 244,374 238,459
Negative fair values of closed out derivatives in the banking book 33,588 35,030
Deferred i tems 56,010 68,699
Other l iabilities 553,294 525,268
25) Other liabilities (trading liabilities) 30/6/2020 31/12/2019
Currency contracts 604 2,877
Interest rate contracts 42,276 35,215
Other contracts 0 0
Trading l iabilities 42,880 38,092
26) Subordinated debt capital 30/6/2020 31/12/2019
Subordinated bonds issued incl. tier 2 capital 468,732 522,515
Hybrid capital 0 0
Subordinated debt capital 468,732 522,515
27) Equity 30/6/2020 31/12/2019
Subscribed capital 105,176 105,844 Capital reserves 505,523 505,523
Reta ined earnings (incl. net profit) 2,274,180 2,288,601 Negative goodwill 1,872 1,872
Additional equity capital components 50,000 50,000 Minorities 7,663 8,697
Equity 2,944,414 2,960,537
28) Contingent liabilities and commitments 30/6/2020 31/12/2019
Other contingent liabilities (guarantees and letters of credit) 1,272,903 1,275,336
Contingent l iabilities 1,272,903 1,275,336
Liabilities arising from non-genuine repos 0 0
Other commitments (irrevocable loan commitments) 4,011,226 4,045,352
Credit ri sks 4,011,226 4,045,352

31
29) Segment report as at 30/6/2020 Core business segments in €m
Personal Banking
Corporates Financial Markets
Other Total
Net interest income 31.2 130.2 8.3 169.8 Profi t from entities accounted for by the equity
method -45.0 -45.0
Charges for losses on loans and advances -1.1 -5.3 -3.0 -9.5
Net fee and commission income 42.1 44.6 0 86.7
Net trading income 1.0 -0.2 0.7
Administrative expenses -46.2 -80.9 -5.0 -15.4 -147.5
Other operating income 2.5 4.2 -11.1 -13.6 -18.0
Profi t/loss for the period before tax 28.4 93.8 -56.1 -29.0 37.2
Average risk-weighted assets 1,917.4 10,583.0 5,585.5 18,086.0
Average a llocated equity 308.5 1,702.5 898.6 2,909.5
RoE (return on equity before tax) 18.4% 11.0% n.a .
2.6%
Cost/income ratio 61.0% 44.9% n.a . 76.0% n.a. – not applicable
Segment report as at 30/6/2019 Core business segments in €m
Personal Banking
Corporates Financial Markets
Other Total
Net interest income 31.5 127.9 11.7 171.1
Profi t from entities accounted for by the equity
method 23.4 23.4
Charges for losses on loans and advances -1.4 4.4 -2.1 0.9
Net fee and commission income 37.4 42.8 -0.1 80.2
Net trading income -0.1 4.5 4.4
Administrative expenses -46.2 -77.1 -4.8 -14.2 -142.4
Other operating income 2.5 -3.4 17.8 -11.7 5.2
Profi t/loss for the period before tax 23.8 94.5 50.5 -25.9 142.8
Average risk-weighted assets 1,840.0 10,012.6 5,596.8 17,449.4
Average a llocated equity 298.3 1,623.1 907.3 2,828.6
RoE (return on equity before tax) 16.0% 11.6% 11.1% 10.1%
Cost/income ratio 64.7% 46.1% 8.4% 50.1%
30) Human resources 30/6/2020 31/12/2019
Salaried employees 2,167 2,150
Blue-collar 8 9
Tota l 2,175 2,159

32
31) Regulatory Capital pursuant to Part 2 of Regulation (EU) No 575/2013 - Pillar I in €k
30/6/2020 31/12/2019 30/6/2019
Subscribed capital 98,722 99,622 99,622
Capital reserves 505,523 505,523 505,523
Reta ined earnings 2,130,575 2,181,127 2,053,508
Minority interests 0 0 0
Accumulated other comprehensive income 65,813 70,069 83,086
Regulatory adjustment i tems -22,784 6,530 6,344
Deductions from common equity tier 1 capital i tems -317,629 -203,899 -200,527
COMMON EQUITY TIER 1 CAPITAL 2,460,220 2,658,972 2,547,556
AT1 capital instruments 50,000 50,000 50,000
AT1 capital instruments purs. to national implementation rules 0 0 0
Deductions from AT1 capital items 0 0 0
Additional tier 1 capital 50,000 50,000 50,000
TIER 1 CAPITAL 2,510,220 2,708,972 2,597,556
Qualifying supplementary capital instruments 342,906 352,382 361,369
Nominal capital preference shares purs. to transition rules 7,200 6,300 6,300
AT1 capital instruments purs. to transition rules 0 0 0
Supplementary capital (tier 2) i tems purs. to national impl. rules 5,492 9,406 11,928
General credit risk adjustments 0 0 0
Deductions from tier 2 capital items -19,196 -18,992 -20,253
Supplementary capital (tier 2) 336,402 349,096 359,344
OWN FUNDS 2,846,622 3,058,068 2,956,900
Total risk exposure purs. Art. 92 CRR
Credit ri sk 14,215,960 13,978,718 13,850,545
Market risk, settlement risk and CVA risk 47,542 52,758 59,103
Operational ri sk 1,083,459 1,083,459 1,055,408
Total exposure 15,346,961 15,114,935 14,965,056
Own funds ratio purs. Art. 92 CRR
Common equity tier 1 capital ratio 16.03% 17.59% 17.02%
Tier 1 capital ratio 16.36% 17.92% 17.36%
Tota l capital ratio 18.55% 20.23% 19.76%
Regulatory requirements own capital ratios purs. to transition rules in %
Common equity tier 1 capital ratio 7.10% 7.13% 7.11%
Tier 1 capital ratio 8.60% 8.63% 8.61%
Tota l capital ratio 10.60% 10.63% 10.61%
Regulatory capital requirements purs. to transition rules in €k
Common equity tier 1 capital 1,089,634 1,078,299 1,064,449
Tier 1 capital 1,319,839 1,305,023 1,288,925
Tota l capital 1,626,778 1,607,322 1,588,226
Free capital components
Common equity tier 1 capital 1,370,586 1,580,673 1,483,107
Tier 1 capital 1,190,381 1,403,949 1,308,631
Tota l capital 1,219,844 1,450,746 1,368,674

33
The first line item shows the carrying value; the line below shows the fair value of the same item.
32) Fair value of financial instruments and other items regarding reconciliation as at 30/6/2020 AC FVTPL thereof HFT FVOCI
thereof equity instruments FVOCI
thereof debt instruments FVOCI AC/ liabilities Other Total
Cash and balances with central banks 1,984,607 1,984,607 1,984,607 1,984,607
Loans and advances to credit institutions 782,017 782,017 784,615 784,615
Loans and advances to customers 26,878 56,939 39,295 40,672 40,672 17,034,641 17,159,131 28,087 56,939 39,295 40,672 40,672 17,271,505 17,397,202
Loan loss provisions
-205,497 -205,497 -205,497 -205,497
Trading assets 50,196 50,196 50,196 50,196
Financial investments 1,842,035 574,459 332,217 432,343 290,258 142,085 867,252 3,716,090 1,904,930 574,459 332,217 432,343 290,258 142,085
Intangible assets 1,680 1,680
Property, plant and equipment 414,617 414,617
Other assets
148,536 152,068 300,605 148,536
of which closed out derivatives positions in the banking book
148,536
148,536
148,536 Total assets
1,868,914 631,399 371,512 198,732 473,014 290,258 182,756 19,595,769 1,435,618 24,203,445 1,933,017 631,399 371,512 198,732 473,014 290,258 182,756 19,835,229
Amounts owed to banks 29,730 29,730 5,450,414 5,480,144 29,730 29,730 5,410,585 5,440,315
Amounts owed to customers 442,592 442,592 12,130,191 12,572,782 442,592 442,592 12,145,246 12,587,837
Securitised liabilities 876,013 876,013 927,347 1,803,359 876,013 876,013 977,262 1,853,275
Provisions for liabilities and charges 380,719 380,719
Other liabilities 76,469 476,825 553,294 76,469
of which closed out derivatives positions in the banking book
33,588
33,588
33,588 33,588 Subordinated debt capital
392,213 392,213 76,519 468,732 392,213 392,213 89,822 482,035
Capital 2,944,414 2,944,414
Total equity and liabilities - 1,740,548 1,740,548 76,469 - - - 18,584,470 3,801,958 24,203,445 - 1,740,548 1,740,548 76,469 - - - 18,622,915

34
In the first half-year 2020, there were no reclassifications with respect to financial assets from the measurement category recognised at fair va lue plus or minus through other comprehensive
income (FVOCI) to the measurement category at amortised cost (AC) and no reclassification from the measurement category at fa ir value through profit or loss (FVPL) to the category at
amortised cost (AC) or at fa i r va lue plus or minus through other comprehens ive income (FVOCI).
Liabilities designated at fair value through profit
or loss
Cumulated changes to fair value due to change
in own default risk (recognised in OCI)
Modification to fair value due to a change in market
risk (recognised in P/L)
Difference in amount between
carrying value and par value
as at 30/6/2020 in HY1 2020 Cumulated as at 30/6/2020
Amounts owed to banks -85 191 1,308 1,308
Amounts owed to customers 14,011 -2,875 52,947 52,947
Securitised liabilities 12,113 -12,918 18,797 18,797
Subordinated debt capital 150 -2,064 22,063 22,063
In the fi rs t ha l f-year 2020, there were no reclass i fications of cumulated profi t or loss within equity.
Liabilities designated at fair value through profit
or loss
Cumulated changes to fair value due to change
in own default risk (recognised in OCI)
Modification to fair value due to a change in market
risk (recognised in P/L)
Difference in amount between
carrying value and par value
as at 31/12/2019 in the financial year 2019 cumulated as at 31/12/2019
Amounts owed to banks -101 786 1,514 1,514
Amounts owed to customers -850 -10,894 64,933 64,933
Securitised liabilities -2,868 -5,003 20,860 20,860
Subordinated debt capital -8,878 -531 27,821 27,821
In the financia l year 2019, there were no reclass i fications of cumulated profi t or loss within equity.
Assets designated at fair value through profit or
loss as at 30/6/2020
Modification to fair value due to adjusted
default risk
Modification to fair value of related credit
derivatives or similar instruments
Maximum
default risk
Reduction due to related
credit derivatives or
similar instruments Financial instruments
in HY1 2020 Cumulated in HY1 2020 Cumulated
Loans and advances to customers 39,295 - - - - -
Financial investments 332,217 - - 466 - -
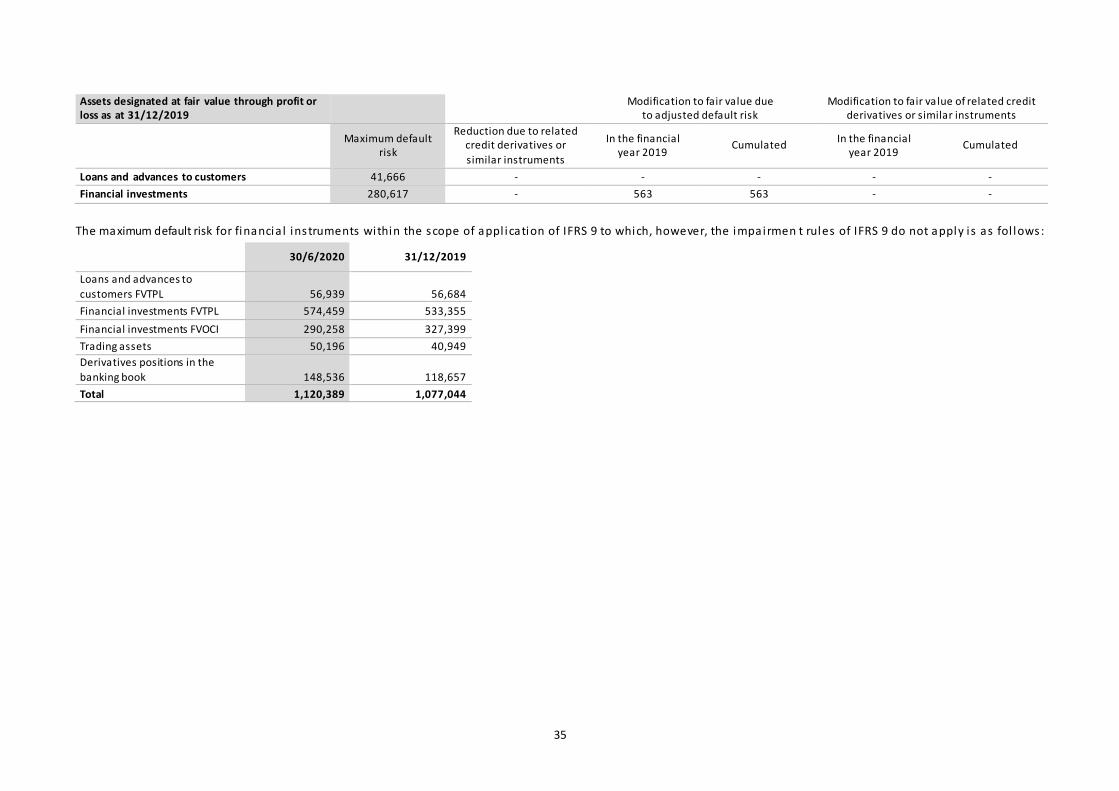
35
Assets designated at fair value through profit or loss as at 31/12/2019
Modification to fair value due
to adjusted default risk Modification to fair value of related credit
derivatives or similar instruments
Maximum default risk
Reduction due to related credit derivatives or
similar instruments
In the financial year 2019
Cumulated In the financial
year 2019 Cumulated
Loans and advances to customers 41,666 - - - - -
Financial investments 280,617 - 563 563 - -
The maximum default risk for financia l instruments within the scope of appl ication of IFRS 9 to which, however, the impairmen t rules of IFRS 9 do not apply i s as fol lows:
30/6/2020 31/12/2019
Loans and advances to
customers FVTPL 56,939 56,684
Financial investments FVTPL 574,459 533,355
Financial investments FVOCI 290,258 327,399
Trading assets 50,196 40,949
Derivatives positions in the
banking book 148,536 118,657
Total 1,120,389 1,077,044

36
Fair value hierarchy of financial instruments as at 30/6/2020
AC
Carrying value
FVTPL Carrying
value
HFT Carrying
value
FVOCI Carrying
value
AC/liabilities carrying value
Other carrying
value
Total carrying
value
Level 1 Fair value
Level 2 Fair value
Level 3 Fair value
Financial instruments carried at fair value in €k
Loans and advances to customers 56,939 40,672 97,611 45,030 52,581
Trading assets 50,196 50,196 1,075 49,121
Financial assets - FVPL 574,459 574,459 353,865 220,595
Financial assets - FVOCI 432,343 432,343 190,473 3,968 237,9021)
Other assets 148,536 148,536 148,536
of which closed out derivatives pos itions in the banking book
148,536 148,536 148,536
Financial assets not carried at fair value
Loans and advances to credit institutions
782,017 782,017 784,615
Loans and advances to customers 26,878 17,034,641 17,061,520 28,087 17,271,505
Financial assets - AC 1,842,035 1,842,035 1,843,174 61,757
Financial assets carried at fair value
Amounts owed to credit institutions 29,730 29,730 29,730
Amounts owed to customers 442,592 442,592 442,592
Securitised liabilities 876,013 876,013 876,013
Other l iabilities 76,468 76,468 76,468
of which closed out derivatives pos itions in the banking book
33,588 33,588 33,588
Subordinated debt capital 392,213 392,213 392,213
1) This i tem is made up of equity investments whose market va lue was measured using the discounted cash -flow entity method and/or mixed methods (multiples method in combination with the discounted cash-flow method) or other methods of company va luation.

37
Fair value hierarchy of financial instruments as at 30/6/2020
AC
Carrying value
FVTPL Carrying
value
HFT Carrying
value
FVOCI Carrying
value
AC/ liabilities carrying value
Other carrying
value
Total carrying
value
Level 1 Fair value
Level 2 Fair value
Level 3 Fair value
Liabilities not carried at fair value
Amounts owed to credit institutions 5,450,414 5,450,414 5,410,585
Amounts owed to customers 12,130,191 12,130,191 12,145,246
Securi tised l iabi l i ties 927,347 927,347 977,262
Other l iabi l i ties
Subordinated debt capita l 76,519 76,519 89,822

38
The fair value corresponds to the amount at which an asset can be sold, or a liability settled by market participants in a
transaction under market conditions on the balance sheet date or at which a debt can be transferred.
The assessment of the fair value is based on the assumption that the transaction takes place either on the principal market
for the respective asset or debt instrument or, if no such principal market exists, the most advantageous active market for
the respective transaction, provided the entities involved have access to such markets. Where market prices are available
for identical assets or debt instruments in an active market to which access is available on the balance sheet date, these
prices are used for the measurement (level 1). Where no such market prices a re available, the fair value is determined
us ing va luation models based on parameters that are either directly or indirectly observable (level 2). Where the fair value
cannot be assessed on the basis of market prices or using valuation models fully based on directly or indirectly observable
market data, individual va luation parameters that are not observable on the market are estimated on the basis of
reasonable assumptions (level 3).
Al l fair va lue measurements refer to regularly performed measurements. There were no one-off fair va lue measurements
in the reporting year.
Measurement process
Responsibility for independent monitoring and communication of ri sks as well as the measurement of financial
instruments lies with the Strategic Risk Management Department of Oberbank. The unit is functionally and organisationally
separate from trading, which is responsible for the initiation and conclusion of transactions. Trading book positions are
marked-to-market da i ly at the close of bus iness .
Va luation is based on current stock exchange prices where such quoted prices are publicly available. If direct measurement
based on prices quoted on securities exchanges is not possible, model values derived from current market data (yield
curves , volatilities, etc.) are used. The market data is va lidated daily; at regular intervals, the model prices are compared
with the prices actually obtainable on the market. Moreover, model prices of derivatives are compared with the model
va lues of the partner banks. The management is s ent a daily update on risk positions and the va luation results based on
enti re trading book positions. The fair value of financial instruments not carried in the trading book is measured on a
quarterly bas is .
Valuation methods for measuring fair values
The va luation methods used are in compliance with recognised mathematical methods for measuring financial instruments
taking into account a ll factors that market participants would consider appropriate for determining a price. The income -
based methodology applied is the fair value measurement approach. The market-based approach is applied in the fair
va lue measurement of s tructured products .
Input factors for the fair value measurement
The measurement of the fair value of financial instruments in level 1 i s based on prices quoted on active markets. These
instruments include listed securities and derivative instruments. If di rect measurement based on prices quoted on
securities exchanges is not possible, the present va lue in level 2 i s estimated using model va lues derived from current
market data (yield curves, volatilities, etc.). Underlying interest-rate curves and volatilities are obtained from the Reuters
Market Data System.
Measurements are based on generally-accepted va luation models, with measurements be ing made under market
conditions. In the case of derivatives, symmetrical products (e.g. IRS) are measured using the discounted cash flow method.
The fa ir va lues of asymmetrical products (options) are calculated using standard methods (e.g. the Black-Scholes options
pricing model). Structured products are measured on the bas is of price information obta ined from third parties .
Al l derivative instruments are measured on a counterparty-risk-free basis in a first step. In a second s tep, a credit risk
markdown is determined (credit valuation adjustment, CVA) based on the internal default probabilities of an expected
loss .

39
The fa ir va lues of non-listed securities are obtained from the Geos system. The fair va lue of investment fund units is
obta ined from the fund management companies. The present va lue method (discounted cash flow method) is used to
ca lculate the fair va lue of securitised liabilities, subordinated capital and amounts owed to banks and customers, with the
cash flows of own issues being calculated using the contractual interest rate. The interest rates used for discounting are
derived from the discount curve applicable to the respective currency, adding a premium in the form of a credit spread
corresponding to the seniority of the issue. The credit rating premiums are adjusted regularly to the respective market
conditions .
The fa ir value of level 3 assets is measured using generally-accepted va luation models. The fair va lue measurement of
receivables from banks and customers is based on the discounted contract cash flow (based on contractually-agreed
repayment structures) and the discounted expected credit loss cash flows (considers the credit rating of the customer and
col latera l ). The exchange rates used are the reference rates publ ished by the ECB.
The effects of the COVID-19 pandemic on interest rates is minor. Rather, the sustained phase of low interest rates was
aggravated, because the major central banks lowered key lending rates and/or took measures to boost liquidity to support
the economy. Central bank purchasing schemes and low inflationary expectations kept long -term interest rates low.
Therefore, there is no increased influence of the interest rate component on financial instruments measured at fair value
due to the COVID-19 pandemic. An economic downswing triggered by the COVID-19 pandemic and the resultant potential
downgrading of credit ratings of customers has an influence on the calculation of fair values of level 3 financial instruments.
If measurements based on risk premiums were to increase by 50 bp, receivables from customers valued at fair value would
decl ine by EUR 0.7 million (31. Dec. 2019 € 0.6 mi llion), and if risk premiums were to increase by 100 bp the fair values of
these receivables would drop by € 1.4 mi l l ion.
The fair value of equity investments and shares in affiliated companies is measured primarily using the discounted cash
flow entity method and/or mixed methods (multiples method in combination with the discounted cash -flow method) or
other methods of company va luation.
Changes in the fair va lue hierarchy or classification take place whenever there is any change in the quality of the input
parameters used in the valuation method. Classification adjustments are made at the end of the reporting period.
The following table shows the development of equity investments FVOCI measured at fair va lue and assigned to level 3.
The fair value of equity investments and shares in affiliated companies is measured primarily using the discounted cash
flow entity method and/or mixed methods (multiples method in combination with the discounted cash-flow method) or
other methods of company va luation.
Movements in €k Equity investments FVOCI
Carrying va lue as at 01/01/2020 238,761
Additions (purchases) 0
Disposals (sa les ) -859
Value changes recognised in equity 0
Value changes recognised in income 0
Carrying va lue as at 30/6/2020 237,902
The i tem Other comprehens ive income from these instruments increased by €k 9.
The remaining level 3 financial instruments measured at fa i r va lue comprise loans and advances to customers .
Movements in €k
Loans and advances to
customers
Carrying va lue as at 1/1/2020 52,253
Transfer to level 2 0
Additions 2,678
Disposals -1,961
Changes in fa i r va lue -389
of which disposals -110
of which portfol io instruments -279
Carrying va lue as at 30/6/2020 52,581
There were no transfers between Level 1 and Level 2.

40
Major transactions with related parties as at 30 June 2020 were:
Associated companies €k 0
Subs idiaries €k 0
Other related parties €k 26.430
STATEMENT BY THE MANAGEMENT BOARD PURSUANT TO §125 STOCK EXCHANGE ACT
The Management Board confirms that
- these condensed interim financial s tatements have been prepared in accordance with the International
Financial Reporting Standards (IFRS) and the International Accounting Standards (IAS) currently in force and
published by the International Accounting Standards Board (IASB) as applicable in the EU and the
interpretations thereof by the International Financial Reporting Interpretations Committee (IFRIC); they
furthermore present a true and fair view of the assets, liabilities, financial position and result of operations
of the Oberbank Group.
- These consolidated interim financial statements cover the first half-year 2020 (1 January 2020 to 30 June
2020) and present a true and fair view of the assets, liabilities, financial position and profit or loss of the
Oberbank Group in compl iance with the principles of IFRS for interim fi nancia l reports .
The undersigned members of the Management Board in their function as legal representatives of Oberbank
confirm that
a) these condensed interim financial s tatements have been prepared in accordance with the relevant
accounting s tandards and to the best of their knowledge present a true and fair view of the assets, liabilities,
financial position and result of operations of the i ssuer and of a l l companies included in the group of
consol idated companies ;
b) the half-year management report presents a true and fair view of the assets, liabilities, financial position and
result of operations with respect to the key events during the first six months of the financial year and their
effects on the condensed interim financial statements, with respect to the key risks and uncertainties in the
remaining six months of the financial year, and with respect to material business transactions with related
parties that must be disclosed.
Linz, 27 August 2020
The Management Board
CEO Di rector Di rector
Franz Gasselsberger Josef Weißl Florian Hagenauer
Remit Remit Remit
Corporate and Bus iness BankingPersonal Banking Overa l l Banking Risk Management

41
Current Management Board Remits
CEO
Franz Gasselsberger
Management Board Member
Josef Weißl
Management Board Member
Florian Hagenauer
General Bus iness Pol icy
Internal Audit
Compl iance
Business and Service Departments
CIF (Corporate & International Finance) PKU (Personal Banking) KRM (Credit Management)
RUC (Accounts & Controlling) PAM (Private Banking & Asset
Management) RIS (Strategic Risk Management)
TRE (Treasury & Trade) OSG2) (Payment Systems and Central
Production)
HRA (Human Resources) SEK (Corporate Secretary &
Communication)
ORG (Organisational Development,
Strategy and Process Management)
ZSP (Payment Systems and Central
Production CEE1), securities settlement)
GFI (Global Financial Institutions)
Regional Business Divisions
Upper Austria South Linz South
Linz North Innviertel
Vienna Sa lzburg
Germany South Lower Austria
Germany Central Slovakia
Czech Republic
Hungary
1) CEE as defined by Oberbank comprises the regions of Czech Republic, Slovakia and Hungary.
2) Banken DL Servicegesellschaft m.b.H., 100% subsidiary of Oberbank

42
Notes
The forecasts that refer to the future development of Oberbank are estimates made on the basis of all the information available to us
on the reporting data. Should the assumptions regarding such forward-looking statements prove incorrect or should risks materialise to
an extent not anticipated, the actual results may vary from those currently expected. Information provided on market shares a re based
on the most recent data available at the copy deadline.
When adding up rounded figures and calculating percentage rates of change, slight differences may result compared with totals and
rates arrived at by adding up component figures which have not been rounded.
The abbreviation ‘n.a.’ in the charts and tables means that the respective provision was not applicable in the relevant financial year.
Financial calendar 2020
22 May 2020 Report for Q1 2020
27 August 2020 Report for Q1-Q2 2020
27 November 2020 Report for Q1-Q3 2020
All of the information is available online at www.oberbank.at under Investor Relations.
Publication Details
Media owner and publisher: Oberbank AG, 4020 Linz, Untere Donaulände 28
Internet: www.oberbank.at , E-Mail: [email protected]
Editing: Corporate Secretary and Communication, phone +43 732 78 02-0
Translation: Edith Vanghelof