oberbank ag investor presentation
TRANSCRIPT

Oberbank AG – Investor Presentation2019

2
FACT SHEET OBERBANK
Source: Oberbank AG, Annual Report 2018 | Annual Reports of the respective banksData as at: 31 December 2018
Employees(FTEs)
2,101
Loans
EUR 15.9 billion
Primary funds
EUR 14.2 billion
Number ofbranches
170
7th largest bank in AustriaFacts & Figures on
Oberbank
Bank Total assets
1 Erste Group Bank EUR 236.8 billion
2 Raiffeisen Bank International AG EUR 140.1 billion
3 UniCredit Bank Austria AG EUR 99.0 billion
4 BAWAG P.S.K. EUR 44.7 billion
5 Raiffeisenlandesbank OÖ EUR 35.7 billion
6 Raiffeisenlandesbank NÖ-Wien AG EUR 25.7 billion
7 Oberbank EUR 22.2 billion
8 HYPO NOE Group EUR 14.1 billion
9 Raiffeisen-Landesbank Steiermark AG EUR 12.3 billion

3
OBERBANK AT A GLANCE – FULL YEAR 2018
Source: Oberbank AG, Annual Report 2018Data as at: 31 December 2018
Profit before tax
271 million
+13%
Profit after tax
226 million
+13%
Net interestincome
345 million
+10%
Net com. income
159 million
+13%
RoE before tax
Cost/Income Ratio
Tier 1 capitalratio
17.77%
+0.74% ppt
48.92%
-0.98% ppt
10.18%
+0.12% ppt

4
OBERBANK AT A GLANCE – Q1 2019
Source: Oberbank AG, Report to Shareholders Q1 2019Data as at: 31 March 2019
Profit before tax
60 million
-7%
Profit after tax
49 million
-10%
Net interestincome
85 million
+8%
Net com. income
41 million
+1%
RoE before tax
Cost/Income Ratio
Tier 1 capitalratio
17.52%
+0.91% ppt
54.72%
+3.30% ppt
8.48%
-1.57% ppt

5
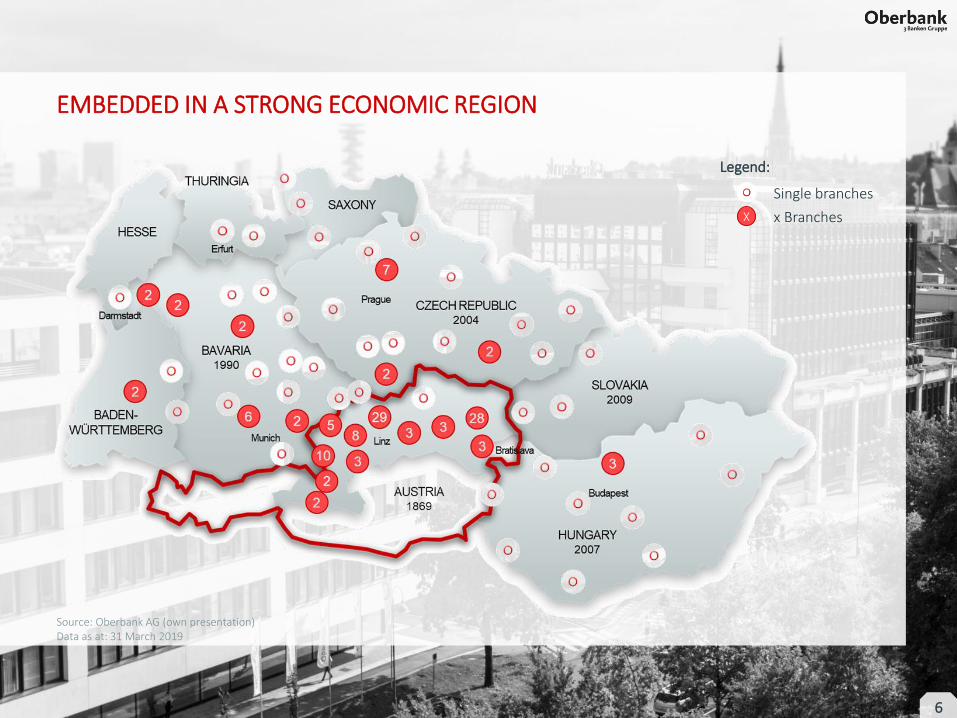
OBERBANK IN THE HEART OF EUROPE
Source: Oberbank AG (own presentation)Data as at: 31 March 2019
1869
Austria 2007
Hungary
1990
Germany
2004
Czech Republic
2009
Slovakia
6
EMBEDDED IN A STRONG ECONOMIC REGION
Legend:
Single branches
x BranchesX
Source: Oberbank AG (own presentation)Data as at: 31 March 2019

7
LONG-TERM EARNINGS GROWTH
Source: Oberbank AG, Annual Reports 2011 to 2018 | Data as at: 31 December | Amounts in € millionThe figures given refer to the past. These cannot be used to derive future trends.
126136 142
158
192
219
239
271
2011 2012 2013 2014 2015 2016 2017 2018
Profit before tax (in € m)
12 % Ø-growth p.a.
Sustainable growth and earnings
• Resilient business model• Long-term growth trend• Ongoing optimisation of process + costs • Steady expansion (branches)
Stable earnings trend!
• Concentration on core business• Stable business policy• Regional customers

8
POSITIVE DEVELOPMENT OF INTEREST & COMMISSION INCOME
Source: Oberbank AG, Annual Reports 2013 to 2018Data as at: 31 December | Amounts in € million
287 314 300 308 315 345
115119 133 131 141
159402433 433 439
456
504
2013 2014 2015 2016 2017 2018
Net interest income Net commission income
1/3 Total income
+13%
+10%
9
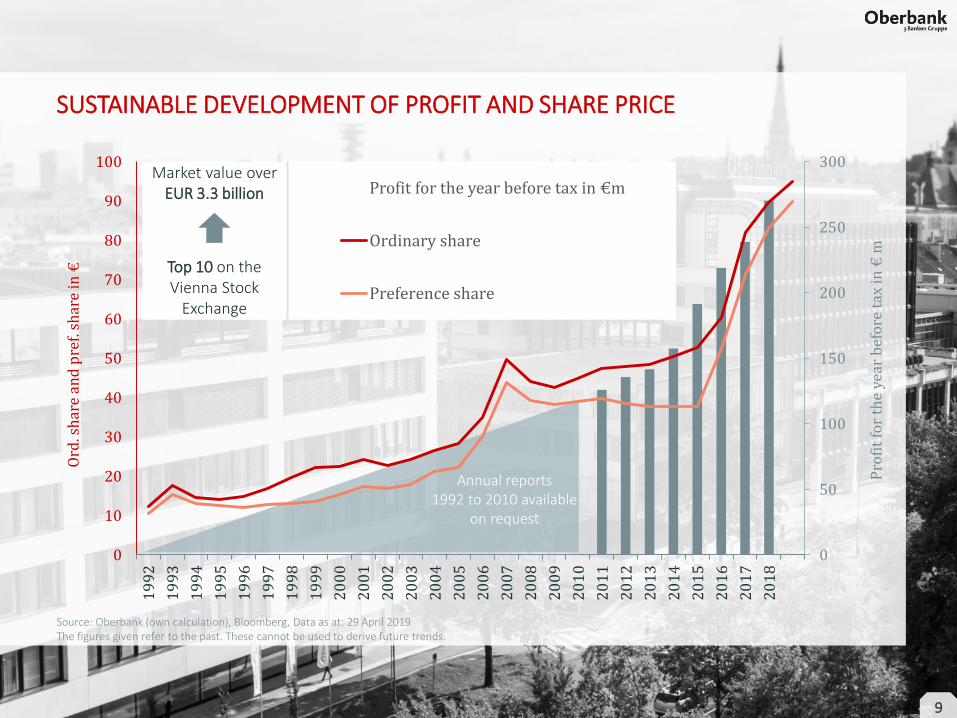
SUSTAINABLE DEVELOPMENT OF PROFIT AND SHARE PRICE
0
50
100
150
200
250
300
0
10
20
30
40
50
60
70
80
90
1001
99
2
19
93
19
94
19
95
19
96
19
97
19
98
19
99
20
00
20
01
20
02
20
03
20
04
20
05
20
06
20
07
20
08
20
09
20
10
20
11
20
12
20
13
20
14
20
15
20
16
20
17
20
18
Pro
fit
for
the
year
bef
ore
tax
in €
m
Ord
. sh
are
and
pre
f. s
har
e in
€
Profit for the year before tax in €m
Ordinary share
Preference share
Source: Oberbank (own calculation), Bloomberg, Data as at: 29 April 2019 The figures given refer to the past. These cannot be used to derive future trends.
Market value over EUR 3.3 billion
Top 10 on the Vienna Stock
Exchange
Annual reports 1992 to 2010 available
on request

10
ISSUER RATING OF OBERBANK
Source: Standard & Poor’sData as at: 9 January 2019
Rat
ing
scal
e St
and
ard
& P
oo
r’s
AAA
AA+
AA
AA-
A+
A
A-
BBB+
BBB
BBB-
BB+
BB
BB-
B+
B
B-
CCC+
CCC
CCC-
CC
C
D
“Stable” outlook
The rating report is available on our website.

11
SOLID BUSINESS MODEL & STRATEGY
Source: Oberbank AG (own presentation)
Co
nce
ntr
atio
n o
n r
isk
man
agem
ent
Sust
ain
able
HR
dev
elo
pm
ent
Org
anic
gro
wth
Au
ton
om
y &
ind
epen
den
ce
Hig
h a
dvi
sory
qu
alit
y
Lean
pro
cess
es
Secu
re li
qu
idit
y
Stable foundation of values

12
SOLID BUSINESS MODEL & STRATEGY
Source: Oberbank AG (own presentation)
Au
ton
om
y &
Ind
epen
den
ce
Our autonomy and independence remain our top priority – they allow us to continue making decisions autonomously, for the region and in
the region.
Stable foundation of values

13
INDEPENDENCE DEVELOPED OVER YEARS
Source: Oberbank AG (own presentation)Data as at: 31 March 2019
1869Founded in Linz
194513 branches
1984End of syndicate agreement with Creditanstalt
1986Initial public offering on theVienna Stock Exchange
1990Market entry in Bavaria
2000First presentation of Oberbank, BTV and BKS as 3 Banken Group
1929Creditanstalt becomes majority shareholder
1952Creditanstaltsells 1/3 of its shares toBKS and BTV
1985First branch in Lower Austria
1988First branchin Vienna
1991Foundation of Drei-Banken-EDV
2002100 Branches
2004Market entry in Czech Republic
2007Market entry in Hungary
2009Market entry in Slovakia
2013150 branches
2015Market entry in Hesse
2016Market entry in Thuringia
2018Market entryBaden-Württemberg& Saxony
2019150 years ofOberbank
14
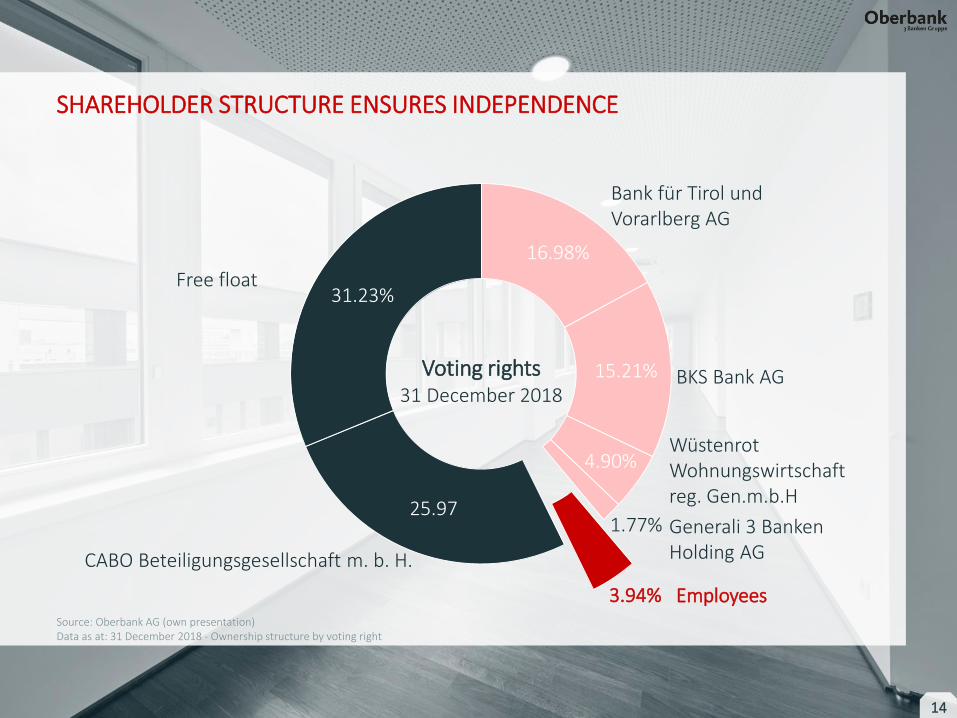
SHAREHOLDER STRUCTURE ENSURES INDEPENDENCE
Source: Oberbank AG (own presentation)Data as at: 31 December 2018 - Ownership structure by voting right
16.98%
15.21%
4.90%
1.77%
3.94%
25.97
31.23%Free float
CABO Beteiligungsgesellschaft m. b. H.
Bank für Tirol und Vorarlberg AG
Wüstenrot Wohnungswirtschaft reg. Gen.m.b.H
BKS Bank AG
Generali 3 Banken Holding AG
Employees
Voting rights31 December 2018

15
BUILD UP OF OWN CAPITAL
Source: Oberbank AG, Annual Reports 2013 to 2018Data as at: 31 December | Amounts in € million
1,4211,534
1,926
2,2832,467
2,798
0
500
1.000
1.500
2.000
2.500
3.000
2013 2014 2015 2016 2017 2018
Equity (in € m)

16
WE EXCEED OUR STATUTORY CAPITAL REQUIREMENTS
Source: Oberbank AG, Annual Report 2018 | SREP purs. to SREP Notice of 2 October 2017Data as at: 31 December 2018
17.46% 17.77%
20.19%
6.47%
7.97%
9.97%
CET 1 ratio Tier 1 capital ratio Total capital ratio
Regulatory requirement
ACT on 31/12/2018
Regulatory requirement
ACT on 31/12/2018
Regulatory requirement
ACT on 31/12/2018
+ 1.40%SREP Premium

17
SOLID BUSINESS MODEL & STRATEGY
Source: Oberbank AG (own presentation)
Hig
h a
dvi
sory
qu
alit
y
We offer high quality advisory services and regularly receive awards for our performance.
Stable foundation of values

18
WE OFFER UNIVERSAL SERVICES
Source: Oberbank AG (own presentation)Data as at : 31 December 2018
Corporate and Business Banking Retail Banking
Export & investment promotion
Documentary business & guarantees
Interest & currency management
Structured finance, private equity,
mezzanine capital, leasing
Payment services & cash management
Investments & pension plans
Real estateloans &
subsidy finance schemes
Private banking & asset management
Retirement provisioning
Consumer loans & vehicle leasing
Portfolio
Bu
sin
ess
Fin
ance
Ris
k M
gmt.
Paym
ent
serv
ices

19
SOLID BUSINESS MODEL & STRATEGY
Source: Oberbank AG (own presentation)
Org
anic
gro
wth
We grow organically through new branches and do not engage in the acquisition of other banks.
Stable foundation of values

20
SUCCESSFUL EXPANSION
Source: Oberbank AG, Annual Reports 1990 to 2018 (Annual Reports 1990 to 2010 not available online)Data as at: 31 December | Amounts in € million
8589
98
110
143
156
170
20 22
49
79
115
192
271
0
50
100
150
200
250
300
0
20
40
60
80
100
120
140
160
180
1990 1995 2000 2005 2010 2015 2018
Branches Profit before tax

21
DYNAMIC EXPANSION IN GERMANY
Source: Oberbank AG (own presentation)Data as at: 31 December 2018
Saxony
ThuringiaHesse
Bavaria
Baden-Württemberg
Mainz
Mannheim
Heilbronn Schwäbisch/Hall
Karlsruhe
Böblingen
Freiburg
Ravensburg
Dresden
Legend:
Existing branches
Opening planned in 2019

22
EXPANSION ALSO REFLECTED IN LENDING VOLUME TREND
Source: Oberbank AG, Annual Reports 2013 to 2018Data as at: 31 December | Amounts in € million
2,218 2,442 2,695 2,875 3,049 3,251
9,496 9,835 10,14510,903
11,71112,632
11,71312,276
12,84013,778
14,76015,883
2013 2014 2015 2016 2017 2018
Individual loans Corporate and business loans
+8%
+7%+6%
+7%
+7%
+8%
+3%
+10%
+10%
+4%
+5%
+4%

23
FAST PACE OF NET GROWTH IN LENDING VOLUME
Source: Oberbank AG, Annual Reports 2013 to 2018Data as at: 31 December | Amounts in € million
354 339311
757809
921
114
224253
181 174202
0
100
200
300
400
500
600
700
800
900
1000
2013 2014 2015 2016 2017 2018
Net increase in lending volume (in € m)
Corporate and Business Banking
Retail Banking

24
LOAN DISTRIBUTION HIGHLIGHTS OUR REGIONAL FOCUS
Source: Oberbank AG (own presentation)Data as at: 31 December 2018
Upper Austria & Salzburg
Vienna
Lower Austria
Germany
Czech Republic
Hungary Slovakia
48%
14%
8%
15%
8%
4% 3%

25
SOLID BUSINESS MODEL & STRATEGY
Source: Oberbank AG (own presentation)
Co
nce
ntr
atio
n o
n r
isk
man
agem
ent
We pursue a cautious risk policy and professional risk management.
Stable foundation of values

26
RELEVANT RISK INDICATORS DEMONSTRATE A POSITIVE PICTURE
Source: Oberbank AG, Annual Report 2018Data as at : 31 December 2018
2017 2018
NPL ratio, gross 2.59% 2.43%
Non-performing loans, gross absolutein € m
414.78 421.68
Impairment allowance ratio 0.19% 0.16%
27
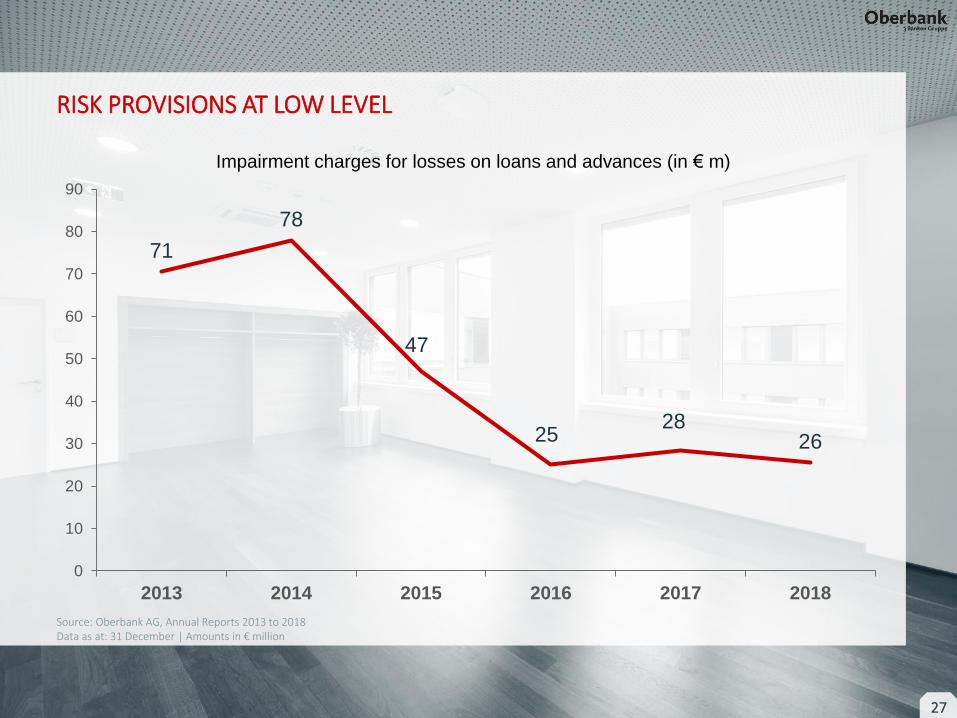
RISK PROVISIONS AT LOW LEVEL
Source: Oberbank AG, Annual Reports 2013 to 2018Data as at: 31 December | Amounts in € million
71
78
47
2528
26
0
10
20
30
40
50
60
70
80
90
2013 2014 2015 2016 2017 2018
Impairment charges for losses on loans and advances (in € m)
28
SOLID BUSINESS MODEL & STRATEGY
Source: Oberbank AG (own presentation)
Sust
ain
able
HR
dev
elo
pm
ent
Our employees are the most important link between Oberbank and customers, and set us apart from our competitors.
Stable foundation of values

29
NUMBER OF EMPLOYEES RISES DUE TO EXPANSION
2013 2014 2015 2016 2017 2018
Employees 1,993 2,004 2,025 2,049 2,050 2,101
• Average number of employees pursuant to IFRS
• Salaried employees excluding management board and senior management
1,486 1,476 1,479 1,495 1,488 1,509
185 194 205 216 215230
183 192 200199 198
20278 83
8994 104
11361 59 52
45 4447
Austria Germany Czech Republic Hungary Slovakia
Source: Oberbank AG, Annual Reports 2013 to 2018Data as at: 31 December

30
WE HAVE ONE OF THE OLDEST EMPLOYEE PARTICIPATION SCHEMES IN AUSTRIA
3.94%
of Oberbank belongs toour employees
since 1994
One of the oldest employee participation schemes
2,500
employees hold shares
130 m €
invested by employees
Mitarbeiterstiftung (Employee Foundation) Special employees offer
Source: Oberbank AG (own presentation)Data as at: 31 December 2018

31
SOLID BUSINESS MODEL & STRATEGY
Source: Oberbank AG (own presentation)
Lean
pro
cess
es
Cost awareness is a main topic for us in our daily business – this is why we do not have to close branches for cost reasons or make
hundreds of employees redundant overnight.
Stable foundation of values

32
MARKET LEADERSHIP IN COST EFFICIENCY
Source: Oberbank AG, Annual Reports 2013 to 2018Data as at: 31 December
52.1%
50.1% 50.5% 50.8%49.9%
48.9%
2013 2014 2015 2016 2017 2018
Cost/income ratio (CIR)

33
DIGITALISATION – AN IMPORTANT STRATEGIC GOAL
Source: Oberbank AG (own presentation)
Numerous online applications
Diverse multi-channel capabilities
Services available online
Products can be obtained
online

34
SOLID BUSINESS MODEL & STRATEGY
Source: Oberbank AG (own presentation)
Secu
re li
qu
idit
y Customer loans are refinanced by customer deposits, securitised liabilities and promotional loans. This is an important strategic goal
for Oberbank - LDR!Additionally, we have a high liquidity reserve in the form of securities
eligible for refinancing and collateral for loans.
Stable foundation of values

35
STABLE FINANCING OF LOANS
Source: Oberbank AG, Annual Reports 2013 to 2018Data as at: 31 December
87.60%
91.70%92.30%
95.50%
97.20%
95.10%
82%
84%
86%
88%
90%
92%
94%
96%
98%
2013 2014 2015 2016 2017 2018
Loan-to-deposit ratio
We have an adequate liquidity buffer in the form
• of securities assets eligible for refinancing
• loan assets eligible for refinancing with central banks

36
OUR LOAN/DEPOSIT RATIO IS 95.10%
Source: Oberbank AG, Annual Report 2018Data as at: 31 December 2018
Loans and advances to customers Funding base in m €
Equity
Refinance allocated for customer loans
Securitised liabilities including subordinated debt capital
Liabilities to customers
Loans and advances to customers
95.10%Loan/deposit ratio

37
FINANCING STRUCTURE OF OBERBANK
Source: Oberbank AG, Annual Report 2018Data as at: 31 December 2018
Liabilities to customers
Securitised liabilities
Subordinated debt
Equity Prov. + other liabilities
Promotional loans
Other liabilities to banks
Liabilities to banks
TLTRO

38
OUR FUNDING STRATEGY AT A GLANCE
Source: Oberbank AG (own presentation)
Oberbank environment
Preparation
Planning
Growth in lending
Limited retail issues
Short-term customer deposits
Rating process
Covered bond issue
Long-term capital market financing
Instruments with different quality

39
SUMMARY
Economic success
Profit (before tax): EUR 270 million*
CIR: 48.9%*
Total assets: EUR 22.2 billion*
Source: Oberbank AG (own presentation), *Annual Report 2018Data as at: 31 December 2018
High stability
Total capital ratio of over 20%*
NPL ratio: 2.43%*
Long-term issuer rating (S&P):
A, stable*
Clear expansion strategy
Focus on strong economic region of Austria, Germany, Czech
Republic, Hungary and Slovakia
Independence is key goal
Strong & sustainable ownership structure

40
KEY FACTS ON PLANNED ISSUE
Source: Oberbank AG (own presentation)
Issuer Oberbank AG
Expected rating A (stable) by S&P
Status Ordinary senior Eligible Notes
Maturity 7 to 9 years
Volume Sub-benchmark
Currency Euro
Lead Manager Commerzbank, DZ Bank, Erste Group, Raiffeisen Bank International

41
Contacts

42
CONTACTS
Stefan Haasbauer
Head of TeamCapital Markets & Tax Law
+43 +732 7802 37429
+43 +664 805565 211
Markus Pretzl
Investor Relations
+43 732 7802 37368
+43 664 805565 312
Robert Musner
Head of Treasury & Trade
+43 732 7802 32640
+43 664 805565 224
Thomas Katzlinger
Head of TeamTrading & Capital Markets
+43 +732 7802 32637
+43 +664 805565 534

43
DISCLAIMER
This/these document(s) is/are for current informational purposes only and is/are based on the state of
knowledge of the persons charged with its/their preparation at the time of its/their preparation. This/these
document(s) constitute(s) neither an offer nor an invitation to buy or sell the investments and (bank)
products mentioned therein. None of the statements con-tained in this/these document(s) should be
understood to constitute a general recommenda-tion. Although we believe that the sources we have used
are reliable, we do not give any guarantee of the completeness or accuracy of the information reproduced
here. In particular, we expressly state that numerical information is subject to errors.
The data provided are historical data. They cannot be used to predict future developments.
Oberbank AG. Legal Form: Aktiengesellschaft (Joint Stock Company). Registered Office: Untere Donaulände
28, A-4020 Linz, Austria. Commercial Register No.: FN 79063 w, Landesgericht Linz (State Court of Linz), DVR:
0019020