nyc boston marketing
TRANSCRIPT
North American Marketing, December 16-17, 2014 TSX; NYSE: AUQ www.auricogold.com
Built for SUCCESS

Forward Looking Statements
2
Cautionary Statement
This presentation contains certain information that constitutes “forward-looking information” and “forward-looking statements” as defined under Canadian and U.S. securities laws. All statements in this press release, other than statements of historical fact, are forward-looking statements. The words “expect”, “believe”, “anticipate”, “contemplate”, “may”, “could”, “will”, “intend”, “estimate”, “forecast”, “target”, “budget”, “schedule” and similar expressions identify forward-looking statements. Forward-looking statements in this presentation include, without limitation, statements with respect to our expectations on underground productivity levels, underground unit mining cost, underground development, mill facility processing rate, cash flow, free cash flow, cash costs, capital investment and timing to completion on the final leg of the Northgate production shaft, information as to our strategy, plans and future financial and operating performance, such as our expansion plans, project timelines, production plans, projected cash flows or capital expenditure levels, cost estimates, mining or milling methods, projected exploration results, resource and reserve estimates, other statements that express our expectations or estimates of future performance, the success of exploration activities, the Company’s ability to delineate additional resources and reserves as a result of such programs, statements regarding the advancement of the Lynn Lake district, the completion of a feasibility study on the Lynn Lake Project within the indicated timeframe, mineral reserves and mineral resources and anticipated grades, exploration expenditures, costs and timing of any future development, costs and timing of future exploration and the Company’s intentions regarding its investment in Carlisle, the ability and timing to complete a resource estimate for Kemess East, the presence of and continuity of metals at Kemess East at modeled grades. Forward-looking statements are necessarily based upon a number of factors and assumptions that, while considered reasonable by management at the time of making such statements, are inherently subject to significant business, economic and competitive uncertainties and contingencies. Known and unknown factors could cause actual results to differ materially from those projected in the forward-looking statements. Such factors and assumptions underlying the forward-looking statements in this press release include, but are not limited to: changes to current estimates of mineral reserves and resources; fluctuations in the price of gold; changes in foreign exchange rates (particularly the Canadian dollar, Mexican peso and U.S. dollar); the impact of inflation; changes in our credit rating; any decision to declare a quarterly dividend; employee relations; litigation; disruptions affecting operations; availability of and increased costs associated with mining inputs and labor; development delays at the Young-Davidson mine; operating or technical difficulties in connection with mining or development activities; inherent risks associated with mining and mineral processing; the risk that the Young-Davidson and El Chanate mines may not perform as planned; uncertainty with the Company’s ability to secure capital to execute its business plans; the speculative nature of mineral exploration and development, including the risks of obtaining necessary licenses and permits, including the necessary licenses, permits, authorizations and/or approvals from the appropriate regulatory authorities for the Kemess Underground project; contests over title to properties; changes in national and local government legislation in Canada, Mexico and other jurisdictions in which the Company does or may carry on business in the future; risk of loss due to sabotage and civil disturbances; the impact of global liquidity and credit availability and the values of assets and liabilities based on projected future cash flows; risks arising from holding derivative instruments; business opportunities that may be pursued by the Company, as well as those factors discussed under “Risk Factors” in the Company’s most recent Annual Information Form. Actual results and developments are likely to differ, and may differ materially, from those expressed or implied by the forward-looking statements contained in this press release. Such statements are based on a number of assumptions which may prove to be incorrect, including, but not limited to, the assumptions set forth in our most recent Form 40-F/Annual Information Form. Readers are cautioned that forward-looking statements are not guarantees of future performance. All of the forward-looking statements made in this press release are qualified by these cautionary statements. Specific reference is made to the most recent Form 40-F/Annual Information Form on file with the SEC and Canadian provincial securities regulatory authorities for a discussion of some of the factors underlying forward-looking statements. There can be no assurance that forward-looking statements or information will prove to be accurate, accordingly, investors should not place undue reliance on the forward-looking statements or information contained herein. The Company disclaims any intention or obligation to update or revise any forward-looking statements whether as a result of new information, future events or otherwise, except as required by applicable law.
Cautionary Note to U.S. Investors Concerning Measured, Indicated and Inferred Resources
This presentation uses the terms "measured", "indicated" and "inferred” resources. We advise investors that while those terms are recognized and required by Canadian regulations, the United States Securities and Exchange Commission does not recognize them. “Inferred resources” have a great amount of uncertainty as to their existence and as to their economic and legal feasibility. It cannot be assumed that all or any part of an inferred resource will ever be upgraded to a higher category. Under Canadian rules, estimates of inferred mineral resources may not form the basis of feasibility or other economic studies. United States investors are cautioned not to assume that all or any part of measured or indicated mineral resources will ever be converted into mineral reserves. United States investors are also cautioned not to assume that all or any part of an inferred mineral resource exists, or is economically or legally mineable.
All amounts are in US dollars unless otherwise indicated
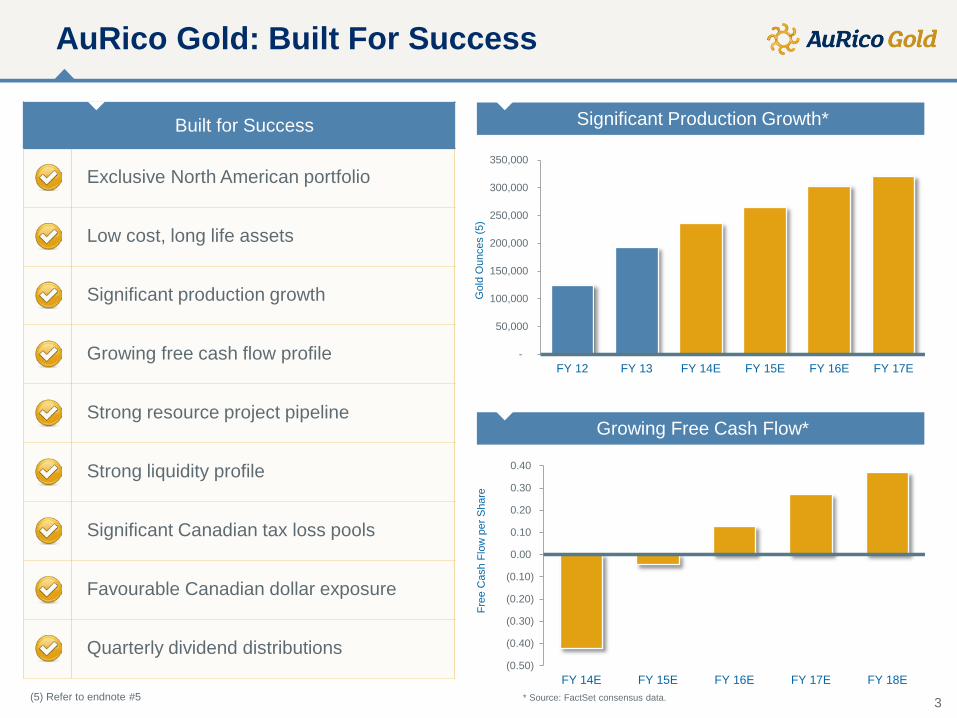
Built for Success
Exclusive North American portfolio
Low cost, long life assets
Significant production growth
Growing free cash flow profile
Strong resource project pipeline
Strong liquidity profile
Significant Canadian tax loss pools
Favourable Canadian dollar exposure
Quarterly dividend distributions
-
50,000
100,000
150,000
200,000
250,000
300,000
350,000
FY 12 FY 13 FY 14E FY 15E FY 16E FY 17E
Gol
d O
unce
s (5
)
AuRico Gold: Built For Success
3
Significant Production Growth*
Growing Free Cash Flow*
(0.50)
(0.40)
(0.30)
(0.20)
(0.10)
0.00
0.10
0.20
0.30
0.40
FY 14E FY 15E FY 16E FY 17E FY 18E
Free
Cas
h Fl
ow p
er S
hare
* Source: FactSet consensus data. (5) Refer to endnote #5
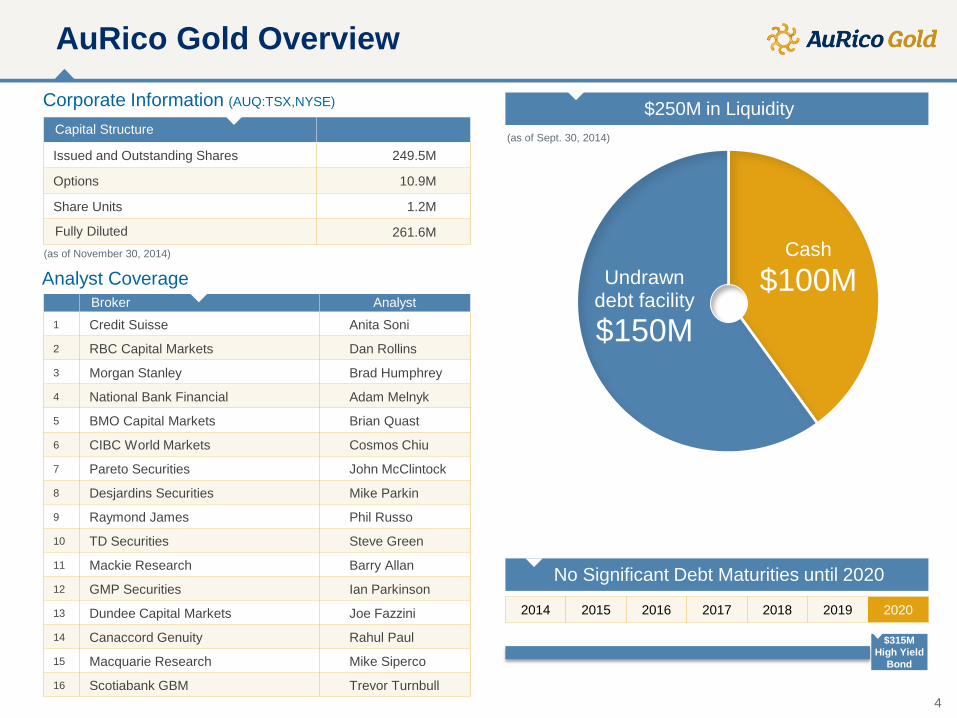
AuRico Gold Overview
4
(as of Sept. 30, 2014)
Cash $100M Undrawn
debt facility
$150M
Capital Structure
Issued and Outstanding Shares 249.5M
Options 10.9M
Share Units 1.2M
Fully Diluted 261.6M (as of November 30, 2014)
Broker Analyst 1 Credit Suisse Anita Soni
2 RBC Capital Markets Dan Rollins
3 Morgan Stanley Brad Humphrey
4 National Bank Financial Adam Melnyk
5 BMO Capital Markets Brian Quast
6 CIBC World Markets Cosmos Chiu
7 Pareto Securities John McClintock
8 Desjardins Securities Mike Parkin
9 Raymond James Phil Russo
10 TD Securities Steve Green
11 Mackie Research Barry Allan
12 GMP Securities Ian Parkinson
13 Dundee Capital Markets Joe Fazzini
14 Canaccord Genuity Rahul Paul
15 Macquarie Research Mike Siperco
16 Scotiabank GBM Trevor Turnbull
$250M in Liquidity
Analyst Coverage
Corporate Information (AUQ:TSX,NYSE)
2014 2015 2016 2017 2018 2019 2020
No Significant Debt Maturities until 2020
$315M High Yield
Bond
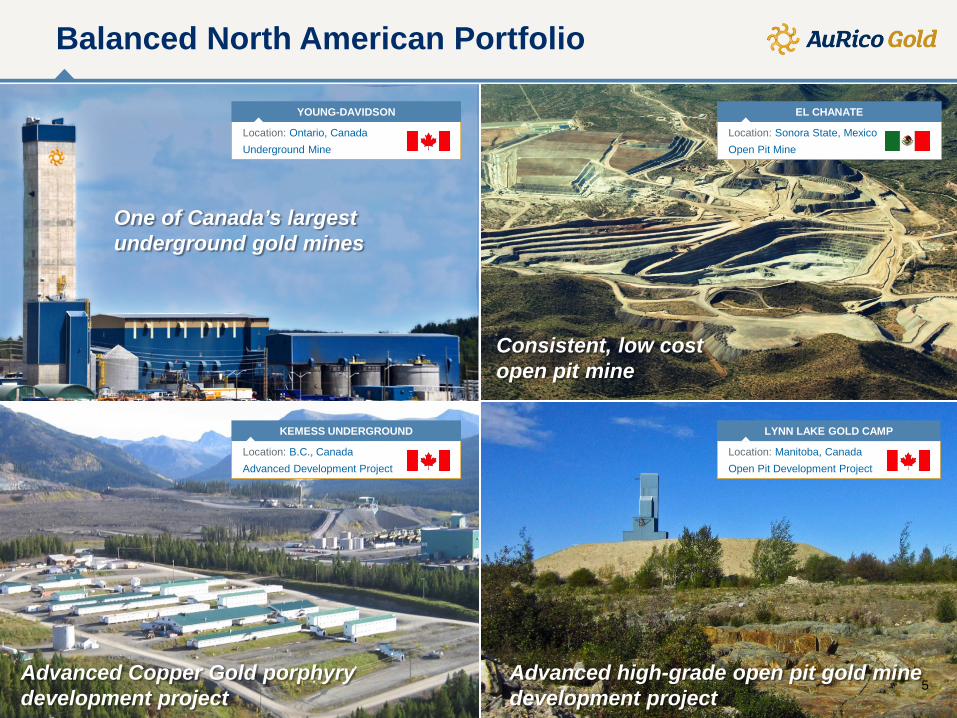
Balanced North American Portfolio
5
YOUNG-DAVIDSON
Location: Ontario, Canada Underground Mine
EL CHANATE
Location: Sonora State, Mexico Open Pit Mine
KEMESS UNDERGROUND
Location: B.C., Canada Advanced Development Project
LYNN LAKE GOLD CAMP
Location: Manitoba, Canada Open Pit Development Project
Advanced high-grade open pit gold mine development project
One of Canada’s largest underground gold mines
Consistent, low cost open pit mine
Advanced Copper Gold porphyry development project
6
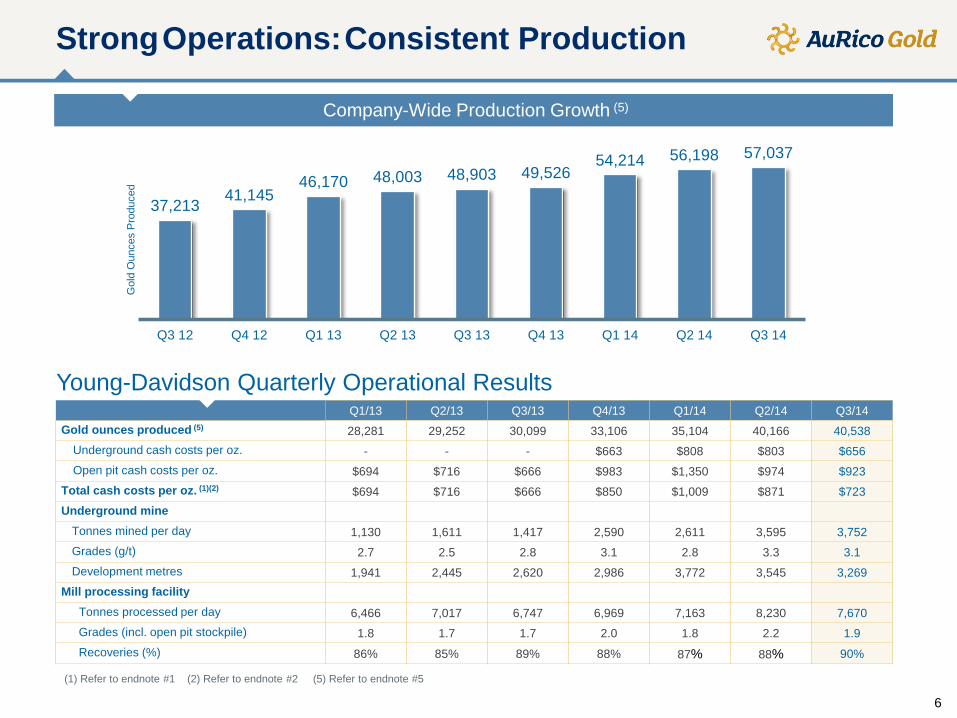
Company-Wide Production Growth (5)
Q1/13 Q2/13 Q3/13 Q4/13 Q1/14 Q2/14 Q3/14 Gold ounces produced (5) 28,281 29,252 30,099 33,106 35,104 40,166 40,538
Underground cash costs per oz. - - - $663 $808 $803 $656 Open pit cash costs per oz. $694 $716 $666 $983 $1,350 $974 $923
Total cash costs per oz. (1)(2) $694 $716 $666 $850 $1,009 $871 $723 Underground mine
Tonnes mined per day 1,130 1,611 1,417 2,590 2,611 3,595 3,752 Grades (g/t) 2.7 2.5 2.8 3.1 2.8 3.3 3.1 Development metres 1,941 2,445 2,620 2,986 3,772 3,545 3,269
Mill processing facility Tonnes processed per day 6,466 7,017 6,747 6,969 7,163 8,230 7,670 Grades (incl. open pit stockpile) 1.8 1.7 1.7 2.0 1.8 2.2 1.9 Recoveries (%) 86% 85% 89% 88% 87% 88% 90%
Young-Davidson Quarterly Operational Results
(1) Refer to endnote #1 (2) Refer to endnote #2 (5) Refer to endnote #5
37,213 41,145 46,170 48,003 48,903 49,526
54,214 56,198 57,037
Q3 12 Q4 12 Q1 13 Q2 13 Q3 13 Q4 13 Q1 14 Q2 14 Q3 14
Gol
d O
unce
s P
rodu
ced
Strong Operations: Consistent Production
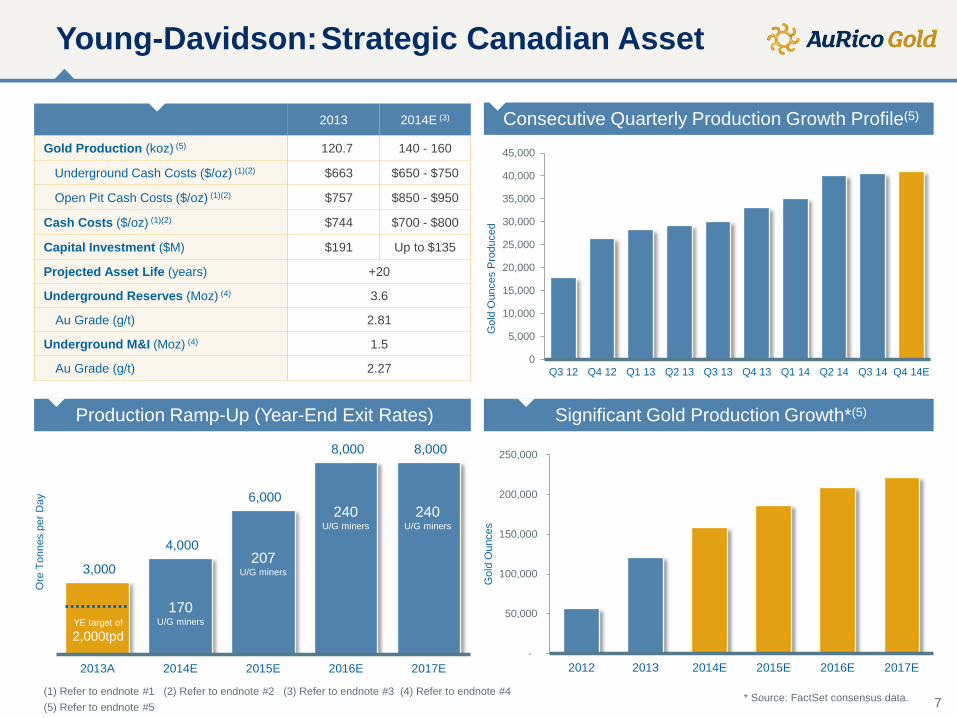
3,000
4,000
6,000
8,000 8,000
2013A 2014E 2015E 2016E 2017E
Ore
Ton
nes
per D
ay
YE target of 2,000tpd
170 U/G miners
207 U/G miners
240 U/G miners
240 U/G miners
Young-Davidson: Strategic Canadian Asset
7
2013 2014E (3)
Gold Production (koz) (5) 120.7 140 - 160
Underground Cash Costs ($/oz) (1)(2) $663 $650 - $750
Open Pit Cash Costs ($/oz) (1)(2) $757 $850 - $950
Cash Costs ($/oz) (1)(2) $744 $700 - $800
Capital Investment ($M) $191 Up to $135
Projected Asset Life (years) +20
Underground Reserves (Moz) (4) 3.6
Au Grade (g/t) 2.81
Underground M&I (Moz) (4) 1.5
Au Grade (g/t) 2.27
Consecutive Quarterly Production Growth Profile(5)
0
5,000
10,000
15,000
20,000
25,000
30,000
35,000
40,000
45,000
Q3 12 Q4 12 Q1 13 Q2 13 Q3 13 Q4 13 Q1 14 Q2 14 Q3 14 Q4 14E
Gol
d O
unce
s P
rodu
ced
Significant Gold Production Growth*(5) Production Ramp-Up (Year-End Exit Rates)
-
50,000
100,000
150,000
200,000
250,000
2012 2013 2014E 2015E 2016E 2017E
Gol
d O
unce
s
(1) Refer to endnote #1 (2) Refer to endnote #2 (3) Refer to endnote #3 (4) Refer to endnote #4 (5) Refer to endnote #5
* Source: FactSet consensus data.
9890L
9590L
9400L
9200L
8900L
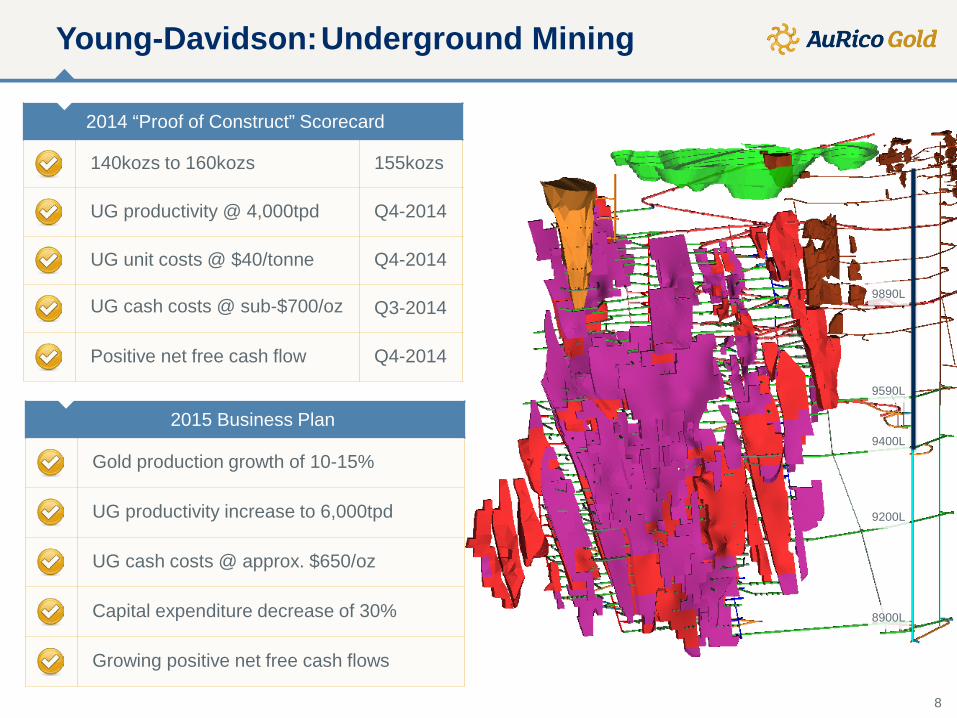
Young-Davidson: Underground Mining
8
2014 “Proof of Construct” Scorecard
140kozs to 160kozs 155kozs
UG productivity @ 4,000tpd Q4-2014
UG unit costs @ $40/tonne Q4-2014
UG cash costs @ sub-$700/oz Q3-2014
Positive net free cash flow Q4-2014
2015 Business Plan
Gold production growth of 10-15%
UG productivity increase to 6,000tpd
UG cash costs @ approx. $650/oz
Capital expenditure decrease of 30%
Growing positive net free cash flows
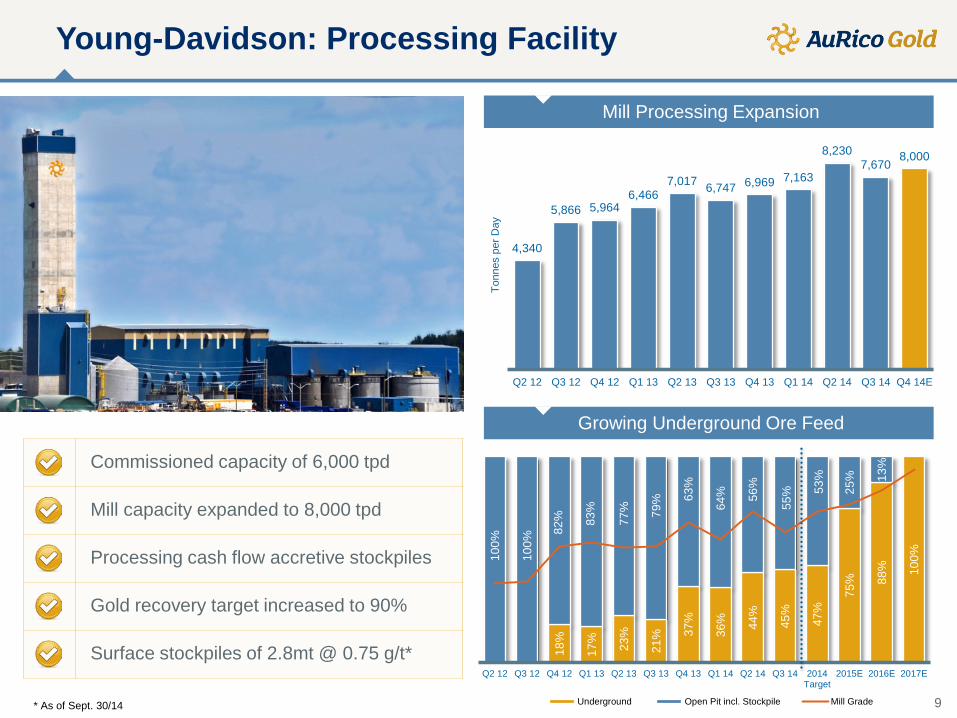
Young-Davidson: Processing Facility
18%
17%
23%
21%
37%
36%
44%
45%
47%
75%
88%
100%
100%
100%
82%
83%
77%
79%
63%
64%
56%
55%
53%
25%
13%
Q2 12 Q3 12 Q4 12 Q1 13 Q2 13 Q3 13 Q4 13 Q1 14 Q2 14 Q3 14 2014Target
2015E 2016E 2017E
Underground Open Pit incl. Stockpile Mill Grade
4,340
5,866 5,964 6,466
7,017 6,747 6,969 7,163
8,230 7,670
8,000
Q2 12 Q3 12 Q4 12 Q1 13 Q2 13 Q3 13 Q4 13 Q1 14 Q2 14 Q3 14 Q4 14E
Tonn
es p
er D
ay
9
Mill Processing Expansion
Growing Underground Ore Feed
Commissioned capacity of 6,000 tpd
Mill capacity expanded to 8,000 tpd
Processing cash flow accretive stockpiles
Gold recovery target increased to 90%
Surface stockpiles of 2.8mt @ 0.75 g/t*
* As of Sept. 30/14

Young-Davidson: Strategic Canadian Asset
21 20
14 13
7 5 4
Source: Scotiabank
580
225 170 165 135
85 65
Source: Scotiabank
10
Indicative Mine Life (years)
2016 Gold Production Profile Q4 Cash Flow as at Nov 30th ($M's)
Opex
$15 Sustaining
$4
Growth
$9
Cash Flow
$4
Revenue
$32
Transitioning to Inaugural Positive Net Free Cash Flow in Q4-2014
Young-Davidson: Strategic Canadian Asset
400
500
600
700
800
900
1000
1100
1200
0
50
100
150
200
250
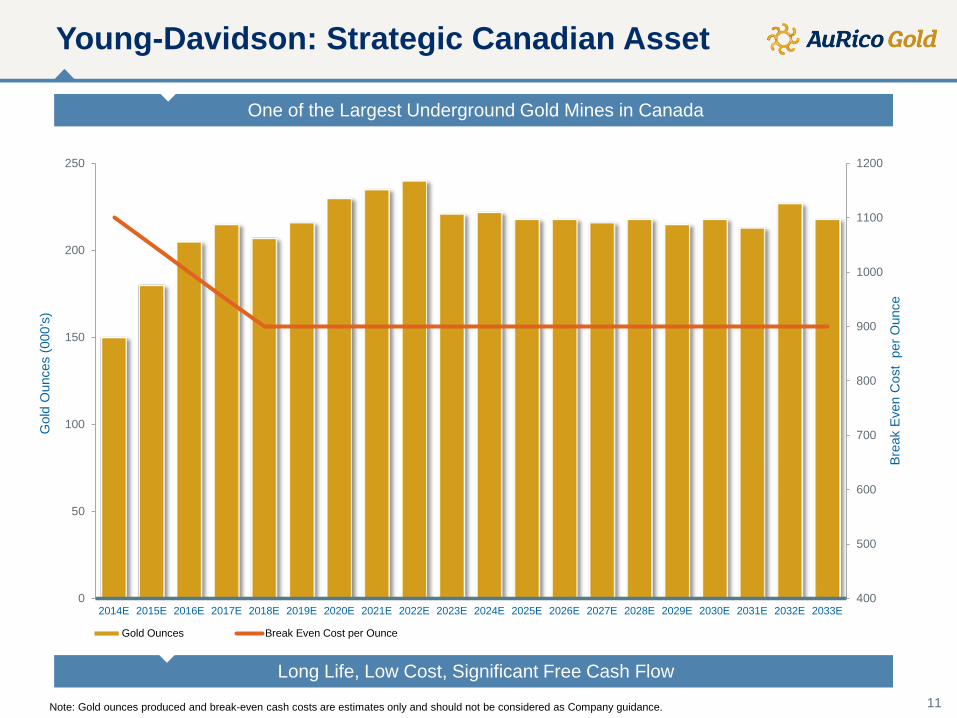
2014E 2015E 2016E 2017E 2018E 2019E 2020E 2021E 2022E 2023E 2024E 2025E 2026E 2027E 2028E 2029E 2030E 2031E 2032E 2033E
Brea
k Ev
en C
ost
per O
unce
Gol
d O
unce
s (0
00’s
)
Gold Ounces Break Even Cost per Ounce
11
One of the Largest Underground Gold Mines in Canada
Long Life, Low Cost, Significant Free Cash Flow
Note: Gold ounces produced and break-even cash costs are estimates only and should not be considered as Company guidance.
12
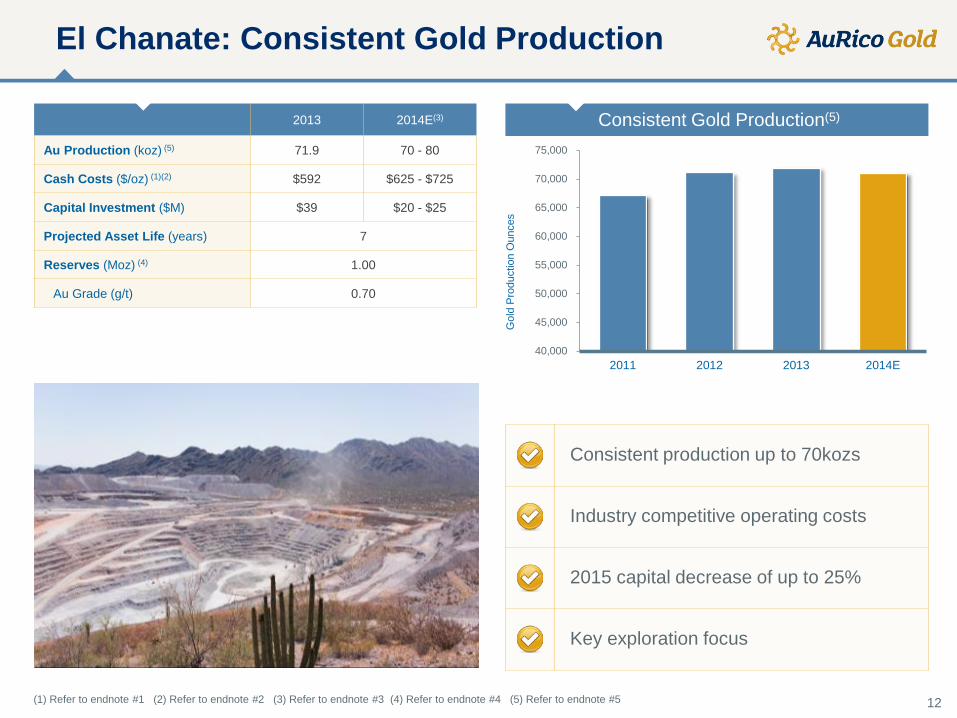
El Chanate: Consistent Gold Production
2013 2014E(3)
Au Production (koz) (5) 71.9 70 - 80
Cash Costs ($/oz) (1)(2) $592 $625 - $725
Capital Investment ($M) $39 $20 - $25
Projected Asset Life (years) 7
Reserves (Moz) (4) 1.00
Au Grade (g/t) 0.70
40,000
45,000
50,000
55,000
60,000
65,000
70,000
75,000
2011 2012 2013 2014E
Gol
d P
rodu
ctio
n O
unce
s
Consistent Gold Production(5)
(1) Refer to endnote #1 (2) Refer to endnote #2 (3) Refer to endnote #3 (4) Refer to endnote #4 (5) Refer to endnote #5
Consistent production up to 70kozs
Industry competitive operating costs
2015 capital decrease of up to 25%
Key exploration focus
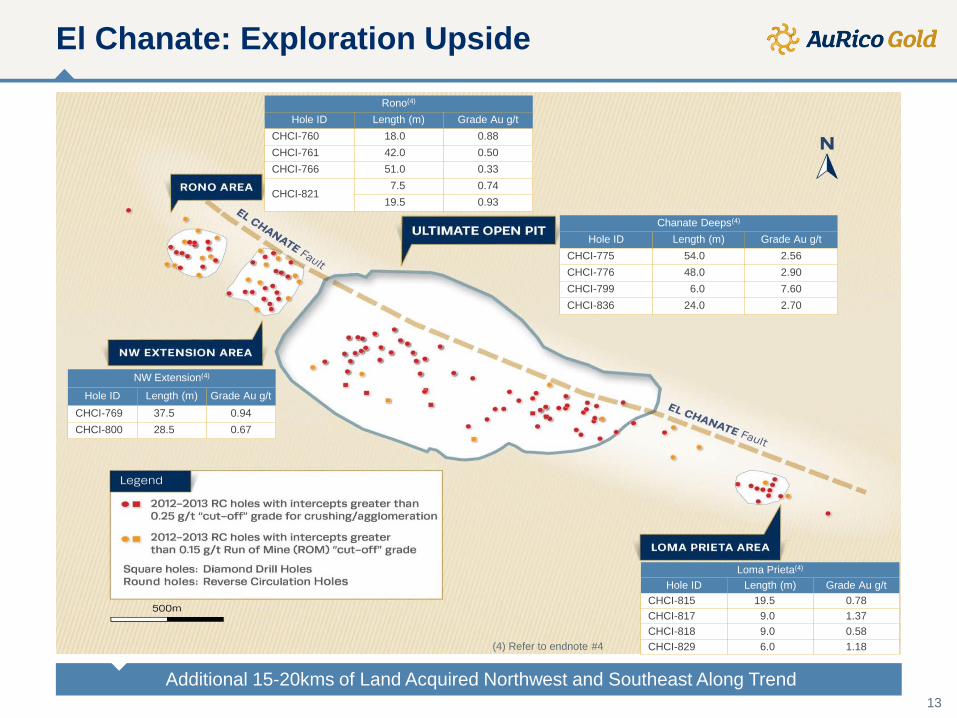
13 Additional 15-20kms of Land Acquired Northwest and Southeast Along Trend
Chanate Deeps(4)
Hole ID Length (m) Grade Au g/t CHCI-775 54.0 2.56 CHCI-776 48.0 2.90 CHCI-799 6.0 7.60 CHCI-836 24.0 2.70
NW Extension(4)
Hole ID Length (m) Grade Au g/t CHCI-769 37.5 0.94 CHCI-800 28.5 0.67
Rono(4) Hole ID Length (m) Grade Au g/t
CHCI-760 18.0 0.88 CHCI-761 42.0 0.50 CHCI-766 51.0 0.33
CHCI-821 7.5 0.74
19.5 0.93
Loma Prieta(4) Hole ID Length (m) Grade Au g/t
CHCI-815 19.5 0.78 CHCI-817 9.0 1.37 CHCI-818 9.0 0.58 CHCI-829 6.0 1.18 (4) Refer to endnote #4
El Chanate: Exploration Upside
14
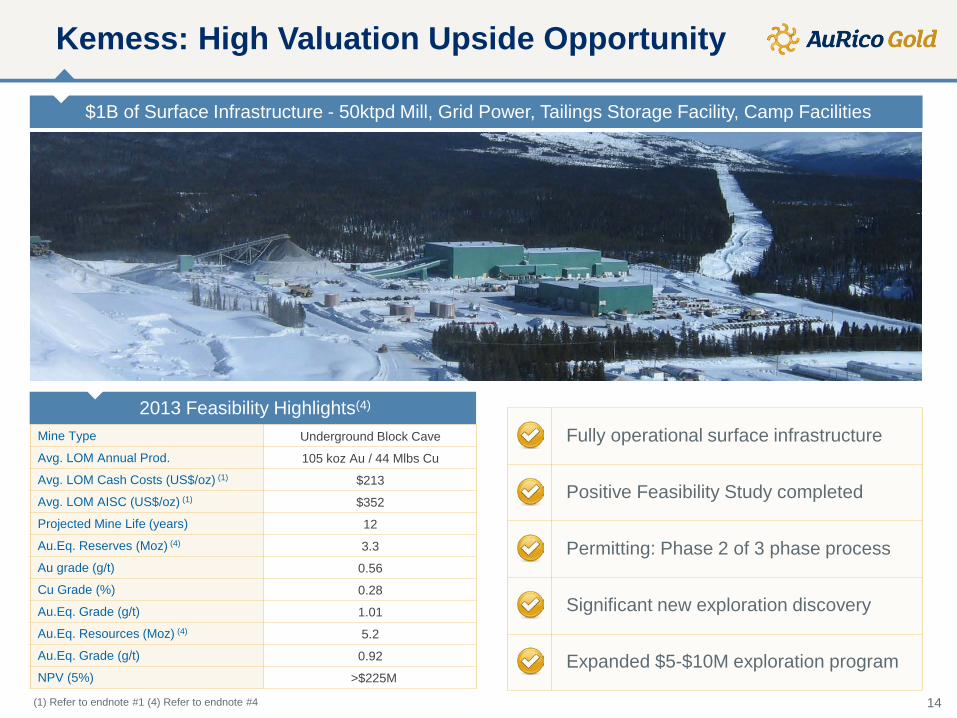
Mine Type Underground Block Cave
Avg. LOM Annual Prod. 105 koz Au / 44 Mlbs Cu
Avg. LOM Cash Costs (US$/oz) (1) $213
Avg. LOM AISC (US$/oz) (1) $352
Projected Mine Life (years) 12
Au.Eq. Reserves (Moz) (4) 3.3
Au grade (g/t) 0.56
Cu Grade (%) 0.28
Au.Eq. Grade (g/t) 1.01
Au.Eq. Resources (Moz) (4) 5.2
Au.Eq. Grade (g/t) 0.92
NPV (5%) >$225M
2013 Feasibility Highlights(4)
$1B of Surface Infrastructure - 50ktpd Mill, Grid Power, Tailings Storage Facility, Camp Facilities
Kemess: High Valuation Upside Opportunity
(1) Refer to endnote #1 (4) Refer to endnote #4
Fully operational surface infrastructure
Positive Feasibility Study completed
Permitting: Phase 2 of 3 phase process
Significant new exploration discovery
Expanded $5-$10M exploration program
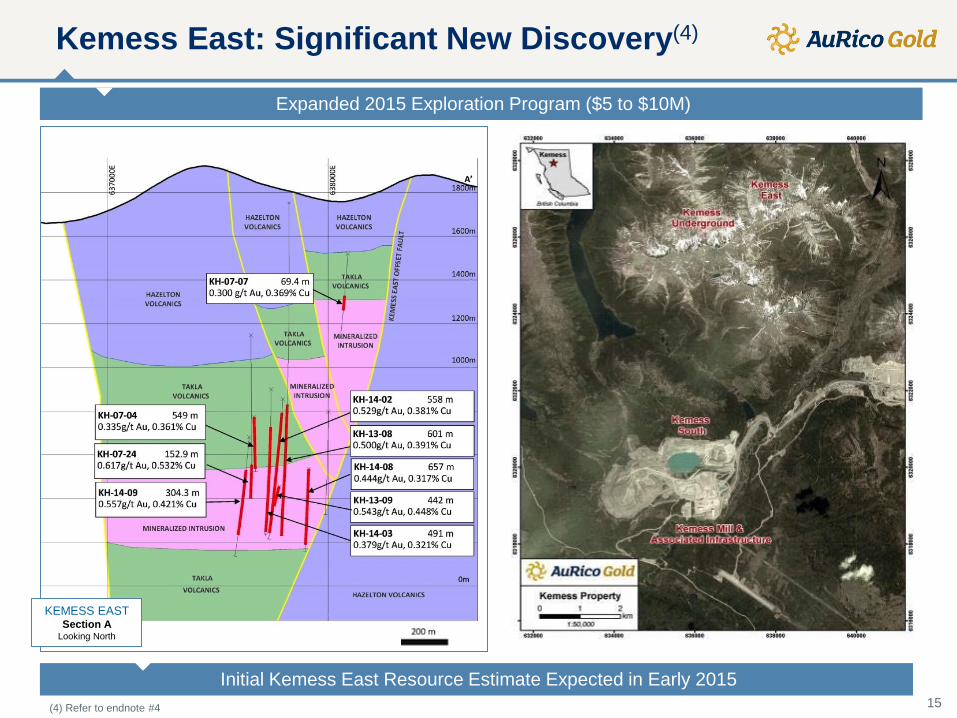
Kemess East: Significant New Discovery(4)
15
KEMESS EAST Section A
Looking North
Expanded 2015 Exploration Program ($5 to $10M)
Initial Kemess East Resource Estimate Expected in Early 2015 (4) Refer to endnote #4
Lynn Lake – High Grade Open Pit Project
16
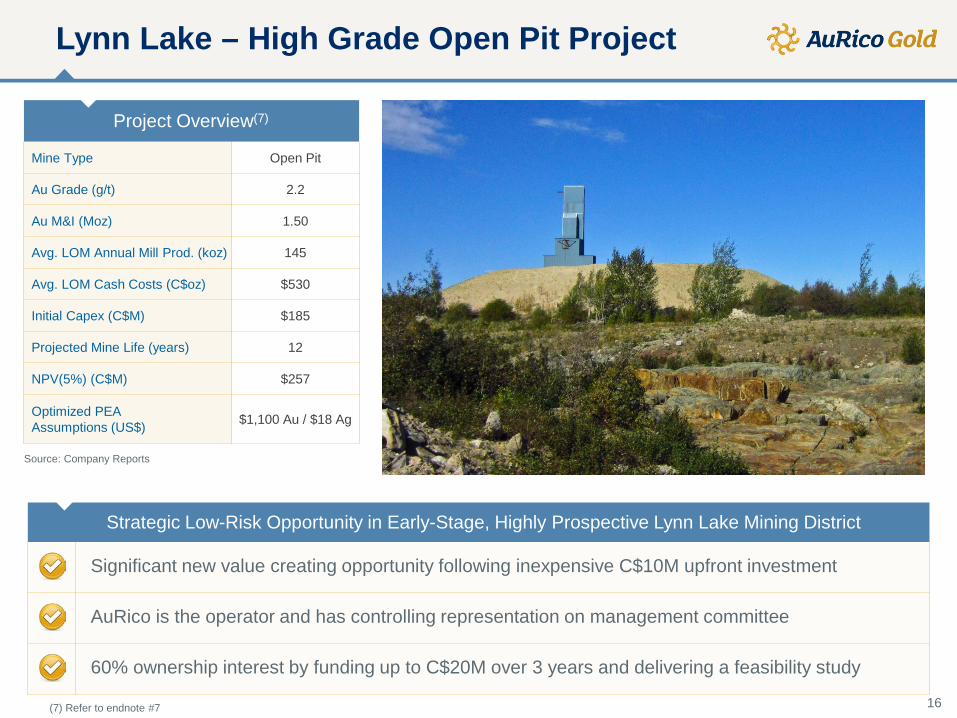
Project Overview(7)
Mine Type Open Pit
Au Grade (g/t) 2.2
Au M&I (Moz) 1.50
Avg. LOM Annual Mill Prod. (koz) 145
Avg. LOM Cash Costs (C$oz) $530
Initial Capex (C$M) $185
Projected Mine Life (years) 12
NPV(5%) (C$M) $257
Optimized PEA Assumptions (US$) $1,100 Au / $18 Ag
Source: Company Reports
Strategic Low-Risk Opportunity in Early-Stage, Highly Prospective Lynn Lake Mining District
Significant new value creating opportunity following inexpensive C$10M upfront investment
AuRico is the operator and has controlling representation on management committee
60% ownership interest by funding up to C$20M over 3 years and delivering a feasibility study
(7) Refer to endnote #7

Lynn Lake – High Grade Open Pit Project
One of the highest grade open pit deposits in Canada with significant exploration potential
Existing infrastructure in place, low power rates of C$0.027/kwh
Commenced Feasibility Study with Young-Davidson project team as lead
Significant 2015 resource delineation & extension drilling program ($6M to $8M)
Source: Company Reports
17

2017 Young-Davidson Gold Mine
Operation at Full Capacity
Significant Free Cash Flow Profile
El Chanate Gold Mine
Consistent Production
Exploration Drilling Program
Kemess Development Project
Construction Decision
Kemess East Feasibility Advancement
Lynn Lake Development Project
Exploration Drilling Program Updates
Feasibility Published
Expected Receipt of Permits
Construction Decision
2016 Young-Davidson Gold Mine
Production Ramp up to 8,000tpd
Growing Free Cash Flow
El Chanate Gold Mine
Consistent Production
Exploration Drilling Program
Kemess Development Project
Expected Receipt of Permits
Kemess East Feasibility
Lynn Lake Development Project
Exploration Drilling Program Updates
Feasibility Advancement
Permitting Advancement
2015
Young-Davidson Gold Mine
Production Ramp up to 6,000tpd
Growing Free Cash Flow
El Chanate Gold Mine
Consistent Production
Exploration Drilling Program
Kemess Development Project
Initial Resource Estimate at Kemess East
Permitting Advancement
Expanded Exploration Drilling Program
Lynn Lake Development Project
Exploration Drilling Program Updates
Resource Extension & Delineation Program
Feasibility Program Advancement
AuRico: Value Creation Business Plan
18
Valuation Catalysts

Balanced Portfolio: Built for Success
150
170
190
210
230
250
270
290
310
330
350
FY 14E FY 15E FY 16E FY 17E FY 18E
Oun
ces
Pro
duce
d (0
00’s
)
(0.50)
(0.40)
(0.30)
(0.20)
(0.10)
0.00
0.10
0.20
0.30
0.40
FY 14E FY 15E FY 16E FY 17E FY 18E
Per
Sha
re
0.00
0.10
0.20
0.30
0.40
0.50
0.60
0.70
FY 14E FY 15E FY 16E FY 17E FY 18E
Per
Sha
re
0.0
0.5
1.0
1.5
2.0
2.5
3.0
FY 14E FY 15E FY 16E
Div
iden
d Y
ield
(%)
19
Growing Operating Cash Flows* Growing Production Profile*(5)
Consensus Illustrative Dividend Yield* (6) Growing Free Cash Flows*
* Source: FactSet consensus data. (5) Refer to endnote #5 (6) Refer to endnote #6

Built for Success
Exclusive North American portfolio
Low cost, long life assets
Significant production growth
Growing free cash flow profile
Strong resource project pipeline
Strong liquidity profile
Significant Canadian tax loss pools
Favourable Canadian dollar exposure
Quarterly dividend distributions
-
50,000
100,000
150,000
200,000
250,000
300,000
350,000
FY 12 FY 13 FY 14E FY 15E FY 16E FY 17E
Gol
d O
unce
s (5
)
AuRico Gold: Built For Success
20
Significant Production Growth*
Growing Free Cash Flow*
(0.50)
(0.40)
(0.30)
(0.20)
(0.10)
0.00
0.10
0.20
0.30
0.40
FY 14E FY 15E FY 16E FY 17E FY 18E
Free
Cas
h Fl
ow p
er S
hare
* Source: FactSet consensus data. (5) Refer to endnote #5
Appendix

Endnotes
22
All amounts are in US dollars unless otherwise indicated
1. Cash Costs per Gold Ounce and All-In Sustaining Costs (“AISC”) Per Gold Ounce are Non-GAAP measures that do not have any standardized Cash Costs per Gold Ounce and All-In Sustaining Costs (“AISC”) Per Gold Ounce are Non-GAAP measures that do not have any standardized meaning prescribed by International Financial Reporting Standards (“IFRS” or “GAAP”), and that should not be considered in isolation from or as a substitute for performance measures prepared in accordance with GAAP. See the Non-GAAP Measures section on page 23 of the Management's Discussion and Analysis for the year ended December 31, 2013 available on the Company website at www.auricogold.com.
2. Cash costs for the Young-Davidson and El Chanate mines are calculated on a per gold ounce basis, net of by-product revenues and net realizable value adjustments and reversals. Prior to 2014, gold ounces include ounces sold at the El Chanate mine and ounces produced at the Young-Davidson mine. Commencing in 2014 cash costs for both the Young-Davidson and El Chanate mines were calculated based on ounces sold. Prior to commissioning the underground mine at Young-Davidson, cash costs are calculated on ounces produced from the open pit only. All underground costs were capitalized, and any revenue related to underground ounces sold was credited against capital expenditures. Subsequent to the declaration of commercial production in the underground mine, cash costs are calculated on ounces produced from both the open pit and underground mines, and revenue related to the sale of underground ounces is recognized in the Company’s Statement of Operations as revenue..
3. For more information regarding AuRico Gold’s 2014 operational estimates, including production, costs, and capital investments, please refer to the press releases dated February 6, 2014 titled AuRico Gold Announces 2014 Operational Outlook and August 7, 2014 titled AuRico Gold Reports Second Quarter Financial Results and Eighth Consecutive Quarter of Record Gold Production as Young-Davidson Ramp-Up Exceeds Expectations, which are available on the Company website at www.auricogold.com.
4. Reserves and resources for Young-Davidson and El Chanate mines, and Orion represent gold grade as per technical reports and Company disclosure. For more information regarding AuRico Gold’s Mineral Reserves and Resources as at December 31, 2013, please refer to the press release dated March 3, 2014 titled AuRico Reports 2013 Reserve & Resource Update available on the Company website at www.auricogold.com. Measured and indicated resources excludes inferred resources. Core lengths in El Chanate drilling highlights are not necessarily true widths. For more information on the Kemess Feasibility Study, please refer to the press release dated March 25, 2013 titled AuRico Reports 2012 Reserve & Resource Update and Kemess Feasibility Study Results. For more information regarding drilling results from the Kemess East discovery refer to the press release issued December 15, 2014 titled AuRico Gold Announces a New Gold-Copper Porphyry Discovery at the Kemess Project; Initial Resource Estimate Expected in Early 2015.
5. Production figures include gold ounces only. 2013 production at the Young-Davidson mine includes pre-production ounces, which include ounces produced prior to the declaration of commercial production on September 1, 2012, and the declaration of commercial production in the underground mine on October 31, 2013.
6. The illustrative yield assumes the share price as of Nov. 11, 2014. Consensus data is as of Nov. 12, 2014. 2014 to 2017 per share numbers are based on the number of shares outstanding as of November 2014. For more information regarding AuRico Gold’s dividend policy, please refer to the press releases dated May 8, 2014 and November 6, 2016, available on the Company website at www.auricogold.com.
7. For more information regarding the Lynn Lake District, please refer to the press release issued by Carlisle Goldfields February 27, 2014 titled Carlisle Announces Optimized PEA of the Farley and MacLellan deposits at Lynn Lake returns Post-Tax IRR of 26.3% at US$1100 gold price.

AuRico: Overhead Cost Rationalization
38
18 17 15
0
5
10
15
20
25
30
35
40
45
2012 2013 2014 2015
28
20 19
16
0
5
10
15
20
25
30
35
2012 2013 2014 2015
23
Year-Over-Year Exploration Spend (US$M's) Year-Over-Year G&A Cash Spend (US$M's)
Company-wide cost rationalization programs demonstrating positive year-over-year trend
Restructured head office staffing and have deferred non-essential exploration programs
Corporate wide G&A cash spend is averaging 1.3% of the Company’s enterprise value
Exploration expenditures have been reduced to approx. 5% of revenues
• Young-Davidson production depletion was replenished
• New significant gold-copper porphyry mineralized system identified at Kemess East
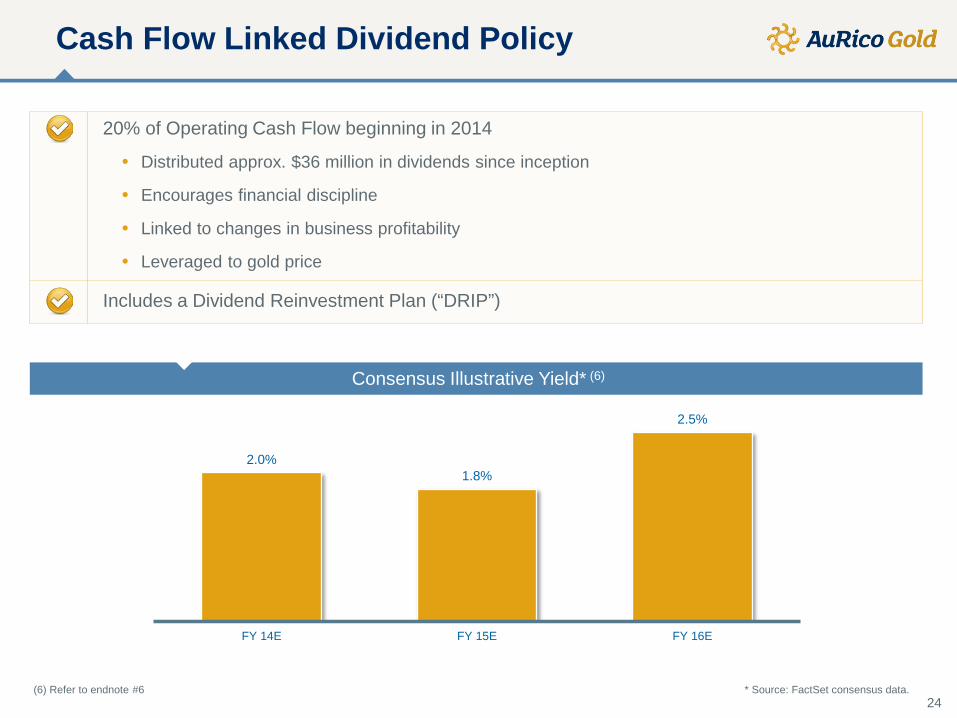
Cash Flow Linked Dividend Policy
2.0% 1.8%
2.5%
FY 14E FY 15E FY 16E
24
Consensus Illustrative Yield* (6)
(6) Refer to endnote #6 * Source: FactSet consensus data.
20% of Operating Cash Flow beginning in 2014
• Distributed approx. $36 million in dividends since inception
• Encourages financial discipline
• Linked to changes in business profitability
• Leveraged to gold price
Includes a Dividend Reinvestment Plan (“DRIP”)
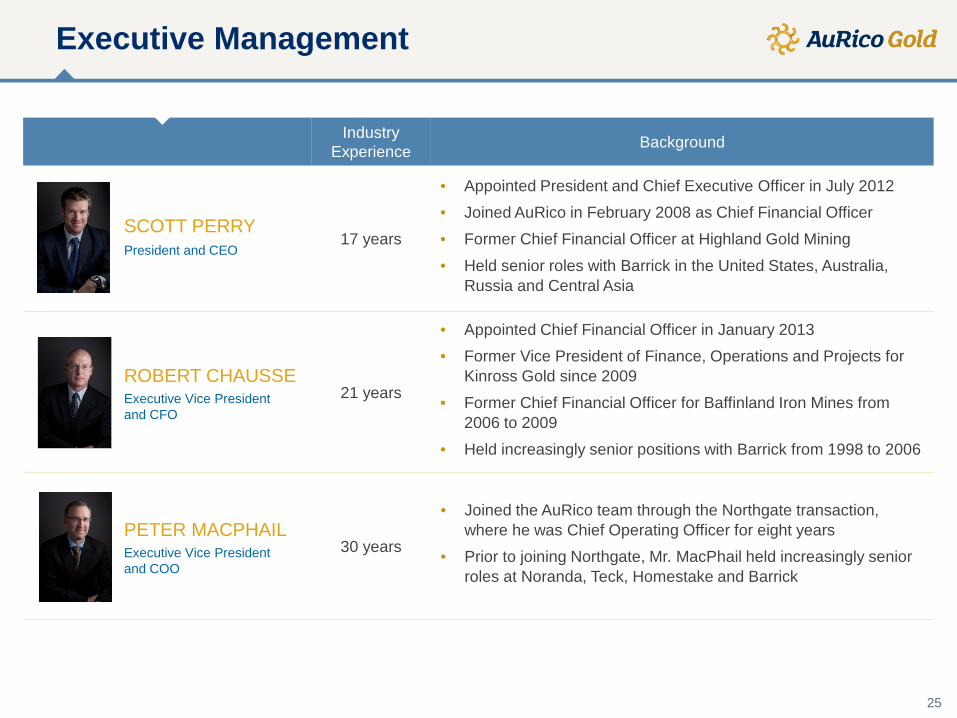
Industry Experience Background
17 years
• Appointed President and Chief Executive Officer in July 2012 • Joined AuRico in February 2008 as Chief Financial Officer
• Former Chief Financial Officer at Highland Gold Mining
• Held senior roles with Barrick in the United States, Australia, Russia and Central Asia
21 years
• Appointed Chief Financial Officer in January 2013 • Former Vice President of Finance, Operations and Projects for
Kinross Gold since 2009
• Former Chief Financial Officer for Baffinland Iron Mines from 2006 to 2009
• Held increasingly senior positions with Barrick from 1998 to 2006
30 years
• Joined the AuRico team through the Northgate transaction, where he was Chief Operating Officer for eight years
• Prior to joining Northgate, Mr. MacPhail held increasingly senior roles at Noranda, Teck, Homestake and Barrick
SCOTT PERRY President and CEO
ROBERT CHAUSSE Executive Vice President and CFO
PETER MACPHAIL Executive Vice President and COO
Executive Management
25
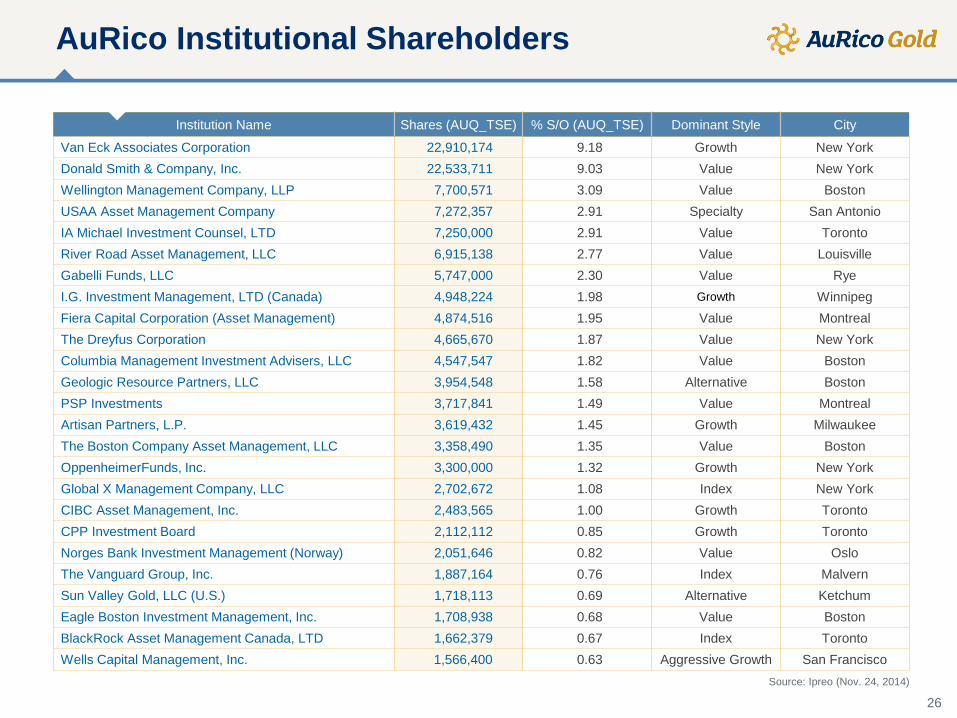
Institution Name Shares (AUQ_TSE) % S/O (AUQ_TSE) Dominant Style City
Van Eck Associates Corporation 22,910,174 9.18 Growth New York Donald Smith & Company, Inc. 22,533,711 9.03 Value New York Wellington Management Company, LLP 7,700,571 3.09 Value Boston USAA Asset Management Company 7,272,357 2.91 Specialty San Antonio IA Michael Investment Counsel, LTD 7,250,000 2.91 Value Toronto River Road Asset Management, LLC 6,915,138 2.77 Value Louisville Gabelli Funds, LLC 5,747,000 2.30 Value Rye I.G. Investment Management, LTD (Canada) 4,948,224 1.98 Growth Winnipeg Fiera Capital Corporation (Asset Management) 4,874,516 1.95 Value Montreal The Dreyfus Corporation 4,665,670 1.87 Value New York Columbia Management Investment Advisers, LLC 4,547,547 1.82 Value Boston Geologic Resource Partners, LLC 3,954,548 1.58 Alternative Boston PSP Investments 3,717,841 1.49 Value Montreal Artisan Partners, L.P. 3,619,432 1.45 Growth Milwaukee The Boston Company Asset Management, LLC 3,358,490 1.35 Value Boston OppenheimerFunds, Inc. 3,300,000 1.32 Growth New York Global X Management Company, LLC 2,702,672 1.08 Index New York CIBC Asset Management, Inc. 2,483,565 1.00 Growth Toronto CPP Investment Board 2,112,112 0.85 Growth Toronto Norges Bank Investment Management (Norway) 2,051,646 0.82 Value Oslo The Vanguard Group, Inc. 1,887,164 0.76 Index Malvern Sun Valley Gold, LLC (U.S.) 1,718,113 0.69 Alternative Ketchum Eagle Boston Investment Management, Inc. 1,708,938 0.68 Value Boston BlackRock Asset Management Canada, LTD 1,662,379 0.67 Index Toronto Wells Capital Management, Inc. 1,566,400 0.63 Aggressive Growth San Francisco
Source: Ipreo (Nov. 24, 2014)
AuRico Institutional Shareholders
26
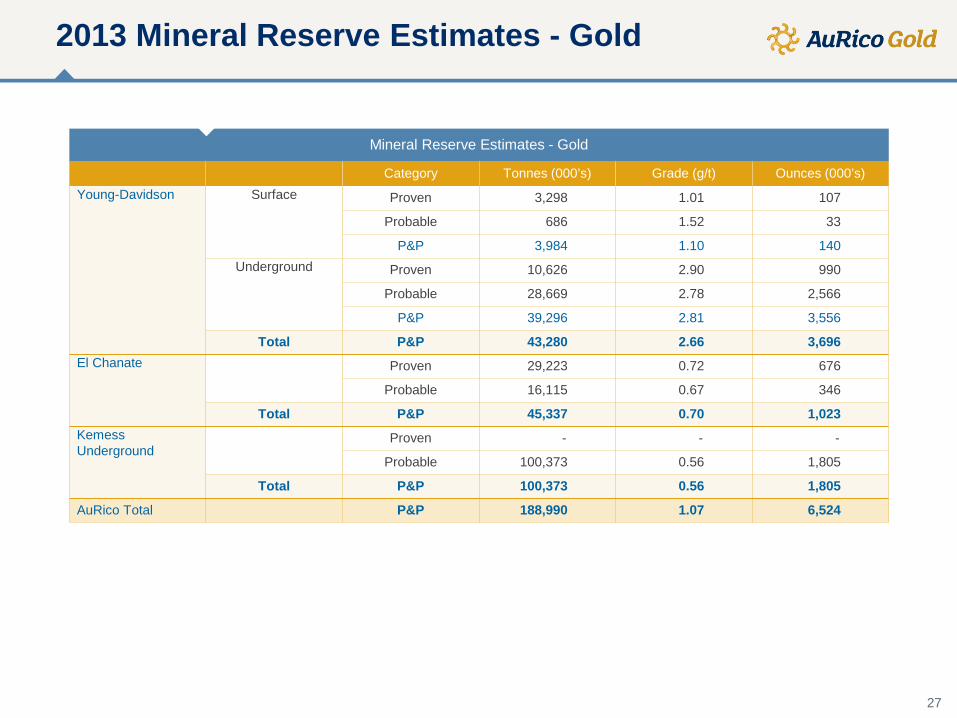
Mineral Reserve Estimates - Gold
Category Tonnes (000’s) Grade (g/t) Ounces (000’s) Young-Davidson
Surface Proven 3,298 1.01 107
Probable 686 1.52 33
P&P 3,984 1.10 140 Underground Proven 10,626 2.90 990
Probable 28,669 2.78 2,566
P&P 39,296 2.81 3,556
Total P&P 43,280 2.66 3,696 El Chanate
Proven 29,223 0.72 676
Probable 16,115 0.67 346
Total P&P 45,337 0.70 1,023 Kemess Underground
Proven - - -
Probable 100,373 0.56 1,805
Total P&P 100,373 0.56 1,805
AuRico Total P&P 188,990 1.07 6,524
2013 Mineral Reserve Estimates - Gold
27
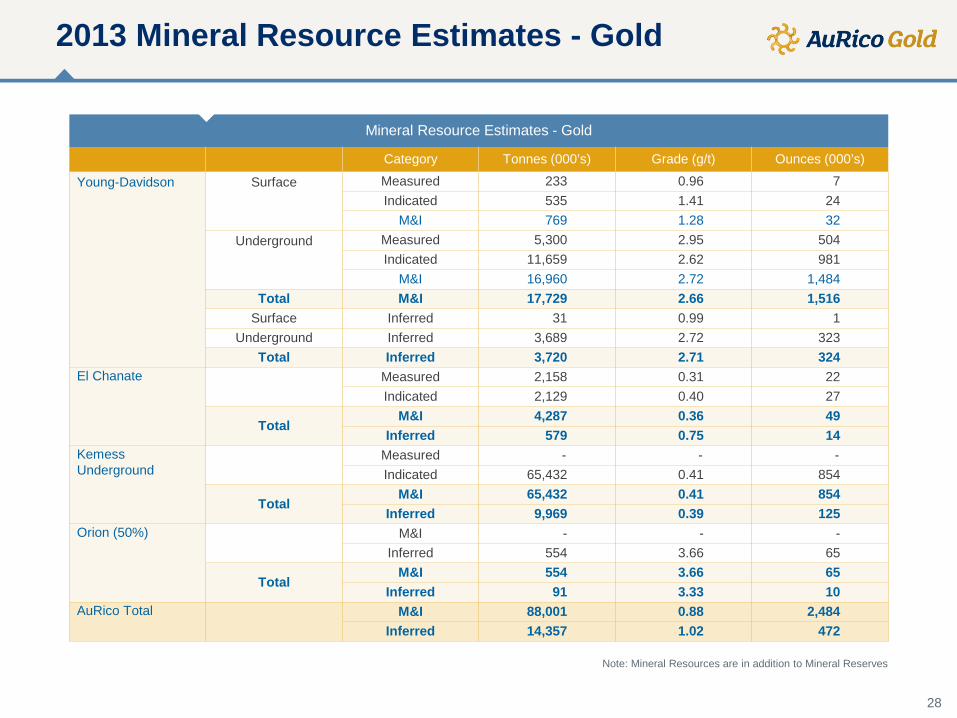
Note: Mineral Resources are in addition to Mineral Reserves
Mineral Resource Estimates - Gold
Category Tonnes (000’s) Grade (g/t) Ounces (000’s)
Young-Davidson Surface Measured 233 0.96 7 Indicated 535 1.41 24
M&I 769 1.28 32 Underground Measured 5,300 2.95 504
Indicated 11,659 2.62 981 M&I 16,960 2.72 1,484
Total M&I 17,729 2.66 1,516 Surface Inferred 31 0.99 1
Underground Inferred 3,689 2.72 323 Total Inferred 3,720 2.71 324
El Chanate Measured 2,158 0.31 22 Indicated 2,129 0.40 27
Total M&I 4,287 0.36 49
Inferred 579 0.75 14 Kemess Underground
Measured - - - Indicated 65,432 0.41 854
Total M&I 65,432 0.41 854
Inferred 9,969 0.39 125 Orion (50%) M&I - - -
Inferred 554 3.66 65
Total M&I 554 3.66 65
Inferred 91 3.33 10 AuRico Total
M&I 88,001 0.88 2,484 Inferred 14,357 1.02 472
2013 Mineral Resource Estimates - Gold
28
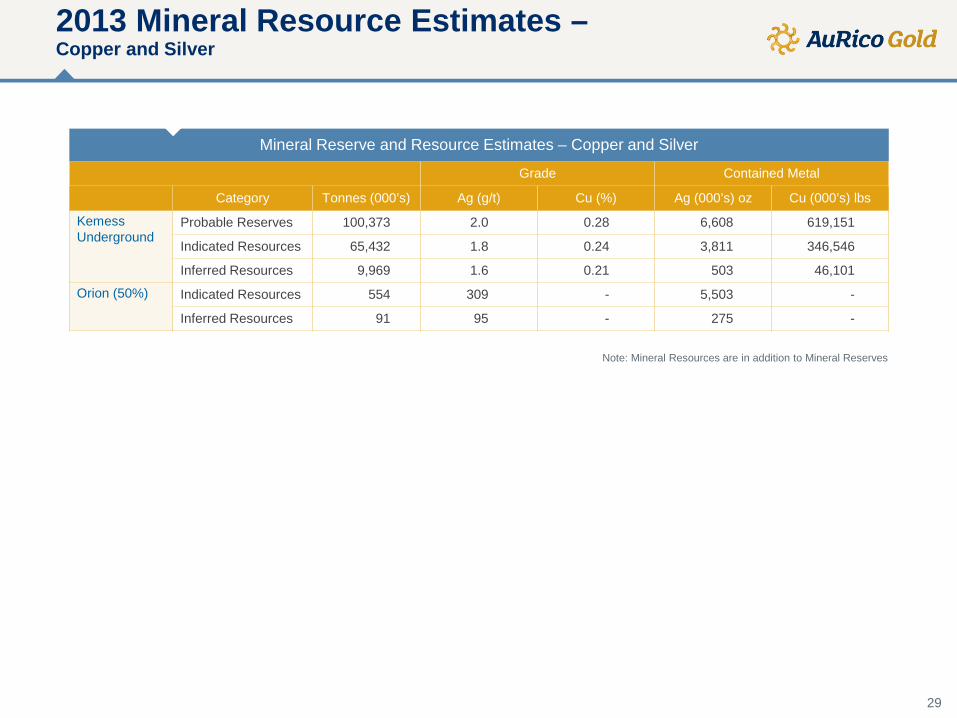
Mineral Reserve and Resource Estimates – Copper and Silver
Grade Contained Metal
Category Tonnes (000’s) Ag (g/t) Cu (%) Ag (000’s) oz Cu (000’s) lbs
Kemess Underground
Probable Reserves 100,373 2.0 0.28 6,608 619,151
Indicated Resources 65,432 1.8 0.24 3,811 346,546
Inferred Resources 9,969 1.6 0.21 503 46,101
Orion (50%) Indicated Resources 554 309 - 5,503 -
Inferred Resources 91 95 - 275 -
2013 Mineral Resource Estimates – Copper and Silver
29
Note: Mineral Resources are in addition to Mineral Reserves
Notes to Mineral Reserve and Resource tables:
• Mineral Reserves and Resources have been stated as at December 31, 2013.
• Mineral Resources are exclusive of Mineral Reserves. Mineral Resources that are not Mineral Reserves do not have demonstrated economic viability.
• El Chanate and Young-Davidson assumed a gold price of $1,250 per ounce for reserves and $1,450 per ounce for resources.
• Kemess Underground assumed a gold price of $1,300 per ounce, a silver price of $23.00 per ounce for silver, and a copper price of $3.00 per pound for reserves. Kemess assumed a $13.00 NSR cutoff for resources.
• Orion assumed a gold price of $850 per ounce and a silver price of $13.00 per ounce for resources.
• Mineral Reserves assume the following cutoff grades and process recoveries: • Young-Davidson – Surface: 0.50 gpt cutoff, 91% mill recovery • Young-Davidson – Underground: 2.05 gpt cutoff, 91% mill recovery • El Chanate: 0.15 gpt cutoff, 30%-65% leach recovery • Kemess Underground: $15 NSR cutoff, mill recovery of 72% for gold and 91% for copper
• Reserves have been reported in accordance with NI 43-101, as required by Canadian securities regulatory authorities. In addition, while the terms “Measured”, “Indicated and “Inferred” Mineral Resources are required pursuant to NI 43-101, the SEC does not recognize such terms. Canadian standards differ significantly from the requirements of the SEC, and mineral resource information contained herein is not comparable to similar information regarding mineral reserves disclosed in accordance with the requirements of the SEC. Investors should understand that “Inferred” Mineral Resources have a great amount of uncertainty as to their existence and great uncertainty as to their economic and legal feasibility. In addition, investors are cautioned not to assume that any part or all of AuRico’s Mineral Resources constitute or will be converted into Reserves.
• Orion Mineral Resources are reflected on a 50% basis. Following the completion of a joint venture agreement, Minera Frisco, S.A.B. de C.V. has a 50% interest in the Orion project.
• Mineral Reserve and Resource tonnage and contained metal have been rounded to reflect the accuracy of the estimate, and numbers may not add due to rounding.
• Mineral Resources were prepared under the supervision of Jeffrey Volk, CPG, FAusIMM, the Director of Reserves and Resources, for AuRico Gold Inc. Mineral Reserves were prepared under the supervision of Chris Bostwick, FAusIMM, the Senior Vice President Technical Services, for AuRico Gold Inc. Both Messrs Volk and Bostwick are “Qualified Persons” as defined by National Instrument 43-101.
Notes to Reserves and Resources
30