nv mkt report 02 2014. gideon joffe
TRANSCRIPT

ReportonNevada’sHousingMarket
February2014
FundingprovidedbytheHousingDataandIndexProject,ajointinitiativeof:
ThisseriesofreportsonNevada’sHousingMarketisco‐presentedbytheLiedInstituteforRealEstateStudiesattheUniversityofNevada,LasVegasandtheStateofNevadaDepartmentofBusiness&Industry.ThesereportsprovidemonthlyupdatesonhousingmarkettrendsforstakeholdersthroughoutNevada,whichwillbecrucialasNevadaembarksonapathofhousingrecovery.

Page| 1
Nevada’sHousingMarket |February2014
TableofContents
NevadaStatewideTrends…….................................... 2
NorthernTrends………………………………………….. 10
SouthernTrends………………………………………….. 14
RuralTrends…………………………………………........... 18

Page| 2
Nevada’sHousingMarket |February2014
NevadaStatewideTrends
Population:2,790,136 in2013 HousingUnits:1,183,870 in2012
Source:U.S.CensusBureau:StateandCountyQuickFacts
Page| 3
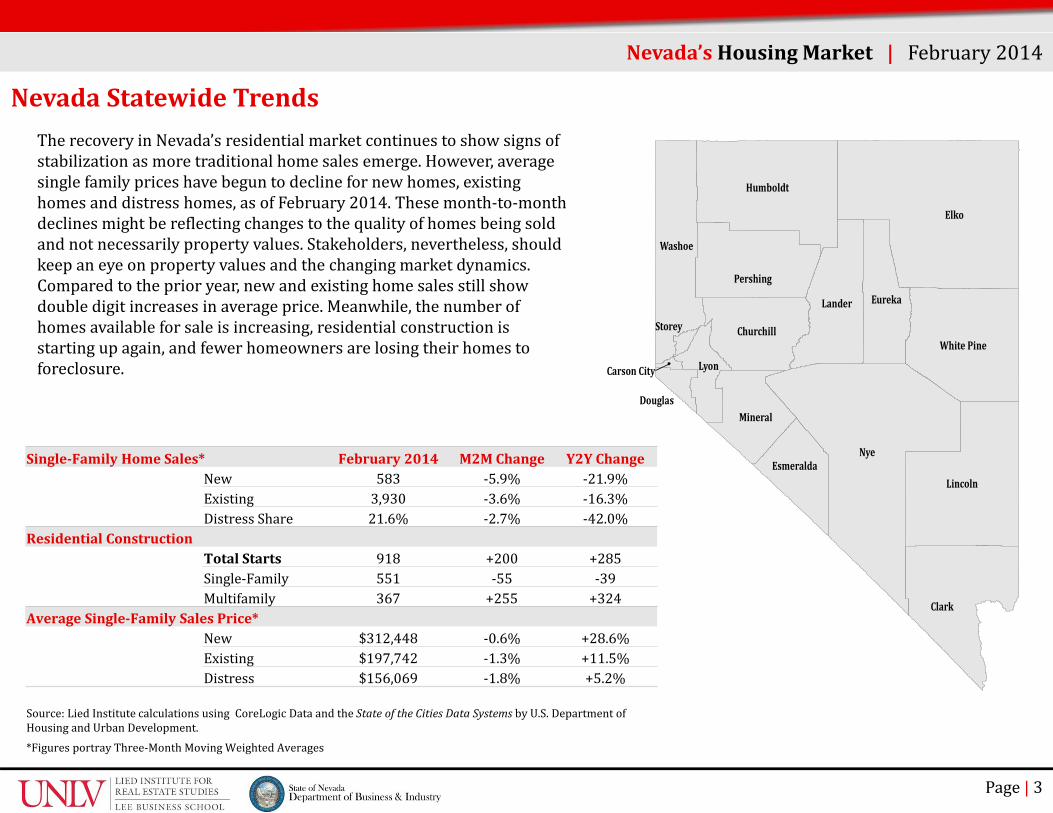
NevadaStatewideTrendsTherecoveryinNevada’sresidentialmarketcontinuestoshowsignsofstabilizationasmoretraditionalhomesalesemerge.However,averagesinglefamilypriceshavebeguntodeclinefornewhomes,existinghomesanddistresshomes,asofFebruary2014.Thesemonth‐to‐monthdeclinesmightbereflectingchangestothequalityofhomesbeingsoldandnotnecessarilypropertyvalues.Stakeholders,nevertheless,shouldkeepaneyeonpropertyvaluesandthechangingmarketdynamics.Comparedtotheprioryear,newandexistinghomesalesstillshowdoubledigitincreasesinaverageprice.Meanwhile,thenumberofhomesavailableforsaleisincreasing,residentialconstructionisstartingupagain,andfewerhomeownersarelosingtheirhomestoforeclosure.
Nevada’sHousingMarket |February2014
Nye
Elko
Clark
Lincoln
Humboldt
Washoe
WhitePine
Lander
Pershing
Eureka
Churchill
Mineral
Lyon
Esmeralda
Douglas
Storey
CarsonCity
Single‐FamilyHomeSales* February2014 M2MChange Y2YChangeNew 583 ‐5.9% ‐21.9%Existing 3,930 ‐3.6% ‐16.3%DistressShare 21.6% ‐2.7% ‐42.0%
ResidentialConstructionTotalStarts 918 +200 +285Single‐Family 551 ‐55 ‐39Multifamily 367 +255 +324
AverageSingle‐FamilySalesPrice*New $312,448 ‐0.6% +28.6%Existing $197,742 ‐1.3% +11.5%Distress $156,069 ‐1.8% +5.2%
Source:LiedInstitutecalculationsusingCoreLogic DataandtheStateoftheCitiesDataSystems byU.S.DepartmentofHousingandUrbanDevelopment.*FiguresportrayThree‐MonthMovingWeightedAverages
NevadaStatewideTrends
Page| 4
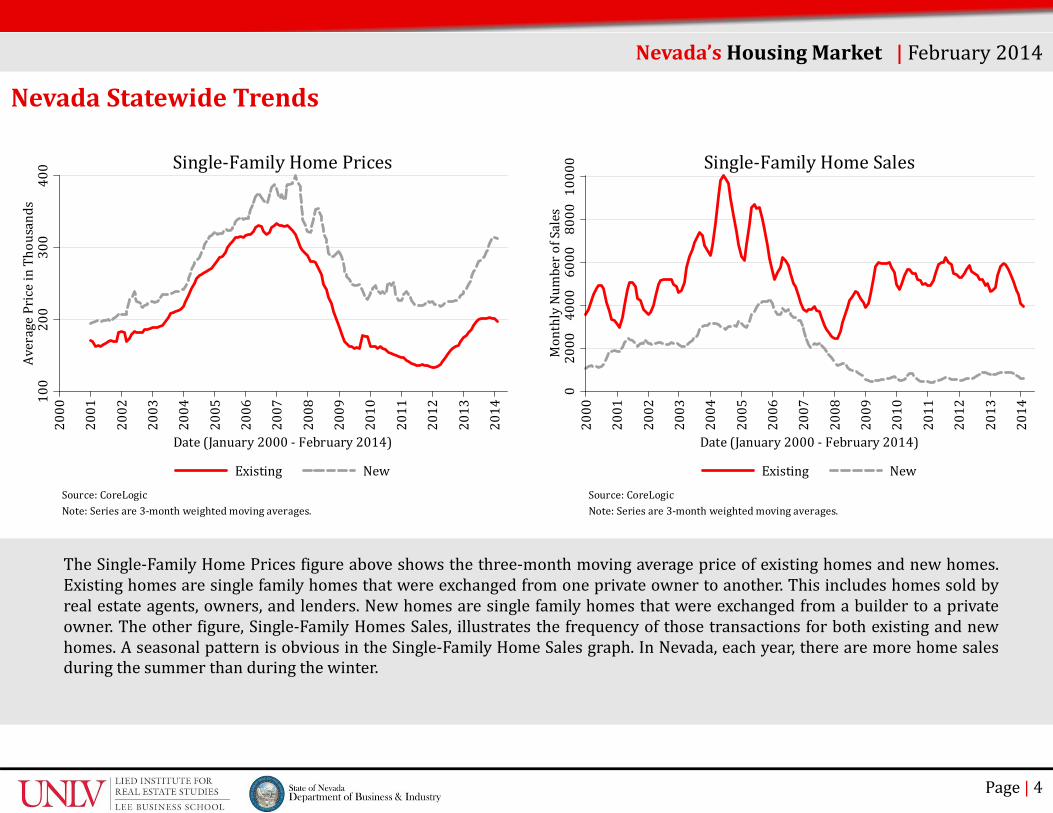
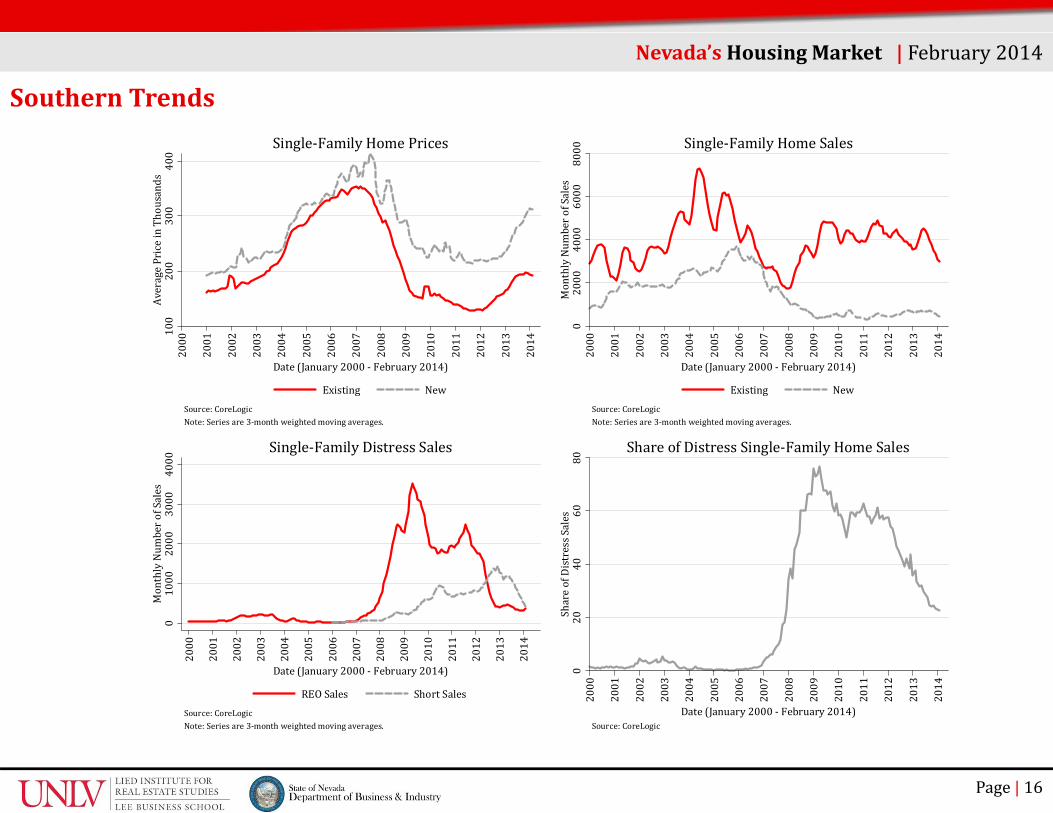
The Single‐Family Home Prices figure above shows the three‐month moving average price of existing homes and new homes.Existing homes are single family homes that were exchanged from one private owner to another. This includes homes sold byreal estate agents, owners, and lenders. New homes are single family homes that were exchanged from a builder to a privateowner. The other figure, Single‐Family Homes Sales, illustrates the frequency of those transactions for both existing and newhomes. A seasonal pattern is obvious in the Single‐Family Home Sales graph. In Nevada, each year, there are more home salesduring the summer than during the winter.
Nevada’sHousingMarket |February2014
02000
4000
6000
8000
10000
MonthlyNum
berofSales
2000
2001
2002
2003
2004
2005
2006
2007
2008
2009
2010
2011
2012
2013
2014
Date(January2000‐February2014)
Existing NewSource:CoreLogicNote:Seriesare3‐monthweightedmovingaverages.
Single‐FamilyHomeSales
100
200
300
400
AveragePriceinThousands
2000
2001
2002
2003
2004
2005
2006
2007
2008
2009
2010
2011
2012
2013
2014
Date(January2000‐February2014)
Existing NewSource:CoreLogicNote:Seriesare3‐monthweightedmovingaverages.
Single‐FamilyHomePrices
NevadaStatewideTrends
Page| 5
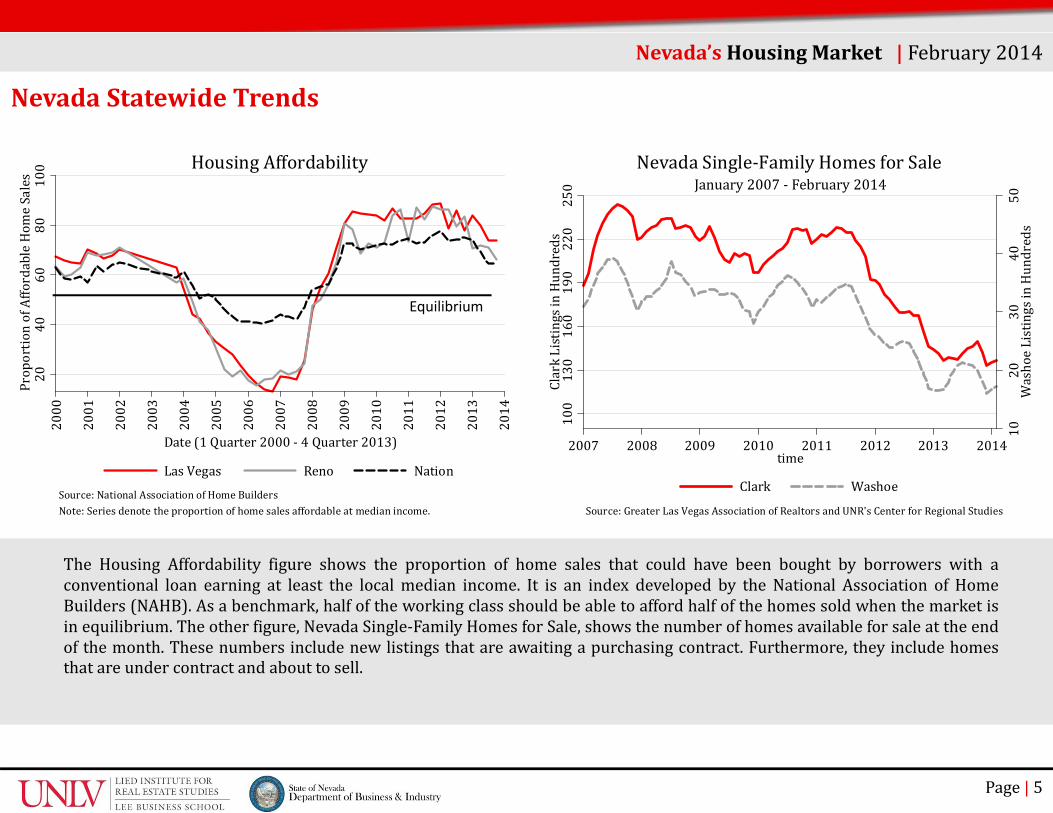
The Housing Affordability figure shows the proportion of home sales that could have been bought by borrowers with aconventional loan earning at least the local median income. It is an index developed by the National Association of HomeBuilders (NAHB). As a benchmark, half of the working class should be able to afford half of the homes sold when the market isin equilibrium. The other figure, Nevada Single‐Family Homes for Sale, shows the number of homes available for sale at the endof the month. These numbers include new listings that are awaiting a purchasing contract. Furthermore, they include homesthat are under contract and about to sell.
Nevada’sHousingMarket |February201420
4060
80100
ProportionofAffordableHom
eSales
2000
2001
2002
2003
2004
2005
2006
2007
2008
2009
2010
2011
2012
2013
2014
Date(1Quarter2000‐4Quarter2013)
LasVegas Reno NationSource:NationalAssociationofHomeBuildersNote:Seriesdenotetheproportionofhomesalesaffordableatmedianincome.
HousingAffordability
Equilibrium
1020
3040
50WashoeListingsinHundreds
250
220
190
160
130
100
ClarkListingsinHundreds
2007 2008 2009 2010 2011 2012 2013 2014time
Clark Washoe
Source:GreaterLasVegasAssociationofRealtorsandUNR'sCenterforRegionalStudies
January2007‐February2014NevadaSingle‐FamilyHomesforSale
NevadaStatewideTrends
Page| 6
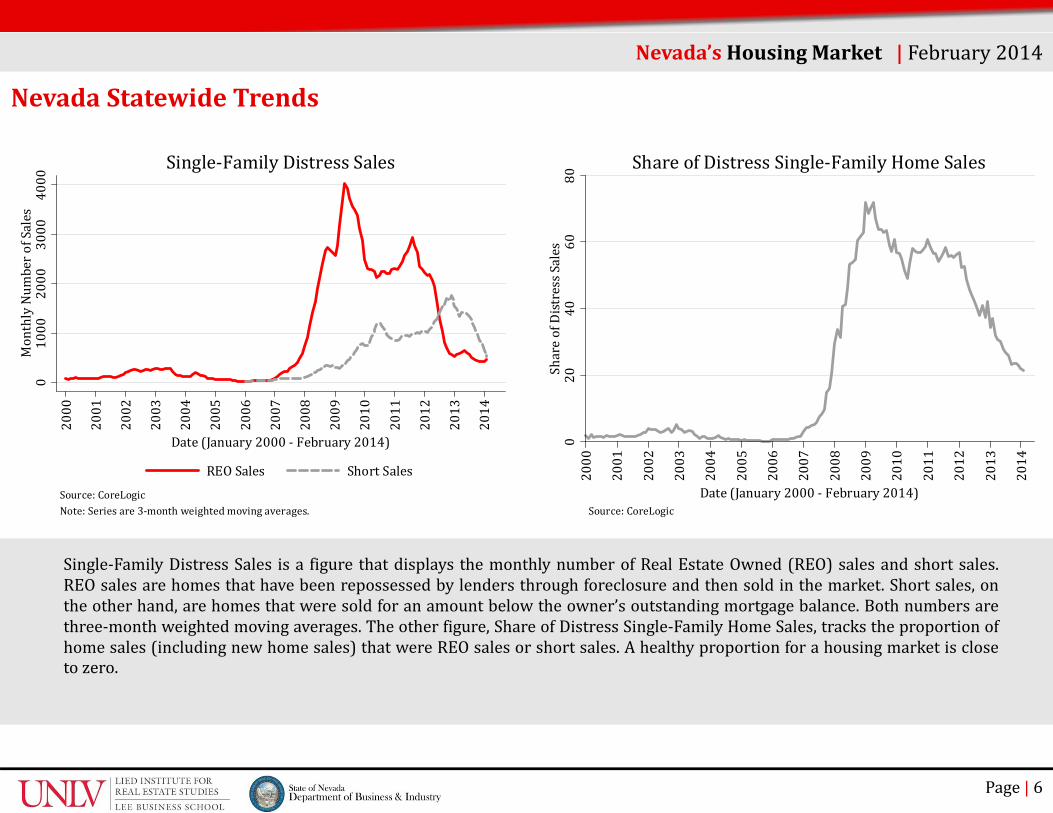
Single‐Family Distress Sales is a figure that displays the monthly number of Real Estate Owned (REO) sales and short sales.REO sales are homes that have been repossessed by lenders through foreclosure and then sold in the market. Short sales, onthe other hand, are homes that were sold for an amount below the owner’s outstanding mortgage balance. Both numbers arethree‐month weighted moving averages. The other figure, Share of Distress Single‐Family Home Sales, tracks the proportion ofhome sales (including new home sales) that were REO sales or short sales. A healthy proportion for a housing market is closeto zero.
Nevada’sHousingMarket |February20140
1000
2000
3000
4000
MonthlyNum
berofSales
2000
2001
2002
2003
2004
2005
2006
2007
2008
2009
2010
2011
2012
2013
2014
Date(January2000‐February2014)
REOSales ShortSalesSource:CoreLogicNote:Seriesare3‐monthweightedmovingaverages.
Single‐FamilyDistressSales
020
4060
80ShareofDistressSales
2000
2001
2002
2003
2004
2005
2006
2007
2008
2009
2010
2011
2012
2013
2014
Date(January2000‐February2014)Source:CoreLogic
ShareofDistressSingle‐FamilyHomeSales
NevadaStatewideTrends
Page| 7
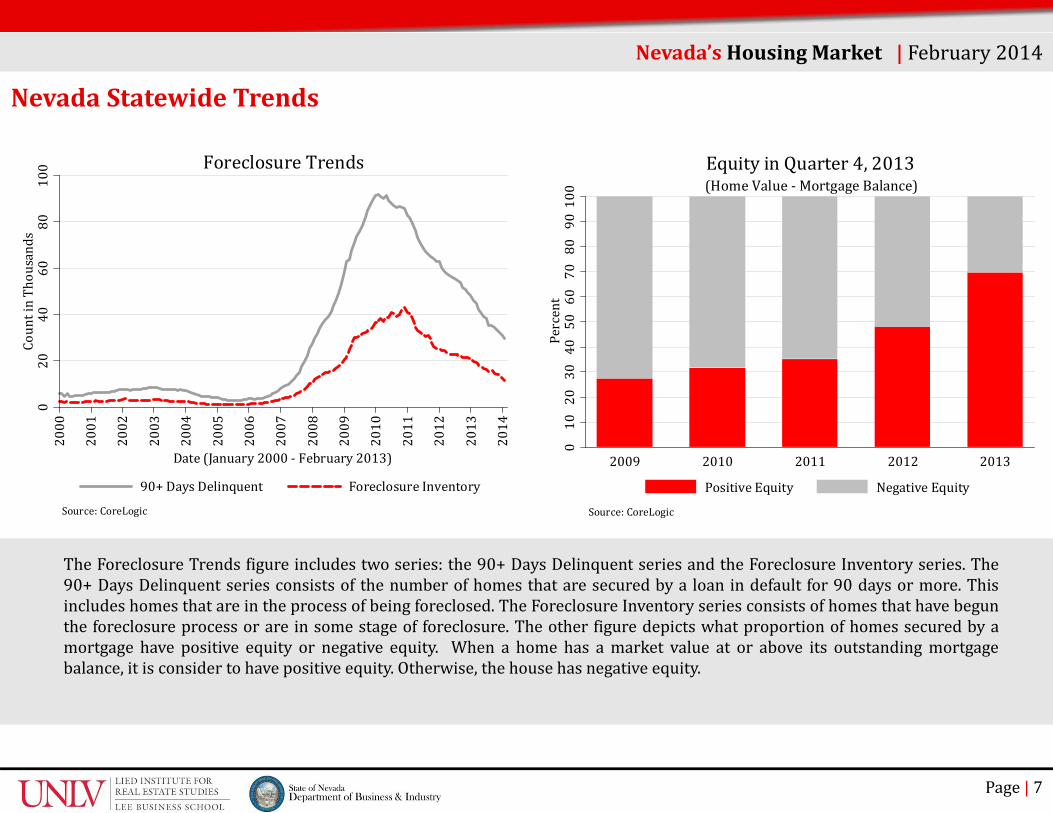
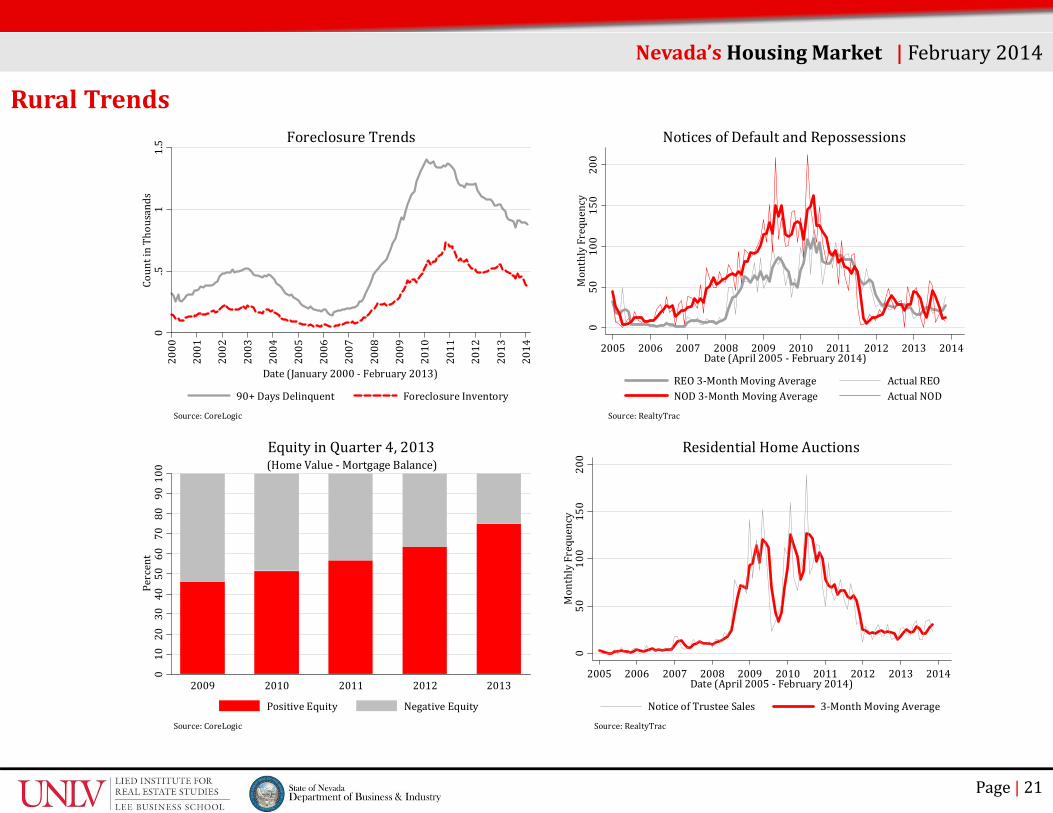
The Foreclosure Trends figure includes two series: the 90+ Days Delinquent series and the Foreclosure Inventory series. The90+ Days Delinquent series consists of the number of homes that are secured by a loan in default for 90 days or more. Thisincludes homes that are in the process of being foreclosed. The Foreclosure Inventory series consists of homes that have begunthe foreclosure process or are in some stage of foreclosure. The other figure depicts what proportion of homes secured by amortgage have positive equity or negative equity. When a home has a market value at or above its outstanding mortgagebalance, it is consider to have positive equity. Otherwise, the house has negative equity.
Nevada’sHousingMarket |February2014
100
9080
7060
5040
3020
100
Percent
2009 2010 2011 2012 2013
Source:CoreLogic
(HomeValue‐MortgageBalance)EquityinQuarter4,2013
PositiveEquity NegativeEquity
020
4060
80100
CountinThousands
2000
2001
2002
2003
2004
2005
2006
2007
2008
2009
2010
2011
2012
2013
2014
Date(January2000‐February2013)
90+DaysDelinquent ForeclosureInventory
Source:CoreLogic
ForeclosureTrends
NevadaStatewideTrends
Page| 8
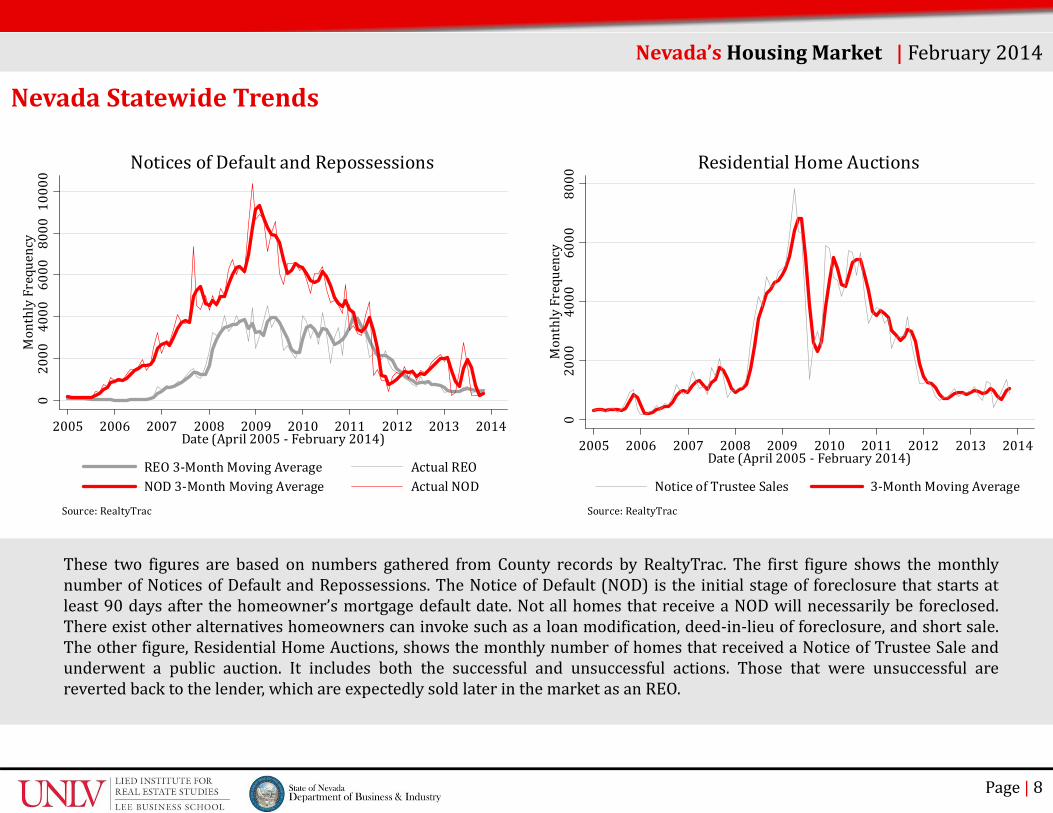
These two figures are based on numbers gathered from County records by RealtyTrac. The first figure shows the monthlynumber of Notices of Default and Repossessions. The Notice of Default (NOD) is the initial stage of foreclosure that starts atleast 90 days after the homeowner’s mortgage default date. Not all homes that receive a NOD will necessarily be foreclosed.There exist other alternatives homeowners can invoke such as a loan modification, deed‐in‐lieu of foreclosure, and short sale.The other figure, Residential Home Auctions, shows the monthly number of homes that received a Notice of Trustee Sale andunderwent a public auction. It includes both the successful and unsuccessful actions. Those that were unsuccessful arereverted back to the lender, which are expectedly sold later in the market as an REO.
Nevada’sHousingMarket |February2014
02000
4000
6000
8000
MonthlyFrequency
2005 2006 2007 2008 2009 2010 2011 2012 2013 2014Date(April2005‐February2014)
NoticeofTrusteeSales 3‐MonthMovingAverage
Source:RealtyTrac
ResidentialHomeAuctions
02000
4000
6000
8000
10000
MonthlyFrequency
2005 2006 2007 2008 2009 2010 2011 2012 2013 2014Date(April2005‐February2014)
REO3‐MonthMovingAverage ActualREONOD3‐MonthMovingAverage ActualNOD
Source:RealtyTrac
NoticesofDefaultandRepossessions
NevadaStatewideTrends
Page| 9
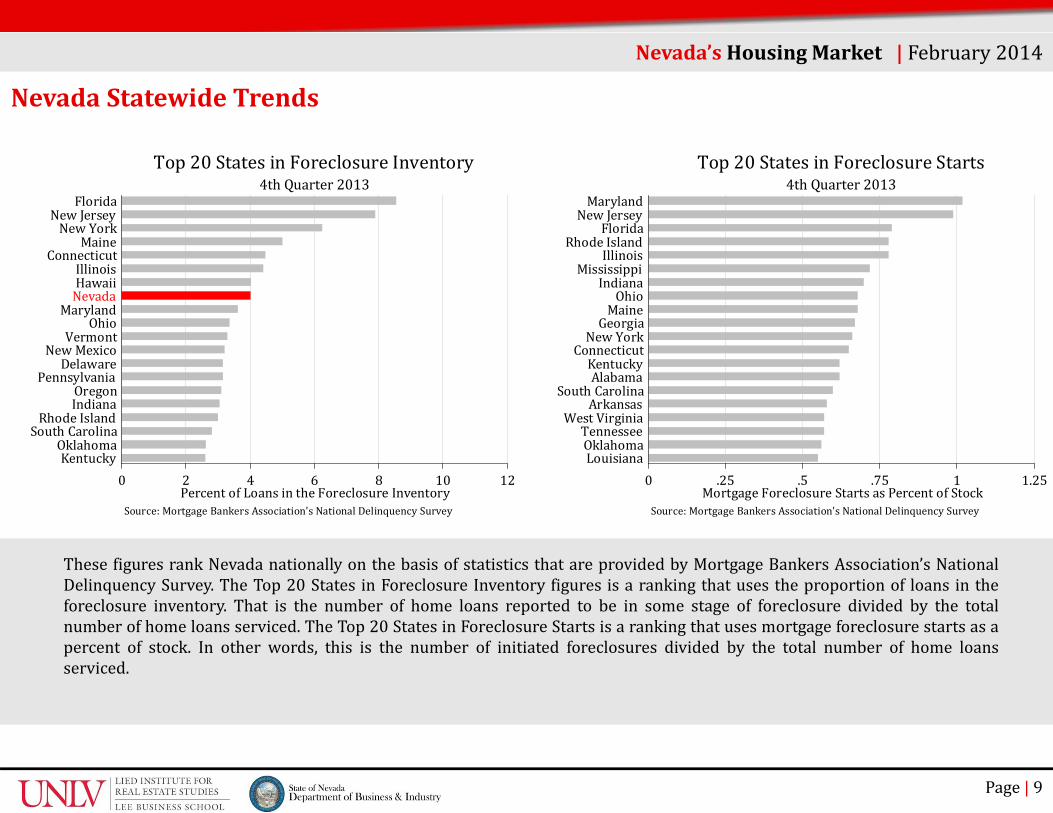
These figures rank Nevada nationally on the basis of statistics that are provided by Mortgage Bankers Association’s NationalDelinquency Survey. The Top 20 States in Foreclosure Inventory figures is a ranking that uses the proportion of loans in theforeclosure inventory. That is the number of home loans reported to be in some stage of foreclosure divided by the totalnumber of home loans serviced. The Top 20 States in Foreclosure Starts is a ranking that uses mortgage foreclosure starts as apercent of stock. In other words, this is the number of initiated foreclosures divided by the total number of home loansserviced.
Nevada’sHousingMarket |February2014
121086420PercentofLoansintheForeclosureInventory
KentuckyOklahoma
SouthCarolinaRhodeIsland
IndianaOregon
PennsylvaniaDelaware
NewMexicoVermont
OhioMarylandNevadaHawaiiIllinois
ConnecticutMaine
NewYorkNewJersey
Florida
Source:MortgageBankersAssociation'sNationalDelinquencySurvey
4thQuarter2013Top20StatesinForeclosureInventory
1.251.75.5.250MortgageForeclosureStartsasPercentofStock
LouisianaOklahomaTennessee
WestVirginiaArkansas
SouthCarolinaAlabamaKentucky
ConnecticutNewYorkGeorgiaMaineOhio
IndianaMississippi
IllinoisRhodeIsland
FloridaNewJerseyMaryland
Source:MortgageBankersAssociation'sNationalDelinquencySurvey
4thQuarter2013Top20StatesinForeclosureStarts

Page| 10
Nevada’sHousingMarket |February2014
NorthernTrends
Population:611,379 in2012 HousingUnits:267,622 in2012
Source:U.S.CensusBureau:StateandCountyQuickFacts (CarsonCity,Churchill,Douglas,Lyon,Storey,andWashoeCounty)

Page| 11
NorthernTrends
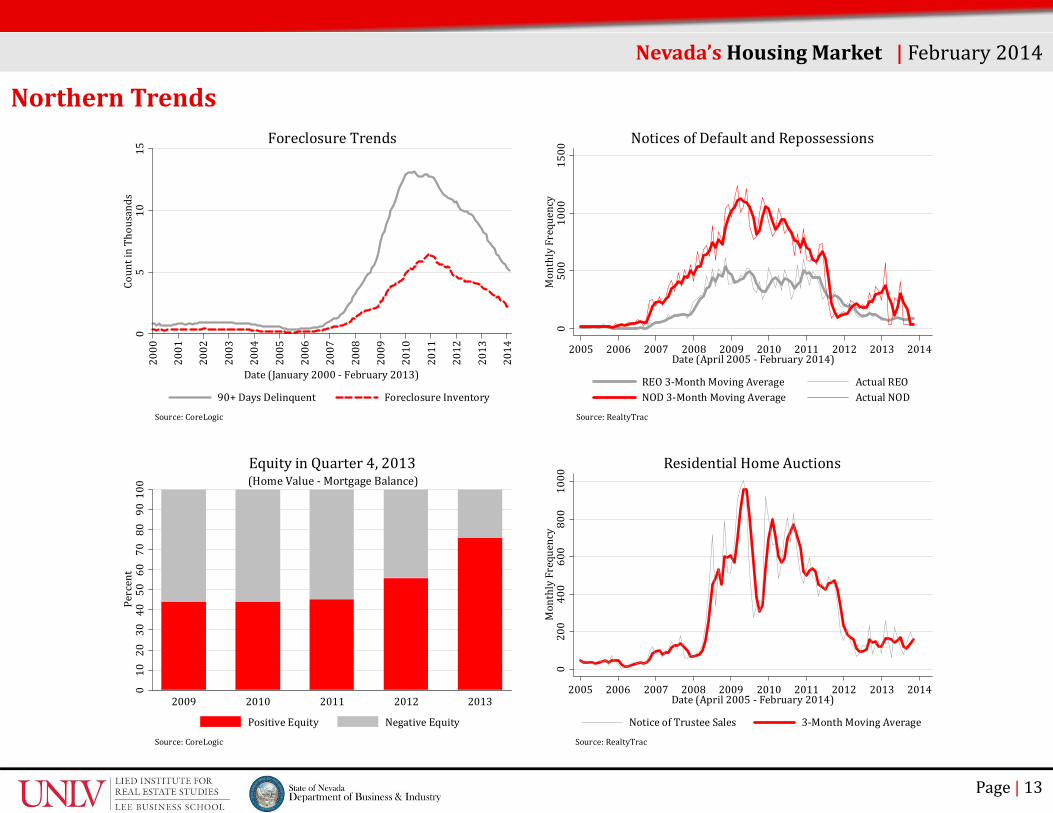
In Northern Nevada, there were close to zero notices of default filed in February 2014, despite there being close to 5,000 homeowners 90 days or more past due on their mortgage payments. This sounds promising for the housing market recovery in Northern Nevada, especially with prices stabilizing. February 2014 marked the end of a two‐year streak of continuous average price growth. This market, however, still warrants further observation since these price changes were negative, marginal and reflect higher levels than the prior year. Moreover, unfavorable market conditions continue to persist. About a quarter of all financed homes are still underwater – owing more than their market value. And, about 1 out of every 5 home sales are either short sales or real estate owned (REO) sales.
Nye
Elko
Clark
Lincoln
Humboldt
Washoe
WhitePine
Lander
Pershing
Eureka
Churchill
Mineral
Lyon
Esmeralda
Douglas
Storey
CarsonCity
Nevada’sHousingMarket |February2014
Single‐FamilyHomeSales* February2014 M2MChange Y2YChangeNew 100 ‐1.3% +3.1%Existing 788 ‐3.9% ‐11.3%DistressShare 18.3% ‐7.3% ‐52.4%
ResidentialConstructionTotalStarts 165 +11 +22Single‐Family 136 +14 +36Multifamily 29 ‐3 ‐14
AverageSingle‐FamilySalesPrice*New $325,430 ‐0.8% +24.1%Existing $233,702 ‐2.9% +0.9%Distress $165,834 ‐6.0% +0.8%
Source:LiedInstitutecalculationsusingCoreLogic DataandtheStateoftheCitiesDataSystems byU.S.DepartmentofHousingandUrbanDevelopment.*FiguresportrayThree‐MonthMovingWeightedAverages

Page| 12
NorthernTrends
Nevada’sHousingMarket |February2014
0100
200
300
400
MonthlyNum
berofSales
2000
2001
2002
2003
2004
2005
2006
2007
2008
2009
2010
2011
2012
2013
2014
Date(January2000‐February2014)
REOSales ShortSalesSource:CoreLogicNote:Seriesare3‐monthweightedmovingaverages.
Single‐FamilyDistressSales
020
4060
ShareofDistressSales
2000
2001
2002
2003
2004
2005
2006
2007
2008
2009
2010
2011
2012
2013
2014
Date(January2000‐February2014)Source:CoreLogic
ShareofDistressSingle‐FamilyHomeSales
0500
1000
1500
2000
MonthlyNum
berofSales
2000
2001
2002
2003
2004
2005
2006
2007
2008
2009
2010
2011
2012
2013
2014
Date(January2000‐February2014)
Existing NewSource:CoreLogicNote:Seriesare3‐monthweightedmovingaverages.
Single‐FamilyHomeSales150
200
250
300
350
400
AveragePriceinThousands
2000
2001
2002
2003
2004
2005
2006
2007
2008
2009
2010
2011
2012
2013
2014
Date(January2000‐February2014)
Existing NewSource:CoreLogicNote:Seriesare3‐monthweightedmovingaverages.
Single‐FamilyHomePrices
NorthernTrends
Page| 13
Nevada’sHousingMarket |February2014
100
9080
7060
5040
3020
100
Percent
2009 2010 2011 2012 2013
Source:CoreLogic
(HomeValue‐MortgageBalance)EquityinQuarter4,2013
PositiveEquity NegativeEquity
0200
400
600
800
1000
MonthlyFrequency
2005 2006 2007 2008 2009 2010 2011 2012 2013 2014Date(April2005‐February2014)
NoticeofTrusteeSales 3‐MonthMovingAverage
Source:RealtyTrac
ResidentialHomeAuctions
0500
1000
1500
MonthlyFrequency
2005 2006 2007 2008 2009 2010 2011 2012 2013 2014Date(April2005‐February2014)
REO3‐MonthMovingAverage ActualREONOD3‐MonthMovingAverage ActualNOD
Source:RealtyTrac
NoticesofDefaultandRepossessions0
510
15CountinThousands
2000
2001
2002
2003
2004
2005
2006
2007
2008
2009
2010
2011
2012
2013
2014
Date(January2000‐February2013)
90+DaysDelinquent ForeclosureInventory
Source:CoreLogic
ForeclosureTrends
Page| 14
Nevada’sHousingMarket |February2014
SouthernTrends
Population:2,000,759 in2012 HousingUnits:849,361 in2012
Source:U.S.CensusBureau:StateandCountyQuickFacts (ClarkCounty)

Nye
Elko
Clark
Lincoln
Humboldt
Washoe
WhitePine
Lander
Pershing
Eureka
Churchill
Mineral
Lyon
Esmeralda
Douglas
Storey
CarsonCity
Page| 15
SouthernTrendsEquity conditions in Southern Nevada are worse than in NorthernNevada. More than 30 percent of all financed homes are underwater asof quarter four 2013. Fortunately, more homeowners have found theirway to holding equity during the recovery of the residential market.Further equity growth could stall if the property values stop growing.This is something that seems more likely since current average prices ofsingle family homes appear to be waving. Distress in this market,however, appears to be successfully dissipating. The foreclosureinventory fell again this month. Back in mid‐2010, there were more than35,000 homes in the foreclosure inventory. As of February 2014, thisnumber has fallen below 11,600. Of course, having close to zero homesin the foreclosure inventory is more pleasing. But, this decline is a signof an improving housing market.
Nevada’sHousingMarket |February2014
Single‐FamilyHomeSales* February2014 M2MChange Y2YChangeNew 468 ‐6.3% ‐26.0%Existing 2,991 ‐3.1% ‐17.0DistressShare 22.5% ‐2.4% ‐40.1%
ResidentialConstructionTotalStarts 733 +177 +263Single‐Family 397 ‐79 ‐73Multifamily 336 +256 +336
AverageSingle‐FamilySalesPrice*New $311,811 ‐0.6% +29.5%Existing $191,554 ‐1.1% +14.7%Distress $155,768 ‐0.6% +6.9%
Source:LiedInstitutecalculationsusingCoreLogic DataandtheStateoftheCitiesDataSystems byU.S.DepartmentofHousingandUrbanDevelopment.*FiguresportrayThree‐MonthMovingWeightedAverages
SouthernTrends
Page| 16
Nevada’sHousingMarket |February2014
01000
2000
3000
4000
MonthlyNum
berofSales
2000
2001
2002
2003
2004
2005
2006
2007
2008
2009
2010
2011
2012
2013
2014
Date(January2000‐February2014)
REOSales ShortSalesSource:CoreLogicNote:Seriesare3‐monthweightedmovingaverages.
Single‐FamilyDistressSales
020
4060
80ShareofDistressSales
2000
2001
2002
2003
2004
2005
2006
2007
2008
2009
2010
2011
2012
2013
2014
Date(January2000‐February2014)Source:CoreLogic
ShareofDistressSingle‐FamilyHomeSales
02000
4000
6000
8000
MonthlyNum
berofSales
2000
2001
2002
2003
2004
2005
2006
2007
2008
2009
2010
2011
2012
2013
2014
Date(January2000‐February2014)
Existing NewSource:CoreLogicNote:Seriesare3‐monthweightedmovingaverages.
Single‐FamilyHomeSales100
200
300
400
AveragePriceinThousands
2000
2001
2002
2003
2004
2005
2006
2007
2008
2009
2010
2011
2012
2013
2014
Date(January2000‐February2014)
Existing NewSource:CoreLogicNote:Seriesare3‐monthweightedmovingaverages.
Single‐FamilyHomePrices

Page| 17
SouthernTrends
Nevada’sHousingMarket |February2014
100
9080
7060
5040
3020
100
Percent
2009 2010 2011 2012 2013
Source:CoreLogic
(HomeValue‐MortgageBalance)EquityinQuarter4,2013
PositiveEquity NegativeEquity
02000
4000
6000
8000
MonthlyFrequency
2005 2006 2007 2008 2009 2010 2011 2012 2013 2014Date(April2005‐February2014)
NoticeofTrusteeSales 3‐MonthMovingAverage
Source:RealtyTrac
ResidentialHomeAuctions
02000
4000
6000
8000
10000
MonthlyFrequency
2005 2006 2007 2008 2009 2010 2011 2012 2013 2014Date(April2005‐February2014)
REO3‐MonthMovingAverage ActualREONOD3‐MonthMovingAverage ActualNOD
Source:RealtyTrac
NoticesofDefaultandRepossessions0
2040
6080
CountinThousands
2000
2001
2002
2003
2004
2005
2006
2007
2008
2009
2010
2011
2012
2013
2014
Date(January2000‐February2013)
90+DaysDelinquent ForeclosureInventory
Source:CoreLogic
ForeclosureTrends

Page| 18
Nevada’sHousingMarket |February2014
RuralTrends
Population:146,793 in2012 HousingUnits:66,887 in2012
Source:U.S.CensusBureau:StateandCountyQuickFacts (Elko,Esmeralda,Eureka,Humboldt,Lander,Lincoln,Mineral,Nye,Pershing,andWhitePineCounty)
Page| 19
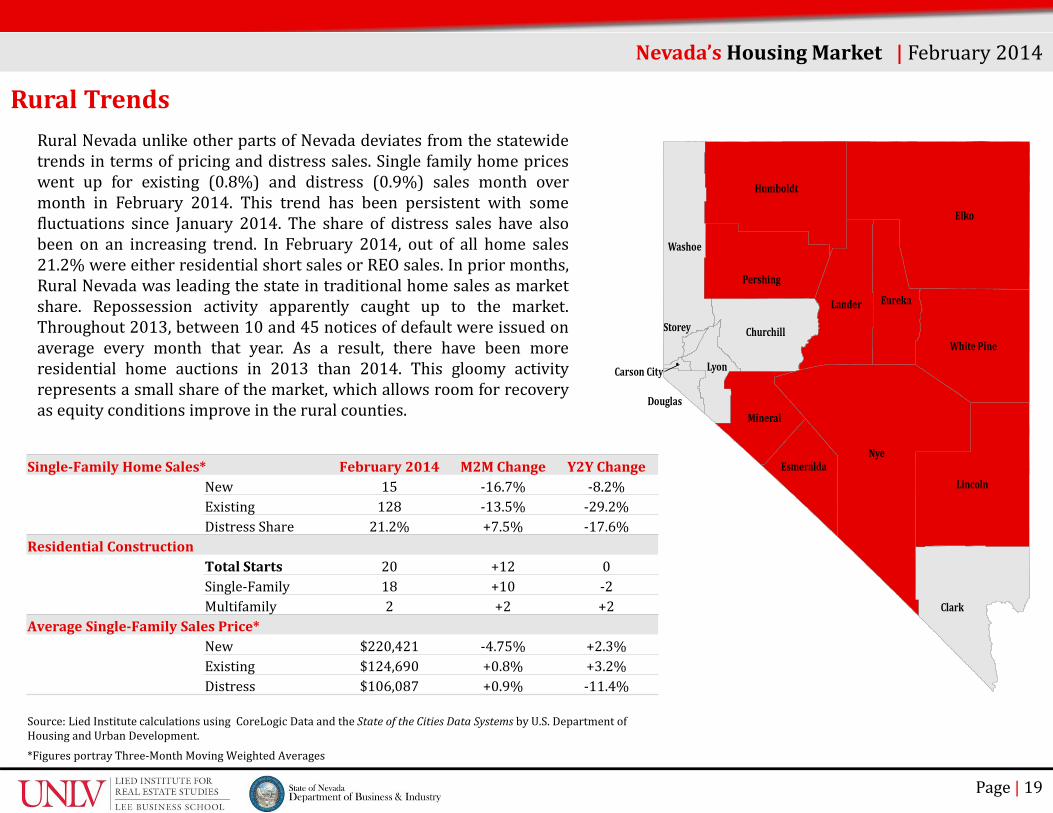
RuralTrendsRural Nevada unlike other parts of Nevada deviates from the statewidetrends in terms of pricing and distress sales. Single family home priceswent up for existing (0.8%) and distress (0.9%) sales month overmonth in February 2014. This trend has been persistent with somefluctuations since January 2014. The share of distress sales have alsobeen on an increasing trend. In February 2014, out of all home sales21.2% were either residential short sales or REO sales. In prior months,Rural Nevada was leading the state in traditional home sales as marketshare. Repossession activity apparently caught up to the market.Throughout 2013, between 10 and 45 notices of default were issued onaverage every month that year. As a result, there have been moreresidential home auctions in 2013 than 2014. This gloomy activityrepresents a small share of the market, which allows room for recoveryas equity conditions improve in the rural counties.
Nye
Elko
Clark
Lincoln
Humboldt
Washoe
WhitePine
Lander
Pershing
Eureka
Churchill
Mineral
Lyon
Esmeralda
Douglas
Storey
CarsonCity
Nevada’sHousingMarket |February2014
Single‐FamilyHomeSales* February2014 M2MChange Y2YChangeNew 15 ‐16.7% ‐8.2%Existing 128 ‐13.5% ‐29.2%DistressShare 21.2% +7.5% ‐17.6%
ResidentialConstructionTotalStarts 20 +12 0Single‐Family 18 +10 ‐2Multifamily 2 +2 +2
AverageSingle‐FamilySalesPrice*New $220,421 ‐4.75% +2.3%Existing $124,690 +0.8% +3.2%Distress $106,087 +0.9% ‐11.4%
Source:LiedInstitutecalculationsusingCoreLogic DataandtheStateoftheCitiesDataSystems byU.S.DepartmentofHousingandUrbanDevelopment.*FiguresportrayThree‐MonthMovingWeightedAverages

RuralTrends
Page| 20
Nevada’sHousingMarket |February2014
020
4060
80MonthlyNum
berofSales
2000
2001
2002
2003
2004
2005
2006
2007
2008
2009
2010
2011
2012
2013
2014
Date(January2000‐February2014)
REOSales ShortSalesSource:CoreLogicNote:Seriesare3‐monthweightedmovingaverages.
Single‐FamilyDistressSales
010
2030
40ShareofDistressSales
2000
2001
2002
2003
2004
2005
2006
2007
2008
2009
2010
2011
2012
2013
2014
Date(January2000‐February2014)Source:CoreLogic
ShareofDistressSingle‐FamilyHomeSales
0200
400
600
800
MonthlyNum
berofSales
2000
2001
2002
2003
2004
2005
2006
2007
2008
2009
2010
2011
2012
2013
2014
Date(January2000‐February2014)
Existing NewSource:CoreLogicNote:Seriesare3‐monthweightedmovingaverages.
Single‐FamilyHomeSales
50100
150
200
250
300
AveragePriceinThousands
2000
2001
2002
2003
2004
2005
2006
2007
2008
2009
2010
2011
2012
2013
2014
Date(January2000‐February2014)
Existing NewSource:CoreLogicNote:Seriesare3‐monthweightedmovingaverages.
Single‐FamilyHomePrices
Page| 21
RuralTrends
Nevada’sHousingMarket |February2014
100
9080
7060
5040
3020
100
Percent
2009 2010 2011 2012 2013
Source:CoreLogic
(HomeValue‐MortgageBalance)EquityinQuarter4,2013
PositiveEquity NegativeEquity
050
100
150
200
MonthlyFrequency
2005 2006 2007 2008 2009 2010 2011 2012 2013 2014Date(April2005‐February2014)
NoticeofTrusteeSales 3‐MonthMovingAverage
Source:RealtyTrac
ResidentialHomeAuctions
050
100
150
200
MonthlyFrequency
2005 2006 2007 2008 2009 2010 2011 2012 2013 2014Date(April2005‐February2014)
REO3‐MonthMovingAverage ActualREONOD3‐MonthMovingAverage ActualNOD
Source:RealtyTrac
NoticesofDefaultandRepossessions0
.51
1.5
CountinThousands
2000
2001
2002
2003
2004
2005
2006
2007
2008
2009
2010
2011
2012
2013
2014
Date(January2000‐February2013)
90+DaysDelinquent ForeclosureInventory
Source:CoreLogic
ForeclosureTrends
Page| 22
About the Lied Institute
The Lied Institute was established in 1989 by the LeeBusiness School at the University of Nevada, Las Vegasto foster excellence in real estate education andresearch. Through partnerships with business andcommunity leaders, the Lied Institute strives toimprove the real estate business and effective publicpolicy practices in Southern Nevada. The instituteproduces relevant and timely real estate research,supports educational programs in real estateeconomics and finance for students and professionals,and provides community outreach and continuingeducation.
About the Department of Business & Industry
The Department of Business and Industry is a cabinetlevel agency in the Nevada State government. TheDepartment’s objective is to encourage and promotethe development and growth of business and to ensurethe legal operation of business in order to protectconsumers by maintaining a fair and competitiveregulatory environment. The Director’s office atBusiness and Industry manages a number of programsand initiatives to address the needs of smallbusinesses, homeowners and consumers includingsmall business advocacy, bond programs, access tocapital, housing retention programs, constituentservices and fraud prevention and education.
LiedInstituteforRealEstateStudies4505S.MarylandParkway,Box456025
LasVegas,NV89154‐6025
LuisA.LopezDataAnalyst
(702)895‐[email protected]
DepartmentofBusiness&Industry555E.WashingtonAve#4900
LasVegas,NV89101
BruceBreslowDirector
(775)684‐[email protected]
AshokMirchandaniDeputyDirector(702)486‐4492
©Copyright2013ReportonNevada’sHousingMarketReadersmayreproducethepublication’sitemsiftheycitethepublicationnameanddate,andnotethecopyrightofLiedInstituteforRealEstateStudies,UniversityofNevada,LasVegasandtheStateofNevadaDepartmentofBusiness&Industry
Nevada’sHousingMarket |February2014