nutritional concerns of pronghorn antelope on … · nutritional concerns of pronghorn antelope on...
TRANSCRIPT
Final Report Submitted to
Arizona Game and Fish Department 2221 W. Greenway Rd.
Phoenix, AZ
Nutritional Concerns of Pronghorn Antelope on Anderson Mesa and Garland Prairie,
Arizona.
Submitted by
W. H. Miller and Melissa Drake Applied Biological Sciences Department
Arizona State University

1
ABSTRACT
A study to determine the potential impact of diet composition and quality on the fawn
recruitment of two pronghorn antelope (Antilocapra americana) herds in northern Arizona
(Garland Prairie and Anderson Mesa) was conducted in 2002. Diet composition of the two herds
was determined at four critical reproductive stages (late gestation, parturition, lactation, and
conception) using microhistological analysis of fecal material. Diet quality was evaluated using
two fecal indicators, diaminopamelic acid (DAPA) and fecal nitrogen. The Garland Prairie
pronghorn diets had significantly higher plant species diversity with an average of 47 different
species in each biological period, while the Anderson Mesa pronghorn diets had an average of 33
different plant species. Garland Prairie diets were consistently dominated by forbs (66 – 83 %)
followed by shrubs (12 – 30 %) and lastly grass (1 – 7 %). Anderson Mesa diets were much
more variable with forbs declining from and initial 61 % to a low of 25 %, grass also declined
from an initial high of 22.5 % to a low of 8.6%, while shrubs increased over time from an initial
low of 16 % to a final high of 66 %. Garland Prairie pronghorn demonstrated significantly
higher overall preferences for forbs than Anderson Mesa pronghorn, and both herds
demonstrated an overall avoidance of grasses. Diaminopamelic acid output of Garland Prairie
pronghorn was 35 to 129 % higher than pronghorn on Anderson Mesa suggesting a diet with a
higher nutrient quality. Fecal nitrogen values were inconclusive. The overall conclusion was
that the Garland Prairie pronghorn had a more diverse forage selection and with a higher nutrient
quality.
Keywords: Pronghorn Antelope, Antilocapra americana, Food Habits, Diet Quality,
Diaminopamelic Acid, Fecal Nitrogen.
2
INTRODUCTION
Pronghorn antelope populations on Anderson Mesa have demonstrated a significant
decline from an estimated high of 1,185 animals in 1985 to an estimated low of 220 in 2001
(AZGFD, unpublished data). The exact cause of this decline is not fully known, however low
fawn recruitment is considered a contributing factor. The average fawn recruitment for
Anderson Mesa over the last decade is only 11.7 fawns per 100 doe. During the same period, the
Garland Prairie antelope population, located approximately 50 km west, had a 37 fawn per 100
doe fawn recruitment (AZGFD, unpublished data).
While a number of factors may impact the differences in recruitment between these two
populations, a major consideration would be the nutritional status of the doe during critical
periods of the reproductive cycle. To evaluate the significance of the nutrient status as a factor
limiting recruitment in the Anderson Mesa population, it is first necessary to determine the
composition and quality of Anderson Mesa pronghorn diets during biologically critical periods.
The objectives of this study were:
1. To describe the diet composition of both the Anderson Mesa and Garland Prairie
antelope populations during critical reproductive periods.
2. To evaluate the nutritional quality of those diets during those reproductive periods
using indirect indicators of diet quality.
STUDY AREA
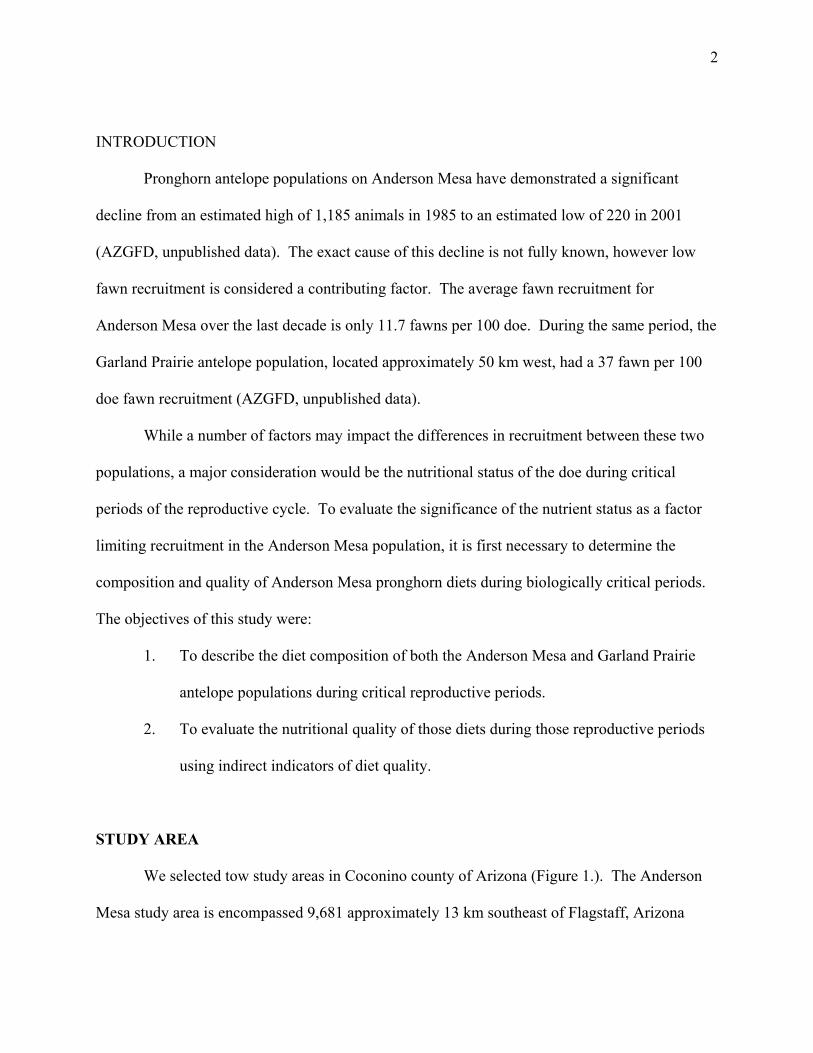
We selected tow study areas in Coconino county of Arizona (Figure 1.). The Anderson
Mesa study area is encompassed 9,681 approximately 13 km southeast of Flagstaff, Arizona
3
(111.5ºW: 35.1ºN), and is a portion of game management unit 5B. Elevation on Anderson Mesa
varied between 6,700 and 7,200 feet (Neff and Woolsey, 1979). The Garland Prairie study area
encompassed 5,540 hectares approximately 27 km west of Flagstaff, Arizona (111.9ºW: 35.2ºN),
and is a portion of game management unit 8. The mean elevation of Garland Prairie is
approximately 6,800 feet.
Figure 1. Location of the Anderson Mesa and Garland Prairie pronghorn antelope study areas in Northern Arizona.
4
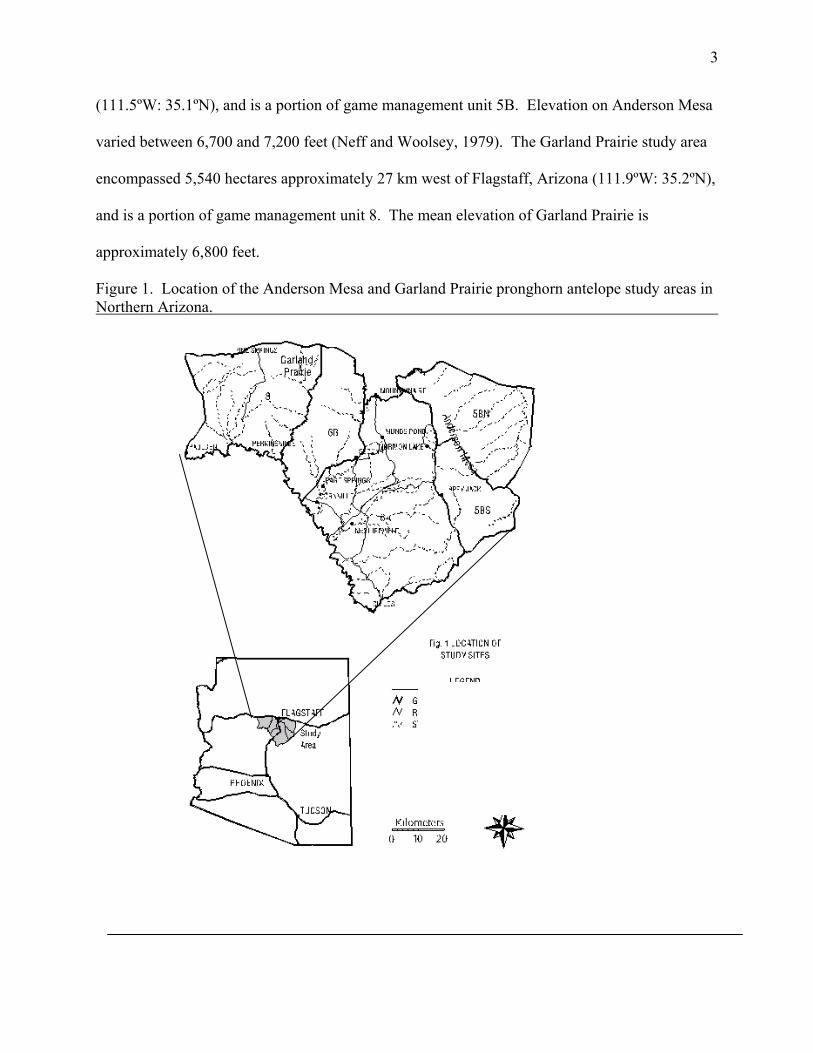
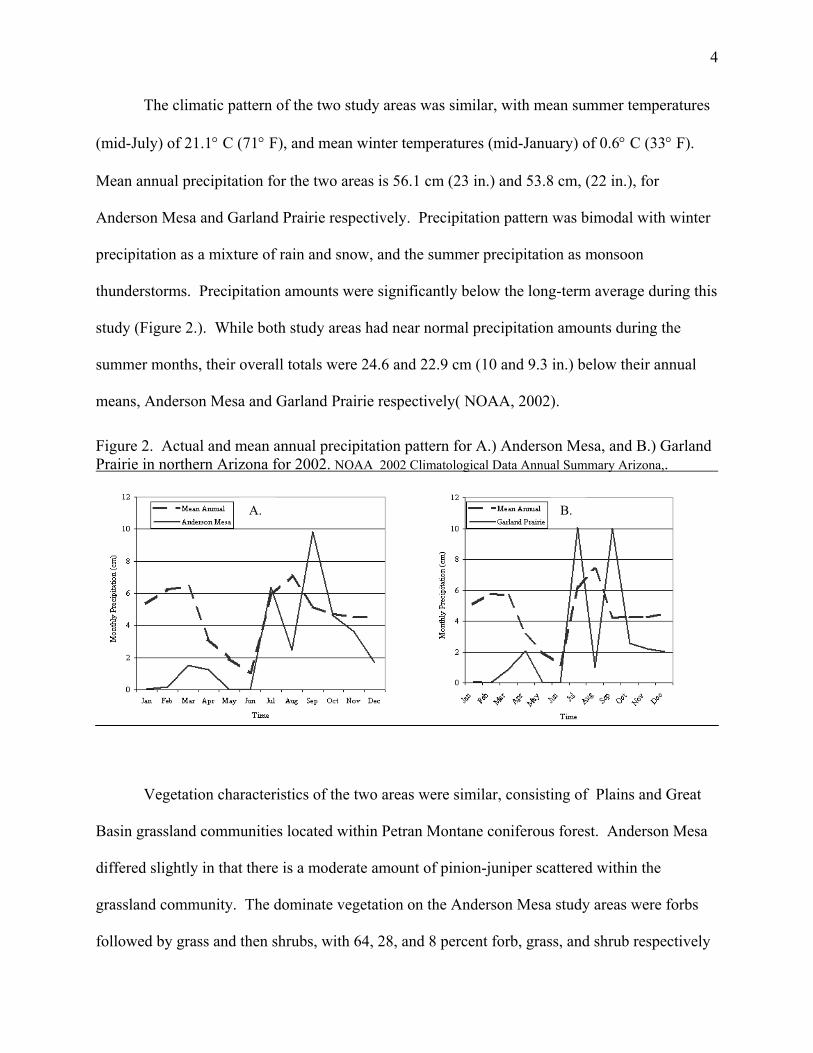
The climatic pattern of the two study areas was similar, with mean summer temperatures
(mid-July) of 21.1° C (71° F), and mean winter temperatures (mid-January) of 0.6° C (33° F).
Mean annual precipitation for the two areas is 56.1 cm (23 in.) and 53.8 cm, (22 in.), for
Anderson Mesa and Garland Prairie respectively. Precipitation pattern was bimodal with winter
precipitation as a mixture of rain and snow, and the summer precipitation as monsoon
thunderstorms. Precipitation amounts were significantly below the long-term average during this
study (Figure 2.). While both study areas had near normal precipitation amounts during the
summer months, their overall totals were 24.6 and 22.9 cm (10 and 9.3 in.) below their annual
means, Anderson Mesa and Garland Prairie respectively( NOAA, 2002).
Figure 2. Actual and mean annual precipitation pattern for A.) Anderson Mesa, and B.) Garland Prairie in northern Arizona for 2002. NOAA 2002 Climatological Data Annual Summary Arizona,.
Vegetation char
Basin grassland commu
differed slightly in that
grassland community.
followed by grass and t
A.
acteristics of the two areas were similar, consisti
nities located within Petran Montane coniferous
there is a moderate amount of pinion-juniper sca
The dominate vegetation on the Anderson Mesa
hen shrubs, with 64, 28, and 8 percent forb, gras
B.
ng of Plains and Great
forest. Anderson Mesa
ttered within the
study areas were forbs
s, and shrub respectively
5
(Appendix A). The dominant forb species included silver sage (Artemisia ludoviciana), aspen
fleabane (Erigeron macranthus), common fleabane (E. oreophilus), red root eriogonum
(Eriogonum racemosum), fleshy mullen (Verbascum thapsus), and goldeneyes (Viguiera
longifolia). The dominant grasses included, western wheatgrass (Agropyron smithii), and blue
grama (Bouteloua gracilis). The most common shrub species included green rabbitbrush
(Chrysothamnus nauseosus), and broom snakeweed (Gutierrezia sarothrae).
On Garland Prairie the vegetative composition was more uniform with forbs more
abundant at 35 %, followed by grasses at 33% and shrubs at 32%. Like Anderson Mesa, silver
sage, aspen and common fleabane, and red root eriogonum were the most common forb species,
with western wheatgrass, blue grama, bottlebrush squirreltail (Sitanion hystrix), and Arizona
fescue (Festuca arizonicus) as the most common grass species. The most abundant shrub species
on Garland Prairie were the same as those found on Anderson Mesa.
While the land ownership of Anderson Mesa is solely public land managed by the U.S.
Forest Service, Garland Prairie is a mixture of public and private ownership. The public lands of
both areas are managed as part of an active grazing allotments, with Anderson Mesa also having
a significant recreational activity in the vicinity of the Marshall Lake and Little Dry Lake.
METHODS
Field Data Collection
We analyzed fecal material to evaluate pronghorn diet composition and quality. We
collected fecal material during four critical periods of pronghorn reproduction: late gestation,
parturition, lactation, and conception. We consulted with wildlife biologists from the two study
areas, to determined dates of these periods (Table 1).
6
Table 1. Collection dates corresponding to the critical biological periods for Anderson Mesa, and Garland Prairie. Biological Pronghorn Herd Period Anderson Mesa Garland Prairie Late Gestation April 10 – April 25 April 1 – April 15 Parturition May 10 – May 30 May 5 – May 20 Lactation June 20 - July 10 June 15 – June 30 Conception August 20 – September 10 August 15 –August 30
Our protocol for fecal collection called for groups of pronghorn to be located and
observed until the majority of the individuals had defecated. Once the group had moved on, we
separately collected entire individual fecal pellet groups. We labeled each fecal sample with
date, number of pronghorn in the group, gender composition of the group, GPS location,
biological period, and study area. We kept all fecal samples frozen until laboratory analysis
could be performed.
We determined the plant species composition of each study area using 200 random
locations. At each location we collected data on species composition using four 0.5m circular
plots placed 1m from the center of the point oriented on the cardinal directions. In each subplot,
we estimated the biomass present by species using a double sampling technique. We further
collected the vegetation by species from one of the subplots for every 10 locations. We dried all
vegetation collections using the same protocol used for fecal material. We used the dried
collected vegetation to adjust each observer’s estimate to a dry weight basis and combined these
values to calculate relative plant composition of each study area.
Laboratory Analysis
Upon arrival at the laboratory, we cleaned samples by removing any foreign materials
and dried them at 50º C for 48 hr. After recording the dry weights of all individual pellet group,
we combined the groups to create four individual replicates per study area by biological period.
We took care to insure that multiple samples from the same group of pronghorn remained
7
together. We ground the replicates in a Wiley mill to a mean particle size of 1mm, and stored in
an airtight bottle for subsequent analysis.
Microhistological Analysis:
We determined diet composition using microhistological analysis of each replicate by
study area and biological period. We processed and analyzed fecal and reference materials using
the procedures described by Holt et al. (1991), and performed all microhistological at the 90%
(P=0.1) confidence level.
Fecal Indices:
We evaluated diet quality using two fecal indices: diaminopimelic acid (DAPA) content,
and fecal nitrogen content. We estimated fecal DAPA concentrations of individual diets using
the procedures described by Nelson et al. (1984). We adjusted each collection to total DAPA
content using the equation:
T DAPAi = (C DAPAi * PG Wt * 8)
Where, T DAPAi was the total DAPA in the diet, C DAPAi was the DAPA concentration of the
fecal sample, PG Wt was the weight of the pellet group, and 8 is the daily defecation rate of most
wild ungulates.
To determine fecal nitrogen concentration of individual diets we used a Kjheltec Auto
Nitrogen Analyzer model 1030 . Total fecal nitrogen content of individual diets were
determined using the equation:
T FNi = (C FNi * PG Wt * 8)
Where, T FNi was the total fecal nitrogen in the diet, C FNi was the fecal nitrogen concentration
of the fecal sample, PG Wt was the weight of the pellet group, and 8 was the daily defecation
rate of most wild ungulates.
8
Data Analysis
We designed this study to test two separate hypotheses. The first hypothesis is that there
is a difference in specie composition in pronghorn diets between Anderson Mesa and Garland
Prairie herds. We tested this hypothesis using a completely random three factor factorial design,
with pronghorn herds (Anderson Mesa and Garland Prairie), biological period (late gestation,
parturition, peak lactation, time of conception) and plant species as the factors. We analyzed
these data using a one-way analysis of variance (ANOVA). There were a high number of zeros
in the data due to differences in plant selection between study areas and biological periods.
Therefore, we used a non-parametric ranked sum analysis to evaluate the individual species
relationship of the diets. When significant differences were detected, we used a Tukey’s ranked
mean separation test to determine the nature of the difference (Zar, 1999).
We tested a second hypothesis that there was a difference in the diet quality between
Anderson Mesa and Garland Prairie. We designed this portion of the study as a completely
random two-factor factorial, where the two factors were study area and biological period. We
performed this analysis on each fecal index using a one-way ANOVA, and further tested any
significant differences using a Tukey’s mean separation test (Zar, 1999). We performed all
statistical tests at the 90 % confidence (P = 0.1) level.
RESULTS
Diet Composition Analysis
The mean individual species composition of the 2002 pronghorn diets for Anderson Mesa
and Garland Prairie are reported in Appendix B. We found significant difference in dietary plant
species diversity between pronghorn herds, with the Garland Prairie having higher mean species
diversity than Anderson Mesa (Table 2.). There were no differences between biological periods
9
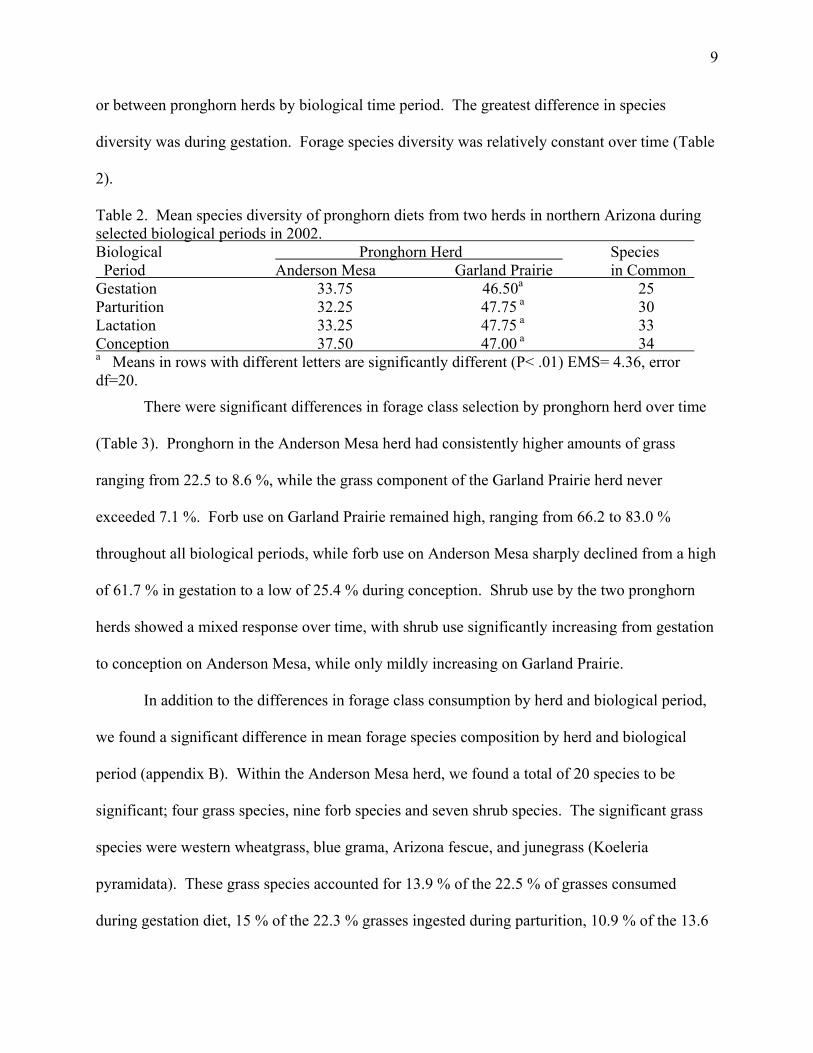
or between pronghorn herds by biological time period. The greatest difference in species
diversity was during gestation. Forage species diversity was relatively constant over time (Table
2).
Table 2. Mean species diversity of pronghorn diets from two herds in northern Arizona during selected biological periods in 2002. Biological Pronghorn Herd Species Period Anderson Mesa Garland Prairie in Common Gestation 33.75 46.50a 25 Parturition 32.25 47.75 a 30 Lactation 33.25 47.75 a 33 Conception 37.50 47.00 a 34 a Means in rows with different letters are significantly different (P< .01) EMS= 4.36, error df=20.
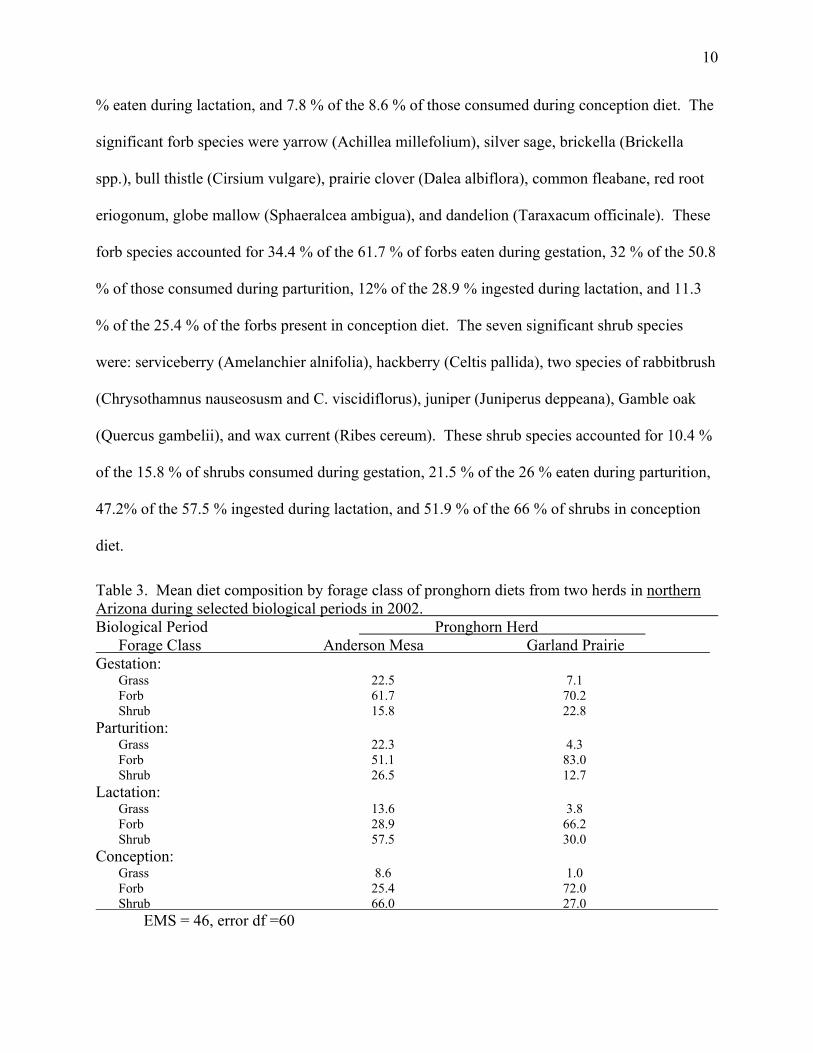
There were significant differences in forage class selection by pronghorn herd over time
(Table 3). Pronghorn in the Anderson Mesa herd had consistently higher amounts of grass
ranging from 22.5 to 8.6 %, while the grass component of the Garland Prairie herd never
exceeded 7.1 %. Forb use on Garland Prairie remained high, ranging from 66.2 to 83.0 %
throughout all biological periods, while forb use on Anderson Mesa sharply declined from a high
of 61.7 % in gestation to a low of 25.4 % during conception. Shrub use by the two pronghorn
herds showed a mixed response over time, with shrub use significantly increasing from gestation
to conception on Anderson Mesa, while only mildly increasing on Garland Prairie.
In addition to the differences in forage class consumption by herd and biological period,
we found a significant difference in mean forage species composition by herd and biological
period (appendix B). Within the Anderson Mesa herd, we found a total of 20 species to be
significant; four grass species, nine forb species and seven shrub species. The significant grass
species were western wheatgrass, blue grama, Arizona fescue, and junegrass (Koeleria
pyramidata). These grass species accounted for 13.9 % of the 22.5 % of grasses consumed
during gestation diet, 15 % of the 22.3 % grasses ingested during parturition, 10.9 % of the 13.6
10
% eaten during lactation, and 7.8 % of the 8.6 % of those consumed during conception diet. The
significant forb species were yarrow (Achillea millefolium), silver sage, brickella (Brickella
spp.), bull thistle (Cirsium vulgare), prairie clover (Dalea albiflora), common fleabane, red root
eriogonum, globe mallow (Sphaeralcea ambigua), and dandelion (Taraxacum officinale). These
forb species accounted for 34.4 % of the 61.7 % of forbs eaten during gestation, 32 % of the 50.8
% of those consumed during parturition, 12% of the 28.9 % ingested during lactation, and 11.3
% of the 25.4 % of the forbs present in conception diet. The seven significant shrub species
were: serviceberry (Amelanchier alnifolia), hackberry (Celtis pallida), two species of rabbitbrush
(Chrysothamnus nauseosusm and C. viscidiflorus), juniper (Juniperus deppeana), Gamble oak
(Quercus gambelii), and wax current (Ribes cereum). These shrub species accounted for 10.4 %
of the 15.8 % of shrubs consumed during gestation, 21.5 % of the 26 % eaten during parturition,
47.2% of the 57.5 % ingested during lactation, and 51.9 % of the 66 % of shrubs in conception
diet.
Table 3. Mean diet composition by forage class of pronghorn diets from two herds in northern Arizona during selected biological periods in 2002. Biological Period Pronghorn Herd Forage Class Anderson Mesa Garland Prairie Gestation: Grass 22.5 7.1 Forb 61.7 70.2 Shrub 15.8 22.8 Parturition: Grass 22.3 4.3 Forb 51.1 83.0 Shrub 26.5 12.7 Lactation: Grass 13.6 3.8 Forb 28.9 66.2 Shrub 57.5 30.0 Conception: Grass 8.6 1.0 Forb 25.4 72.0 Shrub 66.0 27.0
EMS = 46, error df =60
11
Within Garland Prairie diets, we found a total of 23 species to be significant, two grass
species, 17 forb species and four shrub species. The significant grass species were blue grama,
and junegrass. These two species accounted for 3.5 % of the 7.1 % of grasses consumed
gestation, 2.9 % of the 4.3 % eaten during parturition, 0.7 % of the 3.8 % ingested during
lactation, and 0.3 % of the 1.04 % consumed during conception. The significant forb species
were yarrow, silver sage, brickella, Indian paintbrush (Castilla integra), hairy golden aster
(Chrysopsis villosa), field bindweed (Convolvulus arvensis), cryoptantah (Cryptantah
angustifolia), Dalmatian toadflax (Linaria dalmatica), fillarie (Erodium cicutarium), aspen
fleabane, common fleabane, red root eriogonum, sunflower (Helianthus annuus), penstemon
(Penstemon spp.), silverweed (Potentilla anserina), dandelion, and goldeneye (Viguiera
longifolia). These forb species accounted for 36.5 % of the 70.2 % of forbs eaten during
gestation, 49.8 % of the 83 % present in parturition diet, 43.5% of the 66.2 % ingested during
lactation, and 42.8 % of the 72 % of forbs present in conception diet. The four significant shrub
species were: serviceberry, juniper, Ponderosa pine (Pinus ponderosa), and wild rose (Rosa spp.).
These shrub species accounted for 15 % of the 22.1 % of shrubs consumed during gestation, 9.2
% of the 12.7 % of the shrubs present in parturition diets, 16.9% of the 30 % of those eaten
during lactation diet, and 17.9 % of the 27.1 % of the shrubs found in conception diets.
Forage preference/Avoidance has been defined as the ratio of relative consumption of
individual plant species in proportion to the relative availability of that individual plant species.
Pri = Di/Ai
Where Di is the proportion of plant species i in the diet, Ai is the proportion of plant species i
available for consumption, and Pr is the preference value for plant species i. Generally, plants
with Pr values > 1.5 are considered plant species that animals are actively selecting for
12
(Selection), those with Pr values < 0.5 are considered species that are being actively selected
against (avoided), and plants with Pr values > 0.5 but < 1.5 are plants being consumed by chance
(no active selection or avoidance).
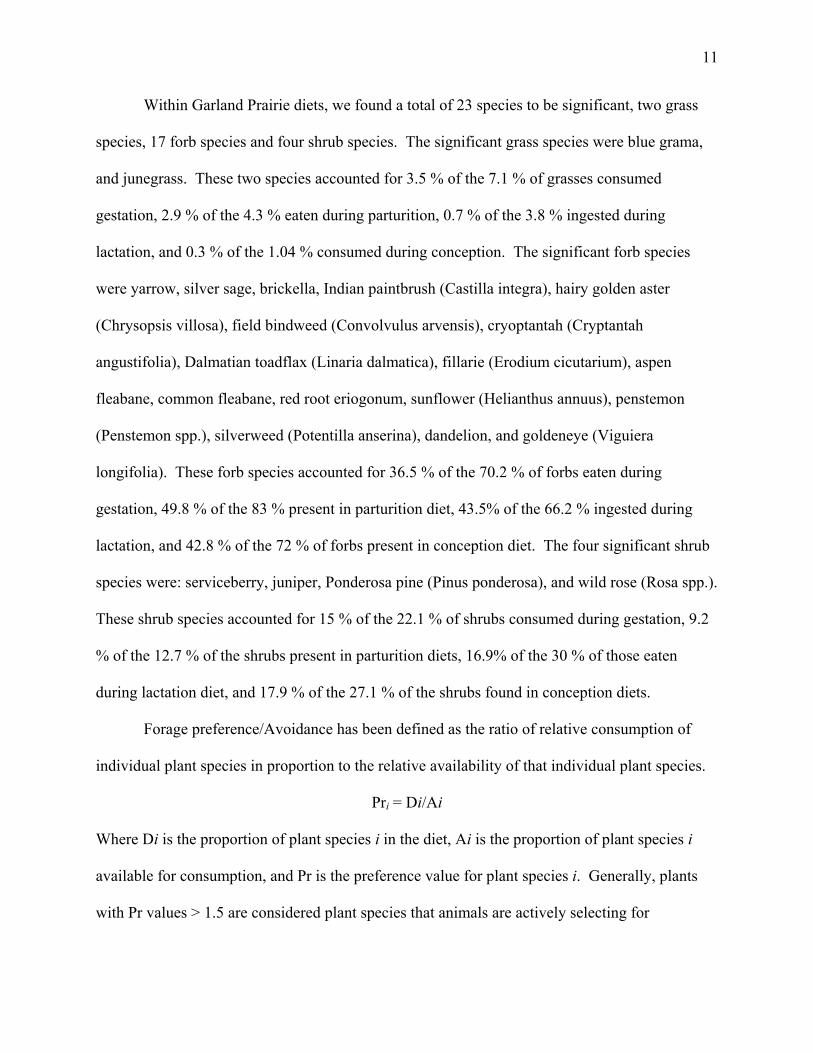
As a whole, for both the Garland Prairie and Anderson Mesa pronghorn diets, forbs had
the highest mean preference value of all forage classes (Figure 4.). The mean preference for
shrubs also indicated an active selection for shrubs, while the preference for grasses showed an
active avoidance of this forage class. Between the two pronghorn herds, preference for forbs on
Garland Prairie was almost twice that of Anderson Mesa, with the avoidance of grasses on
Garland Prairie far stronger than on Anderson Mesa (Figure 4.)
Figure 4. Forage class preference values for two pronghorn antelope herds in northern Arizona during selected biological periods in 2002.
If we examine the individual species preferences, we see further differences in forage
selection patterns between the two pronghorn herds (Appendix C). The Anderson Mesa herd,
selected for at least three grass species during every biological period and avoided five grass
species. Conversely, the Garland Prairie herd selected for only one grass species and avoided at
least 11 species. The most perferred grass species on Anderson Mesa was junegrass (Table 6.).
13
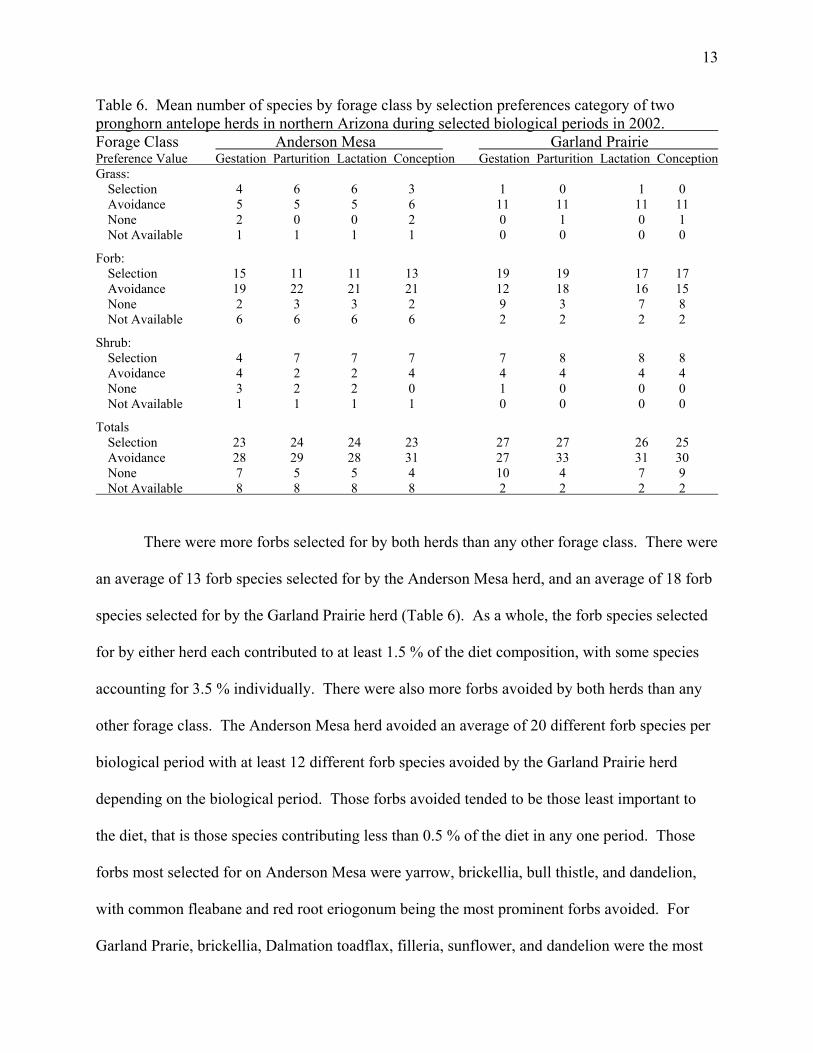
Table 6. Mean number of species by forage class by selection preferences category of two pronghorn antelope herds in northern Arizona during selected biological periods in 2002. Forage Class Anderson Mesa Garland Prairie Preference Value Gestation Parturition Lactation Conception Gestation Parturition Lactation Conception Grass: Selection 4 6 6 3 1 0 1 0 Avoidance 5 5 5 6 11 11 11 11 None 2 0 0 2 0 1 0 1 Not Available 1 1 1 1 0 0 0 0
Forb: Selection 15 11 11 13 19 19 17 17 Avoidance 19 22 21 21 12 18 16 15 None 2 3 3 2 9 3 7 8 Not Available 6 6 6 6 2 2 2 2
Shrub: Selection 4 7 7 7 7 8 8 8 Avoidance 4 2 2 4 4 4 4 4 None 3 2 2 0 1 0 0 0 Not Available 1 1 1 1 0 0 0 0
Totals Selection 23 24 24 23 27 27 26 25 Avoidance 28 29 28 31 27 33 31 30 None 7 5 5 4 10 4 7 9 Not Available 8 8 8 8 2 2 2 2
There were more forbs selected for by both herds than any other forage class. There were
an average of 13 forb species selected for by the Anderson Mesa herd, and an average of 18 forb
species selected for by the Garland Prairie herd (Table 6). As a whole, the forb species selected
for by either herd each contributed to at least 1.5 % of the diet composition, with some species
accounting for 3.5 % individually. There were also more forbs avoided by both herds than any
other forage class. The Anderson Mesa herd avoided an average of 20 different forb species per
biological period with at least 12 different forb species avoided by the Garland Prairie herd
depending on the biological period. Those forbs avoided tended to be those least important to
the diet, that is those species contributing less than 0.5 % of the diet in any one period. Those
forbs most selected for on Anderson Mesa were yarrow, brickellia, bull thistle, and dandelion,
with common fleabane and red root eriogonum being the most prominent forbs avoided. For
Garland Prarie, brickellia, Dalmation toadflax, filleria, sunflower, and dandelion were the most
14
prefered, with tragopogon (Tragopogon dubius), locoweed (Astragulus spp.), and Arizona
ragweed (Ambrosia psilostachya) showing the greatest avoidance.
Shrub species selection and avoidance was much less dramatic than forbs or grasses. The
Anderson Mesa herd selected for four to six shrubs species while avoiding two to four shrub
species. The shrub species most often selected for was serviceberry, followed by wax current
and juniper. The shrubs with the lowest preference value were broom snakeweed and shrubby
buckwheat (Eriogonum faciculatum). On Garland Prairie the most often selected shrub species
was also serviceberry, followed by hackberry (Celtis pallida), Gamble oak (Quercus gambleii),
and wild rose (Rosa spp.). The least selected species were again broom snakeweed and shrubby
buckwheat.
Diaminopamelic Acid Analysis
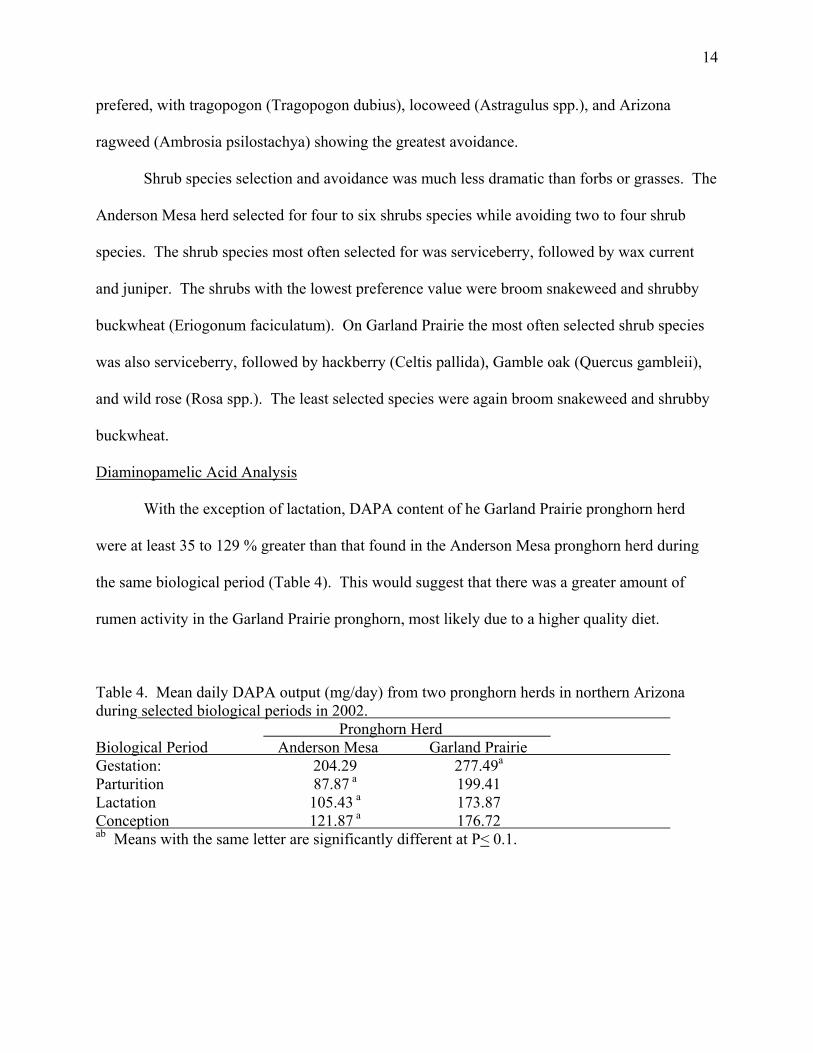
With the exception of lactation, DAPA content of he Garland Prairie pronghorn herd
were at least 35 to 129 % greater than that found in the Anderson Mesa pronghorn herd during
the same biological period (Table 4). This would suggest that there was a greater amount of
rumen activity in the Garland Prairie pronghorn, most likely due to a higher quality diet.
Table 4. Mean daily DAPA output (mg/day) from two pronghorn herds in northern Arizona during selected biological periods in 2002. Pronghorn Herd Biological Period Anderson Mesa Garland Prairie Gestation: 204.29 277.49a Parturition 87.87 a 199.41 Lactation 105.43 a 173.87 Conception 121.87 a 176.72 ab Means with the same letter are significantly different at P< 0.1.
15
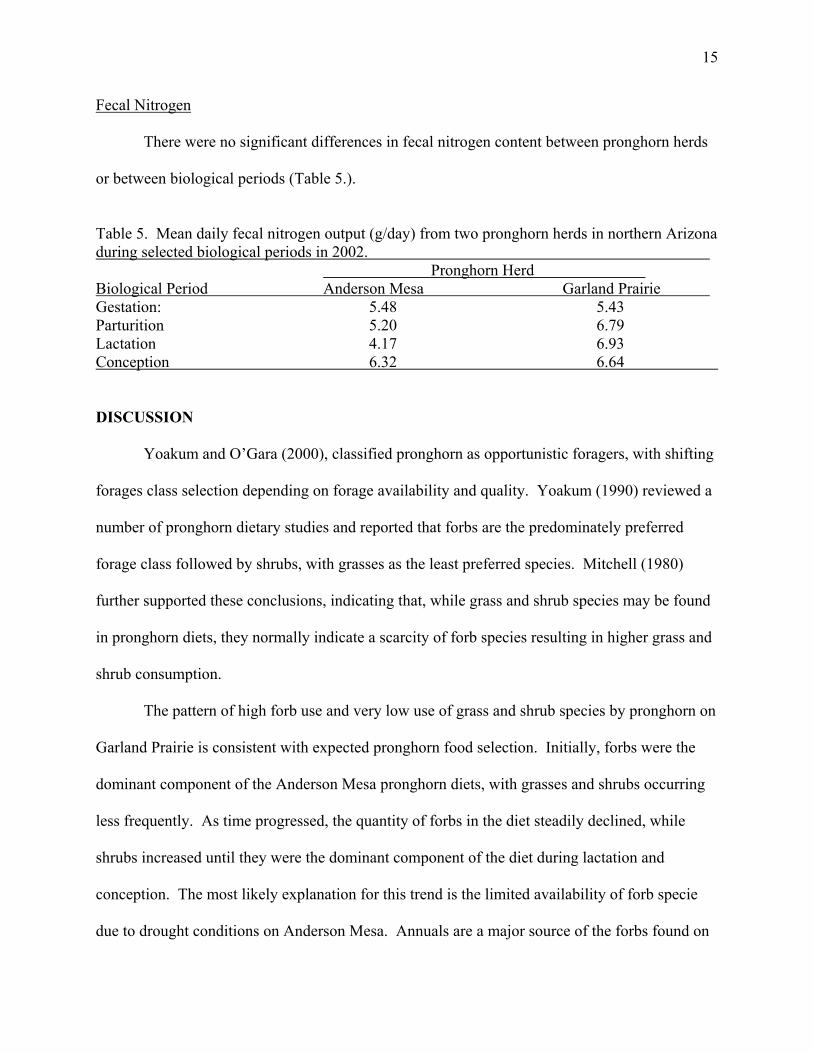
Fecal Nitrogen
There were no significant differences in fecal nitrogen content between pronghorn herds
or between biological periods (Table 5.).
Table 5. Mean daily fecal nitrogen output (g/day) from two pronghorn herds in northern Arizona during selected biological periods in 2002. Pronghorn Herd Biological Period Anderson Mesa Garland Prairie Gestation: 5.48 5.43 Parturition 5.20 6.79 Lactation 4.17 6.93 Conception 6.32 6.64
DISCUSSION
Yoakum and O’Gara (2000), classified pronghorn as opportunistic foragers, with shifting
forages class selection depending on forage availability and quality. Yoakum (1990) reviewed a
number of pronghorn dietary studies and reported that forbs are the predominately preferred
forage class followed by shrubs, with grasses as the least preferred species. Mitchell (1980)
further supported these conclusions, indicating that, while grass and shrub species may be found
in pronghorn diets, they normally indicate a scarcity of forb species resulting in higher grass and
shrub consumption.
The pattern of high forb use and very low use of grass and shrub species by pronghorn on
Garland Prairie is consistent with expected pronghorn food selection. Initially, forbs were the
dominant component of the Anderson Mesa pronghorn diets, with grasses and shrubs occurring
less frequently. As time progressed, the quantity of forbs in the diet steadily declined, while
shrubs increased until they were the dominant component of the diet during lactation and
conception. The most likely explanation for this trend is the limited availability of forb specie
due to drought conditions on Anderson Mesa. Annuals are a major source of the forbs found on
16
Anderson Mesa. The growth and availability of these forbs are directly affected by precipitation.
During the spring and summer of 2002, the Anderson Mesa area only received 11.6 cm of its
normal 25.6 cm of precipitation. This would contribute to a below normal forb availability and
explain the higher use of shrubs by Anderson Mesa pronghorn.
Diaminopamelic acid is a unique amino acid found in anaerobic bacteria such as those
found in the rumen of ungulate species. Because of the amino acid specificity of pancreatic and
intestinal mucosal enzymes, peptides containing DAPA cannot be broken down to individual
amino acids for absorption. These DAPA containing tri-peptides pass out of the digestive tract
in the feces, where they can be measured as an indirect indicator to the ruminant animal’s diet
quality. Nelson et al. (1984) established the value of Diaminopamelic acid (DAPA) as a fecal
indicator of diet quality. The content of DAPA recovered from the Garland Prairie and
Anderson Mesa pronghorn herds would indicate a significantly higher quality diet in the Garland
Prairie herd, across all biological periods.
Diet quality can have particular significant impacts on reproductive function in wild
ruminants depending on the particular stage of reproduction. The quality of the diet during late
gestation is significant to the development of the fawn. While the majority of the cell
development occurs during the first two trimesters of gestation, the vast majority of fetal growth
takes place in the last trimester. Diets of low nutritional quality during the last trimester
typically result in low birth weights of the fawn, which in turn has significant implications for
initial fawn survival (Robbins, 1983).
Diet quality during the parturition period may have more impact on the doe than the
fawn. During the final days of gestation, there are a number of physiological changes that take
place in the doe in preparation for parturition. The most important of these changes are the
17
hormonal variations related to parturition and the initiation of lactation. In most wild ruminants
the protein requirement for parturition is equal to, or exceed the normal maintenance
requirements (Moen, A. N.1973, Robbins, 1983). In order to meet these requirements the doe
must increase her nutrient intake. Should she be on a limited quality diet, the only alternative
she will have is to increase her dry matter intake. Normally wild ruminants have a daily dry
matter intake of about 2.5% of their body weight (BW). The nature of the doe’s nutrient needs
are such that if the diet quality is not increased, she may have to increase her intake to 3.3 or 4 %
BW in order to meet her nutrient demands. The problem with this scenario is that low quality
forages not only do not provide the necessary nutrients, they have a low digestibility. This low
digestibility results in a reduced microbial efficiency in the rumen, a slower passage rate of
forage out of the rumen, and the accumulation of materials that prevent the doe from increasing
her dry matter intake (Hungate 1966, Milligan et al. 1986, Grovum 1988,) The summation of
these conditions is that the doe is not able to significantly increase her intake, thus limiting her
ability to meet her needs for parturition and early lactation.
The period with the single highest nutrient demands on the doe is lactation (Robbins,
1983). Protein and energy requirements vary with time as a function of the body size and
digestive development of the fawn. The amount of protein and energy required by the doe is a
function of two conditions: 1) The nutrient demand of the fawn for growth, and 2) The amount of
solid food the fawn can effectively consume to meet that demand. The doe will try to provide as
much milk as she can to meet the needs of the fawn not met by the fawn’s forage intake.
At birth, the rumen/reticular complex of the fawn is non-functional, and requires
extensive development in size and capabilities. As the fawn grows the demand for nutrients for
growth exceed the amount it can obtain from solid food, thus the demand on the doe to offset the
18
difference is increased (Robbins, 1983). This trend continues until the fawn is about 50 days of
age, at which time the development of the rumen begins catching up with the fawn’s demands
for growth. If, however, the quality of the diet is such that the doe is not able to meet her own
nutrient needs and those of the fawn, then two things will happen. First her ability to produce
milk will decline, making it more difficult for the fawn to meet its nutrient requirements.
Secondly the reduced nutrient intake of the fawn will retard its development, and increase its risk
to mortality factors.
The importance of nutrition during the conception period is often overlooked when
examining the reproductive performance of wild ungulates. A primary reason for this oversight
is that the doe has just completed gestation, parturition and lactation. At this stage in the annual
life cycle the fawn has been weaned and the only apparent nutrient demands for the doe is
maintenance. This is where the misconception occurs. While there are no direct demands for
production of a fawn, the doe has just completed a 335-day process that has placed significant
demands on all of her body reserves. If she is to be able to breed and conceive in time for the
next year, she has only 30 days in which to replenish her body conditions in order to cycle for
breeding. During this period, protein levels in the diet are critical to the doe’s potential for
breeding in a timely manner (Shirley, 1986). The pattern of DAPA concentrations shown in
Figure 5 would suggest that the does in the Anderson Mesa herd have as much as 20% less
protein in their diet as the Garland Prairie herd. This would suggest that does in the Anderson
Mesa herd may have more difficulty cycling their reproductive functions to be able to breed on
an annual basis. This phenomenon alone may partially account for the lower fawn recruitment
observed in the Anderson Mesa herd.
19
Fecal nitrogen is derived from a number of digestive and physiological sources. A
component of fecal nitrogen is nitrogen contained in undigested foodstuffs. In most non-
ruminant animals, undigested food provides a significant input to fecal nitrogen. However, in
ruminant diets, this input is not as significant. The primary site of nitrogen in plant materials is
in the cell soluble content. The rumen microbial population is highly efficient in digesting plant
cell soluble contents. It has been estimated that cell soluble degradation by rumen bacteria is as
high as 95% (Hungate, 1966). For this reason undigested food sources of nitrogen are small in
ruminant animals. The second source is microbial residue, specifically undigested bacterial
protein such as DAPA. The third source is non-recovered digestive enzymes. These are a
combination of pancreatic and intestinal enzymes involved in the breakdown of food in the mid-
gut. The final source of fecal nitrogen is epithelial tissue shed by the digestive tract. The
quantity of GI tract tissue is a function of the physical characteristics of the diet. Foodstuffs that
are highly succulent with low amounts of fiber are less effective in scouring the GI tract.
Conversely, diets high in poorly digested fiber are highly effective in scouring epithelial tissue
form the inside of the GI tract (Merchen, 1988).
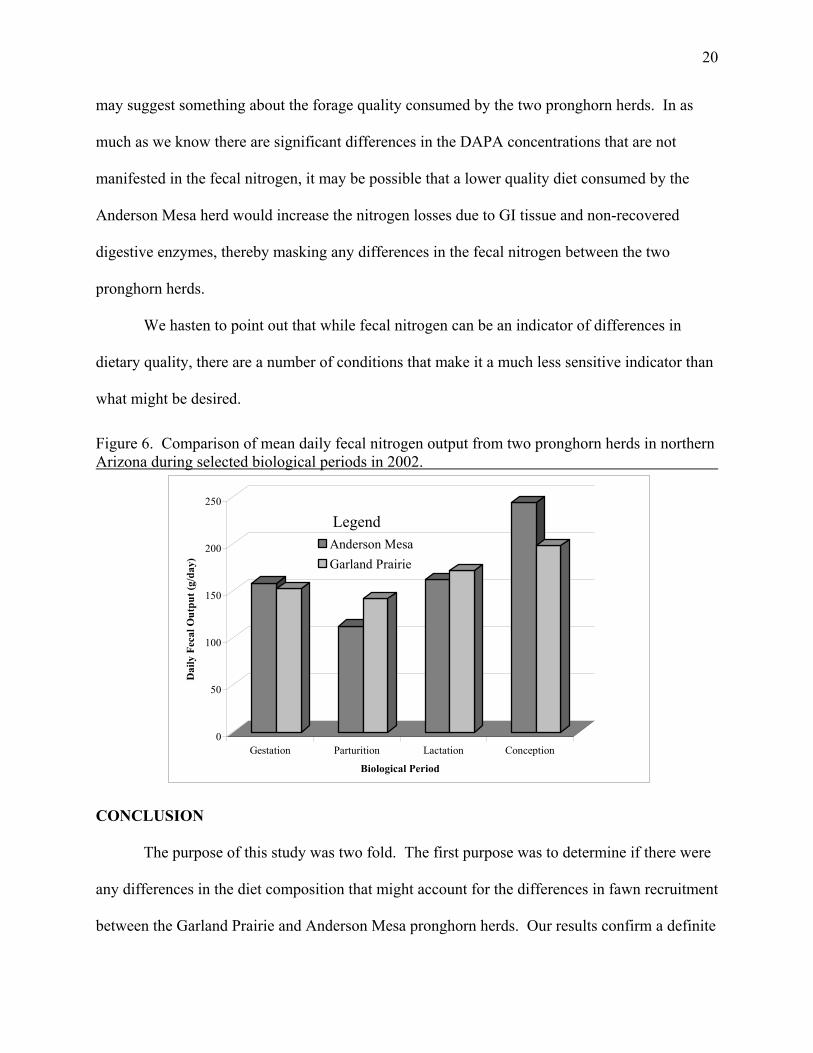
The pattern of fecal nitrogen shown in Figure 6 indicates no difference in fecal nitrogen
between pronghorn herds or over time. This may be misleading. As we reported, there are
significant differences in the DAPA concentrations of the feces, however they are not apparent in
the fecal nitrogen. One possible explanation is the effect of the quality of the diet. Those diet
with higher amounts fiber are of lower quality, and have the potential of depositing higher
amounts of nitrogen in the feces from GI tract tissue. Further, poorly digested foods tend to
cause larger amounts of digestive enzymes to be excreted in the digestive tract, thus increasing
nitrogen in the feces from non-recovered digestive enzymes. This lack of significant difference
20
may suggest something about the forage quality consumed by the two pronghorn herds. In as
much as we know there are significant differences in the DAPA concentrations that are not
manifested in the fecal nitrogen, it may be possible that a lower quality diet consumed by the
Anderson Mesa herd would increase the nitrogen losses due to GI tissue and non-recovered
digestive enzymes, thereby masking any differences in the fecal nitrogen between the two
pronghorn herds.
We hasten to point out that while fecal nitrogen can be an indicator of differences in
dietary quality, there are a number of conditions that make it a much less sensitive indicator than
what might be desired.
Figure 6. Comparison of mean daily fecal nitrogen output from two pronghorn herds in northern Arizona during selected biological periods in 2002.
0
50
100
150
200
250
Dai
ly F
ecal
Out
put (
g/da
y)
Gestation Parturition Lactation Conception
Biological Period
Anderson MesaGarland Prairie
Legend
CONCLUSION
The purpose of this study was two fold. The first purpose was to determine if there were
any differences in the diet composition that might account for the differences in fawn recruitment
between the Garland Prairie and Anderson Mesa pronghorn herds. Our results confirm a definite
21
difference in the diet composition, with the Garland Prairie herd diets having significantly higher
plant diversity across all biological periods. The Garland Prairie diets had a significantly higher
proportion of forbs and lower quantities of grasses than the Anderson Mesa diets. Even though,
the Anderson Mesa herd started out with relatively high forb content, there was a continual
conversion from forb to shrub over time, until shrub species dominated their diet. Additionally,
the Garland Prairie herd showed a dramatically higher preference for forb species than the
Anderson Mesa herd.
The second purpose was to evaluate the quality of the diet using indirect indicators of diet
quality. Diaminopimelic acid analysis of feces from both herds showed a significant difference
between pronghorn herds. The Garland Prairie herds had significantly higher DAPA levels
across all biological periods, indicating a higher rumen microbial activity most likely related to a
higher diet quality. The use of fecal nitrogen as an indicator of diet quality was inconclusive.
The lack of difference between pronghorn herds was most likely due to the sources of fecal
nitrogen, and the possible impact low quality/high fiber forages have of metabolic fecal nitrogen
level.
Even though the direct evaluation of the nutrient quality of the two herd’s diet could not
be performed due to insufficient plant material collection, there is sufficient indication that the
Garland Prairie pronghorn herd was on a higher nutritional plane than the Anderson Mesa herd.
This higher nutritional condition during critical periods of reproduction could account for the
higher fawn recruitment on Garland Prairie.
We hasten to point out that this study was conducted in the fifth year of a drought, and
that the impacts of that drought may be cumulative. It is highly possible that even though the

22
Garland Prairie herd is on a higher quality diet, the quality of that diet might not be sufficient to
allow the Garland Prairie herd to sustain a strong pattern of fawn recruitment.

23
LITERTURE CITED
Grovum, W. L. 1988. Appetite, palatability and control of feed intake. in The Ruminant
Animal Digestive Physiology and Nutrition. D. C. Church, ed. Prentice Hall Englewood
Cliffs. 202-216.
Holt, B. S., W. H. Miller, and B. F. Wakeling. 1992. Composition and quality of desert bighorn
sheep diets in the Superstition Mountains, Arizona, Desert Bighorn Council Proc. 36:36-
41.
Hungate, R. E. 1966. The Rumen and Its Microbes. Academic Press. New York. 533 pg.
Merchen, N. R. 1988 Digestion, Absorption and Excretion in Ruminants. in The Ruminant
Animal Digestive Physiology and Nutrition. D. C. Church, ed. Prentice Hall Englewood
Cliffs. 172-201.
Mitchell, G. J. 1980. The Pronghorn Antelope in Alberta. University of Regina. 165 pg.
Milligan, L. P. , W. L. Grovum, and A. Dobson. 1986. Control of Digestion and Metabolism in
Ruminants. Prentice Hall. Englewood Cliffs. 576 pg.
Moen, A. N. 1973. Wildlife Ecology: An Analytical Approach. Freeman, San Francisco.
456pg.
Neff, D., J., and N. G. Woolsey. 1979. Effect of predation by coyotes on survival of antelope
fawns on Anderson Mesa. Special Report 8, Arizona Game and Fish Department,
Phoenix, Arizona.
Nelson, J. R. and B. B. Davitt. 1984. A regional cooperative DAPA research and development
program. Pages 148-163 in R.W.Nelson. Proceedings of the Western States and
Provinces Elk Workshop. Edmonton, Alberta.
Robbins, C. T. 1983. Wildlife Feeding And Nutrition. Academic Press. New York. 343pg.
24
Shirley, R. L. 1986. Nitrogen and Energy Nutrition of Ruminants. Academic Press. San Diego.
358 pg.
Yoakum, J. D. 1990. Food habits of the pronghorn. Pronghorn Antelope Workshop Proceedings.
14:102-111.
Yoakum, J. D. and B. W. O’Gara. 2000. Pronghorn. in Ecology and Management of Large
Mammals in North America. S. Demarais and P. R. Krausman ed. Prentice Hall Inc.
Upper Saddle River, NJ. 559:577.
Zar, J. H. 1999. Biostatistical Analysis. Prentice Hall Inc. Upper Saddle River, NJ. 663 pg.
25
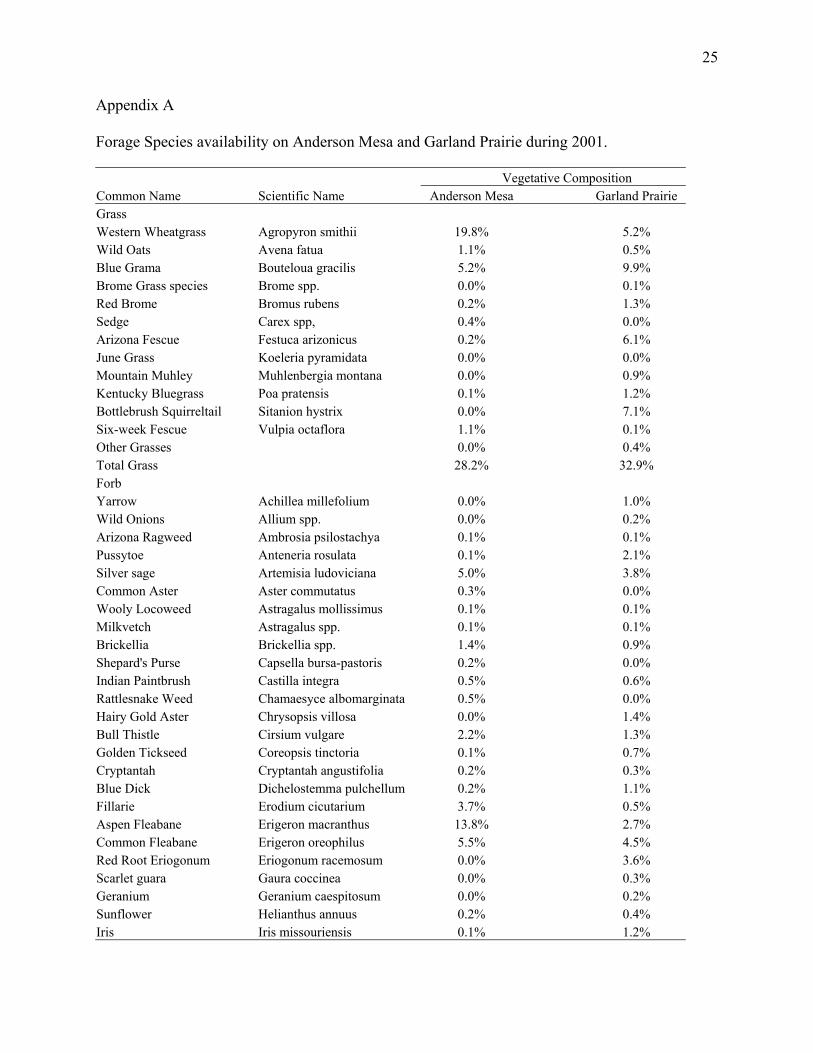
Appendix A
Forage Species availability on Anderson Mesa and Garland Prairie during 2001. Vegetative Composition Common Name Scientific Name Anderson Mesa Garland Prairie Grass Western Wheatgrass Agropyron smithii 19.8% 5.2% Wild Oats Avena fatua 1.1% 0.5% Blue Grama Bouteloua gracilis 5.2% 9.9% Brome Grass species Brome spp. 0.0% 0.1% Red Brome Bromus rubens 0.2% 1.3% Sedge Carex spp, 0.4% 0.0% Arizona Fescue Festuca arizonicus 0.2% 6.1% June Grass Koeleria pyramidata 0.0% 0.0% Mountain Muhley Muhlenbergia montana 0.0% 0.9% Kentucky Bluegrass Poa pratensis 0.1% 1.2% Bottlebrush Squirreltail Sitanion hystrix 0.0% 7.1% Six-week Fescue Vulpia octaflora 1.1% 0.1% Other Grasses 0.0% 0.4% Total Grass 28.2% 32.9% Forb Yarrow Achillea millefolium 0.0% 1.0% Wild Onions Allium spp. 0.0% 0.2% Arizona Ragweed Ambrosia psilostachya 0.1% 0.1% Pussytoe Anteneria rosulata 0.1% 2.1% Silver sage Artemisia ludoviciana 5.0% 3.8% Common Aster Aster commutatus 0.3% 0.0% Wooly Locoweed Astragalus mollissimus 0.1% 0.1% Milkvetch Astragalus spp. 0.1% 0.1% Brickellia Brickellia spp. 1.4% 0.9% Shepard's Purse Capsella bursa-pastoris 0.2% 0.0% Indian Paintbrush Castilla integra 0.5% 0.6% Rattlesnake Weed Chamaesyce albomarginata 0.5% 0.0% Hairy Gold Aster Chrysopsis villosa 0.0% 1.4% Bull Thistle Cirsium vulgare 2.2% 1.3% Golden Tickseed Coreopsis tinctoria 0.1% 0.7% Cryptantah Cryptantah angustifolia 0.2% 0.3% Blue Dick Dichelostemma pulchellum 0.2% 1.1% Fillarie Erodium cicutarium 3.7% 0.5% Aspen Fleabane Erigeron macranthus 13.8% 2.7% Common Fleabane Erigeron oreophilus 5.5% 4.5% Red Root Eriogonum Eriogonum racemosum 0.0% 3.6% Scarlet guara Gaura coccinea 0.0% 0.3% Geranium Geranium caespitosum 0.0% 0.2% Sunflower Helianthus annuus 0.2% 0.4% Iris Iris missouriensis 0.1% 1.2%
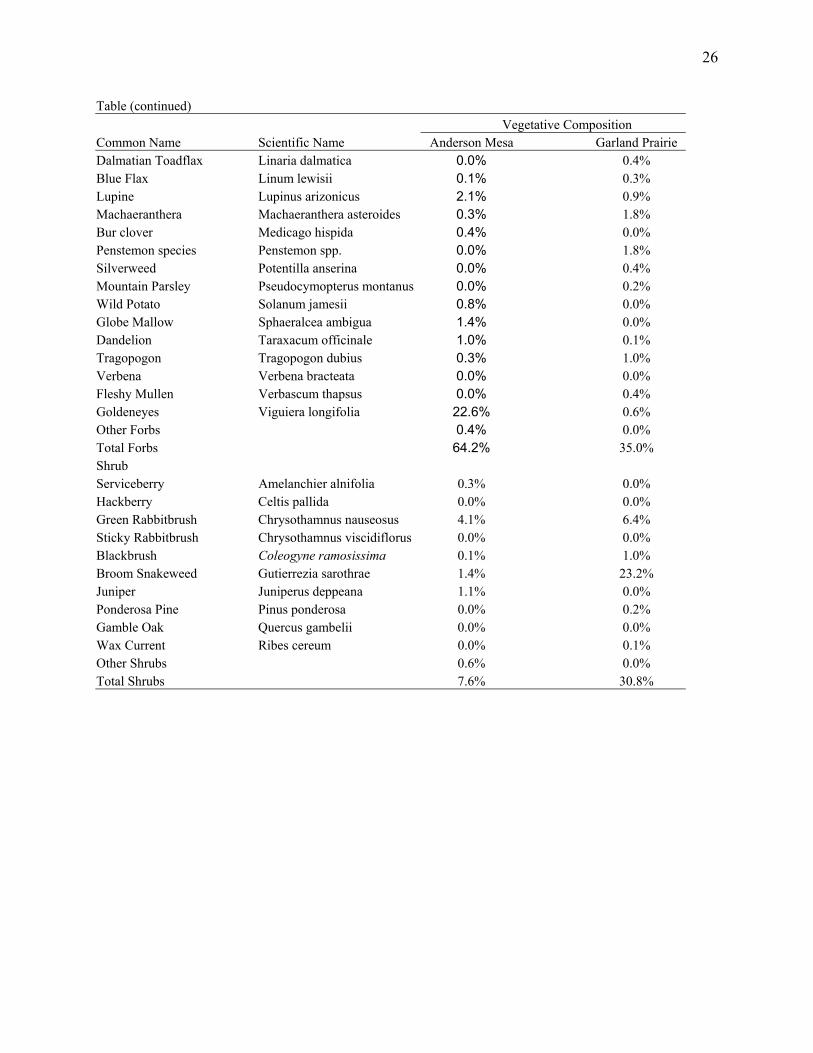
26
Table (continued) Vegetative Composition Common Name Scientific Name Anderson Mesa Garland Prairie Dalmatian Toadflax Linaria dalmatica 0.0% 0.4% Blue Flax Linum lewisii 0.1% 0.3% Lupine Lupinus arizonicus 2.1% 0.9% Machaeranthera Machaeranthera asteroides 0.3% 1.8% Bur clover Medicago hispida 0.4% 0.0% Penstemon species Penstemon spp. 0.0% 1.8% Silverweed Potentilla anserina 0.0% 0.4% Mountain Parsley Pseudocymopterus montanus 0.0% 0.2% Wild Potato Solanum jamesii 0.8% 0.0% Globe Mallow Sphaeralcea ambigua 1.4% 0.0% Dandelion Taraxacum officinale 1.0% 0.1% Tragopogon Tragopogon dubius 0.3% 1.0% Verbena Verbena bracteata 0.0% 0.0% Fleshy Mullen Verbascum thapsus 0.0% 0.4% Goldeneyes Viguiera longifolia 22.6% 0.6% Other Forbs 0.4% 0.0% Total Forbs 64.2% 35.0% Shrub Serviceberry Amelanchier alnifolia 0.3% 0.0% Hackberry Celtis pallida 0.0% 0.0% Green Rabbitbrush Chrysothamnus nauseosus 4.1% 6.4% Sticky Rabbitbrush Chrysothamnus viscidiflorus 0.0% 0.0% Blackbrush Coleogyne ramosissima 0.1% 1.0% Broom Snakeweed Gutierrezia sarothrae 1.4% 23.2% Juniper Juniperus deppeana 1.1% 0.0% Ponderosa Pine Pinus ponderosa 0.0% 0.2% Gamble Oak Quercus gambelii 0.0% 0.0% Wax Current Ribes cereum 0.0% 0.1% Other Shrubs 0.6% 0.0% Total Shrubs 7.6% 30.8%
27
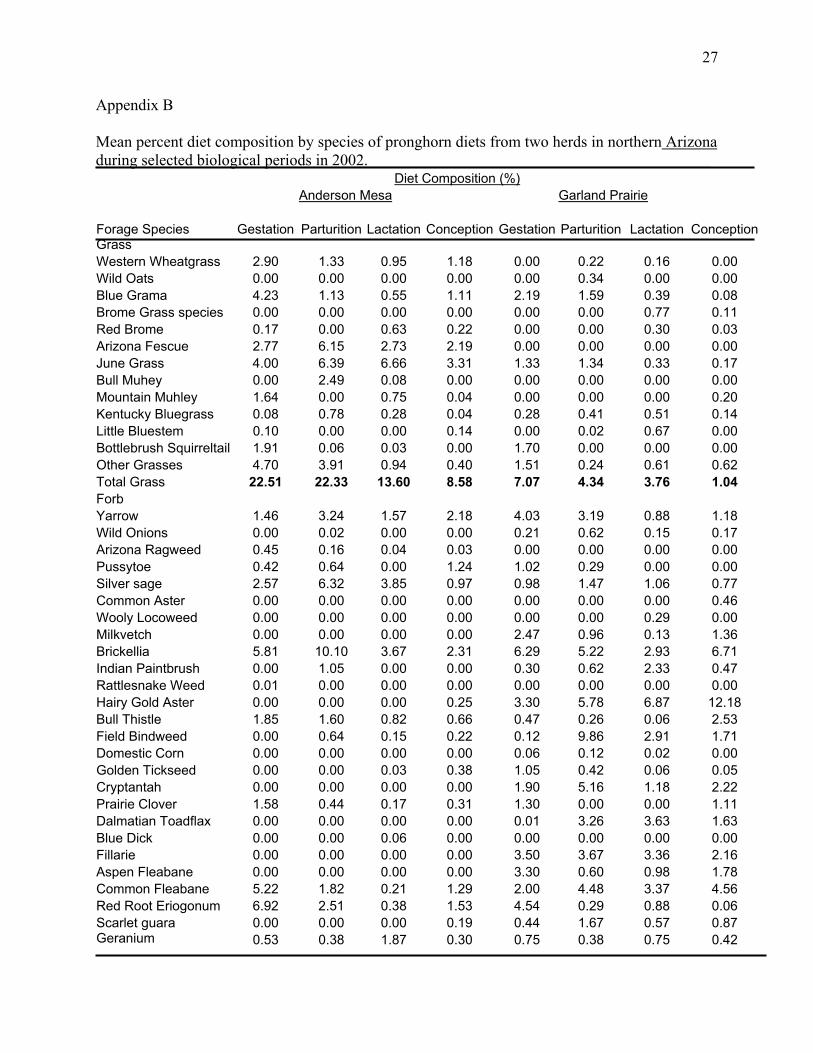
Appendix B
Mean percent diet composition by species of pronghorn diets from two herds in northern Arizona during selected biological periods in 2002. Diet Composition (%) Anderson Mesa Garland Prairie Forage Species Gestation Parturition Lactation Conception Gestation Parturition Lactation ConceptionGrass Western Wheatgrass 2.90 1.33 0.95 1.18 0.00 0.22 0.16 0.00 Wild Oats 0.00 0.00 0.00 0.00 0.00 0.34 0.00 0.00 Blue Grama 4.23 1.13 0.55 1.11 2.19 1.59 0.39 0.08 Brome Grass species 0.00 0.00 0.00 0.00 0.00 0.00 0.77 0.11 Red Brome 0.17 0.00 0.63 0.22 0.00 0.00 0.30 0.03 Arizona Fescue 2.77 6.15 2.73 2.19 0.00 0.00 0.00 0.00 June Grass 4.00 6.39 6.66 3.31 1.33 1.34 0.33 0.17 Bull Muhey 0.00 2.49 0.08 0.00 0.00 0.00 0.00 0.00 Mountain Muhley 1.64 0.00 0.75 0.04 0.00 0.00 0.00 0.20 Kentucky Bluegrass 0.08 0.78 0.28 0.04 0.28 0.41 0.51 0.14 Little Bluestem 0.10 0.00 0.00 0.14 0.00 0.02 0.67 0.00 Bottlebrush Squirreltail 1.91 0.06 0.03 0.00 1.70 0.00 0.00 0.00 Other Grasses 4.70 3.91 0.94 0.40 1.51 0.24 0.61 0.62 Total Grass 22.51 22.33 13.60 8.58 7.07 4.34 3.76 1.04 Forb Yarrow 1.46 3.24 1.57 2.18 4.03 3.19 0.88 1.18 Wild Onions 0.00 0.02 0.00 0.00 0.21 0.62 0.15 0.17 Arizona Ragweed 0.45 0.16 0.04 0.03 0.00 0.00 0.00 0.00 Pussytoe 0.42 0.64 0.00 1.24 1.02 0.29 0.00 0.00 Silver sage 2.57 6.32 3.85 0.97 0.98 1.47 1.06 0.77 Common Aster 0.00 0.00 0.00 0.00 0.00 0.00 0.00 0.46 Wooly Locoweed 0.00 0.00 0.00 0.00 0.00 0.00 0.29 0.00 Milkvetch 0.00 0.00 0.00 0.00 2.47 0.96 0.13 1.36 Brickellia 5.81 10.10 3.67 2.31 6.29 5.22 2.93 6.71 Indian Paintbrush 0.00 1.05 0.00 0.00 0.30 0.62 2.33 0.47 Rattlesnake Weed 0.01 0.00 0.00 0.00 0.00 0.00 0.00 0.00 Hairy Gold Aster 0.00 0.00 0.00 0.25 3.30 5.78 6.87 12.18 Bull Thistle 1.85 1.60 0.82 0.66 0.47 0.26 0.06 2.53 Field Bindweed 0.00 0.64 0.15 0.22 0.12 9.86 2.91 1.71 Domestic Corn 0.00 0.00 0.00 0.00 0.06 0.12 0.02 0.00 Golden Tickseed 0.00 0.00 0.03 0.38 1.05 0.42 0.06 0.05 Cryptantah 0.00 0.00 0.00 0.00 1.90 5.16 1.18 2.22 Prairie Clover 1.58 0.44 0.17 0.31 1.30 0.00 0.00 1.11 Dalmatian Toadflax 0.00 0.00 0.00 0.00 0.01 3.26 3.63 1.63 Blue Dick 0.00 0.00 0.06 0.00 0.00 0.00 0.00 0.00 Fillarie 0.00 0.00 0.00 0.00 3.50 3.67 3.36 2.16 Aspen Fleabane 0.00 0.00 0.00 0.00 3.30 0.60 0.98 1.78 Common Fleabane 5.22 1.82 0.21 1.29 2.00 4.48 3.37 4.56 Red Root Eriogonum 6.92 2.51 0.38 1.53 4.54 0.29 0.88 0.06 Scarlet guara 0.00 0.00 0.00 0.19 0.44 1.67 0.57 0.87 Geranium 0.53 0.38 1.87 0.30 0.75 0.38 0.75 0.42
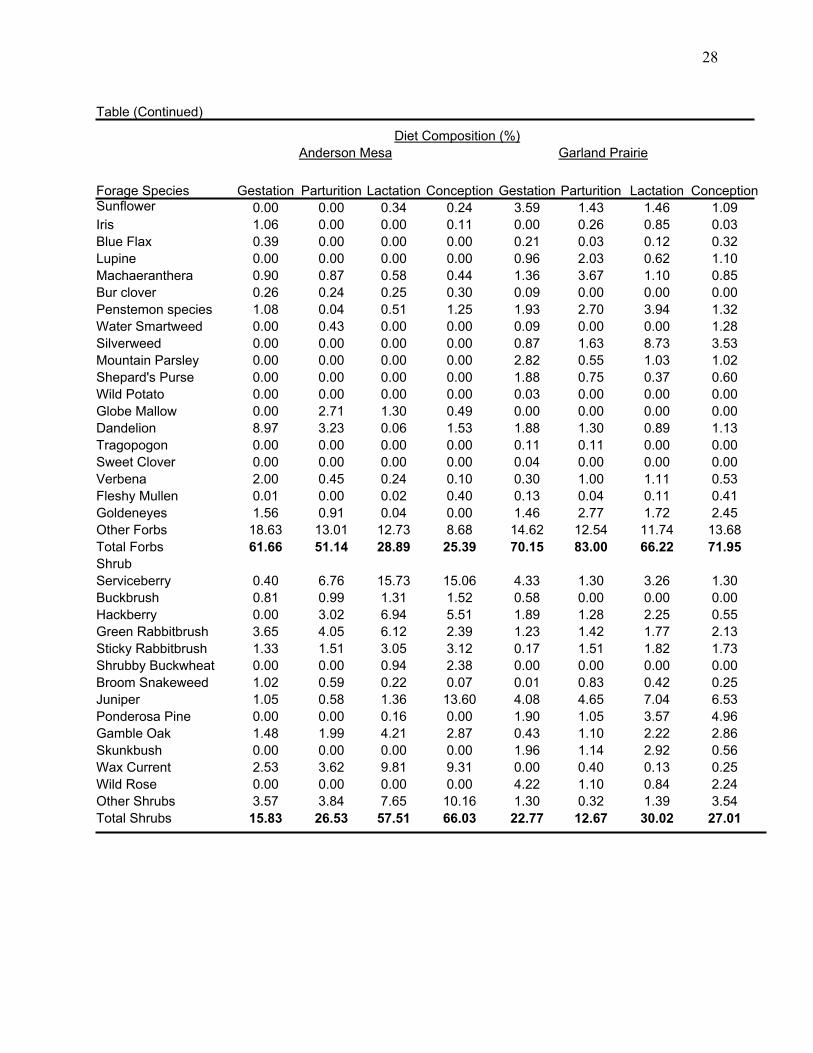
28
Table (Continued) Diet Composition (%) Anderson Mesa Garland Prairie Forage Species Gestation Parturition Lactation Conception Gestation Parturition Lactation ConceptionSunflower 0.00 0.00 0.34 0.24 3.59 1.43 1.46 1.09 Iris 1.06 0.00 0.00 0.11 0.00 0.26 0.85 0.03 Blue Flax 0.39 0.00 0.00 0.00 0.21 0.03 0.12 0.32 Lupine 0.00 0.00 0.00 0.00 0.96 2.03 0.62 1.10 Machaeranthera 0.90 0.87 0.58 0.44 1.36 3.67 1.10 0.85 Bur clover 0.26 0.24 0.25 0.30 0.09 0.00 0.00 0.00 Penstemon species 1.08 0.04 0.51 1.25 1.93 2.70 3.94 1.32 Water Smartweed 0.00 0.43 0.00 0.00 0.09 0.00 0.00 1.28 Silverweed 0.00 0.00 0.00 0.00 0.87 1.63 8.73 3.53 Mountain Parsley 0.00 0.00 0.00 0.00 2.82 0.55 1.03 1.02 Shepard's Purse 0.00 0.00 0.00 0.00 1.88 0.75 0.37 0.60 Wild Potato 0.00 0.00 0.00 0.00 0.03 0.00 0.00 0.00 Globe Mallow 0.00 2.71 1.30 0.49 0.00 0.00 0.00 0.00 Dandelion 8.97 3.23 0.06 1.53 1.88 1.30 0.89 1.13 Tragopogon 0.00 0.00 0.00 0.00 0.11 0.11 0.00 0.00 Sweet Clover 0.00 0.00 0.00 0.00 0.04 0.00 0.00 0.00 Verbena 2.00 0.45 0.24 0.10 0.30 1.00 1.11 0.53 Fleshy Mullen 0.01 0.00 0.02 0.40 0.13 0.04 0.11 0.41 Goldeneyes 1.56 0.91 0.04 0.00 1.46 2.77 1.72 2.45 Other Forbs 18.63 13.01 12.73 8.68 14.62 12.54 11.74 13.68 Total Forbs 61.66 51.14 28.89 25.39 70.15 83.00 66.22 71.95 Shrub Serviceberry 0.40 6.76 15.73 15.06 4.33 1.30 3.26 1.30 Buckbrush 0.81 0.99 1.31 1.52 0.58 0.00 0.00 0.00 Hackberry 0.00 3.02 6.94 5.51 1.89 1.28 2.25 0.55 Green Rabbitbrush 3.65 4.05 6.12 2.39 1.23 1.42 1.77 2.13 Sticky Rabbitbrush 1.33 1.51 3.05 3.12 0.17 1.51 1.82 1.73 Shrubby Buckwheat 0.00 0.00 0.94 2.38 0.00 0.00 0.00 0.00 Broom Snakeweed 1.02 0.59 0.22 0.07 0.01 0.83 0.42 0.25 Juniper 1.05 0.58 1.36 13.60 4.08 4.65 7.04 6.53 Ponderosa Pine 0.00 0.00 0.16 0.00 1.90 1.05 3.57 4.96 Gamble Oak 1.48 1.99 4.21 2.87 0.43 1.10 2.22 2.86 Skunkbush 0.00 0.00 0.00 0.00 1.96 1.14 2.92 0.56 Wax Current 2.53 3.62 9.81 9.31 0.00 0.40 0.13 0.25 Wild Rose 0.00 0.00 0.00 0.00 4.22 1.10 0.84 2.24 Other Shrubs 3.57 3.84 7.65 10.16 1.30 0.32 1.39 3.54 Total Shrubs 15.83 26.53 57.51 66.03 22.77 12.67 30.02 27.01
29
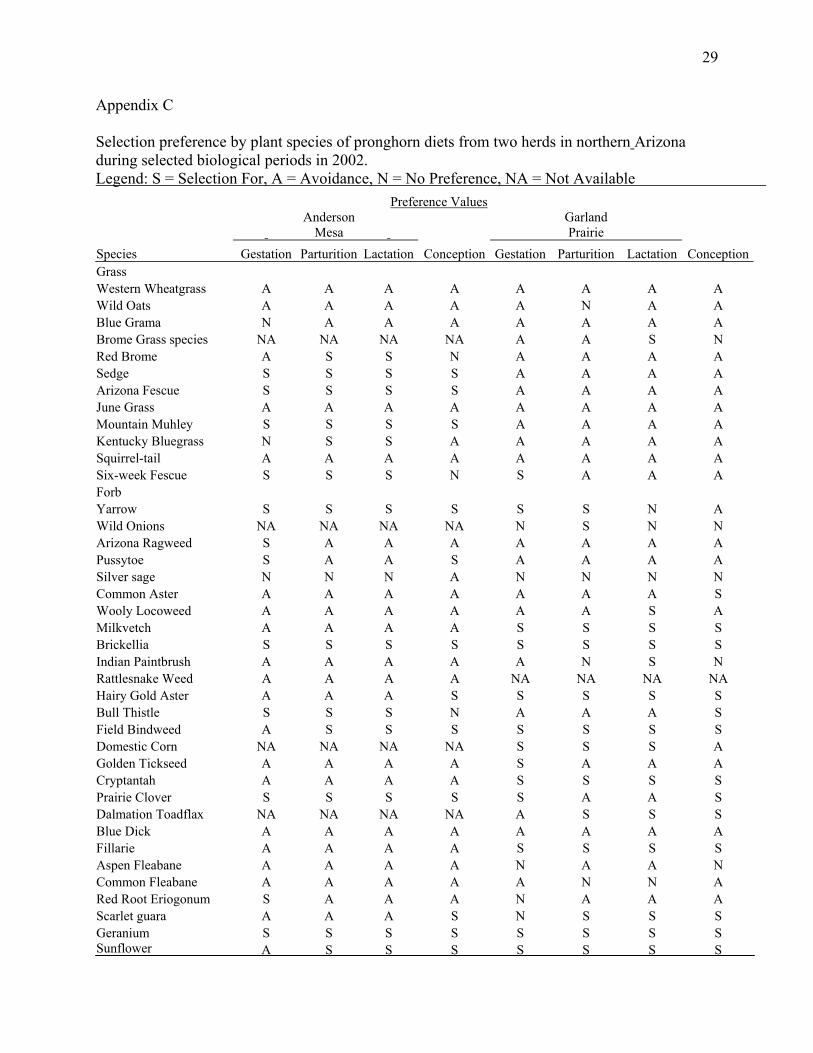
Appendix C
Selection preference by plant species of pronghorn diets from two herds in northern Arizona during selected biological periods in 2002. Legend: S = Selection For, A = Avoidance, N = No Preference, NA = Not Available Preference Values
Anderson
Mesa Garland Prairie
Species Gestation Parturition Lactation Conception Gestation Parturition Lactation ConceptionGrass Western Wheatgrass A A A A A A A A Wild Oats A A A A A N A A Blue Grama N A A A A A A A Brome Grass species NA NA NA NA A A S N Red Brome A S S N A A A A Sedge S S S S A A A A Arizona Fescue S S S S A A A A June Grass A A A A A A A A Mountain Muhley S S S S A A A A Kentucky Bluegrass N S S A A A A A Squirrel-tail A A A A A A A A Six-week Fescue S S S N S A A A Forb Yarrow S S S S S S N A Wild Onions NA NA NA NA N S N N Arizona Ragweed S A A A A A A A Pussytoe S A A S A A A A Silver sage N N N A N N N N Common Aster A A A A A A A S Wooly Locoweed A A A A A A S A Milkvetch A A A A S S S S Brickellia S S S S S S S S Indian Paintbrush A A A A A N S N Rattlesnake Weed A A A A NA NA NA NA Hairy Gold Aster A A A S S S S S Bull Thistle S S S N A A A S Field Bindweed A S S S S S S S Domestic Corn NA NA NA NA S S S A Golden Tickseed A A A A S A A A Cryptantah A A A A S S S S Prairie Clover S S S S S A A S Dalmation Toadflax NA NA NA NA A S S S Blue Dick A A A A A A A A Fillarie A A A A S S S S Aspen Fleabane A A A A N A A N Common Fleabane A A A A A N N A Red Root Eriogonum S A A A N A A A Scarlet guara A A A S N S S S Geranium S S S S S S S S Sunflower A S S S S S S S
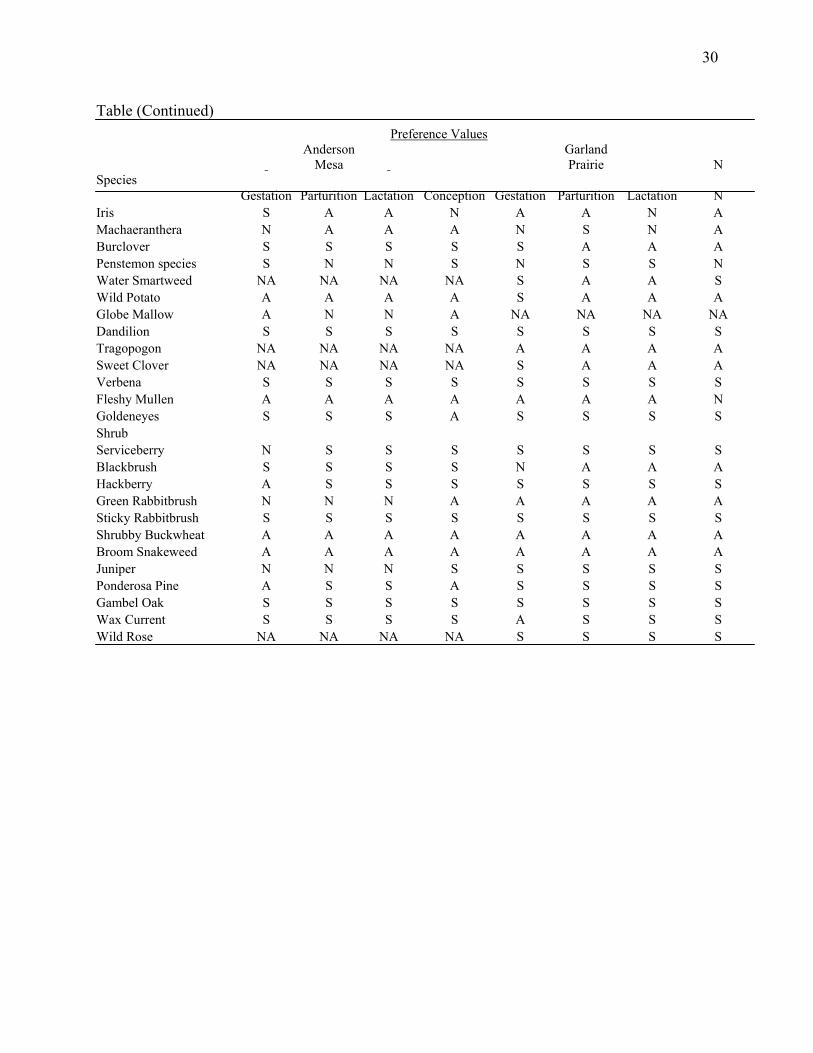
30
Table (Continued) Preference Values
Anderson
Mesa Garland Prairie N
Species Gestation Parturition Lactation Conception Gestation Parturition Lactation N
Iris S A A N A A N A Machaeranthera N A A A N S N A Burclover S S S S S A A A Penstemon species S N N S N S S N Water Smartweed NA NA NA NA S A A S Wild Potato A A A A S A A A Globe Mallow A N N A NA NA NA NA Dandilion S S S S S S S S Tragopogon NA NA NA NA A A A A Sweet Clover NA NA NA NA S A A A Verbena S S S S S S S S Fleshy Mullen A A A A A A A N Goldeneyes S S S A S S S S Shrub Serviceberry N S S S S S S S Blackbrush S S S S N A A A Hackberry A S S S S S S S Green Rabbitbrush N N N A A A A A Sticky Rabbitbrush S S S S S S S S Shrubby Buckwheat A A A A A A A A Broom Snakeweed A A A A A A A A Juniper N N N S S S S S Ponderosa Pine A S S A S S S S Gambel Oak S S S S S S S S Wax Current S S S S A S S S Wild Rose NA NA NA NA S S S S