nursing homes support scheme trends and figuresbudget.gov.ie/budgets/2018/documents/7.nursing... ·...
TRANSCRIPT
Staff paper 2017
Nursing Homes Support Scheme
Trends and Figures
October, 2017
Judith Meirmans
Health Vote
Department of Public Expenditure and Reform
This paper has been prepared by IGEES staff in the Department of Public Expenditure & Reform. The views presented in this paper are those of the author alone and do not represent the official views of the Department of Public Expenditure and Reform or the Minister for Public Expenditure and Reform.

NHSS: Trends and Figures
1
NHSS: Trends and Figures
2
October, 2017
Key observations
The number of clients supported under the Nursing Homes Support Scheme has been increasing
moderately since 2012, with a 5.1% increase over the four years up to 2016.
The largest increase in NHSS client numbers has occurred in the private sector.
From 2014 to 2016, the number of NHSS clients in private nursing homes has been increasing,
while the same figure for public nursing homes shows a small decrease.
Since the end of 2014, the National Placement List has been reduced from a peak of over 2,000
in 2014 to an average of 464 in 2014.
However, the number of approved clients that are not yet supported by the scheme has been
increasing and seems to move opposite to the National Placement List. Currently there is no
data available on the reasons why approved clients are not in payment, or the length of the
period between approval and moving into a nursing home.
Total expenditure on the scheme has increased from €1.17bn in 2014 to €1.26bn in 2016.
However, from 2014 to 2016 individual contributions to nursing homes have been increasing
more than the State’s funding, indicating higher levels of income in the elderly cohort.
Since 2014, the average per-client costs of care have been increasing more rapidly in public
nursing homes than in private ones, widening the already existing gap.
In the first six months of 2017, there are slightly fewer people receiving support than in the
same period in 2016.
Despite the above, both the exchequer expenditure and client contributions are above the
levels in the same period in the previous year.
Beyond demographics there are different sources of cost pressures on the exchequer funding
going forward.
NHSS: Trends and Figures
3
1 Introduction
The Nursing Homes Support Scheme (NHSS) was introduced in 2009 with the aim of providing access
to long-term residential care for all who are deemed to be in need. The introduction of the scheme
has proven to be successful: despite a growing elderly population, no large increases in demand have
materialised. To date the scheme has proven to be financially sustainable, which is of major
importance for the functioning of the scheme going forward.
Under the NHSS clients that are assessed to be in need of residential nursing care can avail of support
from the State to meet the costs of care. The level of the State support depends on the level of the
applicant’s income and assets with the State paying the balance of the costs. Clients always get to
retain 20% of their income, or 20% of the maximum weekly State Pension, whichever is the greater.
Applicants for whom the level of their own statutory contribution is assessed to be higher than the
actual costs of care are not eligible for the scheme.
Over time the scheme has remained remarkably unchanged. Some minor amendments have been
enacted, mostly regarding the application process. The only major amendment has been the Health
(Amendment) Act 2013, which increased the percentage at which assets are included in the income
assessment from 5 to 7.5%.
The aim of this paper is to reflect some of the historic trends in demand for and funding of the scheme,
to inform decision makers and ultimately contribute to the scheme’s sustainability going forward. The
analysis therefore includes all years for which data is available.
The remainder of this paper is structured as follows. The second chapter discusses the historic trends
in the uptake of the scheme. Chapter 3 continues with historic trends in funding of the scheme.
Chapter 4 examines the developments in the first half of 2017 in both uptake and expenditure.
Chapter 5 looks further into the challenges that might arise for the sustainability of scheme going
forward. Chapter 6 concludes.
NHSS: Trends and Figures
4
2 Trends in demand
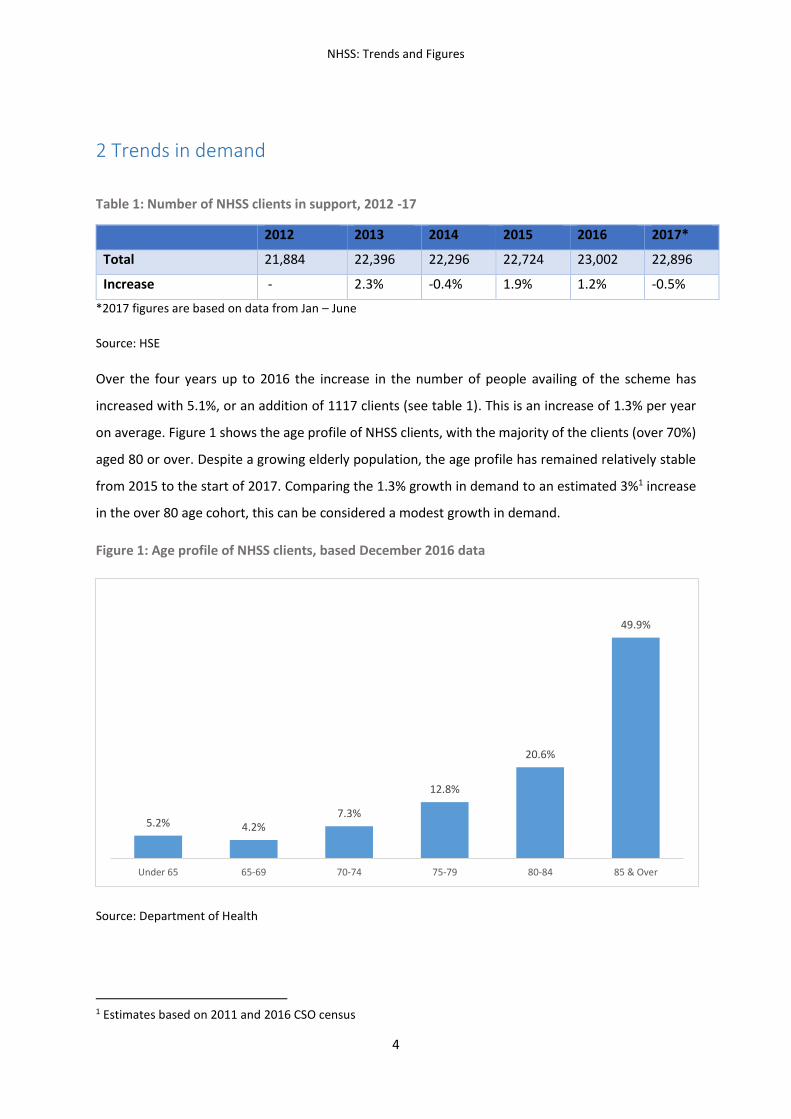
Table 1: Number of NHSS clients in support, 2012 -17
2012 2013 2014 2015 2016 2017*
Total 21,884 22,396 22,296 22,724 23,002 22,896
Increase - 2.3% -0.4% 1.9% 1.2% -0.5%
*2017 figures are based on data from Jan – June
Source: HSE
Over the four years up to 2016 the increase in the number of people availing of the scheme has
increased with 5.1%, or an addition of 1117 clients (see table 1). This is an increase of 1.3% per year
on average. Figure 1 shows the age profile of NHSS clients, with the majority of the clients (over 70%)
aged 80 or over. Despite a growing elderly population, the age profile has remained relatively stable
from 2015 to the start of 2017. Comparing the 1.3% growth in demand to an estimated 3%1 increase
in the over 80 age cohort, this can be considered a modest growth in demand.
Figure 1: Age profile of NHSS clients, based December 2016 data
Source: Department of Health
1 Estimates based on 2011 and 2016 CSO census
5.2% 4.2%7.3%
12.8%
20.6%
49.9%
Under 65 65-69 70-74 75-79 80-84 85 & Over
NHSS: Trends and Figures
5
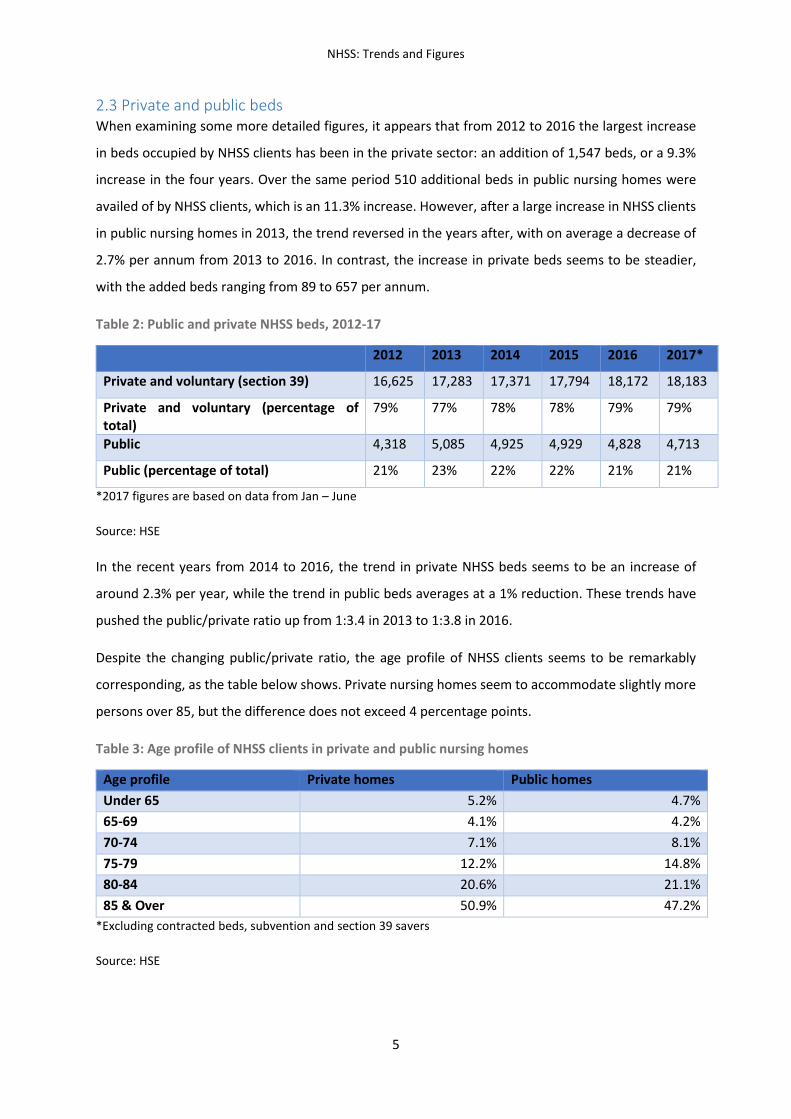
2.3 Private and public beds When examining some more detailed figures, it appears that from 2012 to 2016 the largest increase
in beds occupied by NHSS clients has been in the private sector: an addition of 1,547 beds, or a 9.3%
increase in the four years. Over the same period 510 additional beds in public nursing homes were
availed of by NHSS clients, which is an 11.3% increase. However, after a large increase in NHSS clients
in public nursing homes in 2013, the trend reversed in the years after, with on average a decrease of
2.7% per annum from 2013 to 2016. In contrast, the increase in private beds seems to be steadier,
with the added beds ranging from 89 to 657 per annum.
Table 2: Public and private NHSS beds, 2012-17
2012 2013 2014 2015 2016 2017*
Private and voluntary (section 39) 16,625 17,283 17,371 17,794 18,172 18,183
Private and voluntary (percentage of total)
79% 77% 78% 78% 79% 79%
Public 4,318 5,085 4,925 4,929 4,828 4,713
Public (percentage of total) 21% 23% 22% 22% 21% 21%
*2017 figures are based on data from Jan – June
Source: HSE
In the recent years from 2014 to 2016, the trend in private NHSS beds seems to be an increase of
around 2.3% per year, while the trend in public beds averages at a 1% reduction. These trends have
pushed the public/private ratio up from 1:3.4 in 2013 to 1:3.8 in 2016.
Despite the changing public/private ratio, the age profile of NHSS clients seems to be remarkably
corresponding, as the table below shows. Private nursing homes seem to accommodate slightly more
persons over 85, but the difference does not exceed 4 percentage points.
Table 3: Age profile of NHSS clients in private and public nursing homes
Age profile Private homes Public homes
Under 65 5.2% 4.7%
65-69 4.1% 4.2%
70-74 7.1% 8.1%
75-79 12.2% 14.8%
80-84 20.6% 21.1%
85 & Over 50.9% 47.2%
*Excluding contracted beds, subvention and section 39 savers
Source: HSE
NHSS: Trends and Figures
6
The above trends imply that private nursing home beds play an increasing part in nursing home care
for NHSS clients. It is a question, however, how long this trend can continue. As long as private nursing
homes are in the position to reject clients who they regard to be too complex there is a need to have
a certain percentage public beds available for people with complex, i.e. expensive, needs. With no
data available on the number of patients to whom this may apply it is difficult to estimate what the
minimum percentage public beds of the total NHSS beds should be.
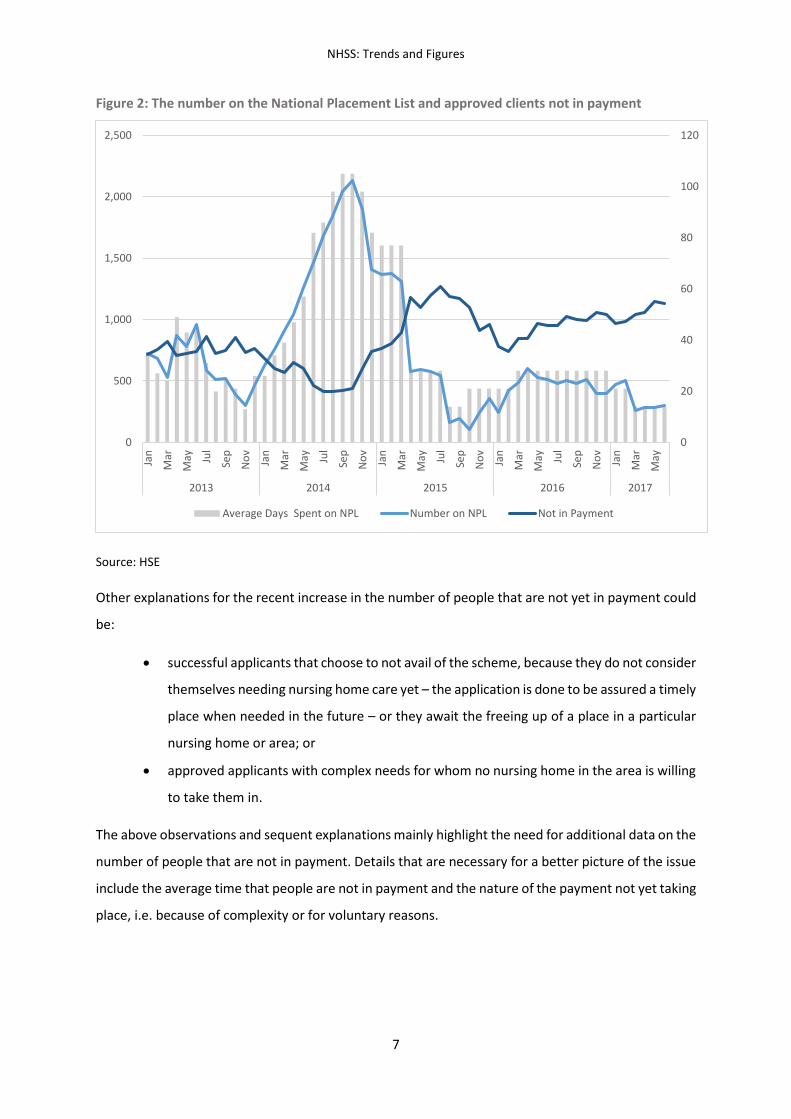
2.4 National waiting list/clients not in payment After a spike in the number of people on the National Placement List (NPL) in 2014 of over 2,000, the
waiting list has reduced to an average of 464 in 2016. This major reduction is mainly due to
administrative improvements within the HSE division responsible for NHSS procedures. This has
brought the average days spend on the NPL down from more than two months in 2014, to less than a
month in 2016. It is Government policy to keep the average waiting time below four weeks.
However, the NPL is not the only figure that is important to consider when looking at waiting times. A
second important measure is the number of people that have been approved for funding, but are not
yet in an NHSS contract. This number increased from just over 550 in 2014, to over 930 in 2016.
Figure 2 shows that the number of approved clients that are not in payment tends to move opposite
to the number on the NPL. A plausible explanation for this is that decreases in the NPL translate into
a temporary increase in the number of people that have to be placed in a particular point in time. The
additional places needed do not become available at the pace in which the backlog in NPL applications
are processed, resulting in an increasing number of people that are approved but not yet placed. In
times where the number on the NPL is building up – indicating a lower processing rate – the pace in
which places become available exceeds the number of additional approved applications, and the
number of people that are approved but not in payment decreases as a result.
NHSS: Trends and Figures
7
Figure 2: The number on the National Placement List and approved clients not in payment
Source: HSE
Other explanations for the recent increase in the number of people that are not yet in payment could
be:
successful applicants that choose to not avail of the scheme, because they do not consider
themselves needing nursing home care yet – the application is done to be assured a timely
place when needed in the future – or they await the freeing up of a place in a particular
nursing home or area; or
approved applicants with complex needs for whom no nursing home in the area is willing
to take them in.
The above observations and sequent explanations mainly highlight the need for additional data on the
number of people that are not in payment. Details that are necessary for a better picture of the issue
include the average time that people are not in payment and the nature of the payment not yet taking
place, i.e. because of complexity or for voluntary reasons.
0
20
40
60
80
100
120
0
500
1,000
1,500
2,000
2,500Ja
n
Mar
May Ju
l
Sep
No
v
Jan
Mar
May Ju
l
Sep
No
v
Jan
Mar
May Ju
l
Sep
No
v
Jan
Mar
May Ju
l
Sep
No
v
Jan
Mar
May
2013 2014 2015 2016 2017
Average Days Spent on NPL Number on NPL Not in Payment

NHSS: Trends and Figures
8
3 Trends in expenditure
Total expenditure on care for NHSS clients in 2016 was €1.26bn, up from €1.17bn in 2014. This
expenditure is comprised of two components: the exchequer funding and clients’ personal
contributions. This is depicted in the figure below, where client personal contributions are further
broken down in contributions to private and public nursing homes, as the latter is a form of
appropriation in aid. Below both components of expenditure will be discussed separately.
Figure 3: Total expenditure on NHSS, 2014-16
Source: HSE
3.1 Exchequer expenditure Exchequer expenditure increased from €887m in 2013, to €921 in 2017. This is an additional €34m
(3.8%) over three years, or a modest increase of €11m (1.3%) per year on average. However, as
displayed in table 4, a decrease in funding in 2014 drags the average down. This temporary decrease
in numbers on the scheme was mainly due to administrative issues resulting in too few applications
being processed in time. From 2014 to 2016 the average increase has been 2.6% per annum.
The modest increases in funding can at least partly be explained by the low growth in client numbers
supported over the years. Another contributing factor could be income growth of the elderly cohort,
which would be reflected both in lower client uptake, as is observed, and higher client contributions.
The latter will be examined further in the next paragraph.
€876 €894 €921
€233 €252€272
€61€64
€65
€0
€200
€400
€600
€800
€1,000
€1,200
€1,400
2014 2015 2016
Mill
ion
s
Exchequer expenditure Private client contributions Public income
NHSS: Trends and Figures
9
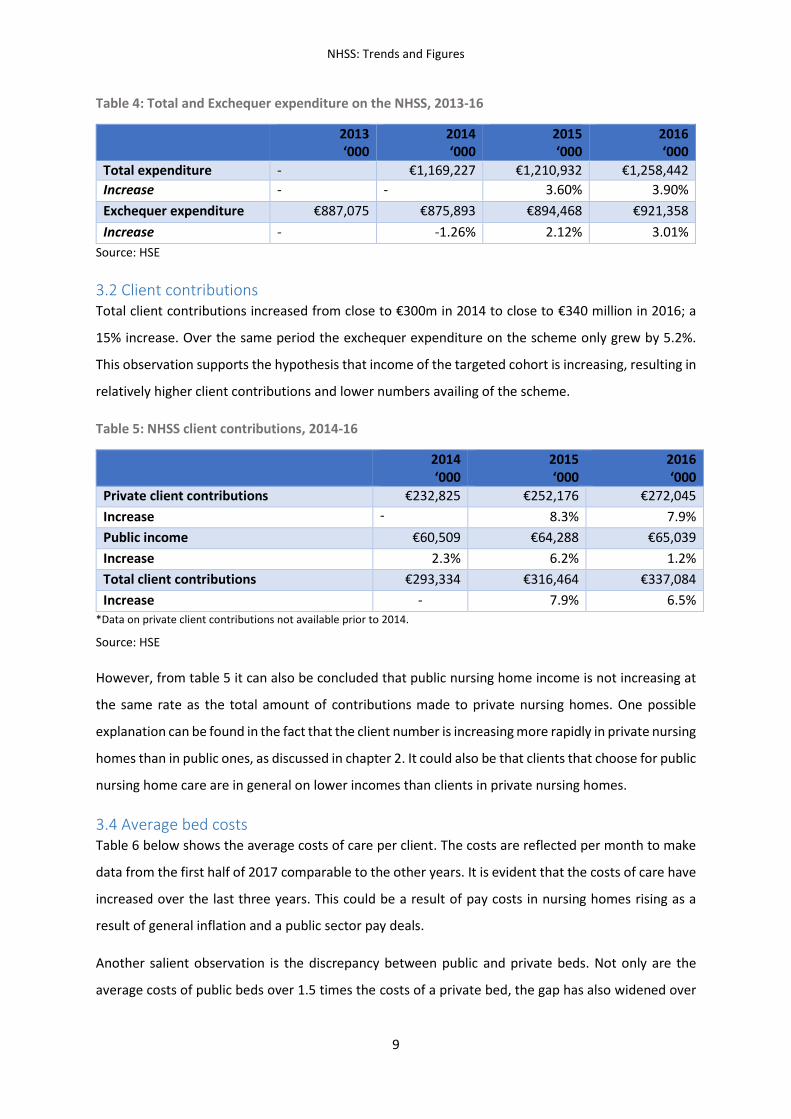
Table 4: Total and Exchequer expenditure on the NHSS, 2013-16
2013 ‘000
2014 ‘000
2015 ‘000
2016 ‘000
Total expenditure - €1,169,227 €1,210,932 €1,258,442
Increase - - 3.60% 3.90%
Exchequer expenditure €887,075 €875,893 €894,468 €921,358
Increase - -1.26% 2.12% 3.01%
Source: HSE
3.2 Client contributions Total client contributions increased from close to €300m in 2014 to close to €340 million in 2016; a
15% increase. Over the same period the exchequer expenditure on the scheme only grew by 5.2%.
This observation supports the hypothesis that income of the targeted cohort is increasing, resulting in
relatively higher client contributions and lower numbers availing of the scheme.
Table 5: NHSS client contributions, 2014-16
2014 ‘000
2015 ‘000
2016 ‘000
Private client contributions €232,825 €252,176 €272,045
Increase - 8.3% 7.9%
Public income €60,509 €64,288 €65,039
Increase 2.3% 6.2% 1.2%
Total client contributions €293,334 €316,464 €337,084
Increase - 7.9% 6.5%
*Data on private client contributions not available prior to 2014.
Source: HSE
However, from table 5 it can also be concluded that public nursing home income is not increasing at
the same rate as the total amount of contributions made to private nursing homes. One possible
explanation can be found in the fact that the client number is increasing more rapidly in private nursing
homes than in public ones, as discussed in chapter 2. It could also be that clients that choose for public
nursing home care are in general on lower incomes than clients in private nursing homes.
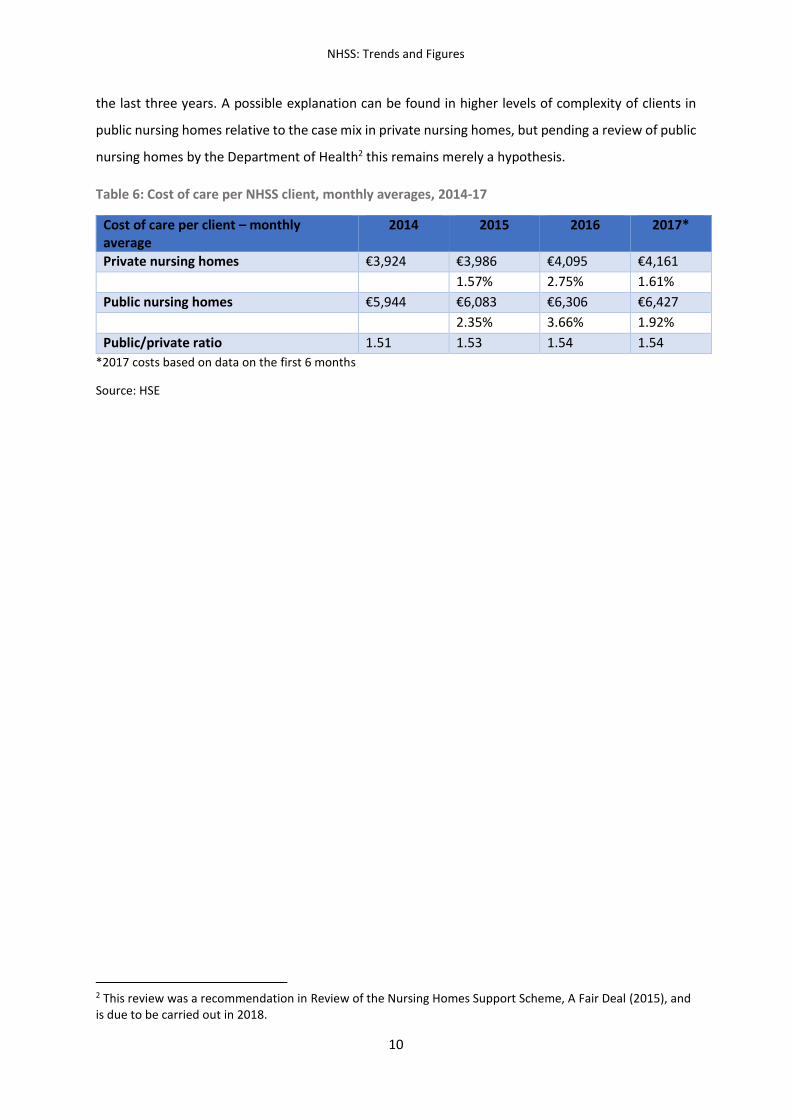
3.4 Average bed costs Table 6 below shows the average costs of care per client. The costs are reflected per month to make
data from the first half of 2017 comparable to the other years. It is evident that the costs of care have
increased over the last three years. This could be a result of pay costs in nursing homes rising as a
result of general inflation and a public sector pay deals.
Another salient observation is the discrepancy between public and private beds. Not only are the
average costs of public beds over 1.5 times the costs of a private bed, the gap has also widened over
NHSS: Trends and Figures
10
the last three years. A possible explanation can be found in higher levels of complexity of clients in
public nursing homes relative to the case mix in private nursing homes, but pending a review of public
nursing homes by the Department of Health2 this remains merely a hypothesis.
Table 6: Cost of care per NHSS client, monthly averages, 2014-17
Cost of care per client – monthly average
2014 2015 2016 2017*
Private nursing homes €3,924 €3,986 €4,095 €4,161 1.57% 2.75% 1.61%
Public nursing homes €5,944 €6,083 €6,306 €6,427 2.35% 3.66% 1.92%
Public/private ratio 1.51 1.53 1.54 1.54
*2017 costs based on data on the first 6 months
Source: HSE
2 This review was a recommendation in Review of the Nursing Homes Support Scheme, A Fair Deal (2015), and is due to be carried out in 2018.
NHSS: Trends and Figures
11
4 Developments in 2017
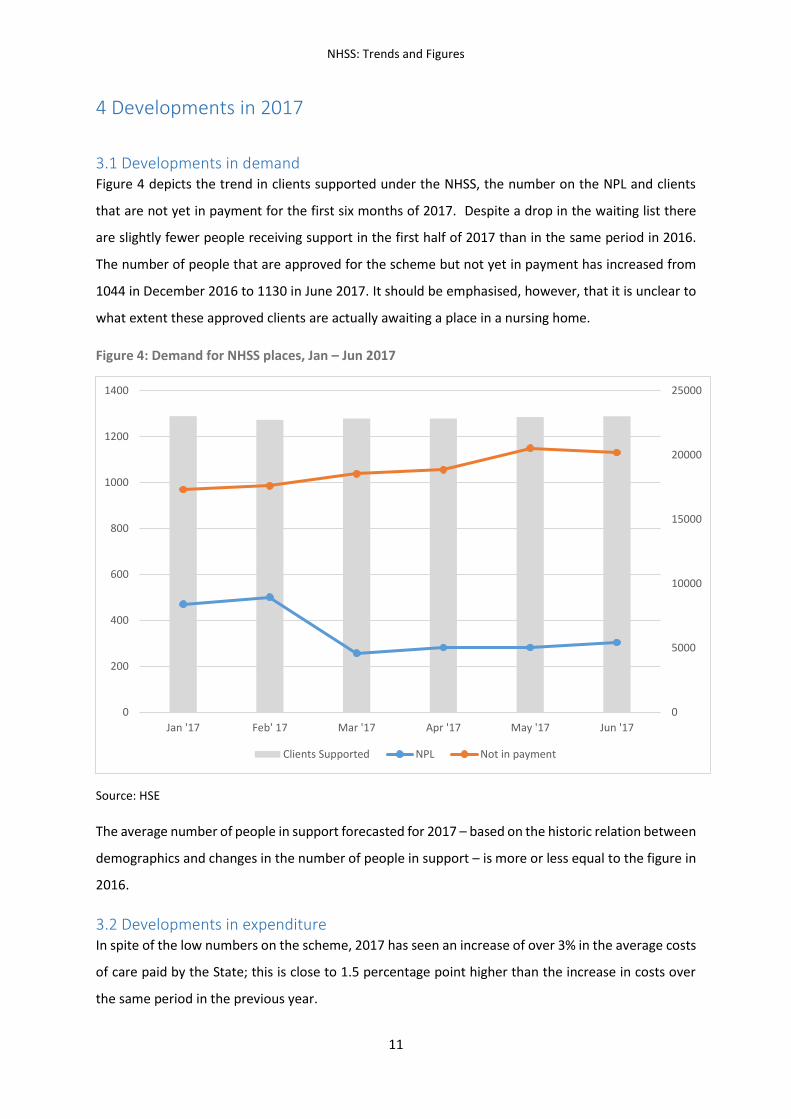
3.1 Developments in demand Figure 4 depicts the trend in clients supported under the NHSS, the number on the NPL and clients
that are not yet in payment for the first six months of 2017. Despite a drop in the waiting list there
are slightly fewer people receiving support in the first half of 2017 than in the same period in 2016.
The number of people that are approved for the scheme but not yet in payment has increased from
1044 in December 2016 to 1130 in June 2017. It should be emphasised, however, that it is unclear to
what extent these approved clients are actually awaiting a place in a nursing home.
Figure 4: Demand for NHSS places, Jan – Jun 2017
Source: HSE
The average number of people in support forecasted for 2017 – based on the historic relation between
demographics and changes in the number of people in support – is more or less equal to the figure in
2016.
3.2 Developments in expenditure In spite of the low numbers on the scheme, 2017 has seen an increase of over 3% in the average costs
of care paid by the State; this is close to 1.5 percentage point higher than the increase in costs over
the same period in the previous year.
0
5000
10000
15000
20000
25000
0
200
400
600
800
1000
1200
1400
Jan '17 Feb' 17 Mar '17 Apr '17 May '17 Jun '17
Clients Supported NPL Not in payment
NHSS: Trends and Figures
12
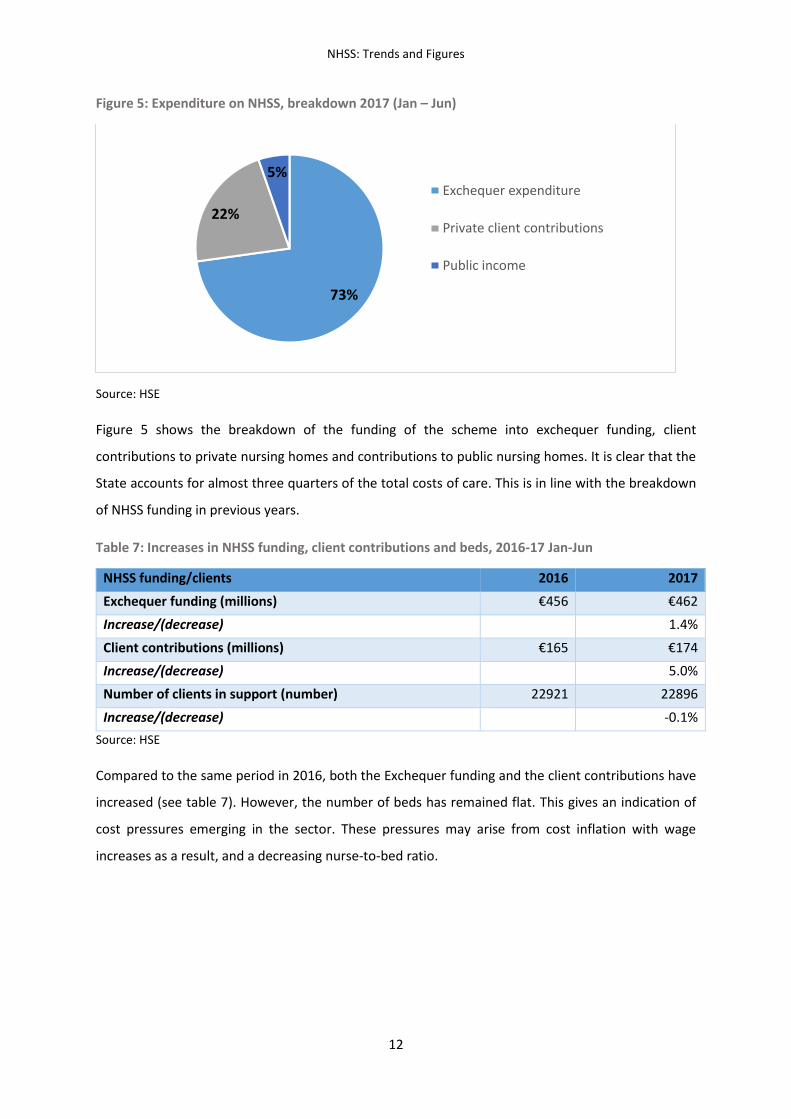
Figure 5: Expenditure on NHSS, breakdown 2017 (Jan – Jun)
Source: HSE
Figure 5 shows the breakdown of the funding of the scheme into exchequer funding, client
contributions to private nursing homes and contributions to public nursing homes. It is clear that the
State accounts for almost three quarters of the total costs of care. This is in line with the breakdown
of NHSS funding in previous years.
Table 7: Increases in NHSS funding, client contributions and beds, 2016-17 Jan-Jun
NHSS funding/clients 2016 2017
Exchequer funding (millions) €456 €462
Increase/(decrease)
1.4%
Client contributions (millions) €165 €174
Increase/(decrease)
5.0%
Number of clients in support (number) 22921 22896
Increase/(decrease)
-0.1%
Source: HSE
Compared to the same period in 2016, both the Exchequer funding and the client contributions have
increased (see table 7). However, the number of beds has remained flat. This gives an indication of
cost pressures emerging in the sector. These pressures may arise from cost inflation with wage
increases as a result, and a decreasing nurse-to-bed ratio.
73%
22%
5%Exchequer expenditure
Private client contributions
Public income

NHSS: Trends and Figures
13
4 The NHSS going forward
Projections based on continuation of the historic ratio between growth in the over 80 age cohort and
assumptions around income growth result in an average of just over 23,000 people in support under
the scheme in 2017. In 2018, the average number is forecasted to increase to approximately 23,040.
However, major cost pressures on exchequer funding could emerge from other sources. Costs in public
nursing homes are likely to continue to rise due to pay agreements – increasing the pay bill - and bed
closures forced by the Health Information and Quality Authority – increasing the per-bed costs. These
developments are putting upward pressure on the exchequer funding. And with the general economy
approaching full employment, recruitment in the private nursing home sector is becoming more
challenging, possible resulting in higher pay rates.
At the same time, there seems to be a trend of increasing individual contributions, which could be the
result of growing income in the elderly cohort. There is also a trend of increasing home care
availability. Over the period from 2014 to 2016 more than 3300 additional home care packages have
been assigned to clients. Further savings will be achieved as the number of legacy patients3 continues
to fall. However, with only a few hundred legacy patients left in the scheme, savings from this source
are likely to be moderate.
The table below summarises the discussed cost pressures that could be at work.
Table 8: Cost pressures on the NHSS exchequer funding
Upward cost pressures Downward cost pressures
Pay increases in public and private nursing homes
Growing elderly cohort
Increased quality standards for nursing homes
Growing income of the elderly cohort
Availability of home care supports
Decrease in ‘legacy’ patients
3 ‘Legacy’ patients are people in receipt of nursing care support before the NHSS commenced in 2009. The 2009 Act ruled that people receiving support from the State before its commencement could not be made off worse by the new scheme. Therefore, these legacy patients pay lower or no individual contributions towards their care, making them relatively expensive to the State.
NHSS: Trends and Figures
14
Concluding remarks
Historic trends in NHSS demand and funding both point at the sustainability of the NHSS. The scheme
has seen moderate increases in clients since 2012. The per-client costs have been increasing, but
within reasonable levels. Part of this increase is offset by clients paying more towards their own care.
As a result the exchequer bill has not been increasing beyond what is affordable.
However, there are upward cost pressures that are already affecting Exchequer expenditure in the
first half of 2017. If these cost pressures are to materialise further the funding requirements for the
scheme might increase substantially.
Furthermore, there are a number of developments within the scheme that might jeopardize its
sustainability going forward. These developments include:
The review of the price of care in private nursing homes negotiated by the NTPF that is due
to be carried out.
The maintenance of income contributions in line with the scheme.
The response to additional charges incurred by private nursing homes on NHSS clients.
For the scheme to stay financially sustainable it is important to keep track of ongoing trends in the
scheme and properly cost all changes that are being considered.