numerical study of jet plume instability from an overexpanded...
TRANSCRIPT

Numerical Study of Jet Plume Instability from an Overexpanded Nozzle
Q. Xiao * and H.M. Tsai † Temasek Laboratories, National University of Singapore Kent Ridge Crescent, SINGAPORE 119260
D. Papamoschou‡
University of California, Irvine, CA 92697-3975
The compressible jet plume from a planar overexpanded nozzle is investigated by solving the Reynolds-Averaged Navier-Stokes equations with several turbulence models. Computations are conducted for a series of exit-to-throat area ratios (Ae/At) from 1.0 to 1.8 and a range of nozzle pressure ratios (NPR) from 1.2 to 1.8. The results are compared with available experimental data in a nozzle of the same geometry. The asymmetric jet plume is well predicted by the simulation and is consistent with the experiments. Among the different turbulence models tested, the two-equation Shear Stress Model (SST) is found to agree closest to the experiments. The simulations are able to predict the velocity profiles, total pressure decay, and axial jet thickness distribution in the jet plume reasonably well. Jet mixing is governed by Ae/At and to a lesser extent by NPR. Increasing Ae/At results in a significant increase of mixing rate. Computations of turbulent kinetic energy (TKE) show that, with increasing Ae/At, the peak TKE in the plume rises and moves towards the nozzle exit. Significant increase of TKE inside the nozzle results from the asymmetric flow separation.
Nomenclature Ae = nozzle exit area At = nozzle throat area F = thrust Ht = throat height M = Mach number m = mass flux me = mass flux at nozzle exit NPR = nozzle pressure ratio = pres/ papa = ambient pressure pres = reservoir pressure pt = local total pressure Ta = ambient temperature Tres = reservoir temperature x = axial coordinate y = transverse coordinate δ = jet thickness
I. Introduction eparation in an over-expanded convergent-divergent (CD) nozzle produces an instability with potential applications in fluid mixing. In the past several years, a series of experimental investigations on the separated S
* Research Scientist, Temasek Laboratories, National University of Singapore, Kent Ridge Crescent, S119260. † Principal Research Scientist, Temasek Laboratories, National University of Singapore, Kent Ridge Crescent, S119260, Member AIAA. ‡ Professor, Department of Mechanical and Aerospace Engineering, 4200 Engineering Gateway, Irvine, CA 92696-3975, Associate Fellow AIAA.
American Institute of Aeronautics and Astronautics
1
45th AIAA Aerospace Sciences Meeting and Exhibit8 - 11 January 2007, Reno, Nevada
AIAA 2007-1319
Copyright © 2007 by the American Institute of Aeronautics and Astronautics, Inc. All rights reserved.
nozzle and plume jets exiting the nozzle have been conducted at University of California at Irvine (UCI).1-4,6-7 These include axisymmetric and planar nozzles. One interesting phenomenon was observed by Papamoschou and Zill4 for a supersonic 2D symmetric convergent-divergent nozzle. Their study shows that, for area ratio Ae/At ≥1.4 and nozzle pressure ratio NPR>1.4, the flow pattern is asymmetric, characterized by a lambda shock with one foot always larger than the other. This asymmetry does not flip during a given test run, but can change side from one run to the next. Later, the computational studies by Xiao et al.5 also demonstrated this asymmetric shock and separation inside the nozzle. More recently, the experimental investigations have been extended to the jet plume outside the nozzle by Papamoschou and Rossetti6 and Papamoschou and Johnson7. Their preliminary studies found that this asymmetric phenomenon extends to the downstream jet region and causes significant increase in the turbulence fluctuation levels. Jet growth rate increases rapidly with nozzle area ratio. Although 2D planar jet seems geometrically simple, many of the details and physical mechanisms involved are unclear, especially for the asymmetric jet plume exiting of the geometrically symmetric nozzle. The recent experimental studies by Papamoschou and Rossetti6 mentioned above have been directed to increasing the understanding of this phenomenon. However, more detailed computational and experimental studies are desirable for a comprehensive understanding of the instability mechanism associated with supersonic nozzle flow separation. To date, there have been few publications of numerical simulation of jets exiting an over-expanded planar nozzle. Most of the nozzle studies have concentrated on the nozzle internal flows and performance, such as the works by Carlson8, Hunter9, and Xiao et al.5 Different turbulence models, like two-equation k-ε turbulence model, k-ω model and non-linear algebraic Reynolds stress models, have been applied. In general, their computations are in good agreement with the available experimental data. The detailed investigation of fundamental flow mechanisms for a jet exiting an over-expanded convergent-divergent nozzle is less mature.
The accuracy of turbulent jet plume prediction depends significantly on the numerical method, specifically on the turbulence model.10-15 The effect of different turbulence models on the prediction of jet mixing has been investigated by several authors. Dembowski and Georgiadis10 conducted a numerical study for supersonic axisymmetric jet flow using two-equation SST and k-ε model with and without compressibility correction. Their results indicated that all these models do not predict supersonic nozzle flows accurately. Compressibility correction can improve the solution. Many authors reported that the standard k-ε model fails to accurately predict the mean velocity profiles of turbulent axisymmetric jets (Thies and Tam11). Based on this, Thies and Tam11 and Tandra et al.12 developed a modified k-ε model that can be used to predict the mean properties of axisymmetric jet by including the compressibility correction. Georgiadis and Papamoschou13 investigated single and coaxial dual-stream jets using RANS with linear two-equation and nonlinear two-equation explicit algebraic stress turbulence modeling. Their comparison of computed mean flow field development with experiments shows that the standard SST model provides the overall best agreement with experimental data. Chenault and Beran15 conducted a numerical investigation of supersonic injection using second-order Reynolds-Stress turbulence model proposed by Zhang et al.14 as well as the k-ε model. Detailed comparison with experimental data showed that the Reynolds-stress model simulation results in physically consistent and accurate prediction for jet plume mean flow and turbulent quantities. However, the simulations with the k-ε model resulted in nonphysical and inconsistent turbulence prediction. In the present study, the turbulent, compressible jets issuing from nozzles with various areas ratios and pressure ratios are simulated numerically. The main objective is to make a systematic and extensive comparison of the numerical prediction on the velocity profile, axial decay of total pressure and axial jet thickness distribution with available experimental data. The computation is also able to provide more detailed flow-field information which is not easily obtained by experiments.
II. Computational Method The Reynolds-averaged Navier-Stokes (RANS) equations were solved using the commercial code FLUENT. Inviscid fluxes were calculated using second-order upwind scheme, while the viscous fluxes were evaluated using second-order central-difference scheme. A second-order implicit scheme was used for iterating the unsteady equations in pseudo-time to steady-state solution. The wall boundary layer was assumed to be turbulent, and a variety turbulent models, available in FLUENT, were tested. In the current computation, one one-equation model, three two-equation models and one Reynolds stress model were used. The one-equation model used here is the Spalart-Allmaras (SA) model. The SA model is designed specifically for aerospace applications involving wall-bounded flows and has been shown to give good results for boundary layers subjected to an adverse pressure gradient. The drawback of the SA model is its inability to
American Institute of Aeronautics and Astronautics
2
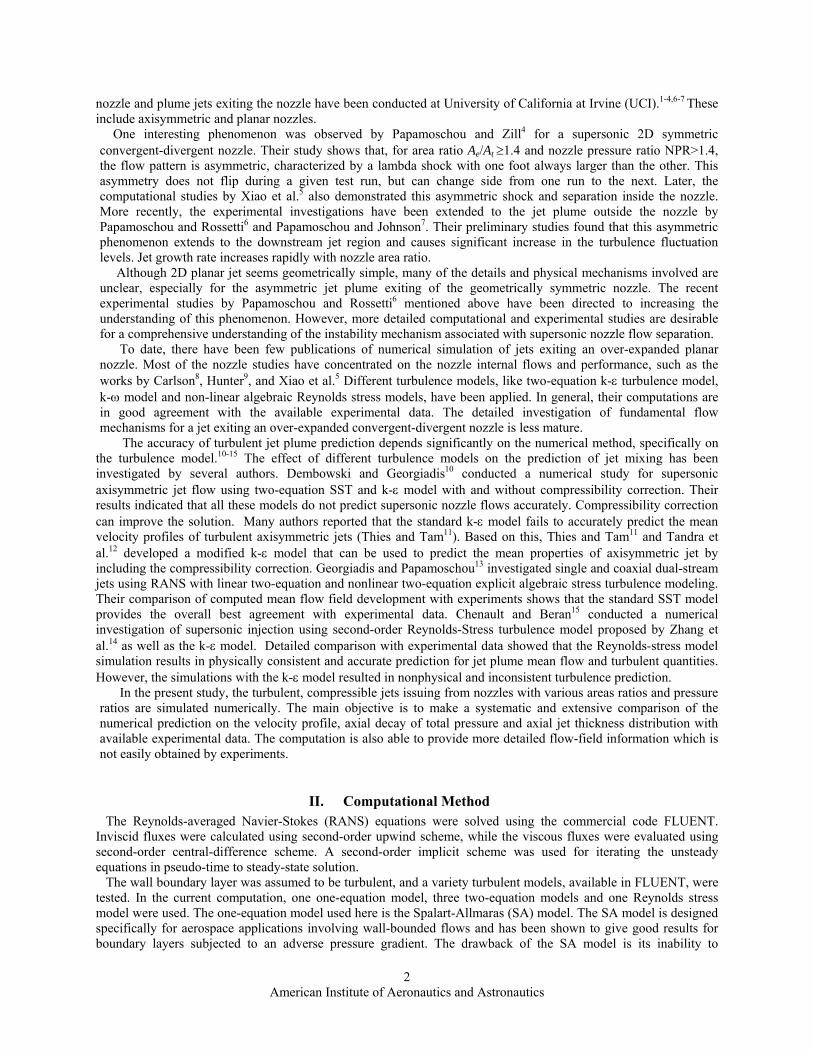
accurately simulate the abrupt flow change from a wall-bounded environment to a free shear layer environment. The two-equation models tested here were the Realizable k-ε model, Wilcox’s standard k-ω model and the shear stress transport (SST) model of Menter. The SST model employs a k-ω formulation in the inner region of wall boundary layers and switches to a transformed k-ε formulation in the outer region of boundary layers and in the free shear layer. Different from the above eddy-viscosity hypothesis turbulence models, the Reynolds stress model (RSM) closes the RANS equations by solving transport equations for the Reynolds stresses, together with an equation for the dissipation rate. The same case as the planar 2D convergent-divergent supersonic nozzle tested by Papamoschou and Zill4 was studied here. Computations are conducted and compared with the experimental data for Ae/At ranging from 1.0 to 1.8 and NPR ranging from 1.2 to 1.8 The computational domain included the domain inside the nozzle and an ambient region around the outer surface and downstream of the nozzle with 25 throat-heights downstream, 15 upstream and 10 normal to the jet axis. The computation was performed on a structured grid generated by a separated, in-house code as illustrated in Fig.1. There were a total about 74000 cells distributed among the aforementioned regions. Grid points were clustered near the walls of the nozzle to resolve the boundary layers, and at the exit of the nozzle to resolve the recirculation zone.
nozzle top wall
nozzle bottom wallnozzle exit
(a) (b) Fig.1 (a) Overall computational domain and mesh. For clarity, only every forth grid line is drawn in each direction. (b) close up view near nozzle exit.
x/Ht
p
0 2 4 6 8 100
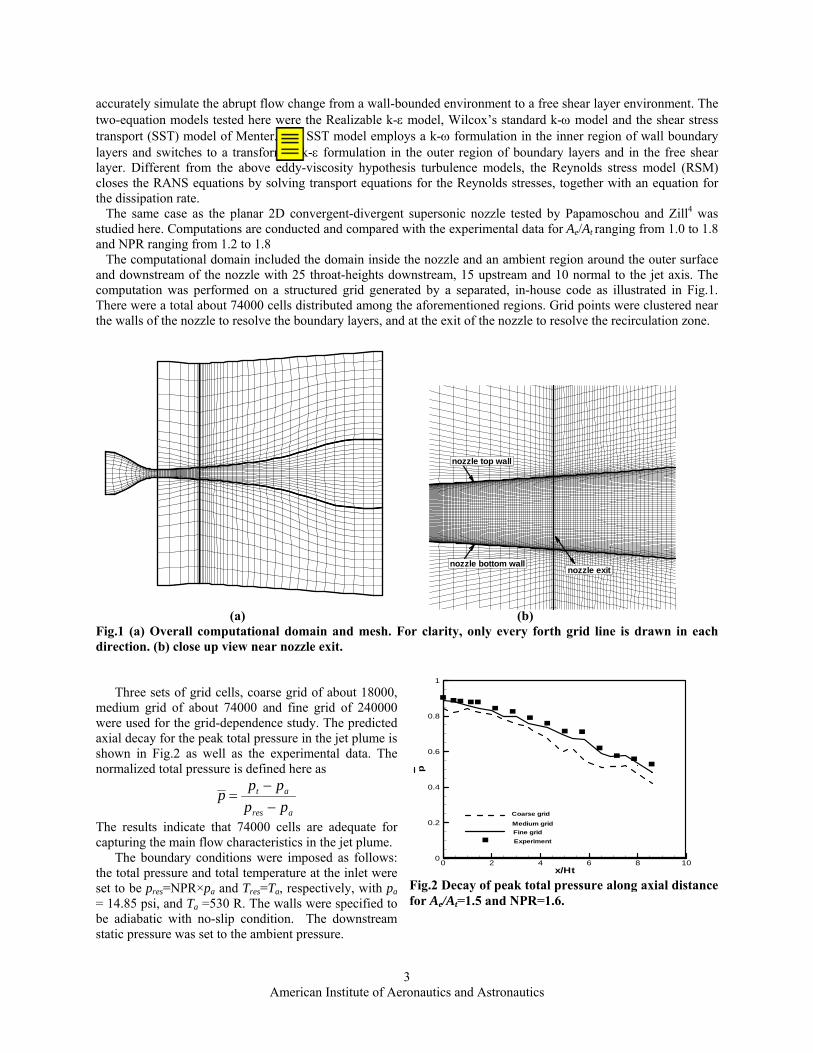
Three sets of grid cells, coarse grid of about 18000, medium grid of about 74000 and fine grid of 240000 were used for the grid-dependence study. The predicted axial decay for the peak total pressure in the jet plume is shown in Fig.2 as well as the experimental data. The normalized total pressure is defined here as
ares
at
ppppp
−−
=
0.2
0.4
0.6
0.8
1
Coarse grid
Medium gridFine gridExperiment
The results indicate that 74000 cells are adequate for capturing the main flow characteristics in the jet plume.
The boundary conditions were imposed as follows: the total pressure and total temperature at the inlet were set to be pres=NPR×pa and Tres=Ta, respectively, with pa = 14.85 psi, and Ta =530 R. The walls were specified to be adiabatic with no-slip condition. The downstream static pressure was set to the ambient pressure.
Fig.2 Decay of peak total pressure along axial distance for Ae/At=1.5 and NPR=1.6.
American Institute of Aeronautics and Astronautics
3
The computation was conducted with an unsteady method. However, the computed shock location inside the nozzle and monitored pressure at point of x/Ht=1.0 and y/Ht=0.5 show the flow to assume a steady state in contrast to the experiment where the flow is observed to show unsteadiness. This difference is not entirely clear but is consistent with our earlier computation of internal nozzle flow (Xiao et al.5). The unsteadiness observed in the experiment was found without resonant tone. It is possible that this unsteadiness is damped out by the numerical solution with the time averaged Reynolds equations. The CFL number ranged from 0.5 to 5 over a few thousand iterations. Convergence of the momentum equation typically required about 7,000 iterations to reduce the L2 norm of the residual by 2-3 orders of magnitude.
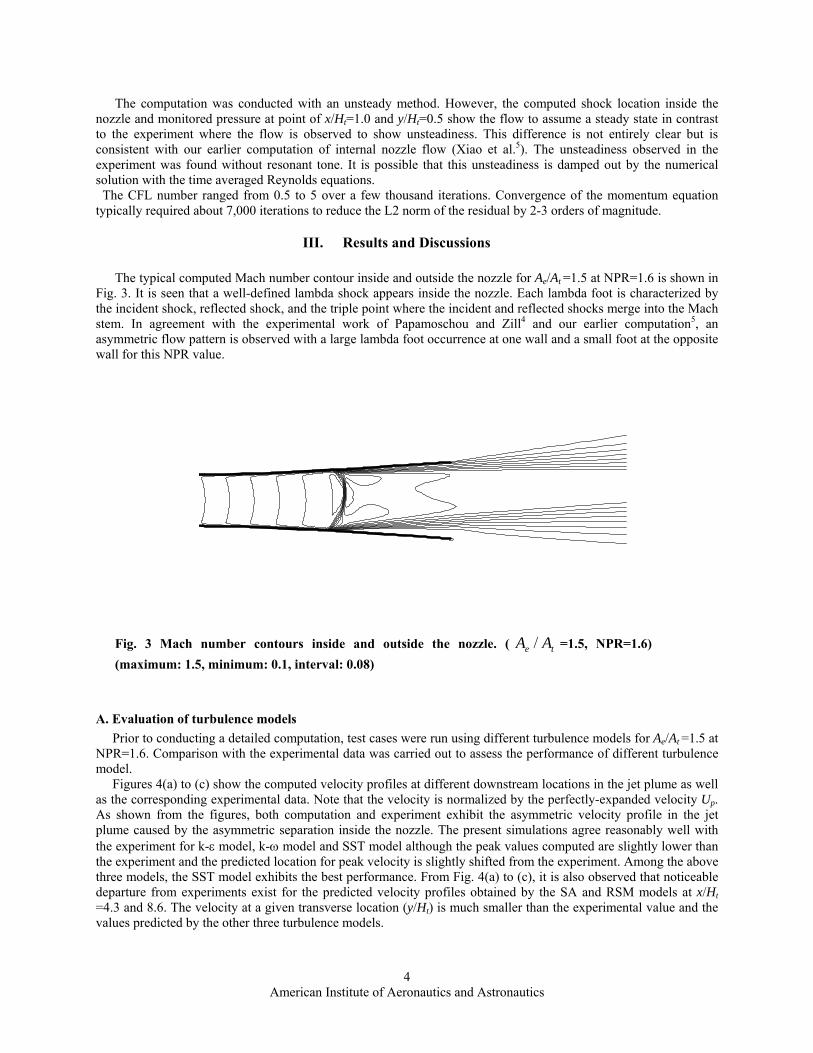
III. Results and Discussions The typical computed Mach number contour inside and outside the nozzle for Ae/At =1.5 at NPR=1.6 is shown in
Fig. 3. It is seen that a well-defined lambda shock appears inside the nozzle. Each lambda foot is characterized by the incident shock, reflected shock, and the triple point where the incident and reflected shocks merge into the Mach stem. In agreement with the experimental work of Papamoschou and Zill4 and our earlier computation5, an asymmetric flow pattern is observed with a large lambda foot occurrence at one wall and a small foot at the opposite wall for this NPR value.
Fig. 3 Mach number contours inside and outside the nozzle. ( =1.5, NPR=1.6) (maximum: 1.5, minimum: 0.1, interval: 0.08)
te AA /
A. Evaluation of turbulence models Prior to conducting a detailed computation, test cases were run using different turbulence models for Ae/At =1.5 at NPR=1.6. Comparison with the experimental data was carried out to assess the performance of different turbulence model. Figures 4(a) to (c) show the computed velocity profiles at different downstream locations in the jet plume as well as the corresponding experimental data. Note that the velocity is normalized by the perfectly-expanded velocity Up. As shown from the figures, both computation and experiment exhibit the asymmetric velocity profile in the jet plume caused by the asymmetric separation inside the nozzle. The present simulations agree reasonably well with the experiment for k-ε model, k-ω model and SST model although the peak values computed are slightly lower than the experiment and the predicted location for peak velocity is slightly shifted from the experiment. Among the above three models, the SST model exhibits the best performance. From Fig. 4(a) to (c), it is also observed that noticeable departure from experiments exist for the predicted velocity profiles obtained by the SA and RSM models at x/Ht =4.3 and 8.6. The velocity at a given transverse location (y/Ht) is much smaller than the experimental value and the values predicted by the other three turbulence models.
American Institute of Aeronautics and Astronautics
4
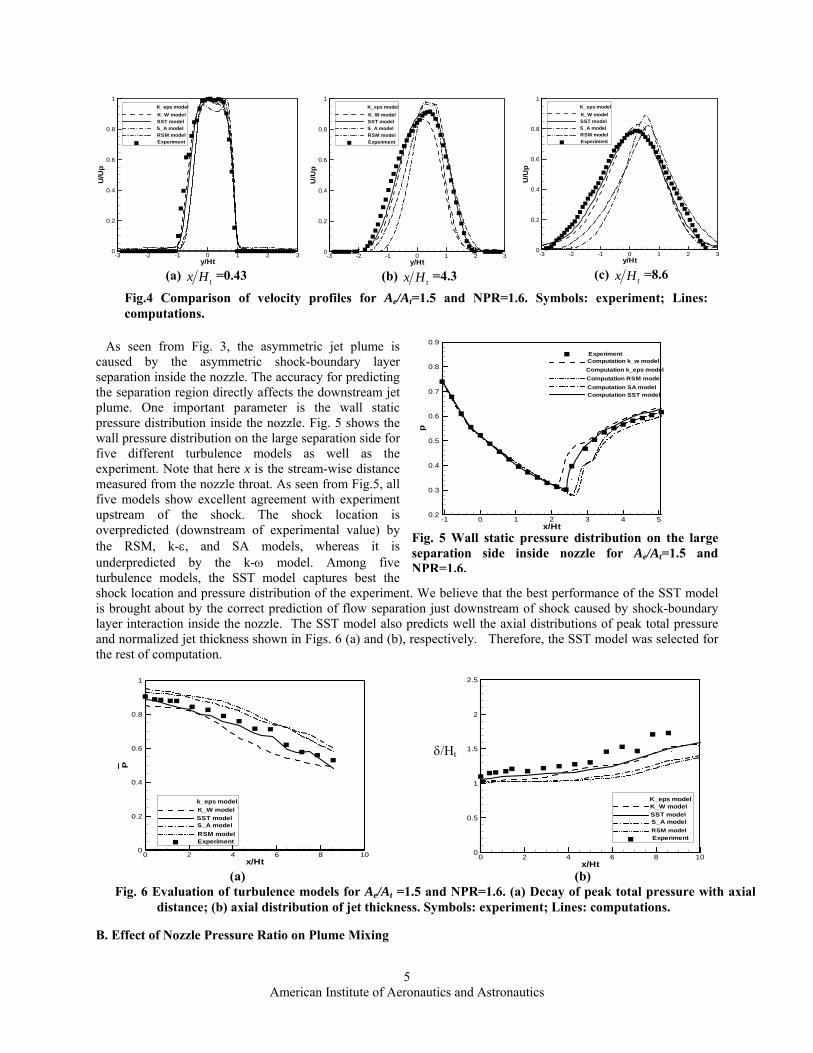
As seen from Fig. 3, the asymmetcaused by the asymmetric shock-separation inside the nozzle. The accurathe separation region directly affects thplume. One important parameter is pressure distribution inside the nozzle. wall pressure distribution on the large sfive different turbulence models aexperiment. Note that here x is the stremeasured from the nozzle throat. As sefive models show excellent agreementupstream of the shock. The shooverpredicted (downstream of experimthe RSM, k-ε, and SA models, underpredicted by the k-ω modeturbulence models, the SST model cshock location and pressure distributionis brought about by the correct predictilayer interaction inside the nozzle. Theand normalized jet thickness shown in Fthe rest of computation.
B. Effect of Nozzle Pressure Ratio on
x/Ht
P
0 2 4 60
0.2
0.4
0.6
0.8
1
Experiment
k_eps modelK_W modelSST modelS_A modelRSM model
(a) Fig. 6 Evaluation of turbulence m
distance; (b) axial distribu
Fig.4 Comparison of velocity computations.
y/Ht
U/U
p
-3 -2 -1 0 1 2 30
0.2
0.4
0.6
0.8
1
S_A modelRSM modelExperiment
K_eps modelK_W modelSST model
(c) Hx =8.6 tHx
Americ
y/Ht
U/U
p
-3 -2 -1 0 1 2 30
0.2
0.4
0.6
0.8
1
S_A modelRSM modelExperiment
K_eps modelK_W modelSST model
(b) Hx =4.3
y/HtU/U
p
-3 -2 -1 0 1 2 30
0.2
0.4
0.6
0.8
1
S_A modelRSM modelExperiment
K_eps modelK_W modelSST model
(a) =0.43
ric jet plume is boundary layer cy for predicting e downstream jet
the wall static Fig. 5 shows the eparation side for s well as the am-wise distance en from Fig.5, all with experiment ck location is ental value) by whereas it is
l. Among five aptures best the of the experiment.on of flow separati SST model also pigs. 6 (a) and (b), r
Plume Mixing
8 10
odels for Ae/At =1.
tion of jet thickness
profiles for Ae/At=1.5 and NPR=1.6. Symbols: experiment; Lines: tt
FsN
an Institute of Aero
5
x/Ht
p
-1 0 1 2 3 4 50.2
0.3
0.4
0.5
0.6
0.7
0.8
0.9
Experiment
Computation SST modelComputation SA modelComputation RSM modelComputation k_eps modelComputation k_w model
ig. 5 Wall static pressure distribution on the large eparation side inside nozzle for Ae/At=1.5 and PR=1.6.
We believe that the best performance of the SST model on just downstream of shock caused by shock-boundary redicts well the axial distributions of peak total pressure espectively. Therefore, the SST model was selected for
x/Ht0 2 4 6 8 100
0.5
1
1.5
2
2.5
ExperimentRSM modelS_A modelSST modelK_W modelK_eps model
(b)
5 and NPR=1.6. (a) Decay of peak total pressure with axial . Symbols: experiment; Lines: computations.
δ/Ht
nautics and Astronautics
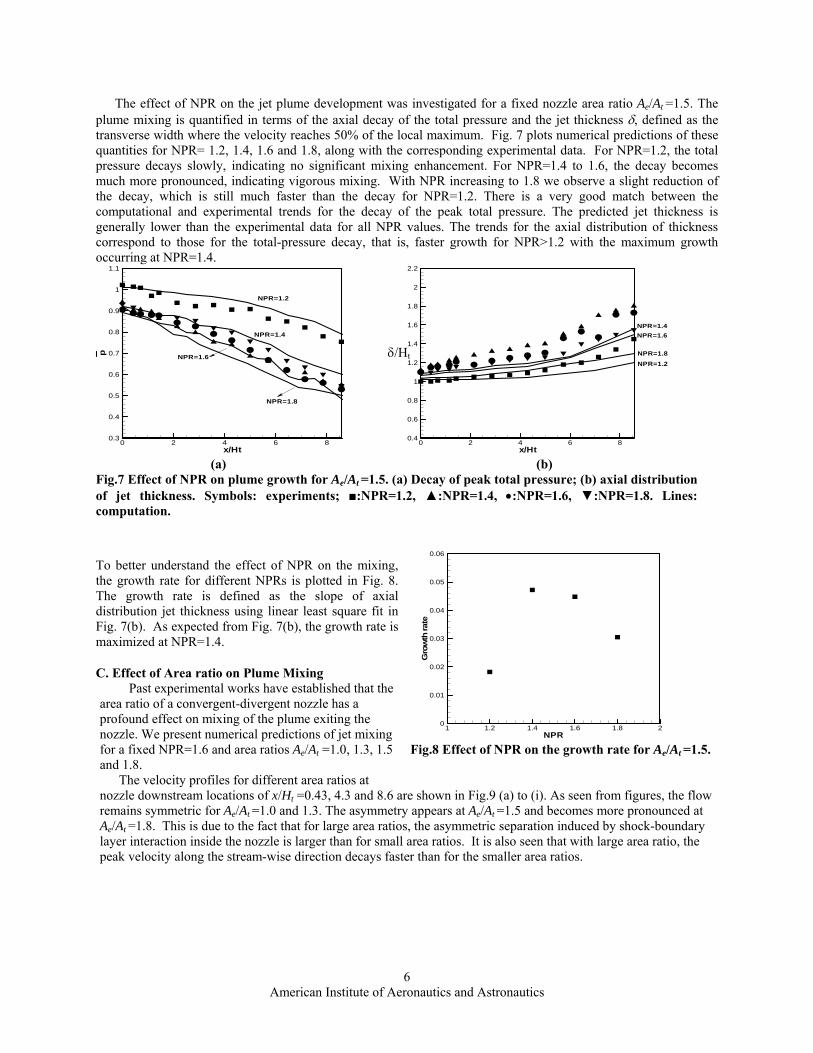
The effect of NPR on the jet plume development was investigated for a fixed nozzle area ratio Ae/At =1.5. The plume mixing is quantified in terms of the axial decay of the total pressure and the jet thickness δ, defined as the transverse width where the velocity reaches 50% of the local maximum. Fig. 7 plots numerical predictions of these quantities for NPR= 1.2, 1.4, 1.6 and 1.8, along with the corresponding experimental data. For NPR=1.2, the total pressure decays slowly, indicating no significant mixing enhancement. For NPR=1.4 to 1.6, the decay becomes much more pronounced, indicating vigorous mixing. With NPR increasing to 1.8 we observe a slight reduction of the decay, which is still much faster than the decay for NPR=1.2. There is a very good match between the computational and experimental trends for the decay of the peak total pressure. The predicted jet thickness is generally lower than the experimental data for all NPR values. The trends for the axial distribution of thickness correspond to those for the total-pressure decay, that is, faster growth for NPR>1.2 with the maximum growth occurring at NPR=1.4.
F o c
TtTdFm
C
x/Ht
p
0 2 4 6 80.3
0.4
0.5
0.6
0.7
0.8
0.9
1
1.1
NPR=1.2
NPR=1.4
NPR=1.8
NPR=1.6
x/Ht0 2 4 6 8
0.4
0.6
0.8
1
1.2
1.4
1.6
1.8
2
2.2
NPR=1.2NPR=1.8
NPR=1.6NPR=1.4
δ/Ht
(a) (b)
ig.7 Effect of NPR on plume growth for Ae/At =1.5. (a) Decay of peak total pressure; (b) axial distributionf jet thickness. Symbols: experiments; ■:NPR=1.2, ▲:NPR=1.4, •:NPR=1.6, ▼:NPR=1.8. Lines:omputation.
o better understand the effect of NPR on the mixing, he growth rate for different NPRs is plotted in Fig. 8. he growth rate is defined as the slope of axial istribution jet thickness using linear least square fit in ig. 7(b). As expected from Fig. 7(b), the growth rate is aximized at NPR=1.4.
. Effect of Area ratio on Plume Mixing Past experimental works have established that the
area ratio of a convergent-divergent nozzle has a profound effect on mixing of the plume exiting the nozzle. We present numerical predictions of jet mixing for a fixed NPR=1.6 and area ratios Ae/At =1.0, 1.3, 1.5 and 1.8.
The velocity profiles for different area ratios at nozzle downstream locations of x/Ht =0.43, 4.3 and 8.6 are shown in Fig.9 (a) to (i). As seen from figures, the flow remains symmetric for Ae/At =1.0 and 1.3. The asymmetry appears at Ae/At =1.5 and becomes more pronounced at Ae/At =1.8. This is due to the fact that for large area ratios, the asymmetric separation induced by shock-boundary layer interaction inside the nozzle is larger than for small area ratios. It is also seen that with large area ratio, the peak velocity along the stream-wise direction decays faster than for the smaller area ratios.
NPR
Gro
wth
rate
1 1.2 1.4 1.6 1.8 20
0.01
0.02
0.03
0.04
0.05
0.06
Fig.8 Effect of NPR on the growth rate for Ae/At =1.5.
American Institute of Aeronautics and Astronautics
6
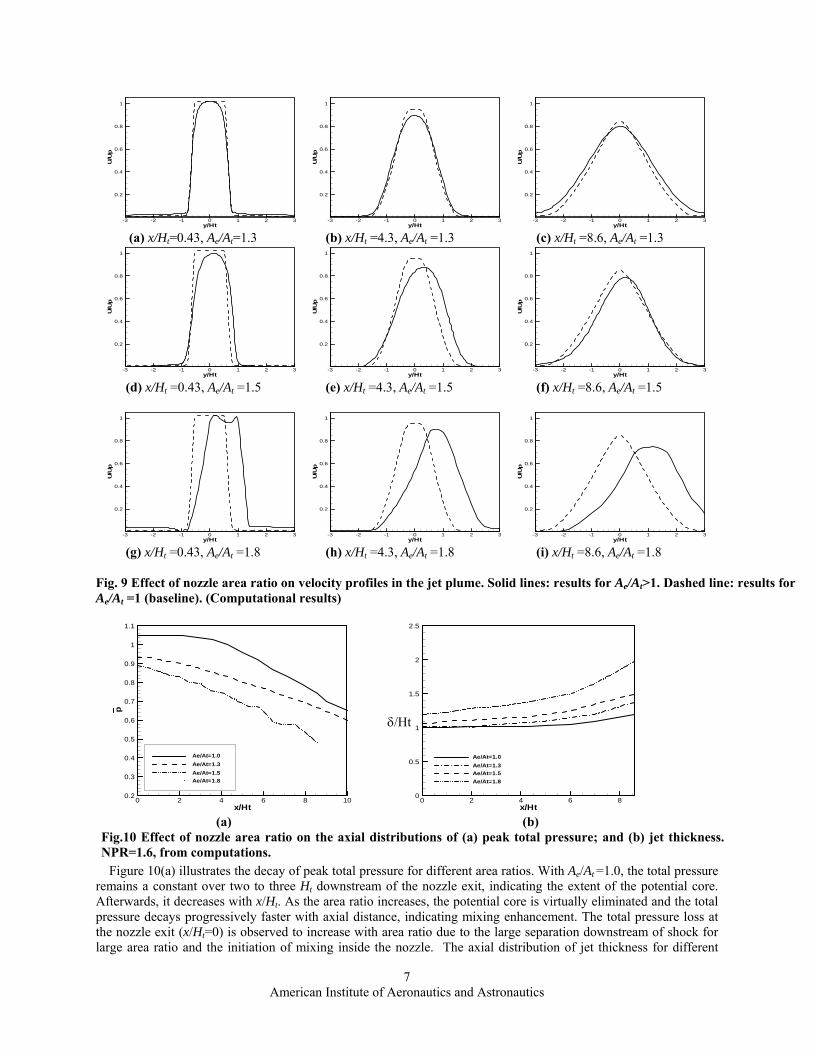
Figure 10(a) illustrates the decay of peak total pressure for different area ratios. With Ae/At =1.0, the total pressure remains a constant over two to three Ht downstream of the nozzle exit, indicating the extent of the potential core. Afterwards, it decreases with x/Ht. As the area ratio increases, the potential core is virtually eliminated and the total pressure decays progressively faster with axial distance, indicating mixing enhancement. The total pressure loss at the nozzle exit (x/Ht=0) is observed to increase with area ratio due to the large separation downstream of shock for large area ratio and the initiation of mixing inside the nozzle. The axial distribution of jet thickness for different
y/Ht
U/U
p
-3 -2 -1 0 1 2 3
0.2
0.4
0.6
0.8
1
y/Ht
U/U
p
-3 -2 -1 0 1 2 3
0.2
0.4
0.6
0.8
1
y/Ht
U/U
p
-3 -2 -1 0 1 2 3
0.2
0.4
0.6
0.8
1
(a) x/Ht=0.43, Ae/At=1.3 (b) x/Ht =4.3, Ae/At =1.3 (c) x/Ht =8.6, Ae/At =1.3
y/Ht
x/Ht
p
0 2 4 6 8 100.2
0.3
0.4
0.5
0.6
0.7
0.8
0.9
1
1.1
Ae/At=1.0Ae/At=1.3Ae/At=1.5Ae/At=1.8
x/Ht0 2 4 6 8
0
0.5
(a) (b) Fig.10 Effect of nozzle area ratio on the axial distributions of (a) peak total pressure; and (b) jet thickness.NPR=1.6, from computations.
1
1.5
2
2.5
Ae/At=1.0Ae/At=1.3Ae/At=1.5Ae/At=1.8
δ/Ht
U/U
p
-3 -2 -1 0 1 2 3
0.2
0.4
0.6
0.8
1
y/Ht
U/U
p
-3 -2 -1 0 1 2 3
0.2
0.4
0.6
0.8
1
y/Ht
U/U
p
-3 -2 -1 0 1 2 3
0.2
0.4
0.6
0.8
1
(d) x/Ht =0.43, Ae/At =1.5 (e) x/Ht =4.3, Ae/At =1.5 (f) x/Ht =8.6, Ae/At =1.5
y/Ht
U/U
p
-3 -2 -1 0 1 2 3
0.2
0.4
0.6
0.8
1
y/Ht
U/U
p
-3 -2 -1 0 1 2 3
0.2
0.4
0.6
0.8
1
y/Ht
U/U
p
-3 -2 -1 0 1 2 3
0.2
0.4
0.6
0.8
1
(g) x/Ht =0.43, Ae/At =1.8 (h) x/Ht =4.3, Ae/At =1.8 (i) x/Ht =8.6, Ae/At =1.8 Fig. 9 Effect of nozzle area ratio on velocity profiles in the jet plume. Solid lines: results for Ae/At>1. Dashed line: results forAe/At =1 (baseline). (Computational results)
American Institute of Aeronautics and Astronautics
7
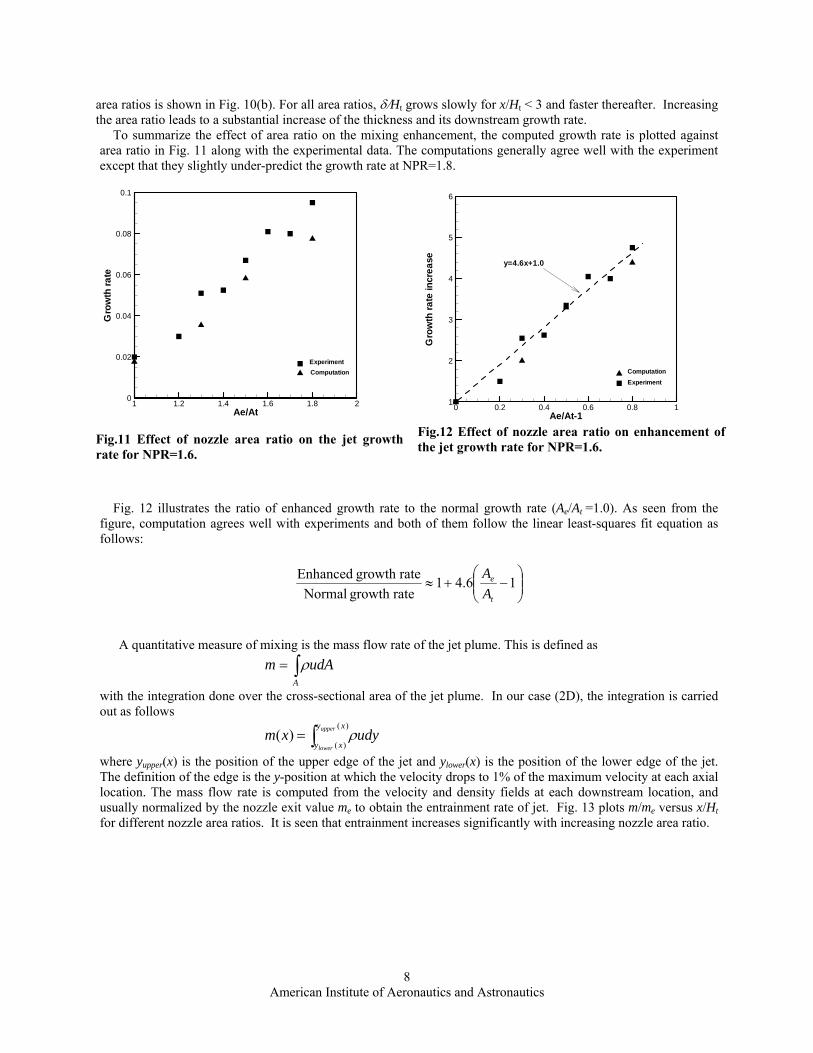
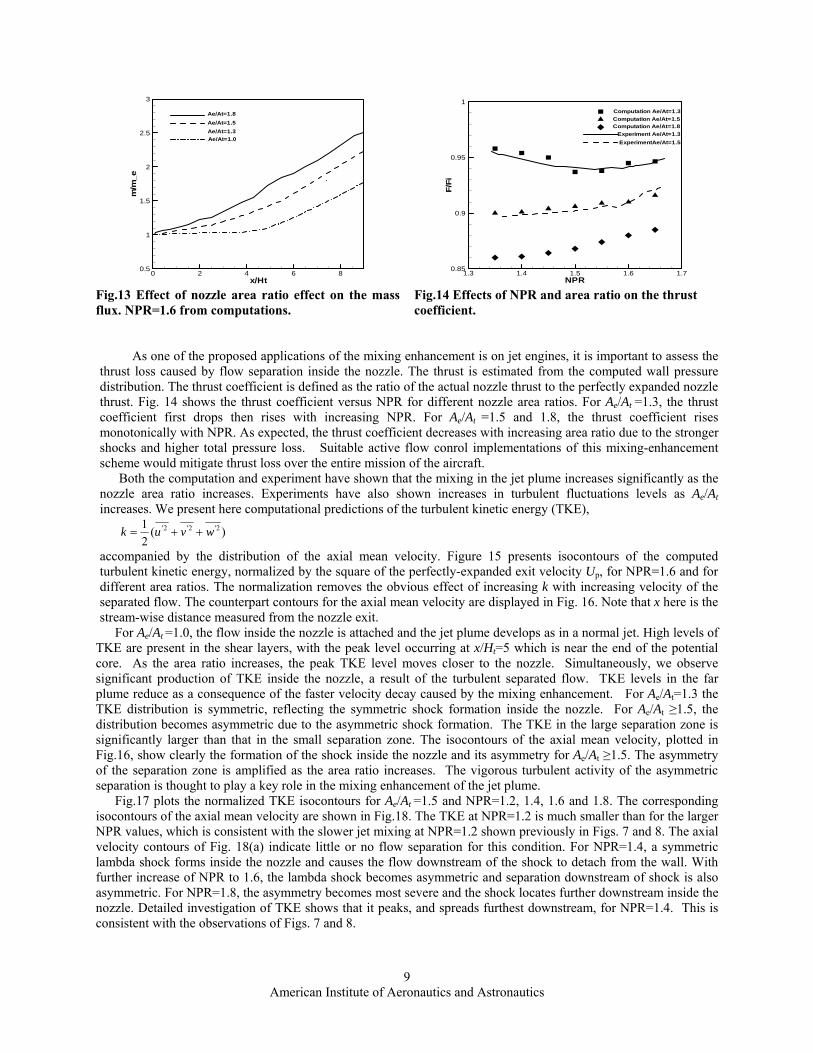
area ratios is shown in Fig. 10(b). For all area ratios, δ/Ht grows slowly for x/Ht < 3 and faster thereafter. Increasing the area ratio leads to a substantial increase of the thickness and its downstream growth rate. To summarize the effect of area ratio on the mixing enhancement, the computed growth rate is plotted against area ratio in Fig. 11 along with the experimental data. The computations generally agree well with the experiment except that they slightly under-predict the growth rate at NPR=1.8.
Ae/At
Gro
wth
rate
1 1.2 1.4 1.6 1.8 20
0.02
0.04
0.06
0.08
0.1
ExperimentComputation
Fig.11 Effect of nozzle area ratio on the jet growth rate for NPR=1.6.
Ae/At-1G
row
thra
tein
crea
se
0 0.2 0.4 0.6 0.8 11
2
3
4
5
6
y=4.6x+1.0
ComputationExperiment
Fig.12 Effect of nozzle area ratio on enhancement of the jet growth rate for NPR=1.6.
Fig. 12 illustrates the ratio of enhanced growth rate to the normal growth rate (Ae/At =1.0). As seen from the figure, computation agrees well with experiments and both of them follow the linear least-squares fit equation as follows:
⎟⎟⎠
⎞⎜⎜⎝
⎛−+≈ 16.41
rategrowth Normalrategrowth Enhanced
t
e
AA
A quantitative measure of mixing is the mass flow rate of the jet plume. This is defined as
∫=A
udAm ρ
with the integration done over the cross-sectional area of the jet plume. In our case (2D), the integration is carried out as follows
∫=)(
)()(
xy
xy
upper
lower
udyxm ρ
where yupper(x) is the position of the upper edge of the jet and ylower(x) is the position of the lower edge of the jet. The definition of the edge is the y-position at which the velocity drops to 1% of the maximum velocity at each axial location. The mass flow rate is computed from the velocity and density fields at each downstream location, and usually normalized by the nozzle exit value me to obtain the entrainment rate of jet. Fig. 13 plots m/me versus x/Ht for different nozzle area ratios. It is seen that entrainment increases significantly with increasing nozzle area ratio.
American Institute of Aeronautics and Astronautics
8
x/Ht
m/m
_e
0 2 4 6 80.5
1
1.5
2
2.5
3
Ae/At=1.3Ae/At=1.5Ae/At=1.8
Ae/At=1.0
Fig.13 Effect of nozzle area ratio effect on the mass flux. NPR=1.6 from computations.
NPR
F/Fi
1.3 1.4 1.5 1.6 1.70.85
0.9
0.95
1Computation Ae/At=1.3Computation Ae/At=1.5Computation Ae/At=1.8
Experiment Ae/At=1.3ExperimentAe/At=1.5
Fig.14 Effects of NPR and area ratio on the thrust coefficient.
As one of the proposed applications of the mixing enhancement is on jet engines, it is important to assess the thrust loss caused by flow separation inside the nozzle. The thrust is estimated from the computed wall pressure distribution. The thrust coefficient is defined as the ratio of the actual nozzle thrust to the perfectly expanded nozzle thrust. Fig. 14 shows the thrust coefficient versus NPR for different nozzle area ratios. For Ae/At =1.3, the thrust coefficient first drops then rises with increasing NPR. For Ae/At =1.5 and 1.8, the thrust coefficient rises monotonically with NPR. As expected, the thrust coefficient decreases with increasing area ratio due to the stronger shocks and higher total pressure loss. Suitable active flow conrol implementations of this mixing-enhancement scheme would mitigate thrust loss over the entire mission of the aircraft.
Both the computation and experiment have shown that the mixing in the jet plume increases significantly as the nozzle area ratio increases. Experiments have also shown increases in turbulent fluctuations levels as Ae/At increases. We present here computational predictions of the turbulent kinetic energy (TKE),
)(21 2'2'2' wvuk ++=
accompanied by the distribution of the axial mean velocity. Figure 15 presents isocontours of the computed turbulent kinetic energy, normalized by the square of the perfectly-expanded exit velocity Up, for NPR=1.6 and for different area ratios. The normalization removes the obvious effect of increasing k with increasing velocity of the separated flow. The counterpart contours for the axial mean velocity are displayed in Fig. 16. Note that x here is the stream-wise distance measured from the nozzle exit.
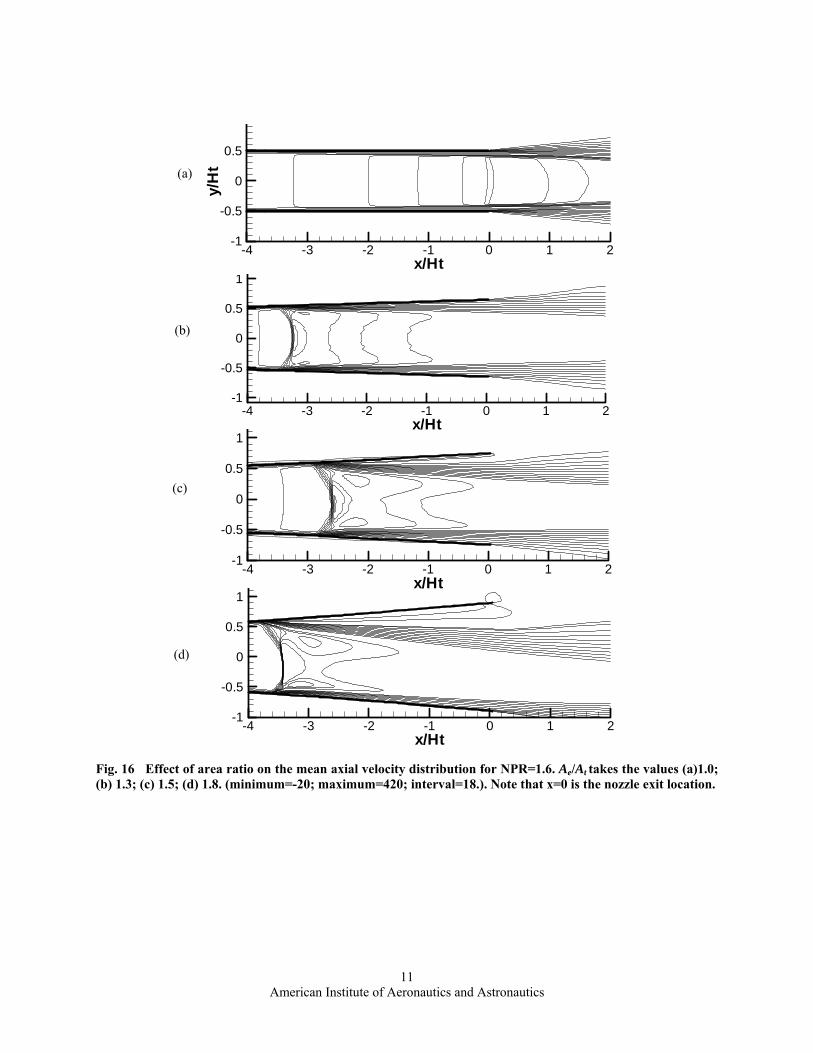
For Ae/At =1.0, the flow inside the nozzle is attached and the jet plume develops as in a normal jet. High levels of TKE are present in the shear layers, with the peak level occurring at x/Ht=5 which is near the end of the potential core. As the area ratio increases, the peak TKE level moves closer to the nozzle. Simultaneously, we observe significant production of TKE inside the nozzle, a result of the turbulent separated flow. TKE levels in the far plume reduce as a consequence of the faster velocity decay caused by the mixing enhancement. For Ae/At=1.3 the TKE distribution is symmetric, reflecting the symmetric shock formation inside the nozzle. For Ae/At ≥1.5, the distribution becomes asymmetric due to the asymmetric shock formation. The TKE in the large separation zone is significantly larger than that in the small separation zone. The isocontours of the axial mean velocity, plotted in Fig.16, show clearly the formation of the shock inside the nozzle and its asymmetry for Ae/At ≥1.5. The asymmetry of the separation zone is amplified as the area ratio increases. The vigorous turbulent activity of the asymmetric separation is thought to play a key role in the mixing enhancement of the jet plume.
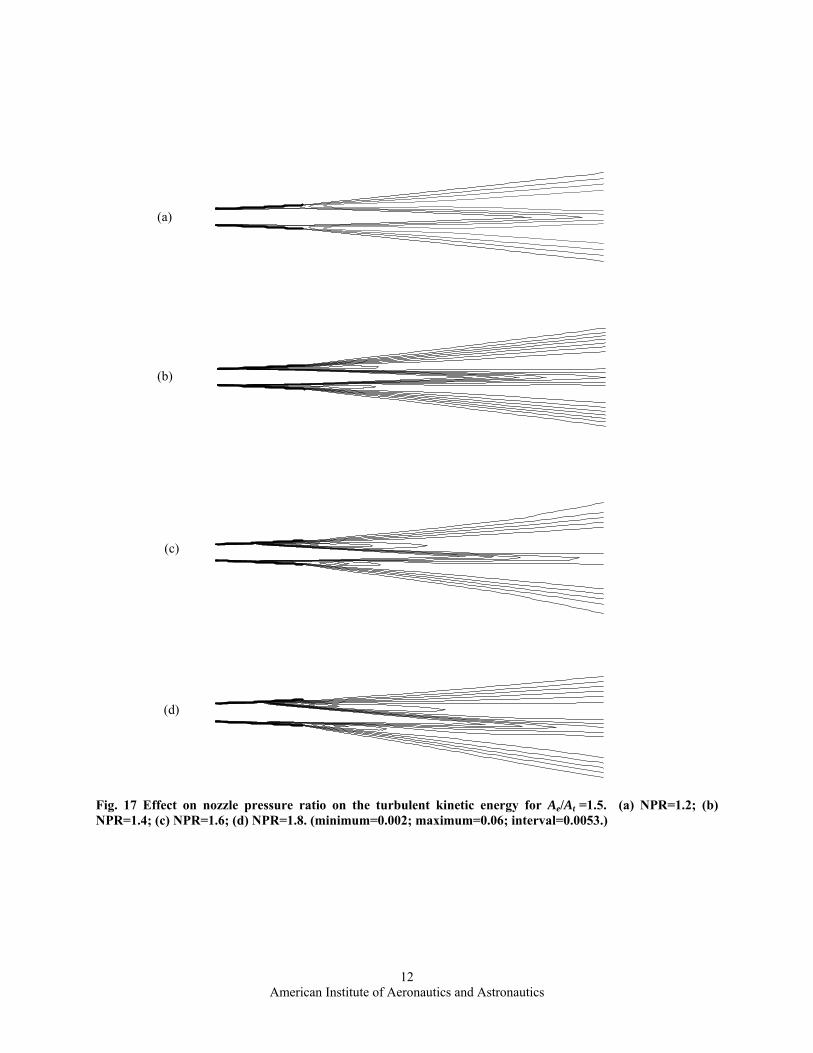
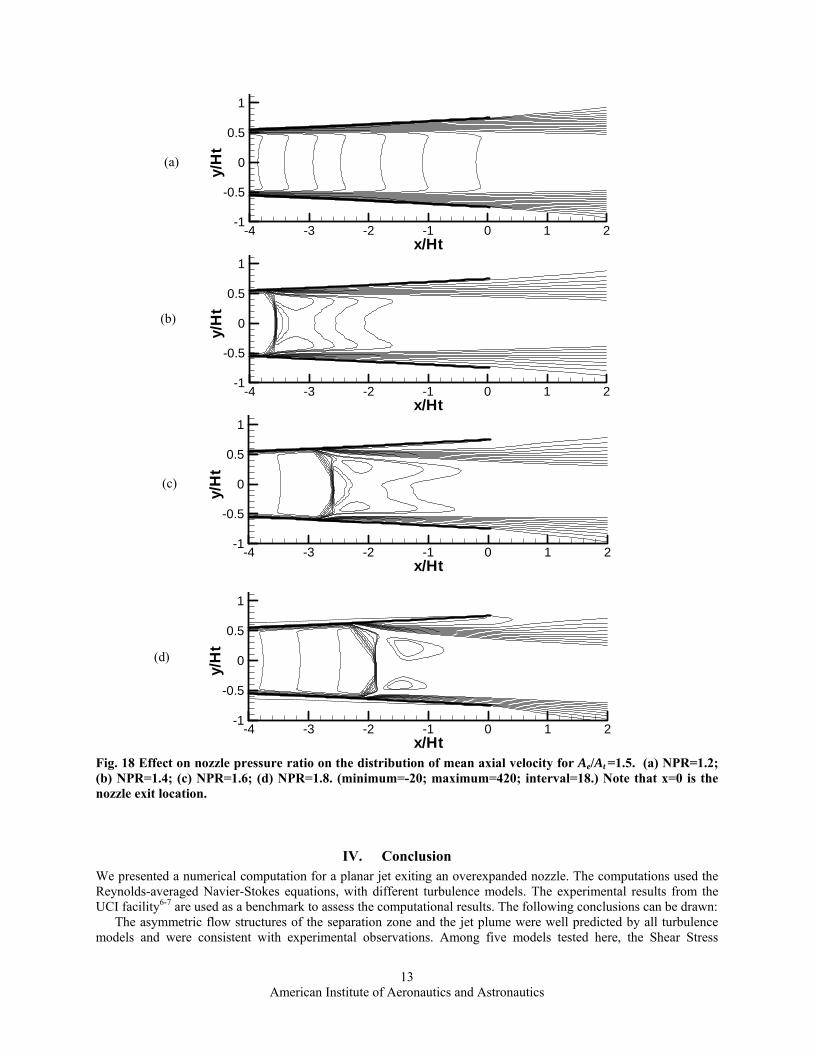
Fig.17 plots the normalized TKE isocontours for Ae/At =1.5 and NPR=1.2, 1.4, 1.6 and 1.8. The corresponding isocontours of the axial mean velocity are shown in Fig.18. The TKE at NPR=1.2 is much smaller than for the larger NPR values, which is consistent with the slower jet mixing at NPR=1.2 shown previously in Figs. 7 and 8. The axial velocity contours of Fig. 18(a) indicate little or no flow separation for this condition. For NPR=1.4, a symmetric lambda shock forms inside the nozzle and causes the flow downstream of the shock to detach from the wall. With further increase of NPR to 1.6, the lambda shock becomes asymmetric and separation downstream of shock is also asymmetric. For NPR=1.8, the asymmetry becomes most severe and the shock locates further downstream inside the nozzle. Detailed investigation of TKE shows that it peaks, and spreads furthest downstream, for NPR=1.4. This is consistent with the observations of Figs. 7 and 8.
American Institute of Aeronautics and Astronautics
9

(a)
(b)
(c)
(d)
Fig. 15 Effect of area ratio on the turbulent kinetic energy at NPR=1.6. Ae/At takes the values: (a) 1.0; (b) 1.3; (c) 1.5; (d) 1.8. (minimum=0.006; maximum=0.0401; interval=0.0031.)
American Institute of Aeronautics and Astronautics
10
x/Ht
y/H
t
-4 -3 -2 -1 0 1 2-1
-0.5
0
0.5
x/Ht-4 -3 -2 -1 0 1 2
-1
-0.5
0
0.5
1
(a)
x/Ht-4 -3 -2 -1 0 1 2
-1
-0.5
0
0.5
1
(b)
x/Ht-4 -3 -2 -1 0 1 2
-1
-0.5
0
0.5
1
(c)
(d)
Fig. 16 Effect of area ratio on the mean axial velocity distribution for NPR=1.6. Ae/At takes the values (a)1.0; (b) 1.3; (c) 1.5; (d) 1.8. (minimum=-20; maximum=420; interval=18.). Note that x=0 is the nozzle exit location.
American Institute of Aeronautics and Astronautics
11
(a)
(b)
(c)
(d)
Fig. 17 Effect on nozzle pressure ratio on the turbulent kinetic energy for Ae/At =1.5. (a) NPR=1.2; (b) NPR=1.4; (c) NPR=1.6; (d) NPR=1.8. (minimum=0.002; maximum=0.06; interval=0.0053.)
American Institute of Aeronautics and Astronautics
12
x/Ht
y/H
t-4 -3 -2 -1 0 1 2
-1
-0.5
0
0.5
1
x/Ht
y/H
t
-4 -3 -2 -1 0 1 2-1
-0.5
0
0.5
1
(a)
x/Ht
y/H
t
-4 -3 -2 -1 0 1 2-1
-0.5
0
0.5
1
(b)
x/Ht
y/H
t
-4 -3 -2 -1 0 1 2-1
-0.5
0
0.5
1
(c)
(d)
Fig. 18 Effect on nozzle pressure ratio on the distribution of mean axial velocity for Ae/At =1.5. (a) NPR=1.2; (b) NPR=1.4; (c) NPR=1.6; (d) NPR=1.8. (minimum=-20; maximum=420; interval=18.) Note that x=0 is the nozzle exit location.
IV. Conclusion We presented a numerical computation for a planar jet exiting an overexpanded nozzle. The computations used the Reynolds-averaged Navier-Stokes equations, with different turbulence models. The experimental results from the UCI facility6-7 are used as a benchmark to assess the computational results. The following conclusions can be drawn:
The asymmetric flow structures of the separation zone and the jet plume were well predicted by all turbulence models and were consistent with experimental observations. Among five models tested here, the Shear Stress
American Institute of Aeronautics and Astronautics
13
Transport (SST) model exhibited the closest agreement with experimental data. The computed velocity profiles, total-pressure decay and axial jet thickness distribution in the jet plume, computed using the SST model, are in reasonable in agreement with the experimental data. For fixed nozzle pressure ratio (NPR), increasing the nozzle area ratio, results in stronger mixing enhancement. For fixed area ratio, there is an optimal NPR that provides the most enhancements. For the particular nozzle geometry tested here, the optimum nozzle pressure ratio was 1.4, although mixing remained vigorous for NPR up to 1.8 (the maximum value explored here).
Computations of turbulent kinetic energy (TKE) show that, with increasing area ratio, the peak TKE in the plume rises and moves towards the nozzle exit. Significant increase of the TKE inside the nozzle is observed, a result of the asymmetric flow separation. The asymmetric separation is thus thought to play a significant role in the instability of the jet plume. The overall trends discussed above reflect the experimental observations in a variety of nozzles. However, the details (for example the NPR for the onset of the instability, or the exact relation of mixing enhancement with area ratio) will depend on the particular nozzle geometry. The primary result of this paper is that RANS using the SST model does a reasonable job in predicting the flow field and provides additional details not available in the experiments. Thus the computations can become a valuable tool in optimizing configurations for most effective mixing.
Acknowledgments
The authors gratefully acknowledge the support from the Directorate of Research and Development, Defense Science and Technology Agency, Singapore under the program managers Dr KY Lou (Flow Control Program), and Mr A Wong (Inlet & Nozzle Flow Program.
References
1. Papamoschou, D, “Mixing enhancement using axial flow,” AIAA-2000-0093, 1993. 2. Murakami, E., and Papamoschou, D., “Experiments on mixing enhancement in dual-stream jets,” AIAA-2001-
0668, 2001. 3. Papamoschou, D., Dixon, T.D., and Nishi, K., “Mean flow of multi-stream rectangular jets under normal and
mixing-enhancement conditions.” AIAA-2004-0919, 2004. 4. Papamoschou, D., and Zill A., “Fundamental investigation of supersonic nozzle flow separation” AIAA 2004-
1111, 2004. 5. Xiao, Q, Tsai, H.M., and Papamoschou, D., “Numerical investigation of supersonic nozzle flow separation,” to
appear in AIAA Journal. 6. Papamoschou, D., and Rossetti, P., "Instability of jet plume from an overexpanded nozzle," abstract and
presentation at the 58th Annual Meeting of the American Physical Society, Division of Fluid Dynamics, November 20–22, 2005; Chicago, IL.
7. Papamoschou, D., and Johnson A., “Unsteady phenomena in supersonic nozzle flow separation,” AIAA 2006-3360, 2006.
8. Carlson, J.R., “A nozzle internal performance prediction method,” NASA Technical Paper 3221, 1992. 9. Hunter, C.A., “Experimental, theoretical, and computational investigation of separated nozzle flows,” AIAA
98-3107 1998. 10. Dembowski,M.A., and Georgiadis N.J., “An evaluation of parameters influencing jet mixing using the WIND
Navier-Stokes codes,” NASA/TM-2002-211727 11. Thies, A.T., and Tam,C.K.W., “Computation of turbulent axisymmetric and nonaxisymmetric jet flows using
the k-ε model,” AIAA Journal Vol. 34, No.2, 1996, pp.309-316, 12. Tandra, D.S., Kaliazine, A., Cormack,D.E., and Tran, H. N., “Numerical simulation of supersonic jet flow
using a modified k-ε model,” International Journal of Computational Fluid Dynamics, Vol. 20, No. 1, pp.19-27, 2006.
13. Georgiadis N. J., and Papamoschou, D., “Computational investigation of high-speed dual-stream jets,” AIAA 2003-3311, 2003.
14. Zhang, H., So, R., Gatski, T., and Speziale, C., “A Near-wall second-order closure for compressible turbulent flows,” Near-Wall Turbulent Flows, edited by R. So, C. Speziale, and B. Launder, Elsevier, New York, 1993, pp. 209-218.
15. Chenault, C. F., and Beran, P., “Numerical investigation of supersonic injection using a Reynolds-Stress turbulence model,” AIAA Journal, Vol. 37, No. 10, 1999, pp. 1257-1269.
American Institute of Aeronautics and Astronautics
14