numerical simulation of aerodynamic characteristics of a...
TRANSCRIPT
Copyright ⓒ The Korean Society for Aeronautical & Space SciencesReceived: November 5, 2014 Revised : February 26, 2015 Accepted: March 2, 2015
8 http://ijass.org pISSN: 2093-274x eISSN: 2093-2480
PaperInt’l J. of Aeronautical & Space Sci. 16(1), 8–18 (2015)DOI: http://dx.doi.org/10.5139/IJASS.2015.16.1.8
Numerical simulation of aerodynamic characteristics of a BWB UCAV configuration with transition models
Young-Hee Jo*Department of Aeronautical System Engineering, Hanseo University, Seosan 356-706, Korea
Kyoungsik Chang** and Dong-Jin Sheen*** Department of Aeromechanical Engineering, Hanseo University, Seosan 356-706, Korea
Soo Hyung Park*** Department of Aerospace Information Engineering, Konkuk University, Seoul 143-701, Korea
Abstract
A numerical simulation for a nonslender BWB UCAV configuration with a rounded leading edge and span of 1.0 m was
performed to analyze its aerodynamic characteristics. Numerical results were compared with experimental data obtained at
a free stream velocity of 50 m/s and at angles of attack from -4 to 26°. The Reynolds number, based on the mean chord length,
is 1.25×10⁶. 3D multi-block hexahedral grids are used to guarantee good grid quality and to efficiently resolve the boundary
layer. Menter’s shear stress transport model and two transition models (γ-Reθ model and γ model) were used to assess the
effect of the laminar/turbulent transition on the flow characteristics. Aerodynamic coefficients, such as drag, lift, and the
pitching moment, were compared with experimental data. Drag and lift coefficients of the UCAV were predicted well while
the pitching moment coefficient was underpredicted at high angles of attack and influenced strongly by the selected turbulent
models. After assessing the pressure distribution, skin friction lines and velocity field around UCAV configuration, it was found
that the transition effect should be considered in the prediction of aerodynamic characteristics of vortical flow fields.
Key words: UCAV, Nonslender Delta Wing, γ-Reθ Model, γ Model
1. Introduction
Unmanned combat air vehicle (UCAV) is an unmanned
air vehicle that is armed to accomplish tactical missions.
Generally, a long duration of flight capability is necessary for
a reconnaissance mission in UAV, whereas low observable
capabilities like stealth and high maneuverability are required
to increase survival rates of the UCAV. Thus, the blended wing
body (BWB) type has the advantages of a high ratio of lift to
drag and decreased radar cross section through minimizing
the discontinuity surface between the body and wings. Also
the lambda wing configuration, with its cranked wing, is
used to increase its stealth characteristics, for example, in the
planforms of the SACCON in Germany and the UCAV series
in the USA.
The aerodynamic characteristics in the upper part of the
delta wing are the primary leading edge vortex, which is
generated from the interaction between the separated shear
layer at the leading edge and the free stream, the secondary
leading edge vortex, which happens when the reattached
flow is separated again by the adverse pressure gradient in
the span-wise direction, the vortex lift, which is an additional
lift by the local suction pressure near the leading edge, the
development and breakdown of the vortex, and the nonlinear
behavior of the pitching moment by the movement of the
vortex [1].
This is an Open Access article distributed under the terms of the Creative Com-mons Attribution Non-Commercial License (http://creativecommons.org/licenses/by-nc/3.0/) which permits unrestricted non-commercial use, distribution, and reproduc-tion in any medium, provided the original work is properly cited.
* Graduate student ** Professor, Corresponding Author: [email protected] *** Professor
(8~18)14-075.indd 8 2015-04-02 오후 2:22:04
9
Young-Hee Jo Numerical simulation of aerodynamic characteristics of a BWB UCAV configuration with transition models
http://ijass.org
The delta wing is divided into slender and nonslender
types depending on the swept angle; generally, the
nonslender type corresponds to the case of an angle
less than 65° (β < 65°). As the swept angle decreases,
the effect of the vortex lift and the maximum of its lift
coefficient decrease and the stall happens earlier [2]. The
difference between the slender and nonslender wings is
that the primary vortex on the upper surface of the wing is
reattached at less than the center of the body and the dual
primary vortex is generated in the case of the nonslender
type. Also, the vortex breakdown is observed as mush less
abrupt in terms of increased buffeting.
Because the behavior of the vortex is sensitive to some
parameters, such as the swept angle [3, 4], the geometry of
the leading edge [5, 6], angles of attack, and the Reynolds
number or Mach number, careful geometric design of the
UCAV is required to meet the requirements.
In recent years, the BWB UCAV model has been a hot issue
in unmanned air vehicle concepts and some representative
models are the 1303 UCAV developed by the US AFRL
in conjunction with Boeing and SACCON (Stability and
Control Configuration) by NATO RTO AVT-161. There have
been studies to understand the flow behavior around the low
sweep delta wings through experiments [5, 7] and to provide
validation data for evaluation of the major CFD codes [6, 8,
9, 10].
In particular, the low speed aerodynamics and the flow
around the BWB configuration are still a challenging problem
(inconclusive) for computational validation, because the
transition effects should be considered in the turbulence
models in CFD [11,12,13]. Arthur and Petterson [12]
conducted a computational study considering the natural
transition, which is calculated from the linear stability
theory and the eN criterion, of the low-speed flow over the
1303 configuration. Their results are compared with the
data from the wind-tunnel tests to show better predictions
in the turbulence model, considering transitional effects,
than in the fully turbulent model [12]. Roy and Morgand [13]
investigated the effects of the two transition modelings: the
Habiballah-Delcourt criteria for the longitudinal transition
and the Arnal-Coustols criterion for the crossflow instability
mode around the SACCON [13] configuration. Their results
show that the laminar-to-turbulent transition appears
upstream of the wing as the incidence rises but comparisons
with experimental results from infrared thermography
became difficult.
There are three main methods to predict the transition
locations around the aerodynamic body. The first one is
‘classical,’ the eN method, based on linear stability theory
to calculate the growth of the disturbance amplitude. The
second approach is the low-Re turbulence model, which
can only be applied to the bypass transition. The third one
is to use the experimental correlation, while considering
the free stream turbulence intensity and the local pressure
gradient. Besides these methodologies, Menter et al. [14]
proposed a new local correlation-based transitional model
(LCTM), which solves two other transport equations, one
for the intermittency (γ) and one for the transition onset
criteria (Reθ), based on the SST k-ω model. The LCTM
approach has the advantage of predicting the transitional
point from the transport equation with empirical
correlations instead of the modeling of transition physics.
This γ-Reθ model shows good agreement with experimental
data with transitional flows, such as the aerospatial A airfoil,
the McDonald Douglas 30P-30N flap, and the DLR F 5 Wings
[14]. Recently, Menter and Smirnov [15] simplified previous
γ-Reθ models to solve a single equation for the intermittency
γ including the crossflow instability mechanism and model
Reθ locally by the free stream turbulence intensity and the
pressure gradient in the correlation formula. This reduces
the computational cost by solving one transport equation
and avoids the dependency of Reθ on the velocity U. The C1
correlation by Arnal was adopted to reflect the crossflow
instability. This γ model shows a better prediction of the
transition location at different Reynolds numbers and
crossflow transition through the simulation of an infinite
swept NLF(2)-415 wing.
In the present study, numerical simulations on the
geometry of the BWB UCAV configuration were conducted
and the aerodynamic coefficients are compared with
the experimental results by Shim et al. [16]. In particular,
the predictive capabilities of the model, considering the
transition effects (γ-Reθ model and γ model), were assessed
based on comparisons with the results from the fully
turbulent model. Also, the relationship between the pitching
moment and vortex structures are investigated.
List of Figures
Fig. 1 Dimensions of a UCAV geometry
Fig. 2 Surface grids of UCAV
Fig. 1. Dimensions of a UCAV geometry
(8~18)14-075.indd 9 2015-04-02 오후 2:22:04

DOI: http://dx.doi.org/10.5139/IJASS.2015.16.1.8 10
Int’l J. of Aeronautical & Space Sci. 16(1), 8–18 (2015)
2. Numerical method and simulation set-up
Shim et al. [16] conducted wind tunnel tests on the
geometry of the BWB configuration with a velocity of 40-
60 m/s and a span of 1 m. In the present study, the same
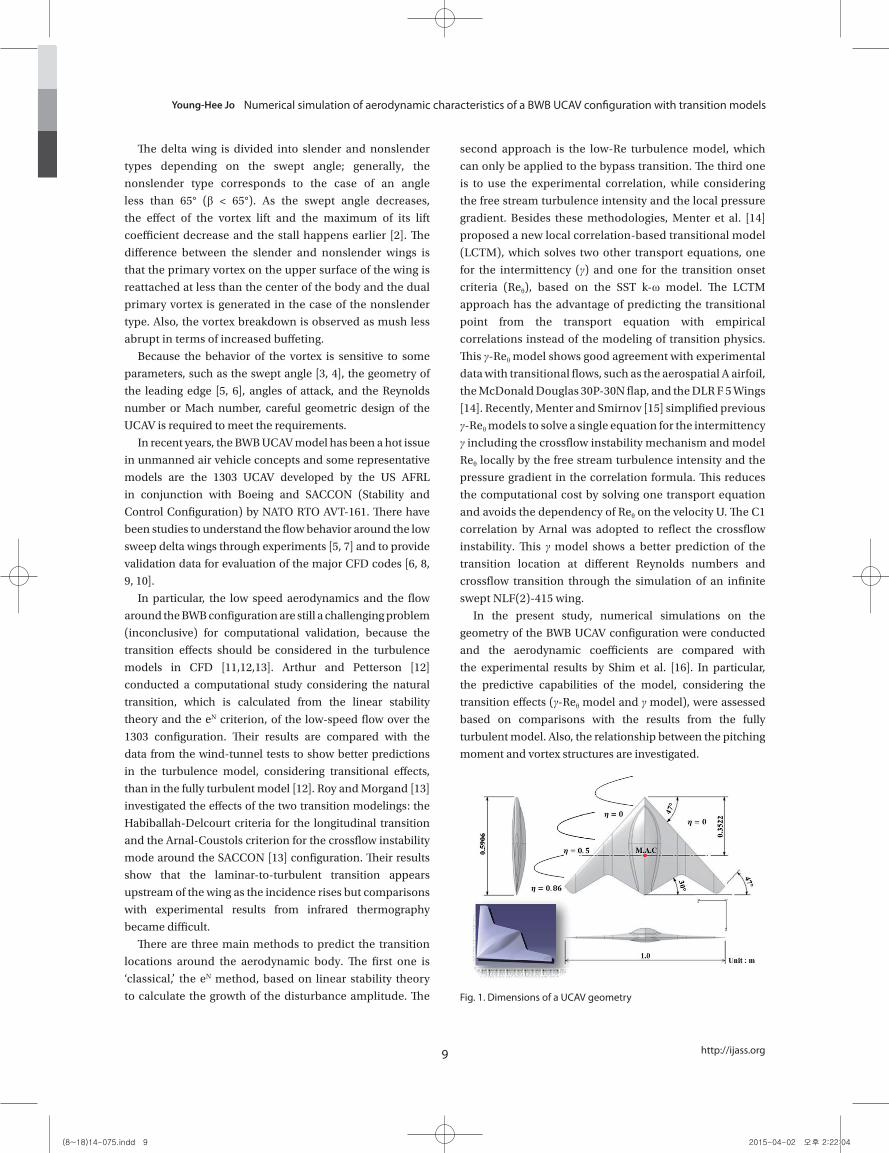
geometry is adopted, the specifications of which are shown
in Fig. 1, with a swept angle of 47°, and the crank angle of 30°
and a span of 1 m. The mean aerodynamic chord is 0.3522
m. The leading edge is round until η = 0.86 from the center of
the model in the span-wise direction and the end of the wing
and the trailing edge are sharp.
The length of the computational domain was 20C (C is the
root chord length). The height and width of the computational
domain are set to 15C. Because the angle of the side slip is
not considered in the present study, a symmetric condition
is applied to the surface of half geometry. (Fig. 2)
The grid and computational domain in the present study
were generated with commercial software, ICEM-CFD of
ANSYS [17]. A hexahedron structured cell was adopted to
decrease the skewness of the grid system and to minimize
the diffusion of the numerical errors. However, the sharp
edge at the wing tip and the trailing edge make it difficult to
use the topology of the O-type or C-type. Thus, the grid was
generated in the H-type with multi-blocks (Fig. 2).
In the present work, three kinds of grid systems (coarse,
medium, and fine mesh) were adopted for the grid test
(Table 1). In the medium grid, 280 grid points are distributed
in the stream-wise direction and clustered near the leading
edge and the trailing edge with an interval of 1.4×10⁻⁴C.
The numbers of grid points in the vertical and span-wise
directions were 220 and 130, respectively. To resolve the
boundary layer correctly, the first point is set to 2×10⁻⁵C in all
three grids, to confirm that y+ is less than 1.0 over the surface
after simulation. The fine grid has 1.5 times the grid points in
a stream-wise direction and 1.8 times the points in a span-
wise direction of the coarse grid and corresponds to the 0.5
wall unit in the vertical direction at a zero angle of attack.
The commercial CFD code, ANSYS Fluent 15.0, has been
used to solve the incompressible Navier-Stokes equations.
In the present work, the second-order discretization scheme
in space and time was adopted and the correction of the
pressure-velocity was done using a SIMPLEC algorithm. The
time step is set to 0.002 s and the total simulation time is 2.6
s, corresponding to 1300 time steps and six times the total
computational length (216Croot).
The free stream velocity is 50 m/s and the Reynolds
number, based on the mean chord and the free stream
velocity, is 1.25×10⁶. To meet the experimental conditions
of Shim et al. [16], atmospheric conditions at sea level
were used. The boundary condition of the pressure outlet
is applied to the far boundary and the wall of the UCAV is
treated as a no-slip wall.
One fully turbulent model and two transitional models
were used to simulate flow around the BWB type UCAV;
Menter’s shear stress transport (SST) model showed excellent
results in previous research [10,12], the γ-Reθ model, which
considers the transitional effects of laminar-to-turbulent
flows proposed by Menter and Langtry [14], and the γ model
with crossflow effects [15].
For efficient simulation and fast convergence, a steady
simulation with a 1st-order accuracy scheme was done and
then an unsteady simulation with a 2nd-order scheme was
performed. The criterion of convergence is that the residual
of the continuity and turbulent quantities is less than 10-6.
3. Results
The grid test was achieved using three grids based on the
SST model (Table 1). Fig. 3 shows the lift coefficients versus
List of Figures
Fig. 1 Dimensions of a UCAV geometry
Fig. 2 Surface grids of UCAV Fig. 2. Surface grids of UCAV
Table 1. Grid parameters of three grid systems
List of Tables
Table 1. Grid parameters of three grid systems
Coarse Medium Fine
Streamwise direction 100 128 150
Vertical direction 80 110 110
Spanwise direction 92 130 166
Wing surface cells 1.8ⅹ104 3.9ⅹ104 5.2ⅹ104
Total cells 4.9ⅹ106 7.8ⅹ106 1.5ⅹ107
(8~18)14-075.indd 10 2015-04-02 오후 2:22:04

11
Young-Hee Jo Numerical simulation of aerodynamic characteristics of a BWB UCAV configuration with transition models
http://ijass.org
four angles of attack (0, 8, 16, and 24°) in three grids. The
lift coefficients were predicted nearly consistently between
medium and fine grids; however, those of the coarse grid
show a maximum 6.2% difference versus those of the other
two grids. Thus, the medium grid (cell number, 7.8×10⁶) was
selected as the appropriate one for efficient computation in
the present study.
Figure 4 shows the aerodynamic coefficients with respect to
the angles of attack of the three turbulence models (Menter’s
SST, γ-Reθ model, γ model) and the experimental results by
Shim et al. [16]. These coefficients are averaged out during
36 s (tUinf/Croot) after the solution converged fully. In the
experimental results [16], the lift curve is linear up to the angle
of attack, 12°, and then the slope starts to decrease after 12°.
Finally, the lift slope is flat after 20°, caused by the decrease
in the vortex lift from the early breakdown of the leading
edge vortex up to the apex [9]. The present results show good
agreement with the experimental results [16] up to 12° and a
small discrepancy after this angle, where the predictions of
the γ-Reθ model and γ model are slightly better than that of
the Menter’s SST model. This discrepancy can be explained
from two points of view; one is that the present work does
not consider the sting mounting, which is attached to the
experimental model [11] and the other is the limitation that
Reynolds-Averaged Navier-Stokes (RANS) models cannot
capture the separated flow correctly at high angles of attack.
In the plot of drag coefficient (Fig. 4(b)), two simulations
show overall agreement with the reference data [16] except
at an angle of attack less than 4°. The error between the
three simulations and the experiment is the maximum at the
angle of attack, 0°, where the experimental value is 0.00717.
Menter’s SST model overpredicted this as 0.01083 (+51%)
and the γ-Reθ model underpredicted it as 0.00579 (-19%).
The best prediction was obtained through the γ model, which
predicted 0.00732 (+2%). Because the γ-Reθ model considers
some regions of laminar flow and others in turbulent flow, the
lower prediction of the drag than the fully turbulent model
(Menter’s SST model) seems reasonable. Also, these trends
Fig. 3 Time averaged global lift coefficient of three grids
Fig. 3. Time averaged global lift coefficient of three grids
a b
c d
Fig. 4. Time averaged global aerodynamic coefficient against AoA(a : lift coefficient, b : drag coefficient, c : pitching moment coefficient, d : lift-to-drag ratio)
(8~18)14-075.indd 11 2015-04-02 오후 2:22:05
DOI: http://dx.doi.org/10.5139/IJASS.2015.16.1.8 12
Int’l J. of Aeronautical & Space Sci. 16(1), 8–18 (2015)
are observed in the comparison of airfoil simulations with
fully turbulent model and transition models [14]. As the angle
of attack increases, the plot shows that the prediction of two
transition models is slightly better than that of the SST model.
The pitching moment, as shown in Fig. 4(c), is predicted as
a lower value at a low angle of attack and an overall trend,
such as an increase of the pitching moment after the pitch
break (~6°) and a decrease after the peak, agree well with
experimental results. Nevertheless, all models fail to predict
the change of the slope (between 6° and 10°) of the pitching
moment. At low angles of attack, Menter’s SST model predicts
well, whereas all models show similar predictions where the
slope is constant after the pitch break (10-14°). The angle
of attack at the peak of the pitching moment is predicted as
16° and 14° in two transitional models and in the SST model
separately, which is 2-4° smaller value than experimental one,
18°. The results show a discrepancy at a high angle of attack
in numerical simulations, consistent with the tendency in lift
coefficients. When the lift-to-drag ratio (L/D) is plotted in Fig.
4(d), the γ model shows the best prediction whereas the γ-Reθ
model overpredicts the peak of the lift-to-drag ratio and the
Menter’s SST model shows a contrary result.
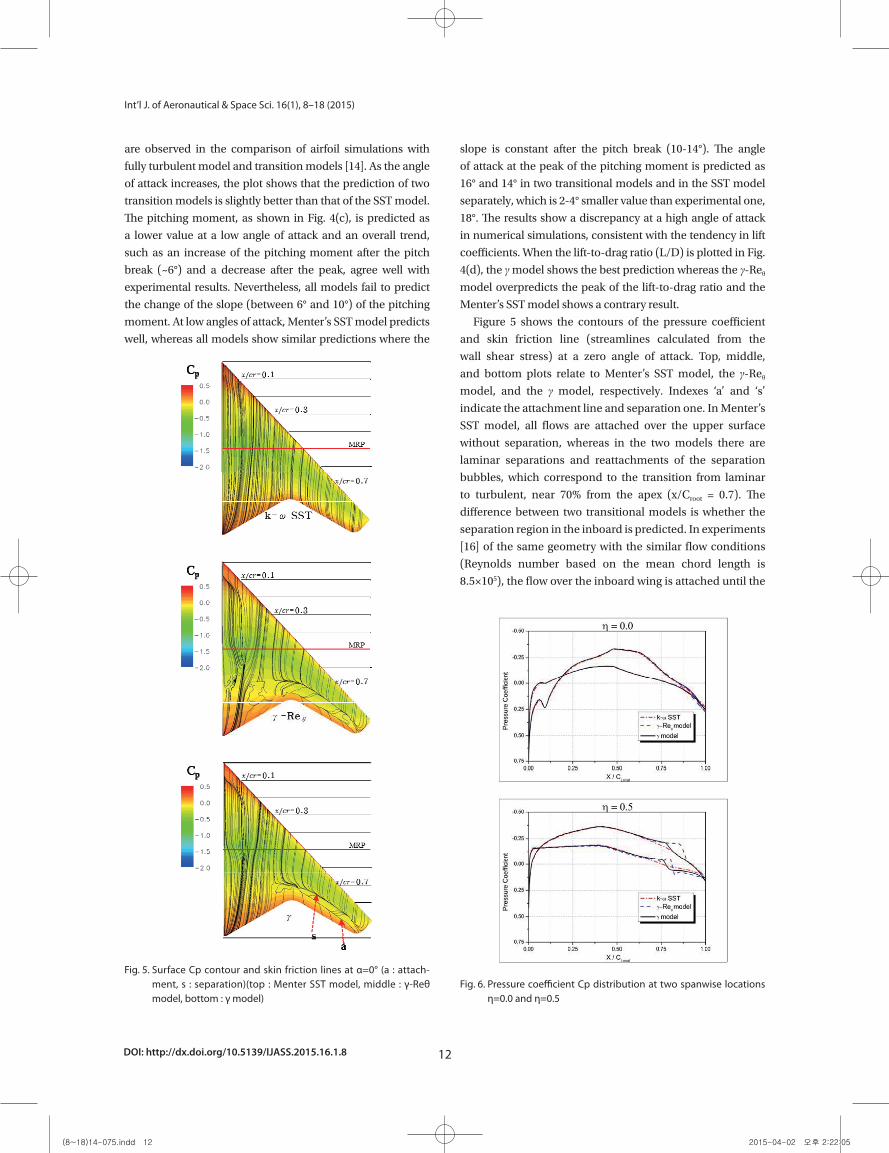
Figure 5 shows the contours of the pressure coefficient
and skin friction line (streamlines calculated from the
wall shear stress) at a zero angle of attack. Top, middle,
and bottom plots relate to Menter’s SST model, the γ-Reθ
model, and the γ model, respectively. Indexes ‘a’ and ‘s’
indicate the attachment line and separation one. In Menter’s
SST model, all flows are attached over the upper surface
without separation, whereas in the two models there are
laminar separations and reattachments of the separation
bubbles, which correspond to the transition from laminar
to turbulent, near 70% from the apex (x/Croot = 0.7). The
difference between two transitional models is whether the
separation region in the inboard is predicted. In experiments
[16] of the same geometry with the similar flow conditions
(Reynolds number based on the mean chord length is
8.5×10⁵), the flow over the inboard wing is attached until the
Fig. 5 Surface Cp contour and skin friction lines at α=0° (a : attachment, s : separation)
( a : Menter SST model, b : γ-Reθ model, c : γ model)
Fig. 5. Surface Cp contour and skin friction lines at α=0° (a : attach-ment, s : separation)(top : Menter SST model, middle : γ-Reθ model, bottom : γ model)
Fig. 6 Pressure coefficient Cp distribution at two spanwise locations η=0.0 and η=0.5 Fig. 6. Pressure coefficient Cp distribution at two spanwise locations
η=0.0 and η=0.5
(8~18)14-075.indd 12 2015-04-02 오후 2:22:05
13
Young-Hee Jo Numerical simulation of aerodynamic characteristics of a BWB UCAV configuration with transition models
http://ijass.org
trailing edge of the wing at the angle of attack 8°, through oil
flow visualization. Based on this result, the γ model shows a
better prediction than the γ-Reθ model. Also, when the more
accurate prediction of the drag coefficient by the γ model is
considered at an angle of attack of 0° (Fig. 4 (b)), the flow
pattern of transitional models are more reasonable.
The pressure coefficient at two specified span-wise
positions (one is the center line of η = z/b = 0.0 and the other is
η = z/b = 0.5) is plotted in Fig. 6. The pressure distributions of
all models are nearly consistent, except near the transitional
points (x/Croot=0.75), where there are separation bubbles and
reattachments. The fact that the pressure coefficient does
not increase smoothly (smooth adverse pressure gradient)
and remains constant to abrupt increases shows the typical
behavior of separation and reattachment in the flow over an
airfoil. [18]
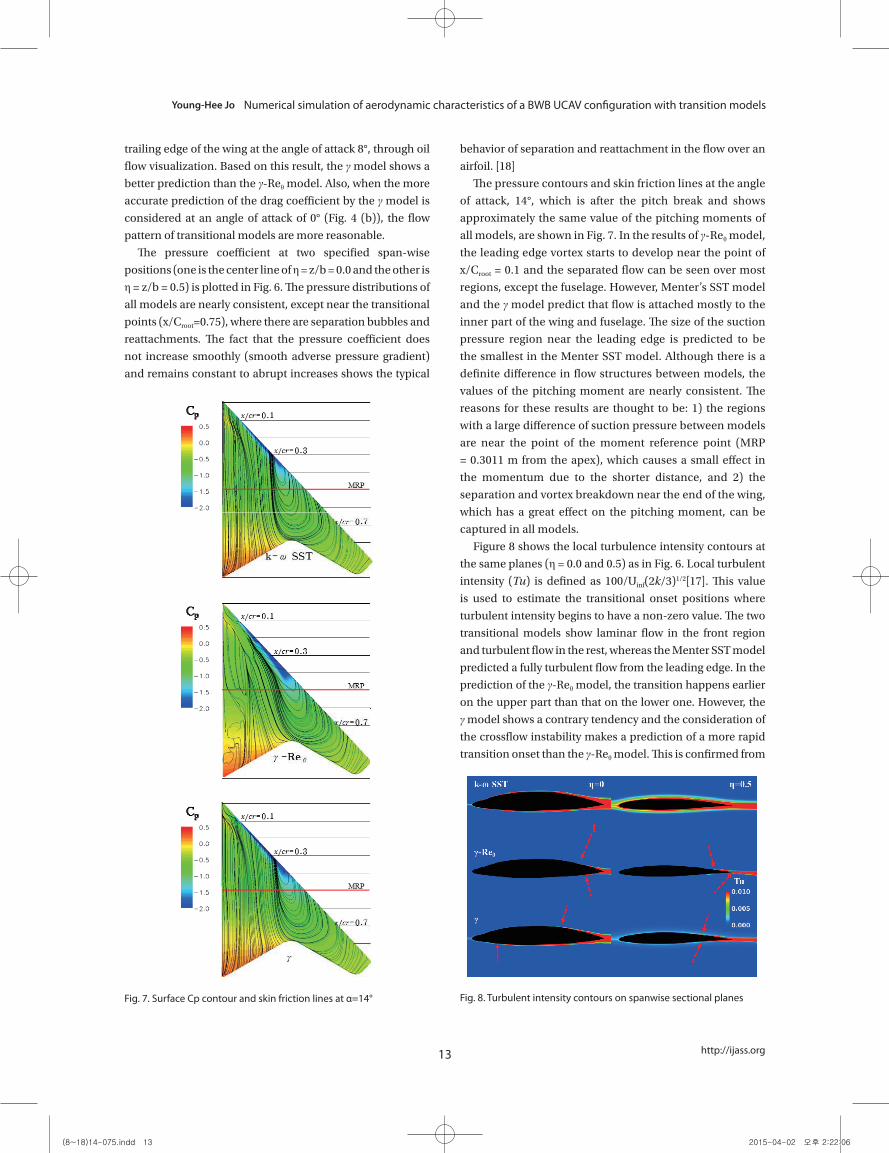
The pressure contours and skin friction lines at the angle
of attack, 14°, which is after the pitch break and shows
approximately the same value of the pitching moments of
all models, are shown in Fig. 7. In the results of γ-Reθ model,
the leading edge vortex starts to develop near the point of
x/Croot = 0.1 and the separated flow can be seen over most
regions, except the fuselage. However, Menter’s SST model
and the γ model predict that flow is attached mostly to the
inner part of the wing and fuselage. The size of the suction
pressure region near the leading edge is predicted to be
the smallest in the Menter SST model. Although there is a
definite difference in flow structures between models, the
values of the pitching moment are nearly consistent. The
reasons for these results are thought to be: 1) the regions
with a large difference of suction pressure between models
are near the point of the moment reference point (MRP
= 0.3011 m from the apex), which causes a small effect in
the momentum due to the shorter distance, and 2) the
separation and vortex breakdown near the end of the wing,
which has a great effect on the pitching moment, can be
captured in all models.
Figure 8 shows the local turbulence intensity contours at
the same planes (η = 0.0 and 0.5) as in Fig. 6. Local turbulent
intensity (Tu) is defined as 100/Uinf(2k/3)1/2[17]. This value
is used to estimate the transitional onset positions where
turbulent intensity begins to have a non-zero value. The two
transitional models show laminar flow in the front region
and turbulent flow in the rest, whereas the Menter SST model
predicted a fully turbulent flow from the leading edge. In the
prediction of the γ-Reθ model, the transition happens earlier
on the upper part than that on the lower one. However, the
γ model shows a contrary tendency and the consideration of
the crossflow instability makes a prediction of a more rapid
transition onset than the γ-Reθ model. This is confirmed from
Fig 7. Surface Cp contour and skin friction lines at α=14° Fig. 7. Surface Cp contour and skin friction lines at α=14°
Fig. 8 Turbulent intensity contours on spanwise sectional planes
Fig. 8. Turbulent intensity contours on spanwise sectional planes
(8~18)14-075.indd 13 2015-04-02 오후 2:22:06

DOI: http://dx.doi.org/10.5139/IJASS.2015.16.1.8 14
Int’l J. of Aeronautical & Space Sci. 16(1), 8–18 (2015)
the distribution of the pressure coefficient in Fig. 6. For more
accurate predictions of the transition onset position of the γ model, the contour of the intermittency (γ) at the upper part
and the lower part of the body are plotted with respect to the
six angles of attack (-4, -2, 0, 2, 4, 6°) in Fig.9. The value of
γ means that the flow is laminar at γ = 0.0 and turbulent at
γ = 1.0 [17]. As the angle of attack increases, the transition
onset position at the pressure side goes backwards, whereas
this position at the suction side moves forward. The variation
of the transition points in the span wise direction is abrupt
near the attached region between the wing and the convex
geometry of the fuselage. The flow starts to be fully turbulent
near the wing tip after an angle of attack of 2° and the fully
turbulent region spreads to the inboard region of the wing
with an increase in the angle of attack.
In this chapter, the vortical structures predicted by
the three models will be investigated through vorticity
contours and skin friction lines. Although there is a small
discrepancy quantitatively between the numerical results
and experimental ones, previous research [6] showed the
qualitative similarity of the vortical structures between
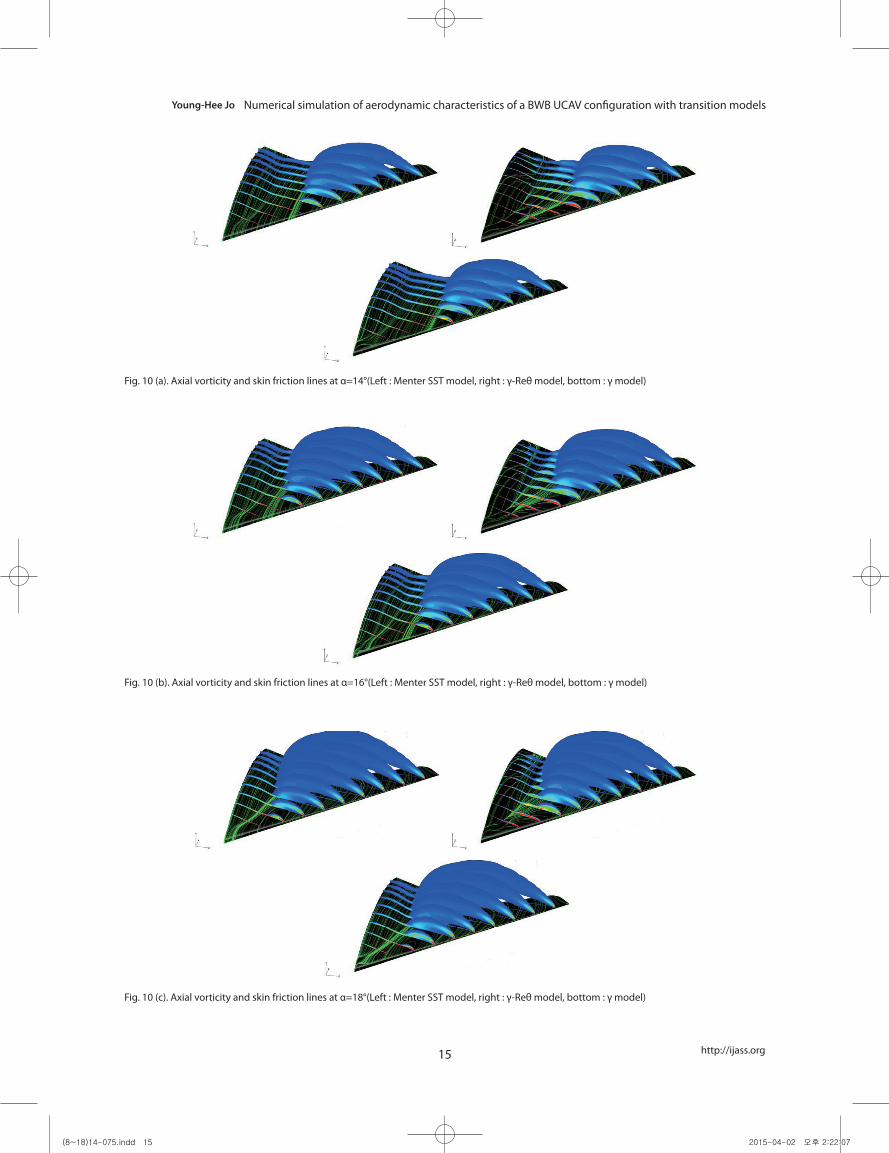
two methods. Fig. 10 shows the stream-wise vorticity (ωx)
contours with respect to each y-z plane in the cases with
the angles of attack, 14°, 16° and 18°, where the pitching
moment starts to nose down after the peak of the pitching
moment. The leading edge vortex is separated into two
primary vortexes and another vortex (the apex vortex) is
generated from the apex at the inner part of wing. The apex
vortex can be seen in the front of the MRP, which means this
vortex induces a vortex lift to add to the pitching moment
in the nose-up direction. This new apex vortex shares the
attachment point with the leading edge vortex and then
the attachment line is formed with a rapid decrease of the
vorticity magnitude, confirming that the vortex breakdown
was already ongoing. The skin friction lines over the upper
surface show a flow separation pattern near the apex. As
the angle of attack increases, vortex break down begins
to occur, the magnitude of the vortex decreases, and the
primary vortex in the inner part moves to the center (Fig.
10). The merger between the primary vortex and the apex
vortex can be seen at an angle of attack of 18° in Fig. 10. At
an angle of attack of 18°, two regions of laminar separation
and suction pressure overlap and then two vortexes at the
apex and leading edge start to merge. This phenomenon
with the two primary vortexes and apex one shows that
it can be captured clearly by two transitional models, but
the strength of the vortex predicted by the Menter SST
model was weak. Although laminar separation induces
the development of the skin friction line from the apex,
the vortex near the apex cannot be recognized clearly in
Fig. 10. The reason is that the round shape, which delays
the separation of the shear layer and depends more on
the adverse pressure gradient by the thickness, makes it
difficult to capture this vortex than the sharp one [9].
Figure 11 shows the contours of pressure coefficients
and skin friction lines at angles of attack of 6°, 12°, and 18°
to recognize the structure and position of the vortex of the
three models. At an angle of attack of 6°, where the pitching
moment starts to increase in the nose- up direction, wing
tip separation occurs at x/Croot = 0.8 and suction pressures
are forming from x/Croot = 0.4. The location of the separation
is aft of the moment center and this causes the onset of
lift loss and the nose-up pitching moment. However,
there are still attached flows near the leading edge of the
inboard wing. As the angle of attack increases, the region
of separation increases, which is to be formed in most parts
of the outboard wing, and the leading edge vortex moves
forward with an increase in magnitude. This confirmed that
the leading edge vortex starts to be formed at a distance
from the apex and moves forward in the aerodynamics
of the delta wing with a blunt leading edge. Finally, most
upper surfaces have a separation flow region of 18°. From
Fig. 9 Intermittency contours on lower and upper surface of γ model
(Blue : laminar flow, Red : turbulent flow)
Fig. 9. Intermittency contours on lower and upper surface of γ model (Blue : laminar flow, Red : turbulent flow)
(8~18)14-075.indd 14 2015-04-02 오후 2:22:06
15
Young-Hee Jo Numerical simulation of aerodynamic characteristics of a BWB UCAV configuration with transition models
http://ijass.org
Fig. 10 (a) Axial vorticity and skin friction lines at α=14°
(Top : Menter SST model, middle : γ-Reθ model, bottom : γ model)
Fig. 10 (a) Axial vorticity and skin friction lines at α=14°
(Top : Menter SST model, middle : γ-Reθ model, bottom : γ model)
Fig. 10 (a) Axial vorticity and skin friction lines at α=14°
(Top : Menter SST model, middle : γ-Reθ model, bottom : γ model)
Fig. 10 (a). Axial vorticity and skin friction lines at α=14°(Left : Menter SST model, right : γ-Reθ model, bottom : γ model)
Fig. 10 (b) Axial vorticity and skin friction lines at α=16°
(Top : Menter SST model, middle : γ-Reθ model, bottom : γ model)
Fig. 10 (b) Axial vorticity and skin friction lines at α=16°
(Top : Menter SST model, middle : γ-Reθ model, bottom : γ model)
Fig. 10 (b) Axial vorticity and skin friction lines at α=16°
(Top : Menter SST model, middle : γ-Reθ model, bottom : γ model)
Fig. 10 (b). Axial vorticity and skin friction lines at α=16°(Left : Menter SST model, right : γ-Reθ model, bottom : γ model)
Fig. 10 (c) Axial vorticity and skin friction lines at α=18°
(Top : Menter SST model, middle : γ-Reθ model, bottom : γ model)
Fig. 10 (c) Axial vorticity and skin friction lines at α=18°
(Top : Menter SST model, middle : γ-Reθ model, bottom : γ model)
Fig. 10 (c) Axial vorticity and skin friction lines at α=18°
(Top : Menter SST model, middle : γ-Reθ model, bottom : γ model)
Fig. 10 (c). Axial vorticity and skin friction lines at α=18°(Left : Menter SST model, right : γ-Reθ model, bottom : γ model)
(8~18)14-075.indd 15 2015-04-02 오후 2:22:07

DOI: http://dx.doi.org/10.5139/IJASS.2015.16.1.8 16
Int’l J. of Aeronautical & Space Sci. 16(1), 8–18 (2015)
the separation lines point of view, similar patterns are seen
between the SST model and the γ model. However, the
formations of suction pressures are similar between the
γ-Reθ model and the γ model.
Also, the reverse flow at the wing tip can be seen in the skin
friction line, which can be confirmed from the contour of the
axial velocity at the point of x/Croot = 0.8 in Fig. 12. The axial
velocity has a negative value near the wing tip at an angle of
attack of 8° and the generated vortex by this separation starts
to break down and its magnitude decreases from an angle of
attack of 8°, the ‘critical angle of attack’ [9]. All three models
predict reverse flows at the angle of attack of 8°.
4. Conclusions
The present study reports results of simulations of the
nonslender BWB UCAV configuration with one fully turbulent
Fig. 11 (a) Surface Cp contour and skin friction lines at α=6°
(Left : Menter SST model, middle : γ-Reθ model, right : γ model)
Fig. 11 (b) Surface Cp contour and skin friction lines at α=12°
Fig. 11 (c) Surface Cp contour and skin friction lines at α=18
Fig. 11(a). Surface Cp contour and skin friction lines at α=6°(Left : Menter SST model, middle : γ-Reθ model, right : γ model)
Fig. 11 (a) Surface Cp contour and skin friction lines at α=6°
(Left : Menter SST model, middle : γ-Reθ model, right : γ model)
Fig. 11 (b) Surface Cp contour and skin friction lines at α=12°
Fig. 11 (c) Surface Cp contour and skin friction lines at α=18
Fig. 11(b). Surface Cp contour and skin friction lines at α=12°
Fig. 11 (a) Surface Cp contour and skin friction lines at α=6°
(Left : Menter SST model, middle : γ-Reθ model, right : γ model)
Fig. 11 (b) Surface Cp contour and skin friction lines at α=12°
Fig. 11 (c) Surface Cp contour and skin friction lines at α=18 Fig. 11 (c). Surface Cp contour and skin friction lines at α=18°
(8~18)14-075.indd 16 2015-04-02 오후 2:22:07

17
Young-Hee Jo Numerical simulation of aerodynamic characteristics of a BWB UCAV configuration with transition models
http://ijass.org
model (Menter SST model) and two transition models
(the γ-Reθ and γ models). The predictive capabilities of the
two transition models were assessed from comparisons of
aerodynamic coefficients, pressure contours, skin friction
lines, and the vortical structures with experimental results [16].
In the comparisons of aerodynamic coefficients, the two
transitional models were better than the fully turbulent
model before and after the peak of the pitching moment. In
the plot of lift-to-drag ratio, the prediction of the γ model,
considering crossflow instability, was the best at low angles
of attack. This confirmed the crossflow instability by the
pressure gradient toward the span in the swept wing plays
a more important role in enhancing the transition than
Tollmien-Schlichting instability [19].
The findings through the contours of pressure coefficient
and skin friction line were 1) that at a zero angle of attack, a
fully turbulent model predicts all flows are attached without
separation; however, the two transitional models show
separation and re-attachment phenomena near the transition
onset locations, and 2) as the angle of attack increased,
separated flow was predicted near the leading edge in the case
of the γ-Reθ model, while the flow in the region of the inner part
of the wing and fuselage was attached in the other models.
In the analysis of the vortex breakdown and merging
between the primary vortex and the apex vortex, the prediction
by the fully turbulent model was too weak to capture this
phenomenon clearly, whereas the γ model predicted this
well, even though the stream-wise vorticity is smaller than
that of the γ-Reθ model. Also, the prediction of the transition
location in not only the upper surface, but also the lower one,
is important in predicting the aerodynamic coefficients.
In conclusion, the transition models should be
considered to simulate the low-speed flow around the BWB
UCAV configuration. In future studies, we will investigate
aerodynamic coefficients and flow structures numerically
when the control surfaces and the attached engine are
considered in a BWB configuration.
Acknowledgements
We acknowledge financial support from the Ministry of
Science, ICT & Future Planning, subject to the project EDISON
(EDucation-research Integration through Simulation On the
Net, NRF-2011-0020560).
References
[1] John D. Anderson, JR, Fundamentals of aerodynamics,
Fifth edition, McGraw-Hill.
Fig. 12 Axial velocity contours at x/c=0.8
Fig. 12. Axial velocity contours at x/c=0.8
(8~18)14-075.indd 17 2015-04-02 오후 2:22:07

DOI: http://dx.doi.org/10.5139/IJASS.2015.16.1.8 18
Int’l J. of Aeronautical & Space Sci. 16(1), 8–18 (2015)
[2] Earnshaw P. B. and Lawfird J. A., Low-speed wind-
tunnel experiments on a series of sharp-edge delta wings, ARC
Reports and Memoranda, No. 3424, 1964
[3] Gursul, I., Gordnier, R. and Visbal, M., “Unsteady
aerodynamics of nonslender delta wings,” Progress in
Aerospace Science, Vol. 41, 2005, pp. 515-557.
[4] Jmanes M. Luckring, Okko J. Boelens, “A unit-problem
investigation of blunt leading-edge separation motivated by
AVT-161 SACCON research,” NASA Technical Report, 2011
[5] Stephan C. Mcparlin, Robin J. Bruce, Anthony G.
Hepworth and Andrew J. Rae, “Low speed wind tunnel on
the 1303 UCAV concept,” 24th AIAA Applied Aerodynamics
Conference, AIAA 2006-2985, 2006.
[6] Andreas Schutte, Dietrich Hummel and Stephan M.
Hitzel, “Numerical and experimental analyses of the vortical
flow around the SACCON configuration,” 28th AIAA Applied
Aerodynamics Conference, AIAA 2010-4690, 2010.d
[7] Thomas D. Loeser, Dan D. Vicroy, and Andreas Schutte,
“SACCON static wind tunnel tests at DNW-NWB,” 28th AIAA
Applied Aerodynamics Conference, AIAA 2010-4393, 2010.
[8] Milne, M. E., and Arthur M. T., “Evaluation of bespoke
and commercial CFD methods for UCAV configuration,” 24th
Applied Aerodynamics Conference, AIAA 2006-2988, 2006.
[9] Vallespin D., Ronch A. Da, Badcock K.J., and Boelens
O., “Vortical flow prediction validation for an unmanned
combat air vehicle model,” Journal of Aircraft, Vol. 48, No. 6,
2011, pp. 1948-1959.
[10] Chi David, Chakravarthy Sukumar, and Goldberg Uri,
“Flow prediction around the SACCON configuration using
CFD++,” 28th AIAA Applied Aerodynamics Conference, AIAA
2010-4563, 2010.
[11] Petterson Kristian, “Low-speed aerodynamic and
flowfield characteristics of a UCAV,” 24th AIAA Applied
Aerodynamics Conference, 2006-2986.
[12] Arthur M.T., and Petterson K., “A computational study
of the low speed flow over the 1303 configuration,” 25th AIAA
Applied Aerodynamics Conference, 2007-4568, 2007.
[13] Le Roy, J. F., and Morgand S., “SACCON CFD static
and dynamic derivatives using elsA,” 28th AIAA Applied
Aerodynamics Conference, AIAA 2010-4562, 2010.
[14] Menter F.R., Langtry R. B., Likkl S. R., Suzen Y. B.,
Huang P. G.. and Volker S., “A correlation based transition
model using local variables Part 1 – model formulation,”
ASME-GT2004-53452, 2004.
[15] Menter F. R. and Smirnov P., “Laminar-turbulent
transition modeling based on a new intermittency model
formulation,” 11th World Congress on Computational
Mechanics, 2014.
[16] Shim H. J., Park S. O. and Oh S. Y., “An experimental
study on aerodynamic coefficients of a tailless BWB UCAV,”
KSAS Spring Conference, 2013, pp. 110~113
[17] ANSYS FLUENT User’s Guide.
[18] Shan H., Jiang L. and Liu C., “Direct numerical
simulation of flow separation around a NACA 0012 airfoil,”
Computers & Fluids, Vol. 34, 2005, pp. 1096-1114.
[19] Shivaji M., Correlation-based transition modeling
for external aerodynamic flows, Ph. D. diss., University of
Maryland College Park, 2014.
(8~18)14-075.indd 18 2015-04-02 오후 2:22:08