numerical analysis of deformation and stability in the
TRANSCRIPT

Master Thesis
Numerical analysis of deformation and stability in the formation for railway tracks
Submitted by:
Shah Nawaz Khan 117832
Reg.-Nr.: NHRE/2018/18
Under the supervision of:
Prof. Dr.-Ing. habil.Torsten Wichtmann MSc. Cristian D Rodriguez
BAUHAUS-UNIVERSITÄT WEIMAR GERMANY
Faculty of Civil Engineering
Chair of Geotechnical Engineering

ii
DECLARATION
Hereby, I declare that I worked on this Master Thesis independently in close consultation with the supervisors and using only the specified sources and programs which are referred.
Weimar, Day. Month. Year Name
Shah Nawaz Khan
(Signature)

iii
ACKNOWLEDGEMENT
I wish to express my gratitude to certain people who have given me direction, moral and technical supports. And encouraged me during this master study program.
First of all I would like to thank my parents for their love, prayers, and moral supports.
Secondly special gratitude goes to Engr. ZafarUllah Kalwar Additional General Manager/Infrastructure (AGM/I) Railways Head Quarter office Lahore Pakistan Railways who has given me this opportunity to study abroad and extended his technical advices/guidance and encouraged me to get this prestigious degree in stipulated time. This degree will help me definitely in my future career and will be able me to serve Pakistan Railways in better way.
I am also thankful to Prof. Dr.-Ing. habil.Torsten Wichtmann Chair for Geotechnical Engineering Bauhaus University Weimar Germany for his technical advices and guidelines in the fulfillment of this master thesis.
I am grateful to Mr. Cristian D Rodriguez and Mr.Patrick Staubach for their valuable consultation in the PLAXIS-2D and timely supervision of my work during my master thesis.

iv
ABSTRACT
Over the past few decades, the increasing demands of railways operations in the form of heavy loading and high speed have been noticed. Railway formation and ballast deform progressive under heavy axle cyclic loading, therefore the rail track needs proper design of ballast and formation bed to achieve the desire stiffness and stability for the safe and sound serviceability of the track. For the overall stability of the track on soft formation, the ground is improved by different techniques prior to the construction on that, in order to avoid the failure and differential settlement during the designed trains operation.
The numerical analyses illustrate that the total deformation and bearing capacity of the railway tracks mostly depend on the changes in the friction angle and cohesion of the selected soils of the subgrade. To avoid failure in the formation of track under the design loads, the proper selection of types of soils, its layer thickness, well compaction during construction and provision of proper track drainage system are extremely important. For the construction of new railway tracks the soils having greater values of friction angle, cohesion and elastic stiffness with the well graded ballast cushion under the sleepers of designed side slopes can be used to reduce the maintenance cost, considerably increase the life time of the components of the tracks and ultimately give better performance of the tracks.
Keywords: railway track, ballast, subgrade, numerical modeling, drainage, track maintenance, PLAXIS 2D

v
TABLE OF CONTENTS
DECLARATION ................................................................................................................................ ii
ACKNOWLEDGEMENT ................................................................................................................ iii
ABSTRACT ....................................................................................................................................... iv
TABLE OF CONTENTS ................................................................................................................... v
LIST OF FIGURES ........................................................................................................................ viii
LIST OF TABLES ............................................................................................................................ xi
ABBREVIATIONS .......................................................................................................................... xii
DEFINITIONS ................................................................................................................................ xiv
CHAPTER 1 ....................................................................................................................................... 1
1. INTRODUCTION ...................................................................................................................... 1
1.1 FORMATION .......................................................................................................................... 3
1.2 Functions .................................................................................................................................. 3
1.3 Types of embankment .............................................................................................................. 3
1.4 Modes of failure in formation .................................................................................................. 3
1.5 Cross-sections of formation ..................................................................................................... 5
CHAPTER 2 ....................................................................................................................................... 6
2. DESIGN OF FORMATION ...................................................................................................... 6
2.1 Calculation of rail seat load ...................................................................................................... 6 2.1.1 ORE method ..................................................................................................................... 6 2.1.2 AREA method .................................................................................................................. 7 2.1.3 Equivalent dynamic wheel load ....................................................................................... 8
2.2 Action under the Load .............................................................................................................. 8
2.3 Gaussian distribution curves and sub-grade pressure .............................................................. 8 2.3.1 Calculation of contact pressure for new track .................................................................. 9 2.3.2 Pressure distribution pattern beneath sleeper in existing track ...................................... 12 2.3.3 Pressure distribution pattern beneath different types of sleeper .................................... 12
2.4 Stress limitation for ideal sub grade ....................................................................................... 13
vi
CHAPTER 3 ..................................................................................................................................... 15
3. BALLAST ................................................................................................................................. 15
3.1 Functions of ballast ................................................................................................................ 15
3.2 Requirements for ideal ballast ................................................................................................ 15
3.3 Materials for ballast ................................................................................................................ 16
3.4 Calculation of ballast layer thickness ..................................................................................... 16
3.5 Classification of tracks in Pakistan ........................................................................................ 17
3.6 Ballast characteristic limits .................................................................................................... 18 3.6.1 Role of ballast fouling on track performance ................................................................. 19 3.6.2 Percentage void contamination in Ballast ...................................................................... 20
3.7 Consequences of fouled ballast .............................................................................................. 21
CHAPTER 4 ..................................................................................................................................... 23
4. FINITE ELEMENT ANALYSIS ............................................................................................ 23
4.1 Characteristic of the track models .......................................................................................... 23 4.1.1 Single Line Track ........................................................................................................... 23 4.1.2 Double Lines Track ........................................................................................................ 24
4.2 Vertical deformation .............................................................................................................. 25 4.2.1 Effect of cyclic loading frequency on the permanent deformation of the track ............. 26 4.2.2 Input parameters for dynamic load ................................................................................ 27
4.3 PLAXIS 2-D RESULTS FOR ELASTOPLASTIC CONSTITUTIVE MODELS................ 30 4.3.1 For single line in wet condition ...................................................................................... 30 4.3.2 For single line in dry condition ...................................................................................... 34 4.3.3 For double lines in wet condition ................................................................................... 37 4.3.4 For double lines in dry condition ................................................................................... 40
4.4 Summary of displacements and Safety Factors under different conditions ........................... 43
4.5 PLAXIS 2-D RESULTS FOR HYPOPLASTIC CONSTITUTIVE MODELS .................... 44
4.6 Settlements ............................................................................................................................. 47
4.7 Material model and properties ............................................................................................... 49 4.7.1 For single line under wet condition ................................................................................ 49 4.7.2 For single line under dry condition ................................................................................ 50
4.8 Physical properties of sand and clay ...................................................................................... 51
4.9 Ideal soil for preparation of formation bed for railway’s track .............................................. 51
4.10 C-ϕ reduction method ......................................................................................................... 53
4.11 Soil selection criteria for the construction of embankment for new railway line .............. 55
vii
4.11.1 Effect of geogrid location and layering ...................................................................... 59
4.12 Common errors and accuracy in the FEM software PLAXIS. ........................................... 61
4.13 Results and discussion ........................................................................................................ 61
CHAPTER 5 ..................................................................................................................................... 62
5. FILLING MATERIALS FOR SUBGRADE ......................................................................... 62
5.1 Improved soil include ............................................................................................................. 62 5.1.1 Physical improved soil ................................................................................................... 62 5.1.2 Chemical improved soil ................................................................................................. 63
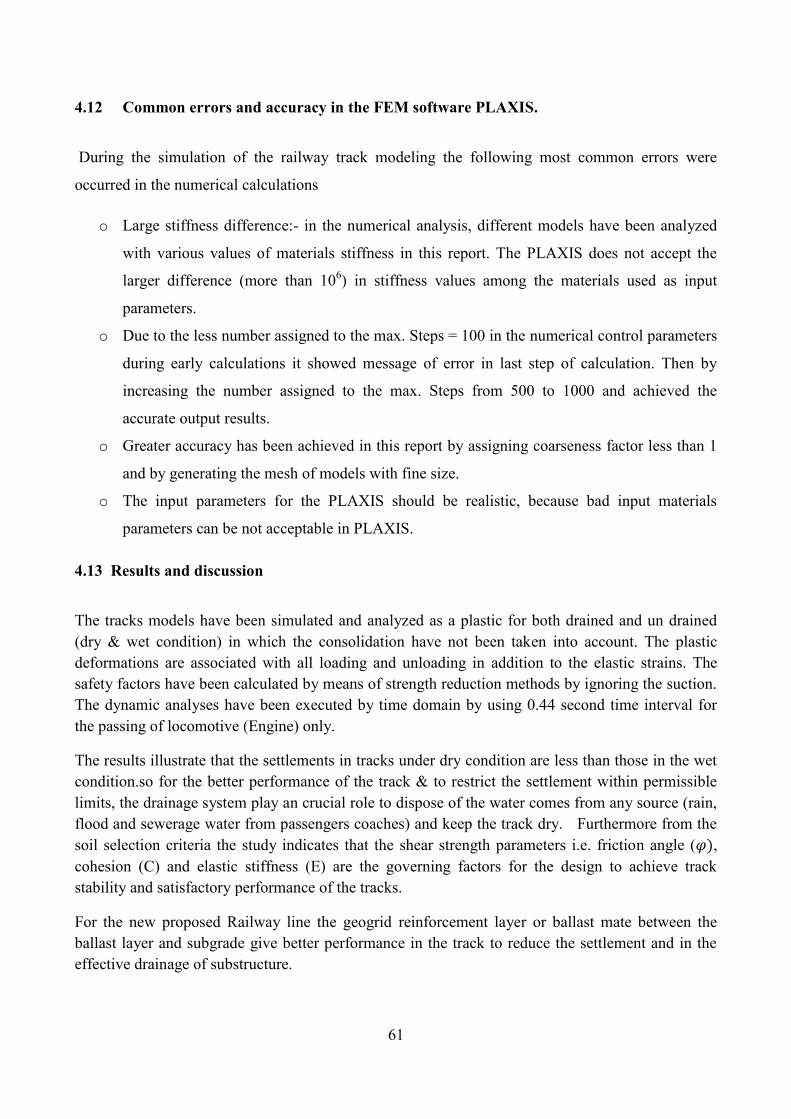
5.2 Foundation consolidation design of subgrade ........................................................................ 63 5.2.1 Packed drain ................................................................................................................... 63 5.2.2 Dynamic compaction ..................................................................................................... 64 5.2.3 Gravel/sand piles ............................................................................................................ 64 5.2.4 Cement -mixed pile ........................................................................................................ 65 5.2.5 Pre-stress pipe pile ......................................................................................................... 66 5.2.6 Concrete core mining pile .............................................................................................. 66 5.2.7 T-shaped cement -mixed pile ......................................................................................... 67 5.2.8 Removal /replacement .................................................................................................... 67
CHAPTER 6 ..................................................................................................................................... 69
6. TRACK DRAINAGE ............................................................................................................... 69
6.1 Causes of failure of drainage system ..................................................................................... 73
CHAPTER 7 ..................................................................................................................................... 75
7. SPECIFICATIONS AND RECOMMENDATIONS ............................................................ 75
8. REFERENCES ......................................................................................................................... 79
viii
LIST OF FIGURES
Figure 1-1: Typical cross-section of railway track .............................................................................. 1
Figure 1-2: Embankment failure .......................................................................................................... 3
Figure 1-3: Overflow of flood water and side drains ........................................................................... 4
Figure 2-1: Sleeper dimension for calculation ..................................................................................... 9
Figure 2-2: Calculation of contact pressure ......................................................................................... 9
Figure 2-3: Cross-section of one side of sleeper ................................................................................ 10
Figure 2-4: Rail seat & sleeper cross-section [1] ............................................................................... 10
Figure 2-5: Pressure distribution under sleeper in old track .............................................................. 12
Figure 2-6: Pressure distribution for different types of sleeper ......................................................... 13
Figure 2-7: Distribution of force of the wheel load to the sub soil .................................................... 14
Figure 3-1: Ballast cushion ................................................................................................................ 17
Figure 3-2: Ballast contamination process ......................................................................................... 19
Figure 3-3: Fouled ballast under PSC sleepers (Rawalpindi division) .............................................. 20
Figure 3-4: Percentage of ballast contamination by different sources ............................................... 21
Figure 3-5: Crushed sleepers due to the fouled ballast ...................................................................... 22
Figure 4-1: Failure pattern of embankment under single line ............................................................ 24
Figure 4-2: Failure pattern of embankment under double track ........................................................ 25
Figure 4-3: Relationship between ϵv and BBI [10] ............................................................................ 27
Figure 4-4: Track cross section & wheel axle distance of Locomotive ............................................. 28
Figure 4-5: External axle of the passenger coach .............................................................................. 28
Figure 4-6: Acceleration Vs Dynamic time for passing Locomotive only ........................................ 29
Figure 4-7: Velocity Vs Dynamic time for Locomotive only ............................................................ 29
Figure 4-8: Deformed mesh under initial condition ........................................................................... 30
Figure 4-9: Deformed mesh for c-phi reduction ................................................................................ 30
Figure 4-10: Deformed mesh under external loading ........................................................................ 31
Figure 4-11: Total displacement under loading ................................................................................. 31
Figure 4-12: Safety after loading ....................................................................................................... 32
Figure 4-13: Total displacement (Ux) ................................................................................................ 32
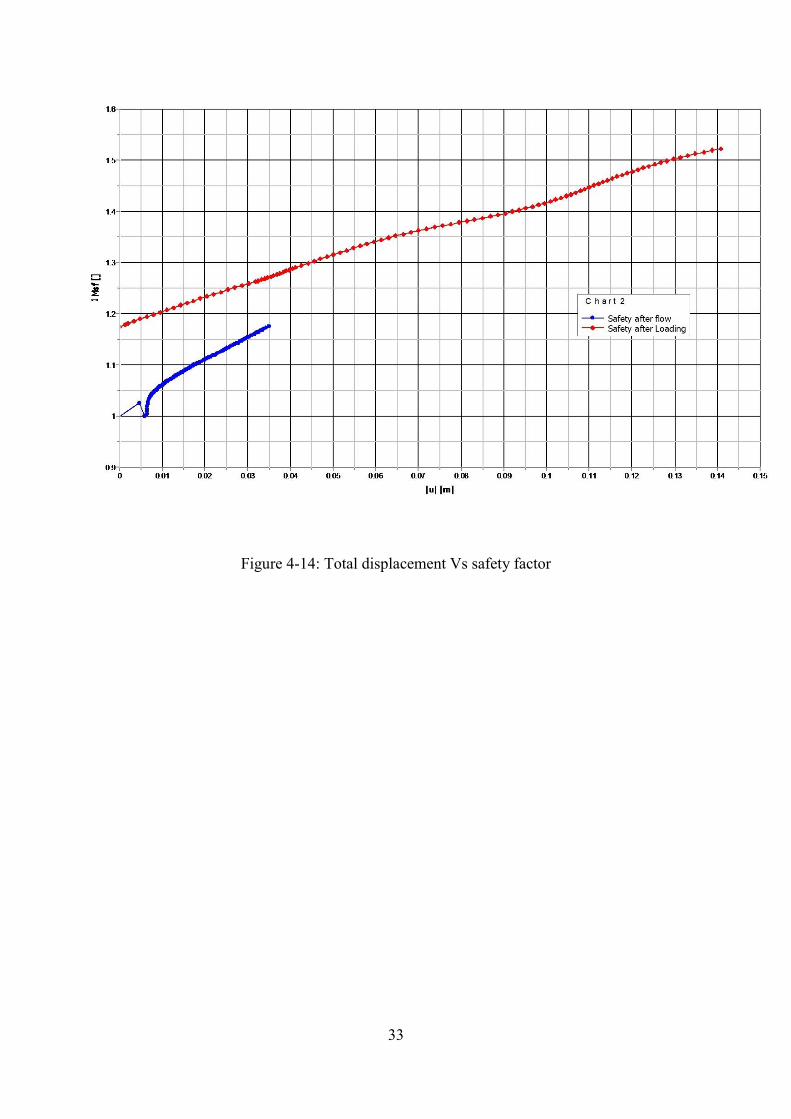
Figure 4-14: Total displacement Vs safety factor .............................................................................. 33
Figure 4-15: Deformed mesh (initial condition) ................................................................................ 34

ix
Figure 4-16: Safety after initial phase ................................................................................................ 34
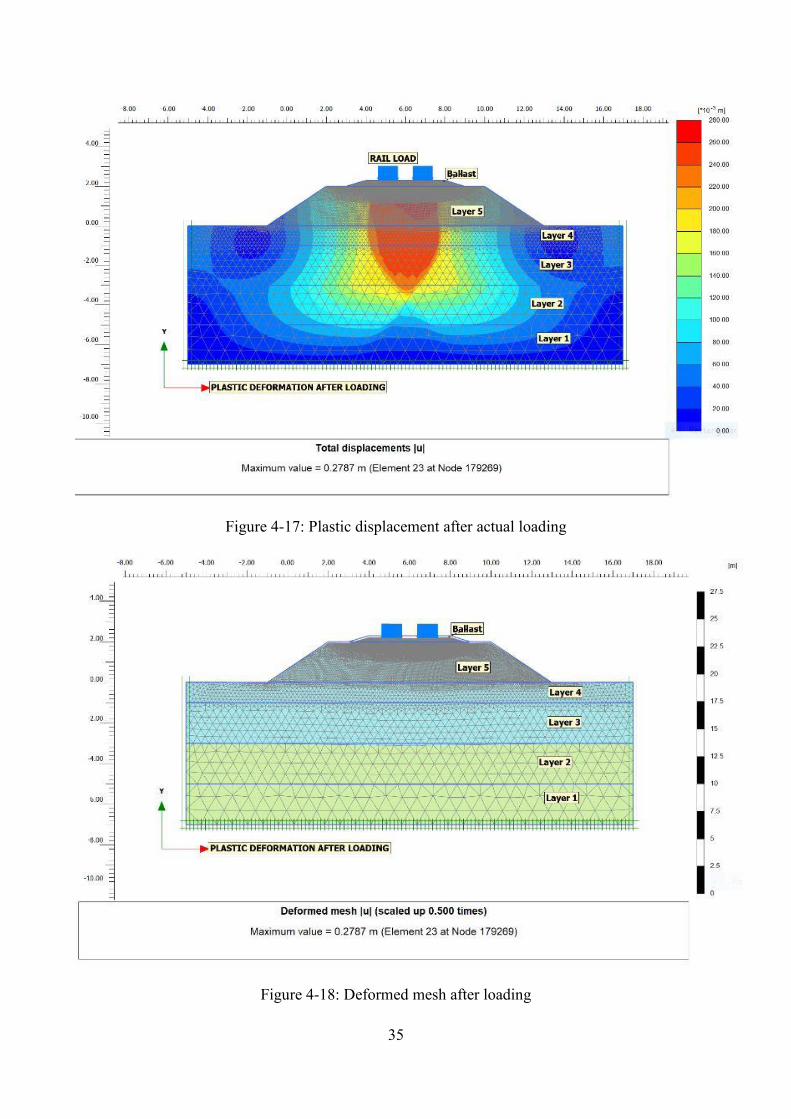
Figure 4-17: Plastic displacement after actual loading ...................................................................... 35
Figure 4-18: Deformed mesh after loading ........................................................................................ 35
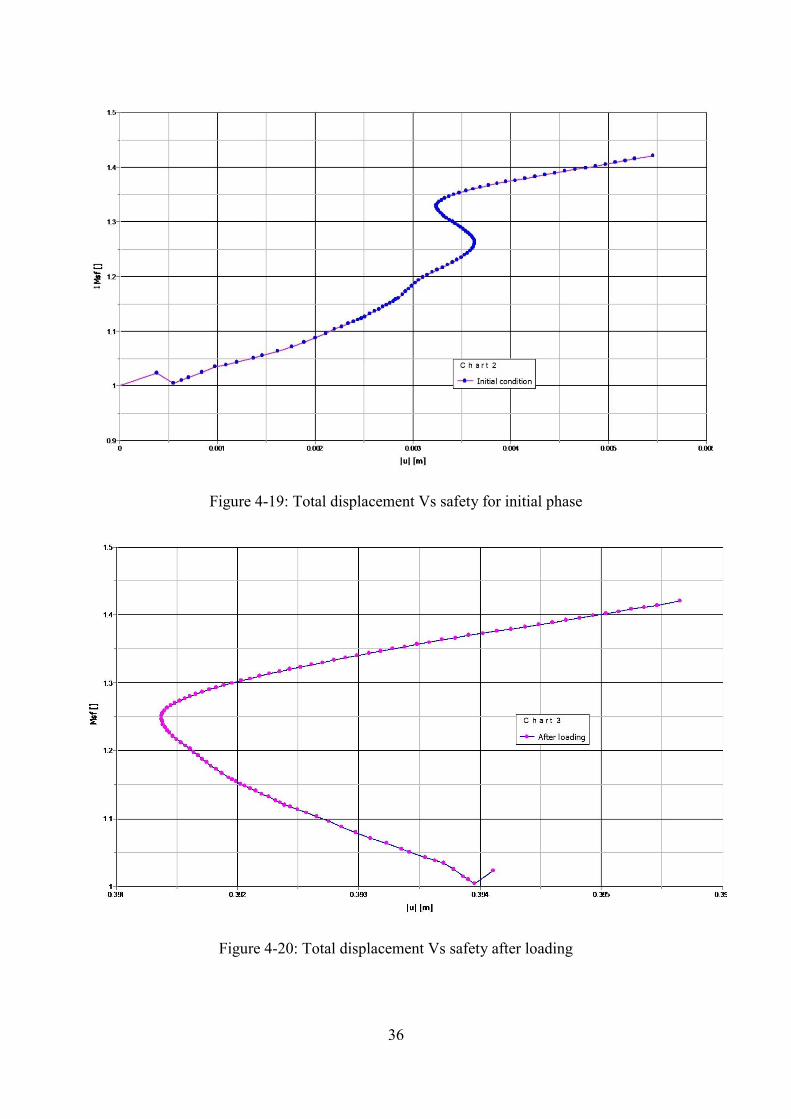
Figure 4-19: Total displacement Vs safety for initial phase .............................................................. 36
Figure 4-20: Total displacement Vs safety after loading ................................................................... 36
Figure 4-21: Deformed mesh under loading ...................................................................................... 37
Figure 4-22: Total deformation (Ux) under loading ........................................................................... 37
Figure 4-23: Total displacement (Uy) in safety phase ........................................................................ 38
Figure 4-24: Total displacement (Ux) in safety .................................................................................. 38
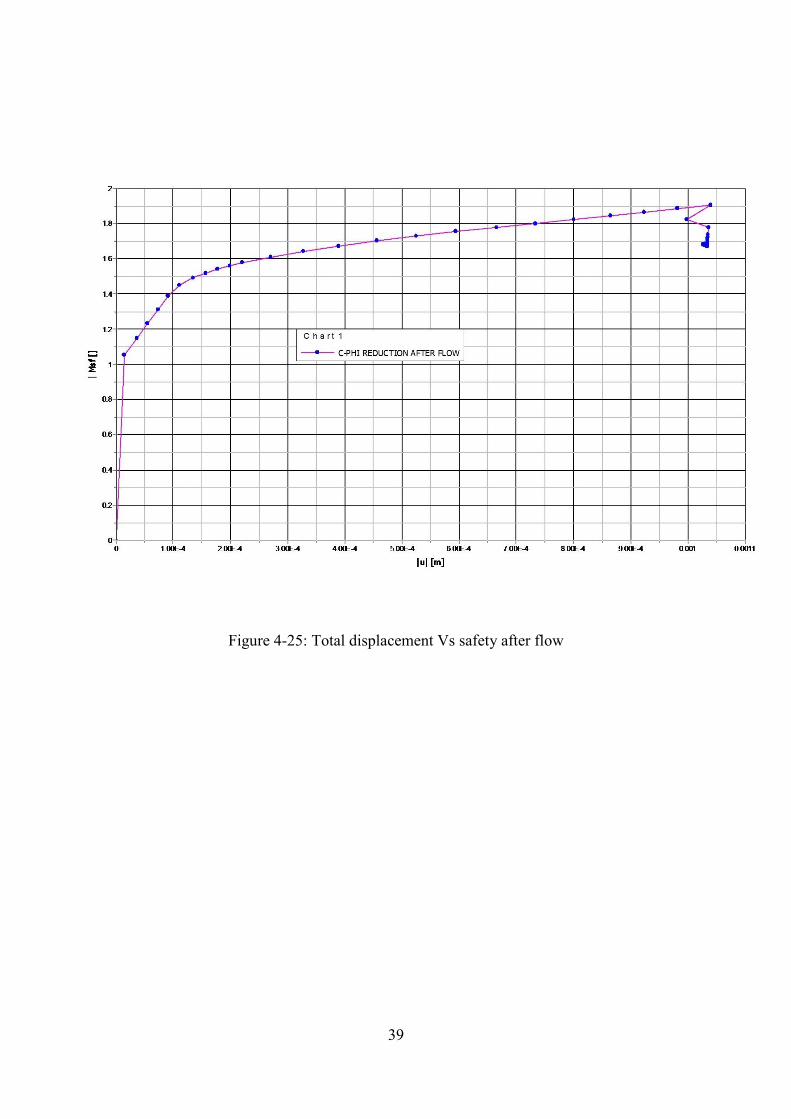
Figure 4-25: Total displacement Vs safety after flow ........................................................................ 39
Figure 4-26: Deformed mesh for plastic phase .................................................................................. 40
Figure 4-27: Total displacement ........................................................................................................ 40
Figure 4-28: Total displacement in safety phase ................................................................................ 41
Figure 4-29: Total displacement (Ux) in safety phase ........................................................................ 41
Figure 4-30: Deformed mesh under actual loading ............................................................................ 42
Figure 4-31: Total displacement under actual loading ....................................................................... 42
Figure 4-32: Total displacement Vs Safety both for initial phase & under loading .......................... 43
Figure 4-33: Deformed mesh under plastic phase .............................................................................. 44
Figure 4-34: Total displacement under plastic phase ......................................................................... 45
Figure 4-35: Total displacement under safety phase after flow ......................................................... 45
Figure 4-36: Active pore pressure for double lines track ................................................................... 46
Figure 4-37: Total displacement Vs Safety ........................................................................................ 46
Figure 4-38: Embankment failure on the top of flood opening (over flow of water in culvert) ........ 47
Figure 4-39: Settlement due to failure in side slope during heavy rain fall in monsoon in Multan division in year 2013. ......................................................................................................................... 48
Figure 4-40: Possible failure surface in the double tracks ................................................................. 53
Figure 4-41: Estimated total displacement due to the (a) Cohesion; (b) friction angle; (c) elastic stiffness .............................................................................................................................................. 56
Figure 4-42: Settlement pattern initial phase for the case study No.4 ............................................... 57
Figure 4-43: Settlement pattern under the loading for the case study No.4 ....................................... 58
Figure 4-44: Effect of geogrid layer ................................................................................................... 60
Figure 4-45: Settlement in case of geogrid layer ............................................................................... 60
x
Figure 5-1: Compaction of formation bed ......................................................................................... 62
Figure 5-2: Working on packed drains in progress ............................................................................ 63
Figure 5-3: working on dynamic compaction in progress ................................................................. 64
Figure 5-4: Stone column installation process ................................................................................... 65
Figure 5-5: Piles in yard ..................................................................................................................... 65
Figure 5-6: Pre-stress piles ................................................................................................................. 66
Figure 5-7: Injection process of concrete core ................................................................................... 66
Figure 5-8: Diagram showing the T- shaped piles injection process ................................................. 67
Figure 5-9: Diagram showing the typical cross section of removal and replacement works ............ 68
Figure 6-1: Rain water in the middle of track due to the poor drainage ............................................ 69
Figure 6-2: Cross section of drainage in hilly area ............................................................................ 70
Figure 6-3: Track settlement due to the poor drainage ..................................................................... 70
Figure 6-4: Ballast mixed with soil layer ........................................................................................... 71
Figure 6-5: Cracked sleeper due to the underneath rigid surface (Fouled ballast) ............................ 72
Figure 6-6: The formation washed away by flood water (Multan Division) ..................................... 73
Figure 6-7: Inadequate side drains along the track (Rawalpindi-Lahore section) ............................. 74
Figure 7-1: Twin block sleepers in Main line (Rawalpindi to Lahore section) ................................. 75
Figure 7-2: Track maintenance through track machine ..................................................................... 76
Figure 7-3: Track maintenance through labors (manually) ................................................................ 76
Figure 7-4: Kacha & pacca side drains .............................................................................................. 77

xi
LIST OF TABLES
Table 1: Cross sections of formation ................................................................................................... 5
Table 2: Pressure distribution for rail seat load ................................................................................. 11
Table 3: Calculation of pressure distribution for different sleepers ................................................... 13
Table 4: Track Classification in PR. .................................................................................................. 17
Table 5: Ballast specification for PR ................................................................................................. 18
Table 6: Gradation of ballast .............................................................................................................. 18
Table 7: Summery of calculation ....................................................................................................... 43
Table 8: Hypo plastic parameters for Karlsruhe sand ........................................................................ 44
Table 9: Track tolerances ................................................................................................................... 49
Table 10: Input parameters for single line ......................................................................................... 49
Table 11: Input parameters for single line ......................................................................................... 50
Table 12: Input parameters for double lines tracks ............................................................................ 50
Table 13: Selection of soil for subgrade ............................................................................................ 52
Table 14: Different subgrade properties used in parametric study .................................................... 55
Table 15: Displacement with and without geogrid layer ................................................................... 59

xii
ABBREVIATIONS
PR ..................... Pakistan Railways
PSC .................. Pre-Stressed Concrete Sleepers
UIC ................. International Union of Railways
ORE ................ Office of Research and Experiments of UIC
AREMA ........... American Railways Engineering and Maintenance of way Association.
AREA .............. American Railway Engineering Association
HST .................. High speed trains
B.G ................... Broad gauge 1676mm (5'-6'')
M.G .................. Meter gauge 1000mm (3'-3
'')
N.G .................. Narrow gauge 762mm (2'-6'')
Q0 .................... Static Load of the Train
Pd ...................... Design Rail-seat Load (Normal service dynamic loading)
B.M .................. Bending Moment
Mdr +ve .............. Design positive (sagging) Bending moments at rail-seat
Mdr-ve ............... Design negative (hogging) Bending moments at rail-seat
Mdc-ve ............... Design negative (hogging) Bending moments at sleeper center
Mdc +ve .............. Design positive (sagging) Bending moments at sleeper center
ϒp .................... Factor to dynamic increment to reflect rail-pad attenuation
ϒv .................... Normal service dynamic increment determining the effect of speed
ϒd .................... Factor to allow for load distribution between sleepers
ϒr .................... Partial Factor to allow for irregularities in the longitudinal support of the sleepers
DIF .................. Dynamic impact factor (Dimensionless, greater than 1)
K1 .................... Impact factor representing exceptional load case
K2 .................... Impact factor representing accidental load case

xiii
Ic ...................... Second moment of area at sleeper center section
Ir ....................... Second moment of area at rail-seat section
CTR ................ Complete Track Renewal
SR ................... Sleepers Renewals
RR ................... Rail Renewal
P-Way ............. Permanent Way (Track)
H.F.L ............... Highest Flood Level.
N.S.L ............... Natural Surface Level
S.E ................... Super Elevation
Main line .......... The railway tracks connecting the big cities (in PR system).
Branch line ....... The railway tracks connecting the small cities (in PR system).
CBR ................ California bearing ratio
CD ................... test consolidated drained test
CU ................... test Consolidated un-drained test
UU .................. test Un-consolidated un-drained test
VCI ................. Void Contamination Index.
SF .................... Safety factor
C ...................... Cohesion
V ..................... speed of train
ɸa , ɸv .............. Cyclic axial and volumetric strain ratio respectively
ʄ ...................... cyclic frequency
N ..................... number of load cycles
BBI .................. Ballast Breakage Index
v ..................... Volumetric strain
SOF ................ Single degree of freedom
xiv
DEFINITIONS
Formation: It is a naturally occurring soil, which is prepared to receive the ballast, sleeper & rails for constructing the railway track. This prepared surface is called formation or subgrade.
Permanent-Way: In the old terminology the Railway track is also called Permanent- Way (P-Way).
Cess: The portion of sub-grade from the toe of the ballast to the outer edge of the formation.
Ballast: The crushed stones around the sleepers and under the sleepers of desired specification.
Shoulder Ballast: The ballast placed outside from the end of sleeper on both sides
Ballast Tamping: It is the process in which re-adjustment the geometry of the track, dressing of ballast around and beneath the sleepers are done using either track machine or manually for providing smooth and homogenous surface for safe operation of the trains.
Sub-soil: Soil of natural ground surface below the formation bed and embankment fill.
Track gauge: The distance between the running faces of the two rails. (B.G=5'-6''=1676.4mm)
Cant: The amount by which one gauge rail is raised w.r.t the other to accommodate the centrifugal force is also called Super-elevation of the track.
Sleepers: The component of the track to hold the rails to correct gauge and transfer the wheel load coming through rails to the ballast.
Sleeper: Density: The number of sleepers used per Rail length specified by
(N + X). One Rail length=14 m UIC54
Types of sleepers: Different kinds of sleepers are used in the railway track i.e. wooden sleepers, Pre-stressed concrete sleepers, sleet trough sleepers, R.C.C twin Blocks Sleepers.
UP trains & track: Trains running towards Peshawar are UP trains. The tracks that carry them are UP tracks or UP lines.
DN trains & tracks: Trains running away from Peshawar are DN trains. The tracks that carry them are DN tracks or DN lines.

xv
Route Kilometer: is the length of a section from beginning to the end of the section
Track kilometer: is the length of section of track multiplied by the number of track
Track geometry: The horizontal, vertical alignment, cross level and super elevation of the track.
Track Drainage: The removal of water from the substructure of the track.
Track Machine: The machine used for the maintenance for the railway track, by dressing of ballast, alignment, gauging, tightening of fitting & fastening etc.
Through Packing: The procedure for the casual maintenance of the track by opening, gauging, alignment, and packing [OGAP] through Labor Manually.
Track maintenance Standard: it includes the safety, smooth running, economy and neatness.
Station Limits: The portion of the track length in between the UP and DN outer signals.
Settlement: The vertical deformation of soil layer due to stress changes.
Consolidation: The process in which the water content is decreased of the saturated soil without replacement of voids with air.
Swelling: The process in which the water content is increased due the increase in volume of voids.

1
CHAPTER 1
1. INTRODUCTION
Railways are considered as the most economical, safe and environmental friendly mode of transportations. Therefore railway tracks are built to carry either passengers or goods from one part of the country to another part, and thus work as backbone in the national & international economy. The track structures are anticipated to guide and facilitate the safe, cost effective and smooth rides of any operation.
Figure 1-1 represents the main important components making typical railway track. The track components can be further divided into the two main sections: superstructure and substructure. The most important components of the track are rails, rail pads, sleepers and fitting & fastening (Bolts & Nuts) make a section that is called as the superstructure. The substructure section is related to the geotechnical components comprising of ballast, sub-ballast and subgrade (formation). Both superstructure and substructure sections play an important role in the safety, comfort of passengers, and the quality ride of the trains as a whole.
Figure 1-1: Typical cross-section of railway track
The sub grade is an integral part of railway track design; the overall performance of the track depends on the factors which directly influence the ultimate quality, required maintenance and
2
performance of subgrade, amongst others the type of soil, its shear strength, moisture content, consolidation and stiffness parameters.
The numerical simulations have been conducted in this study using finite element method (FEM) implemented in PLAXIS-2D in order to identify the most relevant factors on the complex behavior of railway tracks under different conditions. The geometry of the tracks and its components specifications have been chosen from PAKISTAN RAILWAYS for ‘Mix Passenger Freight Main Lines’ for both single and double lines cross-sections.
In this study of formation design, on one hand it has been considered that one existing old track and one is newly laid track besides the old track making double tracks cross sections, on the other hand the totally new proposed single line track has been considered on new formation bed with fresh ballast for the different load assumption according to the UIC 713R and AREMA standard design codes.
The track gauge (B.G) length is 1676.4 mm, the length of PSC sleepers is 2750mm, center to center spacing between two consecutive sleepers 610 mm, ballast cushion 300 mm, of size 50 mm, the embankment shoulder slope 1.5H : 1V and 625 mm wide ballast shoulder, the Rail Type is UIC54. Axle load 25 ton is considered with the moving speed from 120 to 160 km/h.
The soil and ballast specifications have been tabulated in next pages.
3
1.1 FORMATION
The formation bed has to be prepared in compacted soil layers to be safe against the shear failure, and accumulated/plastic deformations under the heavy axle moving loads. The prepared surface has to perform the following basic functions as a subgrade of the tracks.
1.2 Functions
To distribute the weight of train, track & ballast over a wide area of natural ground. To facilitate good drainage. To provide stability to the track. To provide smooth & uniform bed on which the track can be laid.
1.3 Types of embankment
Fill Cut
The geometry of track’s embankment depends upon the ground topography, alignment of the track, highest flood level, number of tracks, gauge of the track, side slopes, overhauling loading, bearing capacity of the soils and the future extension plans of the government.
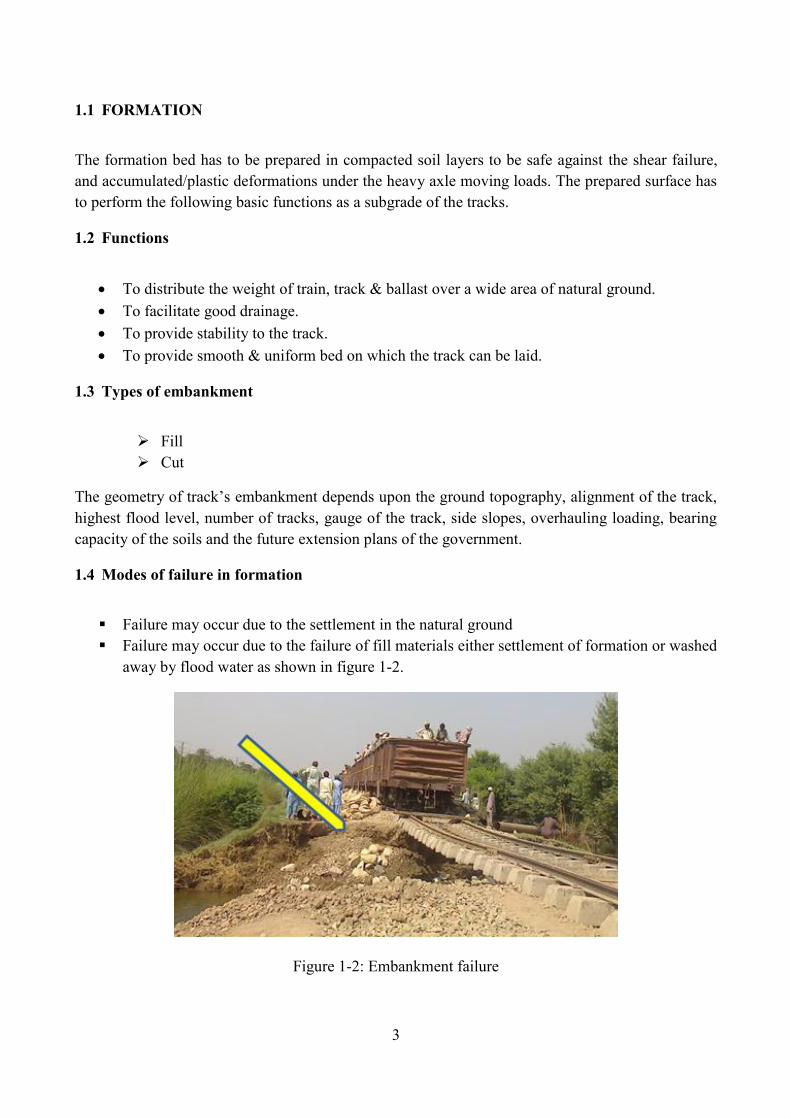
1.4 Modes of failure in formation
Failure may occur due to the settlement in the natural ground Failure may occur due to the failure of fill materials either settlement of formation or washed
away by flood water as shown in figure 1-2.
Figure 1-2: Embankment failure
4
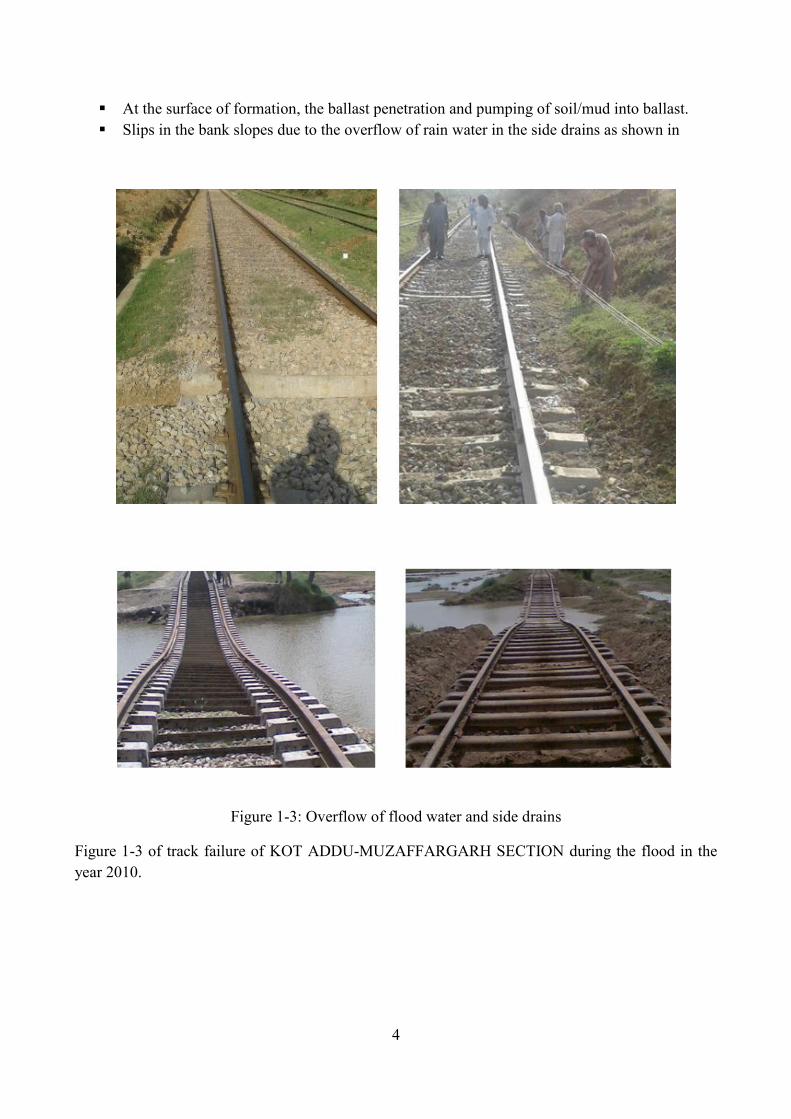
At the surface of formation, the ballast penetration and pumping of soil/mud into ballast. Slips in the bank slopes due to the overflow of rain water in the side drains as shown in
Figure 1-3: Overflow of flood water and side drains
Figure 1-3 of track failure of KOT ADDU-MUZAFFARGARH SECTION during the flood in the year 2010.

5
1.5 Cross-sections of formation
Formation width for different track gauges are tabulated as under,
Table 1: Cross sections of formation
Formation width B.G (ft.) M.G (ft.) Rail type Remarks
In filling 20-0 16-0 90R Single line
22-0 16-0 100RE Single line
37-6 29-0 ------ Double line
In cutting 18-0 14-0 ------ Single line
33-6 27-0 ------ Double line

6
CHAPTER 2
2. DESIGN OF FORMATION
There are various design standards which are used in different countries for the design of railway tracks which are as follow.
1. Australia (AS 1085.14, 2012) 2. USA (AREMA,2006) 3. Europe (EN 13230,2009) 4. International Union of Railways ( UIC 713 R) 5. South African Railways codes
All the above design codes follow the same basic approaches with minor differences according to the local/national track’s components specifications, load parameters and tracks geometry.
In order to construct a formation, that gives services without any trouble even in the most adverse conditions of traffic loading, maintenance and environment, the proper design procedures should be adopted by keeping all design parameters into account. The ideal formations which give sound services have the following characteristic;
i. The formation should not be fail in shear strength under the self-load & live load. ii. There should not be considerable settlement & deformation in the subgrade.
2.1 Calculation of rail seat load
Design rail load calculation is an important step in the design of subgrade for rail tracks. In this report the axle load of 25 tons has been taken for diesel locomotives, which are used in PR.
2.1.1 ORE method
Design rail seat load (qr) can be calculated from Equation 1 According to UIC 713R.
qr = ϒi * Pd
qr = ϒi * *(1+ ϒp ϒv) * ϒd ϒr [1]………………………….Eq. 1
Where,
Q0 = 250 KN = (25 Ton axle load which is load requirement in year 2020)
P = wheel load
ϒi = 1.6 = Support irregularity safety factor as recommended by UIC 713R
ϒp = 1.0 = Rail pad attenuation factor as per UIC 713R
7
ϒv = 0.5 (As Per UIC 713R recommendation for the speed less than 125 mph)
ϒd = 0.5 distribution factor
(UIC 713 R recommends for sleepers spacing less than 25.6 inches)
ϒr = 1.35 Reaction support fault safety factor
As per UIC 713 Recommendation then equation-1 putting all values, we get
qr = 1.6 *
* ( 1+ 1.0 * 0.5) * 0.5 * 1.35) …………………Eq.1
qr = 202.5 KN
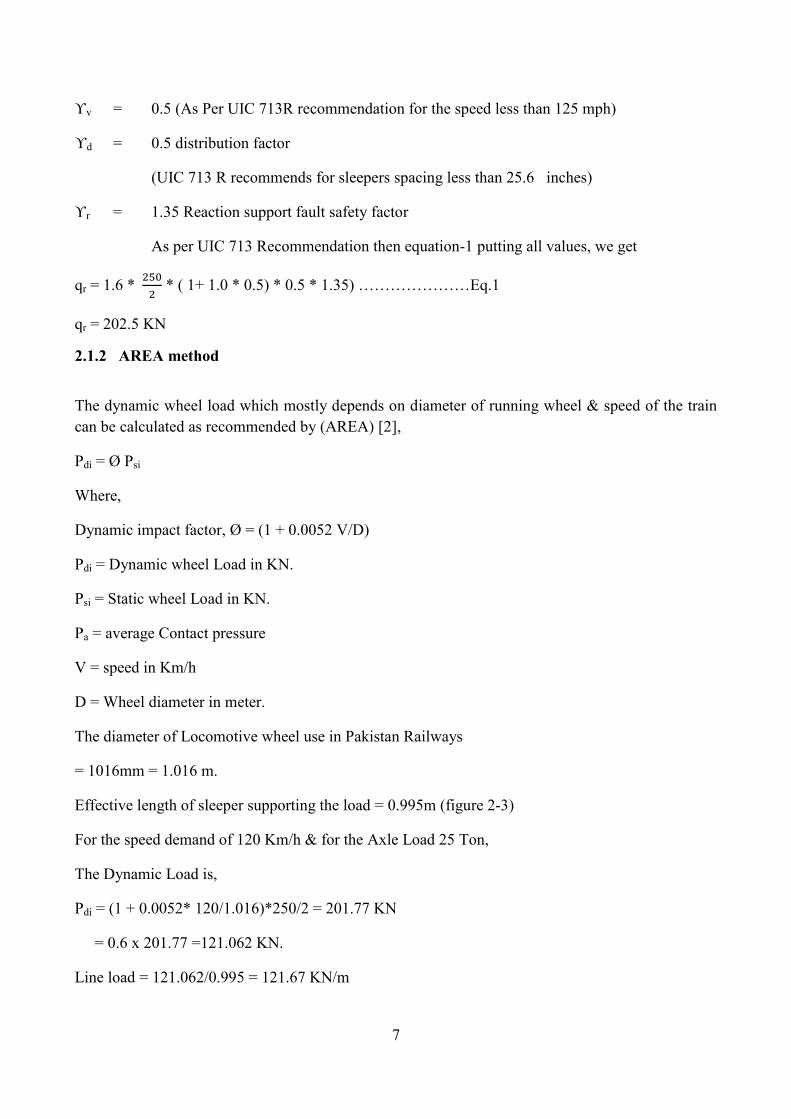
2.1.2 AREA method
The dynamic wheel load which mostly depends on diameter of running wheel & speed of the train can be calculated as recommended by (AREA) [2],
Pdi = Ø Psi
Where,
Dynamic impact factor, Ø = (1 + 0.0052 V/D)
Pdi = Dynamic wheel Load in KN.
Psi = Static wheel Load in KN.
Pa = average Contact pressure
V = speed in Km/h
D = Wheel diameter in meter.
The diameter of Locomotive wheel use in Pakistan Railways
= 1016mm = 1.016 m.
Effective length of sleeper supporting the load = 0.995m (figure 2-3)
For the speed demand of 120 Km/h & for the Axle Load 25 Ton,
The Dynamic Load is,
Pdi = (1 + 0.0052* 120/1.016)*250/2 = 201.77 KN
= 0.6 x 201.77 =121.062 KN.
Line load = 121.062/0.995 = 121.67 KN/m

8
2.1.3 Equivalent dynamic wheel load
According the Atalar et.al [2] the equivalent dynamic wheel load can be calculated from the following formula,
P’w = Pw ( 1 +
……………….Eq.2
Where,
P’w = Equivalent dynamic wheel load for design
Pw = Static wheel load = 125 KN
V = Max. Velocity of train in Km/hr. = 120 Km/h.
C = a coefficient = 0.3 from Eq. 2 we get
P’w = 125 ( 1 +
2.2 Action under the Load
In early times it was believed that the pressure/reactions under the sleepers are uniform. But after several experiments and field observations Talbot realized that the stresses are concentrated directly under the rail seat (Hay W.W Railroad Engineering,1982)
2.3 Gaussian distribution curves and sub-grade pressure
According to Talbot Equation which does not consider the sub-ballast layer and with the assumed bearing capacity of sub grade (Hey, 1982).
h = 16.80(Pa/Pc) 4/5
Where,
h = Support ballast depth (in cm for JNR equation and in inches for Talbot equation).
Pa = Stress at bottom of sleeper
Pc = allowable subgrade stress (in KPa in JNR equation & in Psi in Talbot equation) which is according to the Japanese National Railways Equation Pc = 50Pa/(10+h1.25),
Boussinesq’s Equation Pc = 6P/2 h2 P= wheel load (lbs.)
Also according to the Love’s Equation
Pc = Pa {1-[1/(1+r2/h2)]3/2}

9
Where,
r = radius of loaded circle whose area equal the effective sleeper bearing area under one side rail.
According to AREMA the stress limit on subgrade is 20 Psi.
In this report only one uniform layer of ballast having thickness of 300 mm has been taken, which is practically used in Pakistan Railways.
Figure 2-1: Sleeper dimension for calculation
2.3.1 Calculation of contact pressure for new track
For calculation of the contact pressure between ballast and sleeper, the pressure distribution of the ballast (Pa) it is assumed by Japanese Standards [2] as a uniform pattern, over an effective length [3].
According to the case study in Figure 2-3 one side contact pressure can be calculated for PSC sleeper
Figure 2-2: Calculation of contact pressure
L p = the distance between the Rail seat axis and the end of the sleeper
2 * L p = 2 * 0.4975 = 0.995m
AR= Rectangular section width * Length + Tapered Area + Rectangular section width*Rectangular section length.
S

10
AR = (0.75*0.3) + {1/2(0.3+0.2)*0.2} + (0.045*0.2)
AR= 0.284 m2
Average base of the sleeper = 250 mm = 0.25m
Pa = qr/AR =
= 713 KN/m2
And uniformly distributed load under the PSC sleepers
Line Load = 713 x 0.25 = 178.25 KN/m
Figure 2-3: Cross-section of one side of sleeper
Figure 2-4: Rail seat & sleeper cross-section [1]
Also λ =
, Where λ =effective lever arm

11
Table 2: Pressure distribution for rail seat load
Location Pressure Distribution(KN/m2)
@ Left rail seat 713
@ Right rail seat 713
Esveld stated that the maximum permissible sleeper/ballast contact stress can be taken as 500 KPa. The laboratory test executed by University of Wollongong underneath sleepers in the laboratory and in real tracks give values in the order of 350-400 KPa.[2]
According to UIC (European Countries) For PSC in the newly tamped ballasted track the load transferred from rails to the sleepers [4],
qr = 0.65 x wheel Load = 0.65 x 125 = 81.25 KN
Pa =
) x F2……………….Eq.3 [2]
Where,
Pa =average contact pressure,
B = Width of sleeper
L = effective length of the sleeper supporting the load,
F2 = factor depends on types of sleepers and track maintenance standards,
= ϒi * (1 + ϒp ϒv) * ϒd ϒr
= 1.6 * (1 + 1.0 * 0.5) * 0.5 * 1.35)
= 1.62
Then, Eq. 3
Pa =
* 1.62 = 529 KN/m2
12
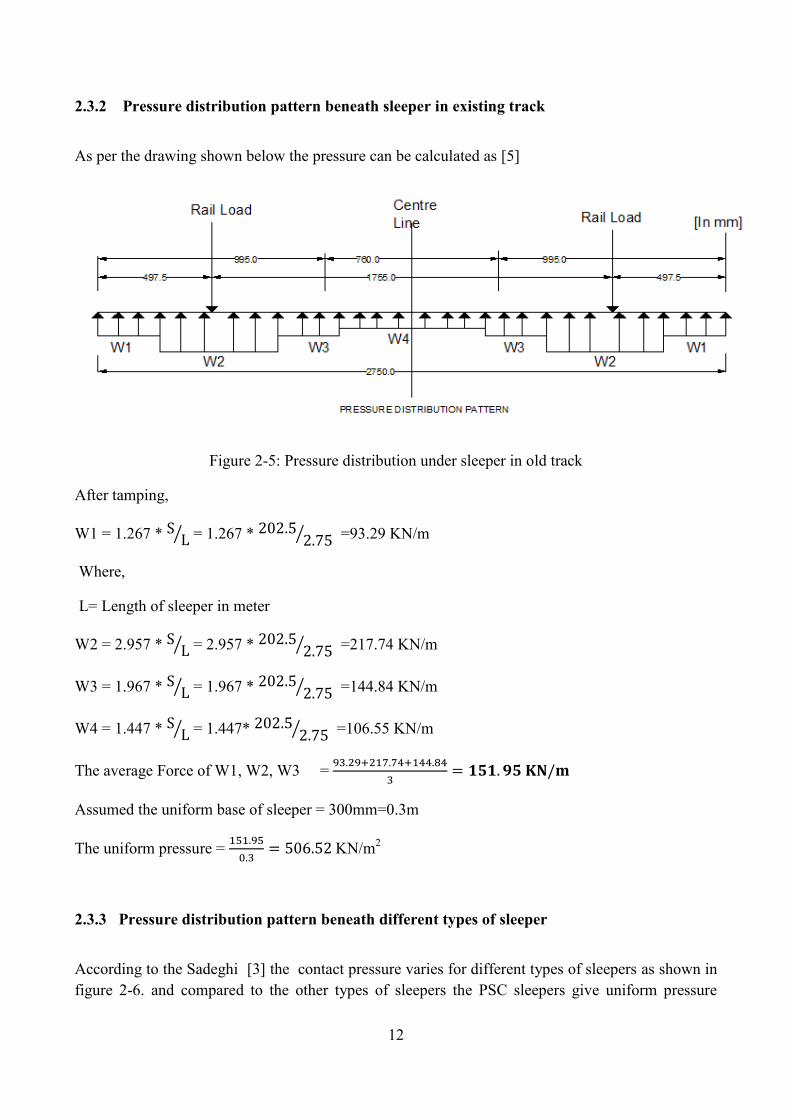
2.3.2 Pressure distribution pattern beneath sleeper in existing track
As per the drawing shown below the pressure can be calculated as [5]
Figure 2-5: Pressure distribution under sleeper in old track
After tamping,
W1 = 1.267 * ⁄ = 1.267 * ⁄ =93.29 KN/m
Where,
L= Length of sleeper in meter
W2 = 2.957 * ⁄ = 2.957 * ⁄ =217.74 KN/m
W3 = 1.967 * ⁄ = 1.967 * ⁄ =144.84 KN/m
W4 = 1.447 * ⁄ = 1.447* ⁄ =106.55 KN/m
The average Force of W1, W2, W3 =
Assumed the uniform base of sleeper = 300mm=0.3m
The uniform pressure =
KN/m2
2.3.3 Pressure distribution pattern beneath different types of sleeper
According to the Sadeghi [3] the contact pressure varies for different types of sleepers as shown in figure 2-6. and compared to the other types of sleepers the PSC sleepers give uniform pressure

13
distribution pattern under heavy loading & high speed, due high rigidity against bending. The pressure distribution pattern for different types of sleepers is tabulated as under;
Table 3: Calculation of pressure distribution for different sleepers
Sleeper Types Parameters
a (KN/m) b (KN/m)
Wooden Timber 0.753 * ⁄ 0.494 *
⁄
Steel 0.719 * ⁄ 0.561 *
⁄
PSC 0.709 * ⁄ 0.581 *
⁄
Figure 2-6: Pressure distribution for different types of sleeper
The effects of different load types, its locations, for different types of sleepers have been calculated considering different assumptions from different literature review. The Average contact pressure 180 KN/m has been imposed as a uniformly distributed load under the PSC sleepers.
2.4 Stress limitation for ideal sub grade
For ideal designed subgrade the maximum pressure on the formation at the bottom of ballast, , should not be exceed 0.3MN/m2 or 3 Kg/cm2 and the pressure on the sub soil should not be generally exceed 0.1 MN/m2 or 1 Kg/cm2

14
The indicative load distribution pattern due to the moving load is shown in figure 2-7,
Figure 2-7: Distribution of force of the wheel load to the sub soil
15
CHAPTER 3
3. BALLAST
Ballast is an important component of the sub structure of railway tracks and is provided just around and below the sleepers. The loads from the wheels of trains ultimately come on the ballast through rails and sleepers.
3.1 Functions of ballast
Some of the important functions of railway ballast are:
1. To provide firm and level bed for the sleepers to rest on it. 2. To allow for maintaining correct track level without disturbing the rail road bed. 3. To drain off the water quickly and to keep the sleepers in dry conditions. 4. To discourage the growth of vegetation. 5. To protect the surface of formation and to form an elastic bed. 6. To hold the sleepers in position during the passage of trains. 7. To transmit and distribute the loads from the sleepers to the formation. 8. To provide lateral stability to the track as a whole.
3.2 Requirements for ideal ballast
The ideal materials for ballast should fulfill the following basic requirements
1) It should be possible to maintain the required depth of the material in order to distribute the load of passing train on the formation ground.
2) The material to be used for ballast should not be too rigid but it should be elastic in nature. 3) The material for ballast should be of such nature that it grips the sleepers in position and
prevent its horizontal movement during passage of train. 4) It should not allow the rain water to accumulate but should be able to drain off the water
immediately without percolating. 5) It should be strong enough a resistance to abrasion

16
3.3 Materials for ballast
The following materials are used for ballast on the railway tracks.
1. Broken stone 2. Gravel 3. Cinders / Ashes 4. Sand 5. Kankar 6. Moorum 7. Brick ballast 8. Selected earth
3.4 Calculation of ballast layer thickness
The ballast is crucial component of the rail track; the performance of the track depends upon the selection of gradation of ballast, layer thickness, it’s packing during maintenance and proper drainage system.
The thickness of ballast layer depends on width of sleepers and spacing between two consecutive sleepers, according to the [6]
The Depth of ballast d =
Where, S= Sleeper spacing (center to center distance)
W=width of sleeper as shown in figure 3-1

17
Figure 3-1: Ballast cushion
d= (610-300)/2=155 mm=15.5 cm
3.5 Classification of tracks in Pakistan
On the basis of the components (Sleepers, rails and ballast) of the railway track, there are four classes of tracks in PR system, which are tabulated as under
Table 4: Track Classification in PR.
Class Speed Sleepers spacing Ballast cushion Rails Types Section
Primary A 120Km/h N+7 30 cm 100R.E Main line
Primary B 100 Km/h N+6 25cm 90 Lbs. Main line
Secondary 80Km/h N+5,N+4 20cm 90 Lbs. Branch line
Teriary 50Km/h N+3 15cm (90-75) Lbs. Branch line
On the basis of different experiments [7], the minimum depth of ballast under the sleepers is 30 cm. However for more proper resistance against lateral displacement it is strongly recommended to keep the ballast layer up to 40 cm under the sleepers which gives better results both in common railways and HSR.
In this report the thickness of ballast layer is 30 cm for primary class of the PR standard.
18
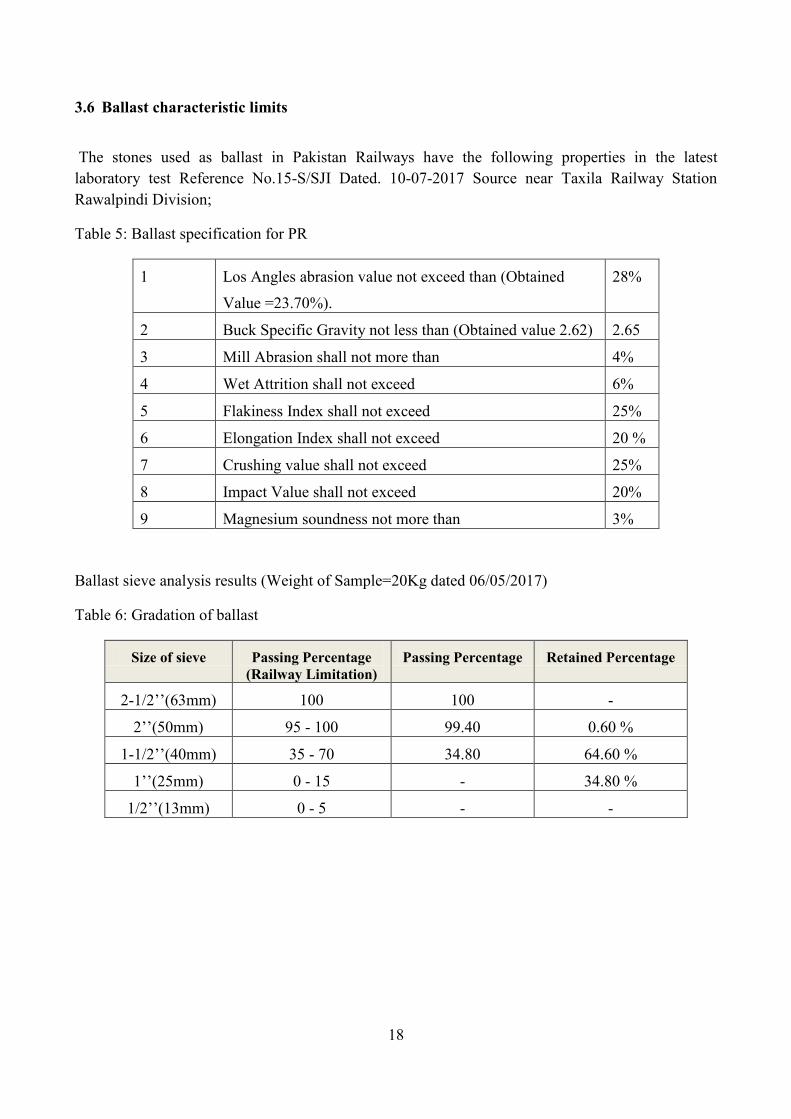
3.6 Ballast characteristic limits
The stones used as ballast in Pakistan Railways have the following properties in the latest laboratory test Reference No.15-S/SJI Dated. 10-07-2017 Source near Taxila Railway Station Rawalpindi Division;
Table 5: Ballast specification for PR
1
Los Angles abrasion value not exceed than (Obtained
Value =23.70%).
28%
2 Buck Specific Gravity not less than (Obtained value 2.62) 2.65
3 Mill Abrasion shall not more than 4%
4 Wet Attrition shall not exceed 6%
5 Flakiness Index shall not exceed 25%
6 Elongation Index shall not exceed 20 %
7 Crushing value shall not exceed 25%
8 Impact Value shall not exceed 20%
9 Magnesium soundness not more than 3%
Ballast sieve analysis results (Weight of Sample=20Kg dated 06/05/2017)
Table 6: Gradation of ballast
Size of sieve Passing Percentage (Railway Limitation)
Passing Percentage Retained Percentage
2-1/2’’(63mm) 100 100 -
2’’(50mm) 95 - 100 99.40 0.60 %
1-1/2’’(40mm) 35 - 70 34.80 64.60 %
1’’(25mm) 0 - 15 - 34.80 %
1/2’’(13mm) 0 - 5 - -

19
3.6.1 Role of ballast fouling on track performance
According to the [8] the void contamination index (VCI) is given by the following expression,
Figure 3-2: Ballast contamination process
Where,
= void ratio of the clean ballast.
= void ration of the fouling materials.
= specific gravity of the clean ballast.
= specific gravity of the fouling materials
= Dry mass of the clean ballast.
= Dry mass of the fouling materials.
In the field only the mass of clean ballast, mass and specific gravity of the fouled materials can be calculated. The codes allow the PVC value from 2.0 to 9.5 % for the clean ballast and above 50% are considered as fully fouled ballast. From the field experience and the figure 3-3 shows that it is
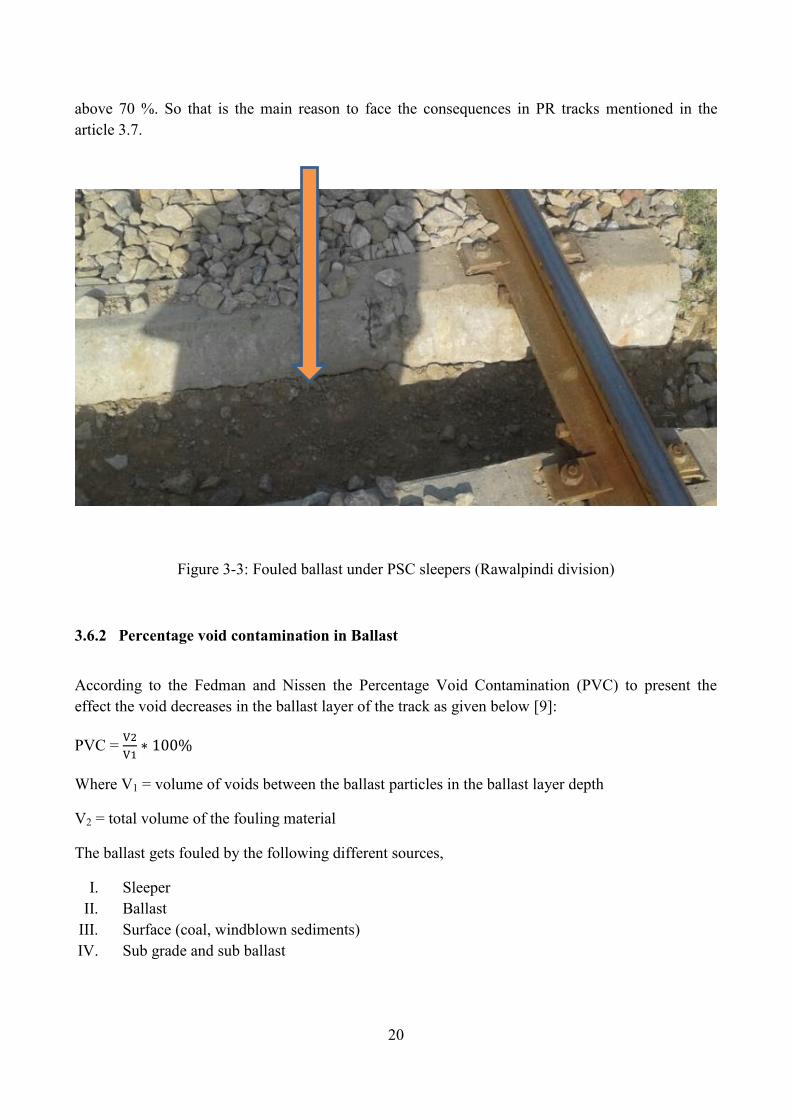
20
above 70 %. So that is the main reason to face the consequences in PR tracks mentioned in the article 3.7.
Figure 3-3: Fouled ballast under PSC sleepers (Rawalpindi division)
3.6.2 Percentage void contamination in Ballast
According to the Fedman and Nissen the Percentage Void Contamination (PVC) to present the effect the void decreases in the ballast layer of the track as given below [9]:
PVC =
Where V1 = volume of voids between the ballast particles in the ballast layer depth
V2 = total volume of the fouling material
The ballast gets fouled by the following different sources,
I. Sleeper II. Ballast
III. Surface (coal, windblown sediments) IV. Sub grade and sub ballast

2%
20%
20% 58%
Sleeper
Ballast
Surface(coal,windblownsediment)Subgrade and sub ballast

22
Figure 3-5: Crushed sleepers due to the fouled ballast
4) The fouled ballast have less friction angle, less stiffness and bearing capacity may cause of the track differential settlement which are very dangerous specially on the approaches of major girder bridges and may cause of derailment and demolishing of bridges.
The cost of ballast is Rs.1305.36 (PKR) per cubic meter in Pakistan Railways and can be compared with geogrid system or ballast mate, the ballast mate gives better track performance up to 10% and thus can be reduced the maintenance & reconditioning cost of the ballast .
To avoid the actual situation in the field shown in figure No. 3-3 and 3-5 and eliminating the above mentioned consequences of the fouled ballast, a single layer of geogrid are recommended in between the ballast and formation top level. The effects of providing the geogrid layer on the overall stability of the track have been given in details in Chapter No. 4.
23
CHAPTER 4
4. FINITE ELEMENT ANALYSIS
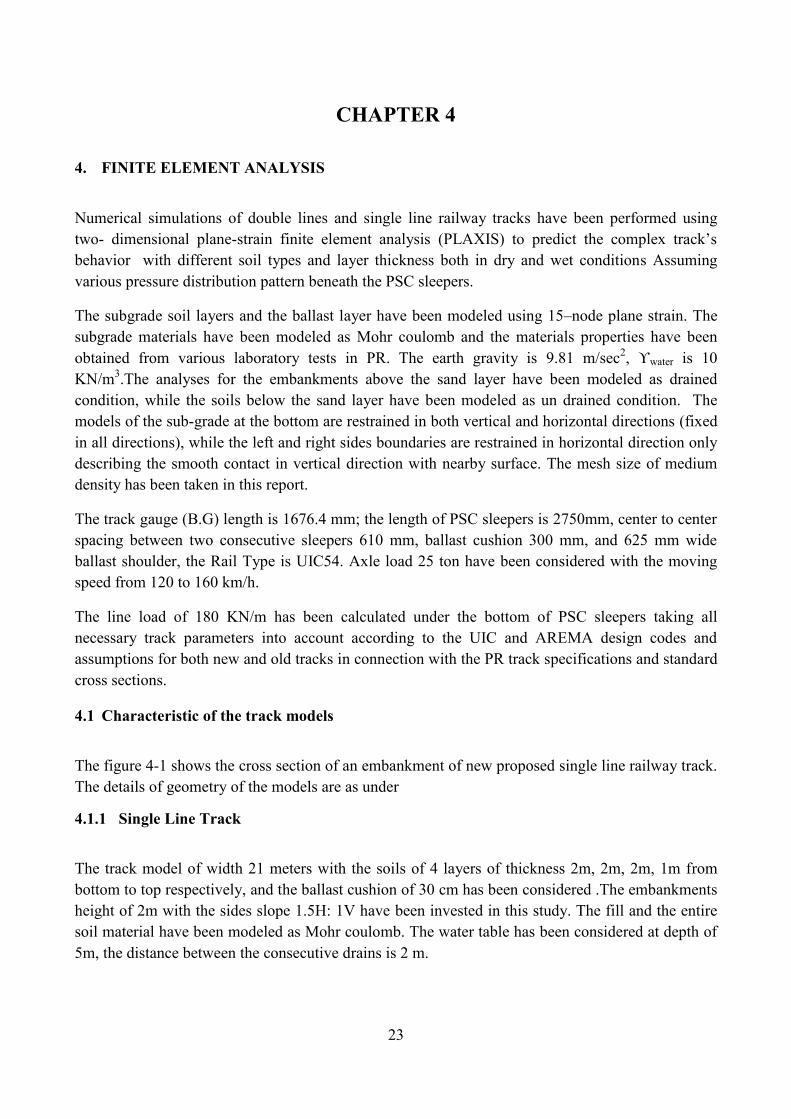
Numerical simulations of double lines and single line railway tracks have been performed using two- dimensional plane-strain finite element analysis (PLAXIS) to predict the complex track’s behavior with different soil types and layer thickness both in dry and wet conditions Assuming various pressure distribution pattern beneath the PSC sleepers.
The subgrade soil layers and the ballast layer have been modeled using 15–node plane strain. The subgrade materials have been modeled as Mohr coulomb and the materials properties have been obtained from various laboratory tests in PR. The earth gravity is 9.81 m/sec2, ϒwater is 10 KN/m3.The analyses for the embankments above the sand layer have been modeled as drained condition, while the soils below the sand layer have been modeled as un drained condition. The models of the sub-grade at the bottom are restrained in both vertical and horizontal directions (fixed in all directions), while the left and right sides boundaries are restrained in horizontal direction only describing the smooth contact in vertical direction with nearby surface. The mesh size of medium density has been taken in this report.
The track gauge (B.G) length is 1676.4 mm; the length of PSC sleepers is 2750mm, center to center spacing between two consecutive sleepers 610 mm, ballast cushion 300 mm, and 625 mm wide ballast shoulder, the Rail Type is UIC54. Axle load 25 ton have been considered with the moving speed from 120 to 160 km/h.
The line load of 180 KN/m has been calculated under the bottom of PSC sleepers taking all necessary track parameters into account according to the UIC and AREMA design codes and assumptions for both new and old tracks in connection with the PR track specifications and standard cross sections.
4.1 Characteristic of the track models
The figure 4-1 shows the cross section of an embankment of new proposed single line railway track. The details of geometry of the models are as under
4.1.1 Single Line Track
The track model of width 21 meters with the soils of 4 layers of thickness 2m, 2m, 2m, 1m from bottom to top respectively, and the ballast cushion of 30 cm has been considered .The embankments height of 2m with the sides slope 1.5H: 1V have been invested in this study. The fill and the entire soil material have been modeled as Mohr coulomb. The water table has been considered at depth of 5m, the distance between the consecutive drains is 2 m.
24
Nr. of soil elements = 8884 with 15-noded
Nr. of nodes = 71657
Average elem. size = 0.1518 m
Table No 10 summarizes soil properties used in PLAXIS modeling.
Figure 4-1: Failure pattern of embankment under single line
4.1.2 Double Lines Track
The model of width 28 m with the soil (Clay) layer of height 7m has been taken for existing double tracks shown in figure 4-2. A sand layer of thickness 1 m and then soil layer of thickness 1 m have been provided as a embankment with side slope 1.5H: 1V. The fill and the entire soil materials have been modeled as Mohr coulomb. The depth of water level is 7m under the embankment for the case study. The distance between the consecutive drains is 2 m. Tables No.11 &12 summarize soils and sand properties used in PLAXIS modeling.
Nr. of soil elements = 10749 with 15-noded
Nr. of nodes = 86675
Average elem. size = 0.1556 m

25
Figure 4-2: Failure pattern of embankment under double track
The numerical analyses for all track models have been conducted in five stages;
1) The initial condition under the soil self –weight. 2) Phase with flow after initial condition. (Elastoplastic analysis in which consolidation have
not been considered and reset disp. to zero from case to case). 3) Phase with C-Phi reduction method after flow (ignoring suction) 4) Phase with line loading after flow phase 5) Phase with C-Phi reduction method after loading
It is clear from the results that the estimated bearing capacities of trains load and settlements in the formation have minor difference due to the variation in meshing size. Therefore, mesh sizes for the elements of fine density have been chosen for this study.
4.2 Vertical deformation
In order to calculate the vertical deformation the Selig, E. T and Waters, j. M: Track Geo technology and Substructure, Thomas Telford, London. give analytical relationship between million gross tons (MGT) of rail traffic per year and number of cycles (N) which can be used for the calculation of load cycles.

26
Cm = 106/ (At x Na)
Where,
Cm = Number of load cycle/MGT,
At = axle load in tons.
Na = number of axles/ load cycle.
For example the annual traffic tonnage of 50 MGT between (Lahore –Karachi Section) and four axles per load cycle, an axle load of 25 ton gives
Cm = 106/ (25 x 4) =10000/MGT=10000 x 50 =500,000 cycles per MGT
4.2.1 Effect of cyclic loading frequency on the permanent deformation of the track
According to the [10] number of large scale tri axial tests were conducted to know about the complex behavior of the track under the cyclic loading of moving trains for the frequency range 05 Hz to 60 Hz & for the speed 11.11 m/sec to 111.11 m/sec (40 to 400 Km/h). The deformation under the cyclic loading were classified into 3 phases,
i. Plastic shakedown ( ) ii. Plastic and ratcheting ( 30 )
iii. Plastic collapse ( )
And different types of analytic relationships were developed after several field experiments for the different trains speeds and axial loads.
Cyclic axial strain ratio ɸa= ϵa,cyc/ ϵa,sta also for calculating the ϵa = a ϵa,sta. similarly a relationship between volumetric strain and BBI were established by the following linear equation,
ϵv = 1.113 BBI – 0.011

27
Figure 4-3: Relationship between ϵv and BBI [10]
In this test study the load qmax,cyc = 180 KPa with moving speed (V) from 120 km/h to 160 km/h (33.33 m/sec to 44.44 m/sec), number of load cycle (N) 500,000 and average frequency of 25 Hz has been taken to investigate about the deformation in the tracks using FEM.
4.2.2 Input parameters for dynamic load
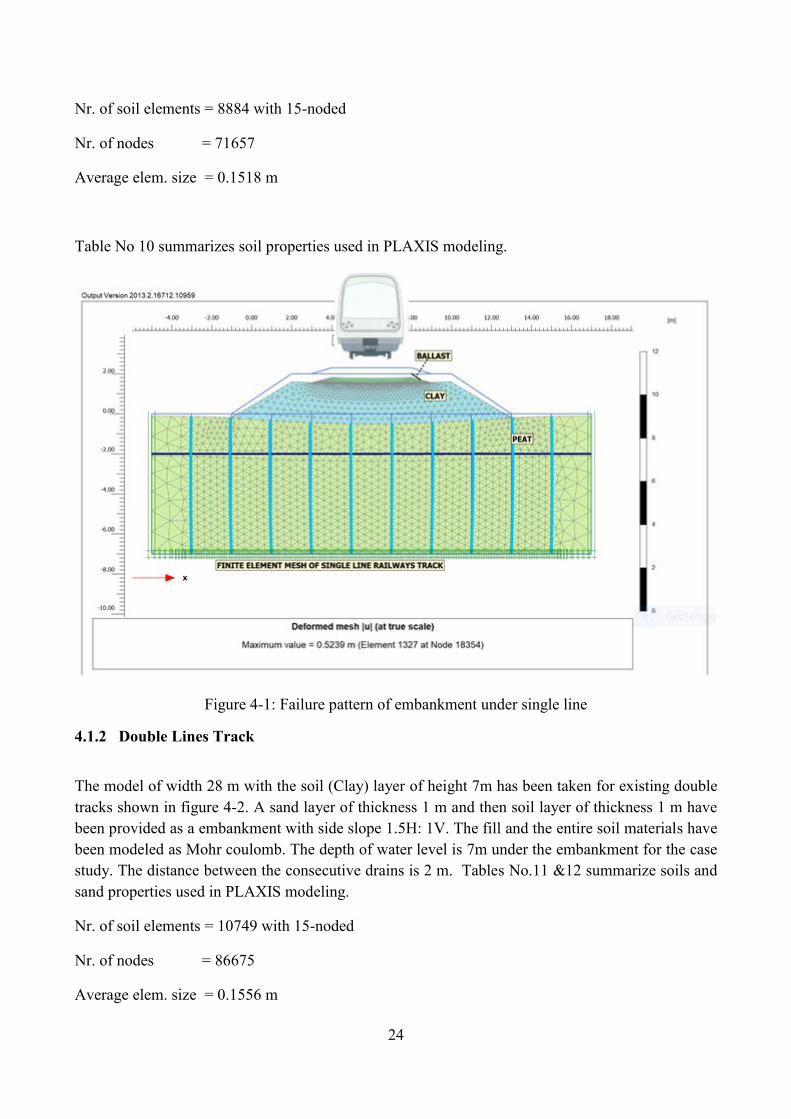
In this case study the Rayleigh damping ) of 5.0 % for SOF have been selected for frequency range 10 to 25 Hz. To calculate time interval the length of the train and its speed are taken into account. Here the average speed (v) of 130km/h (36.12 m/sec) and the length of locomotive is the governing length (S) of 16 m. After the final calculation the time interval for the passing of first wheel axle and the last wheel axle is
For full passenger train length (15 passenger coaches) = S = 240 m
28
Figure 4-4: Track cross section & wheel axle distance of Locomotive
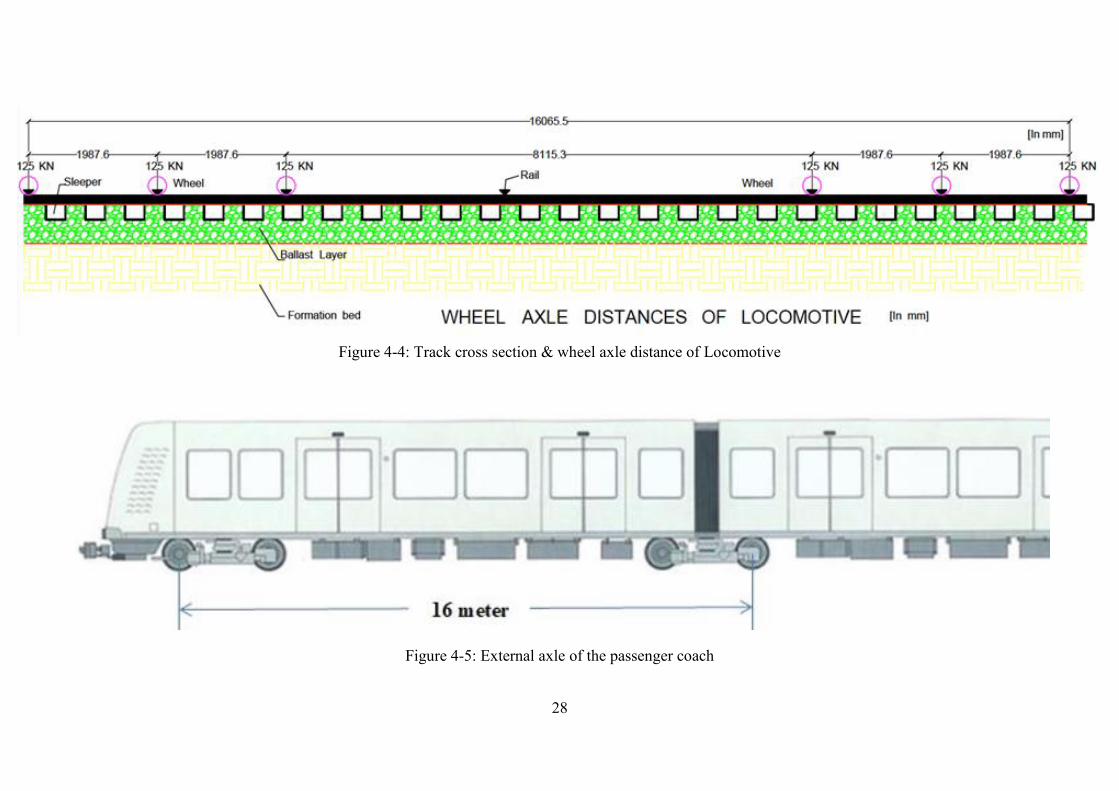
Figure 4-5: External axle of the passenger coach

29
The graph between the actual loading and dynamic time (input) and also displacements, velocities and acceleration verses time for the given set of soil parameters are given below,
Figure 4-6: Acceleration Vs Dynamic time for passing Locomotive only
Figure 4-7: Velocity Vs Dynamic time for Locomotive only

30
4.3 PLAXIS 2-D RESULTS FOR ELASTOPLASTIC CONSTITUTIVE MODELS
4.3.1 For single line in wet condition
Figure 4-8: Deformed mesh under initial condition
Figure 4-9: Deformed mesh for c-phi reduction

31
Figure 4-10: Deformed mesh under external loading
Figure 4-11: Total displacement under loading

32
Figure 4-12: Safety after loading
Figure 4-13: Total displacement (Ux)
33
Figure 4-14: Total displacement Vs safety factor

34
4.3.2 For single line in dry condition
Figure 4-15: Deformed mesh (initial condition)
Figure 4-16: Safety after initial phase
35
Figure 4-17: Plastic displacement after actual loading
Figure 4-18: Deformed mesh after loading
36
Figure 4-19: Total displacement Vs safety for initial phase
Figure 4-20: Total displacement Vs safety after loading

37
4.3.3 For double lines in wet condition
Figure 4-21: Deformed mesh under loading
Figure 4-22: Total deformation (Ux) under loading

38
Figure 4-23: Total displacement (Uy) in safety phase
Figure 4-24: Total displacement (Ux) in safety
39
Figure 4-25: Total displacement Vs safety after flow

40
4.3.4 For double lines in dry condition
Figure 4-26: Deformed mesh for plastic phase
Figure 4-27: Total displacement

41
Figure 4-28: Total displacement in safety phase
Figure 4-29: Total displacement (Ux) in safety phase
42
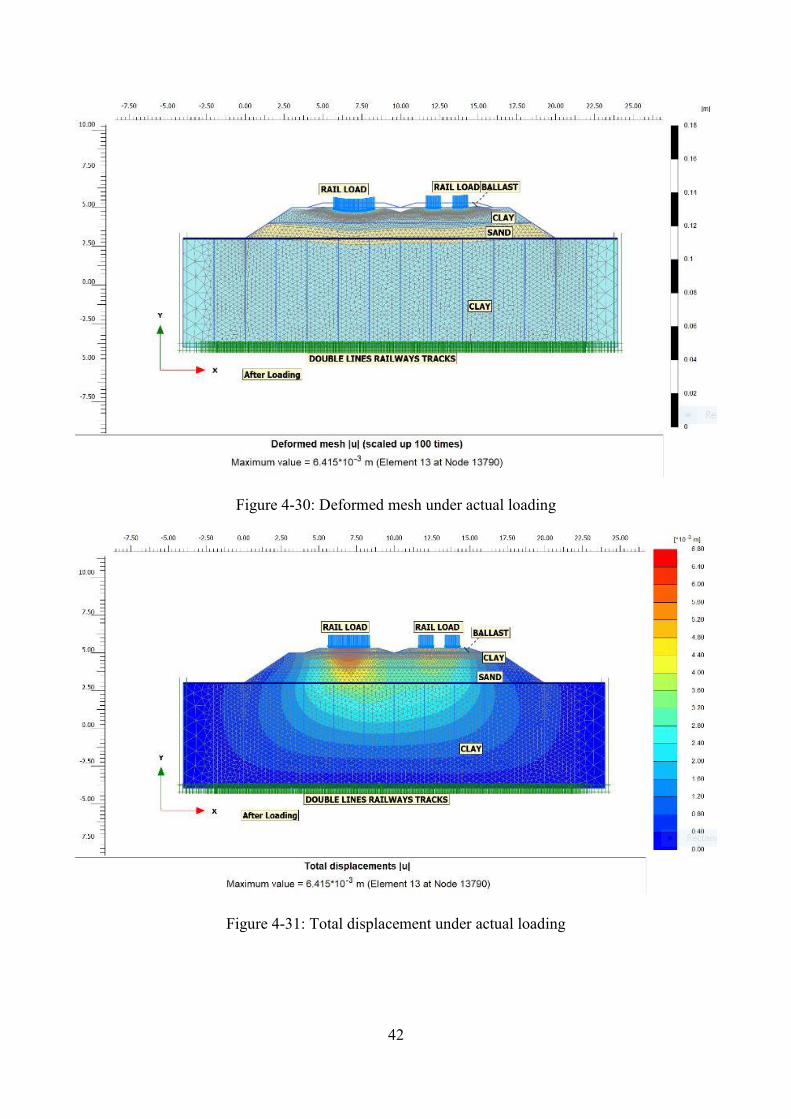
Figure 4-30: Deformed mesh under actual loading
Figure 4-31: Total displacement under actual loading

43
Figure 4-32: Total displacement Vs Safety both for initial phase & under loading
4.4 Summary of displacements and Safety Factors under different conditions
Table 7: Summery of calculation
Phases
Measurements (m)
SINGLE LINE [Node.A(1.0,0.0)]
DOUBLE.LINES [Node.A(0.00,3.00)]
Remarks
Condition Dry Wet Dry Wet
Initial Phase
Total Displacement (U) 0.4629 0.5282 0 2.616*10-3
Displacement reset to zero.
Also, ignoring suction
SF 1.421 1.174 1.682 1.683
Loading Phase
Total Displacement (U) 0.2787 0.4686 6.415*10-3 6.237*10-3
SF 1.421 1.522 1.681 1.536
44
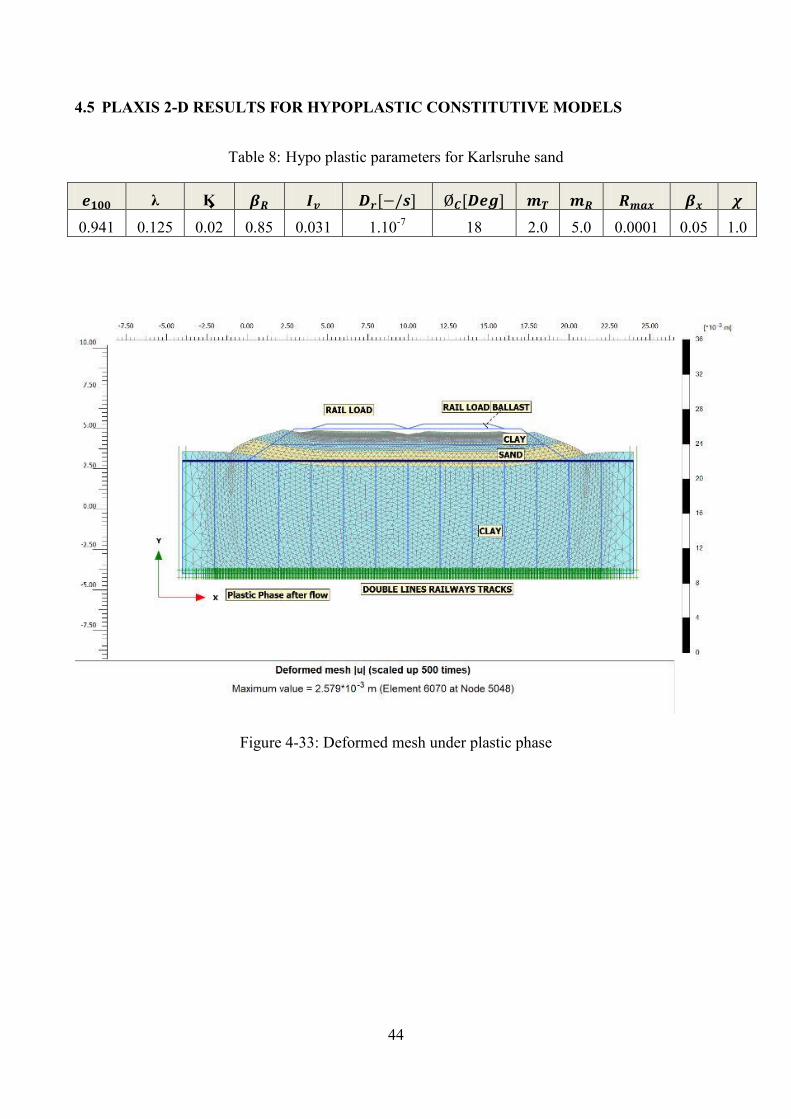
4.5 PLAXIS 2-D RESULTS FOR HYPOPLASTIC CONSTITUTIVE MODELS
Table 8: Hypo plastic parameters for Karlsruhe sand
λ Ϗ
0.941 0.125 0.02 0.85 0.031 1.10-7 18 2.0 5.0 0.0001 0.05 1.0
Figure 4-33: Deformed mesh under plastic phase

45
Figure 4-34: Total displacement under plastic phase
Figure 4-35: Total displacement under safety phase after flow

46
Figure 4-36: Active pore pressure for double lines track
Figure 4-37: Total displacement Vs Safety
47
4.6 Settlements
Settlement of soil may be defined as the vertical, downward displacement of the soil or the relative movement of structure on soil.
Settlement may occur due the following causes;
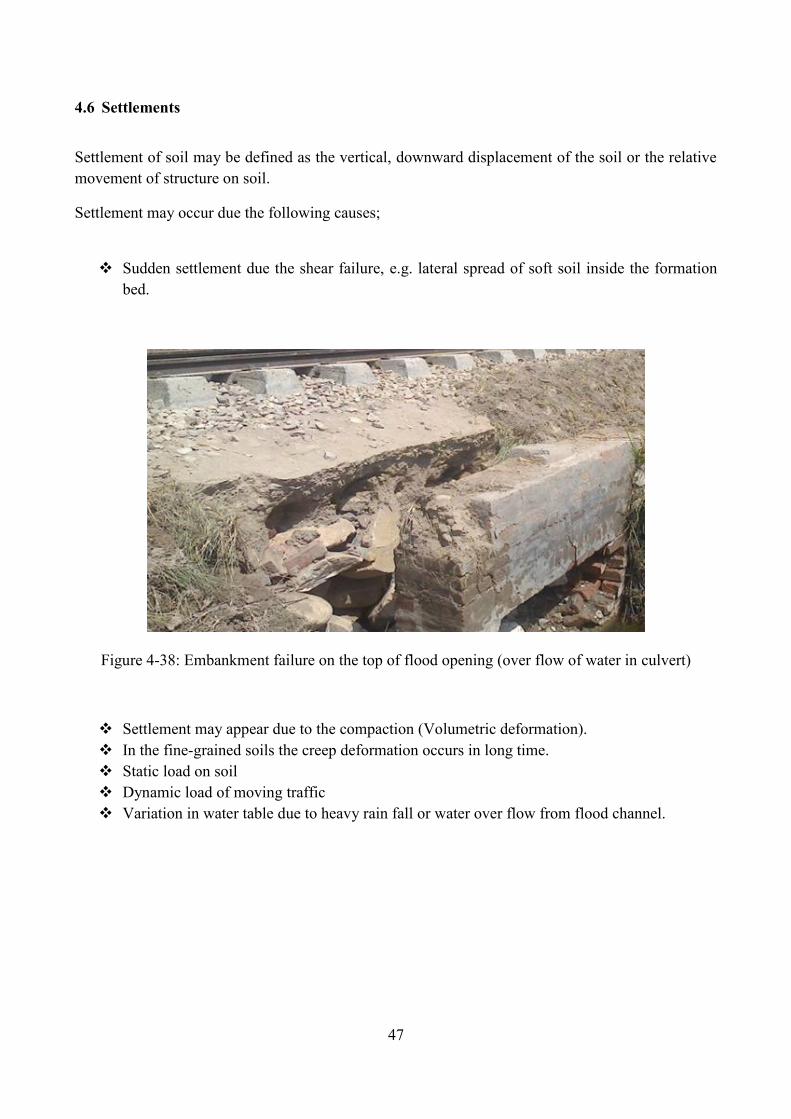
Sudden settlement due the shear failure, e.g. lateral spread of soft soil inside the formation
bed.
Figure 4-38: Embankment failure on the top of flood opening (over flow of water in culvert)
Settlement may appear due to the compaction (Volumetric deformation). In the fine-grained soils the creep deformation occurs in long time. Static load on soil Dynamic load of moving traffic Variation in water table due to heavy rain fall or water over flow from flood channel.

48
Figure 4-39: Settlement due to failure in side slope during heavy rain fall in monsoon in Multan division in year 2013.
During the last decade the tracks in Pakistan were badly affected due to the heavy rains and subsequently flood. In different locations the settlement had been noted up to the several feet, as shown in figure 4-39 the settlement noted was 1.8 feet and track was totally unfit for operational services.
There are various types of track tolerances;
o Safety Tolerances o Service Tolerances o Maintenance Tolerances o New track Tolerances
In this study the maintenance Tolerance have been discussed in detail to know about the permissible values in case of deformation and differential settlement.
For alignment the limits have been laid down for the versine measured on 7.5 meter base. When taking ground measurements, a chord 7.5 meter in length is stretched along the running face of the rail and versine at the center of the chord is measured. The separate tolerances have been laid down for the straight and curved track in table below

49
Table 9: Track tolerances
Track (B.G) Generally (mm) Isolated Location (mm )
Straight
Curved
The total change of versine from chord to chord should not exceed 10 mm.
Cross Level and cant: The relative difference in the level of the two rails tops are permitted up to , and the max. twist per meter between the two points 03 meters apart is 04 mm/meter for the speed above 100 Km/h.
4.7 Material model and properties
4.7.1 For single line under wet condition
Table 10: Input parameters for single line
Section Young’s modulus (M.pa)
Poisson’s ratio
Density
(KN/m3)
Thickness (m)
Friction angle (deg.)
Cohesion (KN/m2)
Ballast 450 0.30 20 0.3 30 7
Clay 10 0.35 18 2 24 7
Peat 50 0.35 11 7 20 2

50
4.7.2 For single line under dry condition
Table 11: Input parameters for single line
Section Young’s modulus (M.pa)
Poisson’s ratio
Density
(KN/m3)
Thickness (m)
Friction angle (deg.)
Cohesion (KN/m2)
Ballast 450 0.30 20 0.3 30 7
Clay Layer 3 10 0.35 18 2 24 7
Clay Layer 2 10 0.35 18 1 24 7
Clay Layer 1 10 0.35 18 2 24 7
Peat Layer 2 50 0.35 11.50 2 20 2
Peat Layer 1 50 0.35 11.50 2 20 2
Table 12: Input parameters for double lines tracks
Young’s modulus (M.pa)
Poisson’s ratio
Density
(KN/m3)
Thickness (m)
Friction angle (deg.)
Cohesion (KN/m2)
Ballast 450 0.3 15.6 0.3 45 0
Sand 40 0.30 20 1.0 35 1
Soil layer 1 20 0.35 18 7 24 4
Soil layer 2 20 0.35 18 1.0 24 4
51
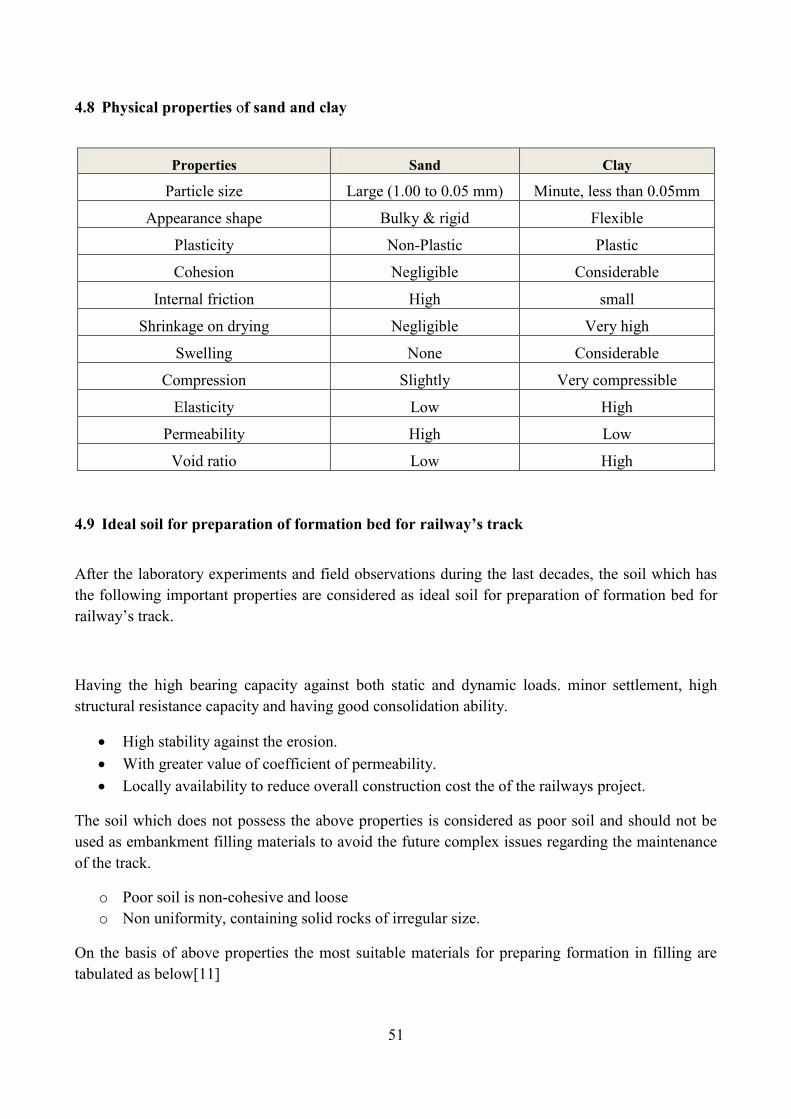
4.8 Physical properties of sand and clay
Properties Sand Clay
Particle size Large (1.00 to 0.05 mm) Minute, less than 0.05mm
Appearance shape Bulky & rigid Flexible
Plasticity Non-Plastic Plastic
Cohesion Negligible Considerable
Internal friction High small
Shrinkage on drying Negligible Very high
Swelling None Considerable
Compression Slightly Very compressible
Elasticity Low High
Permeability High Low
Void ratio Low High
4.9 Ideal soil for preparation of formation bed for railway’s track
After the laboratory experiments and field observations during the last decades, the soil which has the following important properties are considered as ideal soil for preparation of formation bed for railway’s track.
Having the high bearing capacity against both static and dynamic loads. minor settlement, high structural resistance capacity and having good consolidation ability.
High stability against the erosion. With greater value of coefficient of permeability. Locally availability to reduce overall construction cost the of the railways project.
The soil which does not possess the above properties is considered as poor soil and should not be used as embankment filling materials to avoid the future complex issues regarding the maintenance of the track.
o Poor soil is non-cohesive and loose o Non uniformity, containing solid rocks of irregular size.
On the basis of above properties the most suitable materials for preparing formation in filling are tabulated as below[11]

52
Table 13: Selection of soil for subgrade
Suitable Material Not suitable
Firm clay Peat
Sand/Gravel Top soil
Boulder clay Soft clay
Weathered rock.
The shear strength depends on the consolidation state whether it is normally consolidated state or over consolidated. Furthermore shear strength depends on time, as with passage of time the excessive pore water pressures develop and thus the total stresses converted into effective stresses.

53
4.10 C-ϕ reduction method
In this method, the actual values of shear strength parameters, frictional angle (ϕ) and cohesion (c) which are obtained through the laboratory tests are decreased in Safety analysis simultaneously until the failure occurs
In this report the C-ϕ reduction method has been followed for the calculation of factor of safety (Global).
Factor of safety =
Where,
C’f, are shear strength parameter at failure stage.
⁄ Is the inclination of the failure surface.
Also,
=
Figure 4-40: Possible failure surface in the double tracks
54
In the design of an embankment it is the most crucial step to consider both final stability as well as stability during construction stage.
For embankment most of the loading caused by self-weight of the filling materials, but increasing in self-weight would not necessarily lead to failure/collapse.
Factor of safety is therefore given
Safety factor (SF) =
Where, S represents the shear strength .in other words the SF can be expressed as “the ratio of the true strength of the soil to the computed minimum strength which is required for equilibrium”
In the standard Mohr Coulomb method the safety factor (FS) can be calculated by the following expressions,
On the shear plane
If
Shear stress ( ) = c + σ are the actual input strength parameters with normal stress (σ) obtained from actual samples test at laboratory
Shear stress ( ) = cr + σ are the reduced input strength parameters just at equilibrium stage
Then
The Safety factor (SF) =
This principle can be used in PLAXIS-2D for calculating a global safety factor in which the cohesion (C) and the tangent of the friction angle (ɸ) are reduced in same proportion until failure occur.
=
= ∑
The total multiplier ∑ control the reduction in the strength parameters repeatedly until the failure occurs with ignore status of suction and the final value of ∑ obtained at failure stage is the factor of safety of the system. But more realistic value of safety factor can be obtained for fully coupled flow-deformation analysis after the consideration of suction this value will be generally greater than that in which the suction is ignored.

55
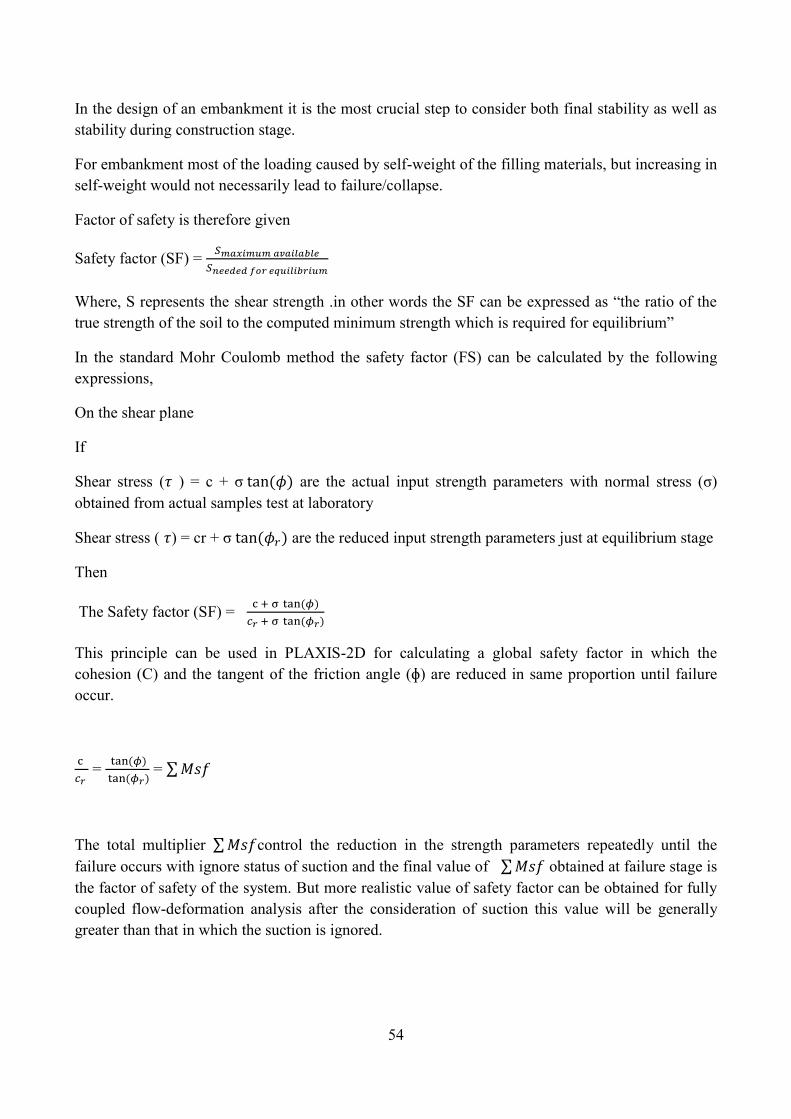
4.11 Soil selection criteria for the construction of embankment for new railway line
In this part of the parametric study, the influence of shear strength parameters, cohesion( C), friction angle ( and elastic stiffness (E) of the soils having different values have been invested by getting displacements for initial condition and cumulative displacement ( resetting disp. NOT To zero ) under loading by keeping all others variable parameters constant. By this study one can easily decide about the best combination of cohesion and friction angle for construction of new proposed track formation to get the desired stability and performance of the track.
Table 14: Different subgrade properties used in parametric study
Case. No Cohesion C (KPa)
Friction angle (degree)
Elastic stiffness E (MPa)
Displacement in m (Initial condition)
Cumulative displacement in m
(under loading)
1 2 30 10 0.04373 0.08966
2 4 35 15 0.02919 0.06813
3 6 40 20 0.02191 0.04948
4 8 45 25 0.01754 0.03803
5 10 50 30 0.01413 0.02815
(a) Friction angle (degree)
0
0.01
0.02
0.03
0.04
0.05
0.06
0.07
0.08
0.09
0.1
25 30 35 40 45 50 55
Dis
pla
cem
en
t (m
)
Friction angle (degree)
Friction angle versus Total Displacement
Initial condition
under loading
56
(b) Cohesion (KPa)
(c) Elastic stiffness E (MPa)
Figure 4-41: Estimated total displacement due to the (a) Cohesion; (b) friction angle; (c) elastic stiffness
0
0.01
0.02
0.03
0.04
0.05
0.06
0.07
0.08
0.09
0.1
0 2 4 6 8 10 12
Dis
pla
cem
en
t (m
)
Cohesion (KPa)
Cohesion versus Total Displacement
Initial condition
under loading
0
0.01
0.02
0.03
0.04
0.05
0.06
0.07
0.08
0.09
0.1
10 15 20 25 30
Dis
pla
cem
en
t (m
)
Elastic stiffness (MPa)
Elastic Stiffness versus Total Displacement
Initial condition
under loading
57
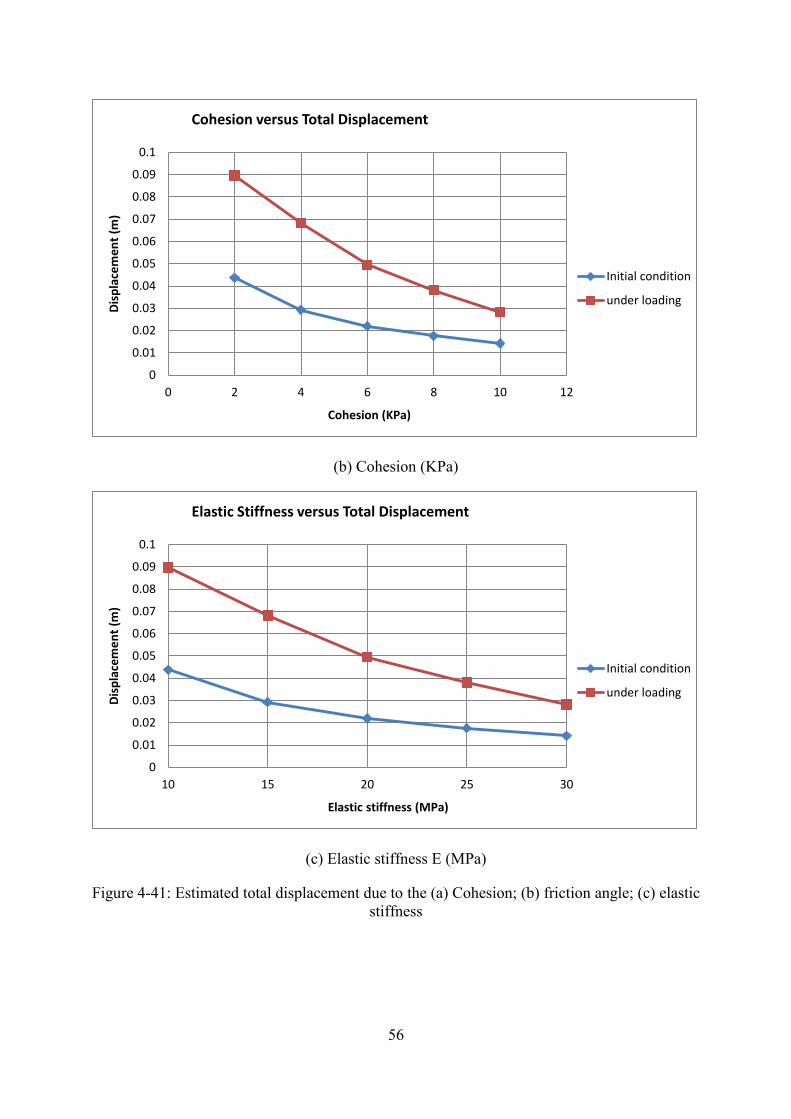
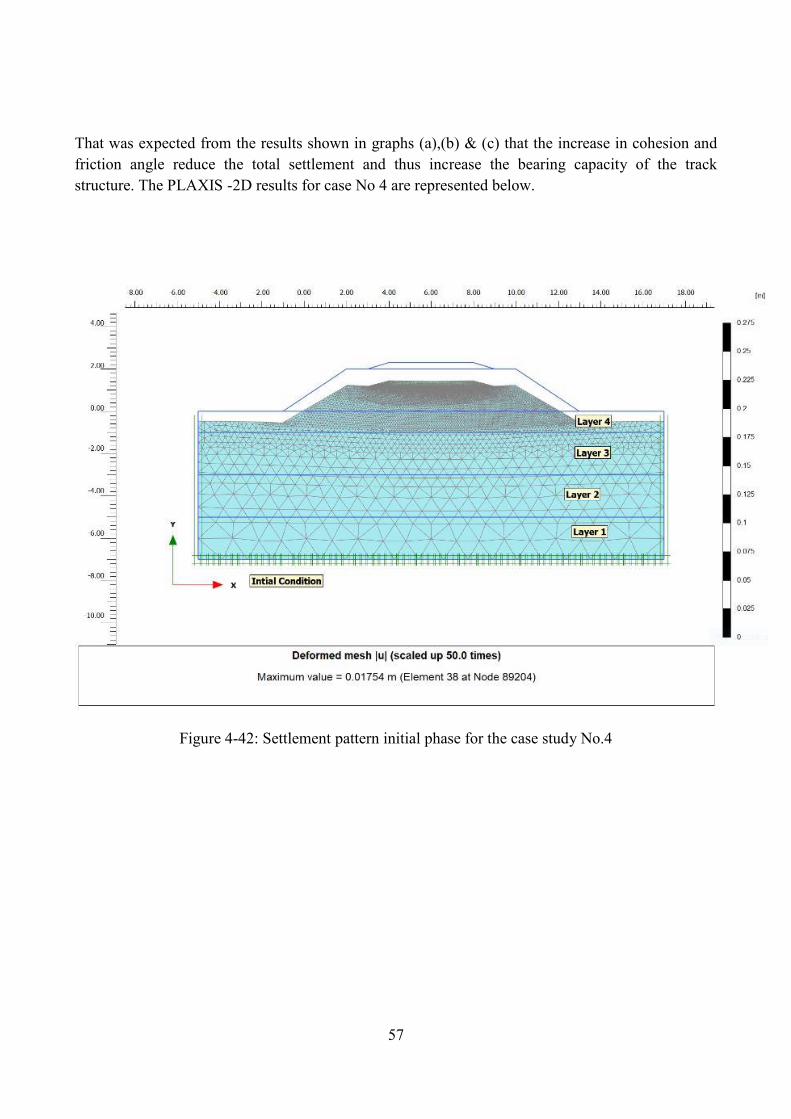
That was expected from the results shown in graphs (a),(b) & (c) that the increase in cohesion and friction angle reduce the total settlement and thus increase the bearing capacity of the track structure. The PLAXIS -2D results for case No 4 are represented below.
Figure 4-42: Settlement pattern initial phase for the case study No.4
58
Figure 4-43: Settlement pattern under the loading for the case study No.4
Furthermore if a loose and weak soil materials found in the alignment of track formation which does not have sufficient desired/design values of shear strength parameters and bearing capacity in the range 01 to 3.5 Kg/cm2, then it is necessary to follow any of one ground improvement techniques to improve the bearing capacity before construction of formation bed for the railway tracks. The representative models for the single line track for the case study have been shown in figure 4-42 & 4-43.

59
4.11.1 Effect of geogrid location and layering
It has been observed in field inspections of different track settlements scenario that the sewerage water from passenger’s coaches is the main cause of sinking of the ballast into the formation bed and subsequently the hammering action of moving loads the ballasts loose its basic functions and deteriorated which have adverse effects on the performance of the track.
To avoid or at least minimize the differential settlement of the track the case study of providing geogrid layer between the ballast and formation bed has been studied in this section. And the results indicate that the improvement in the form of decrease in total settlement and increase of bearing capacity of the overall track can be achieved up to 10% by providing the geogrid in between ballast and formation bed. The main advantages of geogrid are,
It helps in the drainage of rain water or sewerage water and thus keeps the track dry. It isolates the ballast layer from the formation bed, and thus no chance of mixing ballast with
the soil layer of the formation. It considerably reduces the maintenance efforts and increase the life time of the
serviceability of the components of the track. It helps the ballast to perform its basic functions and keep it clean without any
contamination. It helps in the smooth running of the trains.
Table 15: Displacement with and without geogrid layer
S. No Section type
Cohesion C (Kpa)
Friction angle (degree)
Elastic stiffness E
(MPa)
Displacment in m (Intial condition)
Cumulative displacment in m (under
loading)
1 With
geogrid 8 45 25 0.01751 0.03745
2 Without geogrid
8 45 25 0.01754 0.03803

60
Figure 4-44: Effect of geogrid layer
Figure 4-45: Settlement in case of geogrid layer
02.5
57.510
12.515
17.520
22.525
27.530
32.535
37.540
With geogrid Without geogrid
Dis
pla
cem
en
t (m
m)
Section Type
Effect of Geogrid versus Total Displacement
Intial condition
Under loading
61
4.12 Common errors and accuracy in the FEM software PLAXIS.
During the simulation of the railway track modeling the following most common errors were
occurred in the numerical calculations
o Large stiffness difference:- in the numerical analysis, different models have been analyzed
with various values of materials stiffness in this report. The PLAXIS does not accept the
larger difference (more than 106) in stiffness values among the materials used as input
parameters.
o Due to the less number assigned to the max. Steps = 100 in the numerical control parameters
during early calculations it showed message of error in last step of calculation. Then by
increasing the number assigned to the max. Steps from 500 to 1000 and achieved the
accurate output results.
o Greater accuracy has been achieved in this report by assigning coarseness factor less than 1
and by generating the mesh of models with fine size.
o The input parameters for the PLAXIS should be realistic, because bad input materials
parameters can be not acceptable in PLAXIS.
4.13 Results and discussion
The tracks models have been simulated and analyzed as a plastic for both drained and un drained (dry & wet condition) in which the consolidation have not been taken into account. The plastic deformations are associated with all loading and unloading in addition to the elastic strains. The safety factors have been calculated by means of strength reduction methods by ignoring the suction. The dynamic analyses have been executed by time domain by using 0.44 second time interval for the passing of locomotive (Engine) only.
The results illustrate that the settlements in tracks under dry condition are less than those in the wet condition.so for the better performance of the track & to restrict the settlement within permissible limits, the drainage system play an crucial role to dispose of the water comes from any source (rain, flood and sewerage water from passengers coaches) and keep the track dry. Furthermore from the soil selection criteria the study indicates that the shear strength parameters i.e. friction angle ( , cohesion (C) and elastic stiffness (E) are the governing factors for the design to achieve track stability and satisfactory performance of the tracks.
For the new proposed Railway line the geogrid reinforcement layer or ballast mate between the ballast layer and subgrade give better performance in the track to reduce the settlement and in the effective drainage of substructure.

62
CHAPTER 5
5. FILLING MATERIALS FOR SUBGRADE
To improve the bearing capacity, shear strength and drainage of formation of track. The following techniques can be used under different circumstances like nature of soil, types of sleepers, weather, number of running tracks, types of coaches’ sewerage system, speed & loading conditions etc.
5.1 Improved soil include
5.1.1 Physical improved soil
By mixing the fine grained soil with coarse particles to improve foundation coefficient K30 Coarse particles soil may be mixed with fine particles to reduce porosity. Compaction through sheep footed roller of each layer having layer thickness not more than
30 cm as shown in photo 5-1 during the preparation of formation bed for the single line railway track in Jhang section.
Figure 5-1: Compaction of formation bed

63
5.1.2 Chemical improved soil
The cement (4-6%) or lime (6-9%) slurry are injected into loose soil, which fill up the cracks and voids helping to prevent water penetration into the sub grade, thus ultimately improve the bearing capacity of overall formation bed.
5.2 Foundation consolidation design of subgrade
5.2.1 Packed drain
This method is used for saturated cohesive soil foundation, such as muck soil, Silt and other native and compressible soil where the slow process of consolidation may be speed up by providing the sand drains which help in the expulsion of pore water from the soil.
Figure 5-2: Working on packed drains in progress
From the model law of consolidation, time changes as the square of the length of drainage path
[t =
] thus by reducing the distance by half (from H to H/2), increases the rate consolidation
by fourth times.in the case of sand drains where horizontal distance for drainage is shorter than the vertical direction, also keeping in mind that because of the particle shape of the clay, the horizontal permeability of a cohesive soil is usually larger than the vertical direction. i.e Horizontal conductivity Kh >> vertical conductivity Kv (Kh = (2 to 100) x Kv.
The coefficient of consolidation cv =
which indicates that the consolidation depends directly
on constrained modulus (M) and the coefficient of permeability (K) of the soil.
The soil having less cv value takes long time to consolidate.
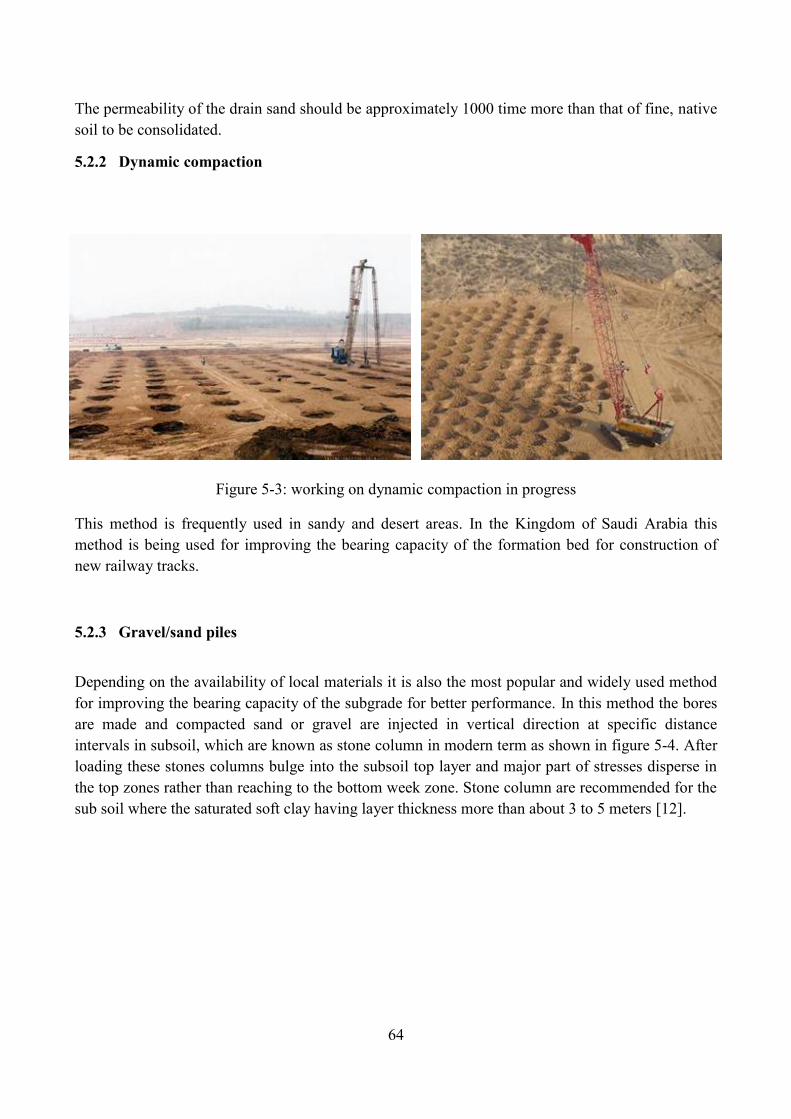
64
The permeability of the drain sand should be approximately 1000 time more than that of fine, native soil to be consolidated.
5.2.2 Dynamic compaction
Dynamic compaction:-
Figure 5-3: working on dynamic compaction in progress
This method is frequently used in sandy and desert areas. In the Kingdom of Saudi Arabia this method is being used for improving the bearing capacity of the formation bed for construction of new railway tracks.
5.2.3 Gravel/sand piles
Depending on the availability of local materials it is also the most popular and widely used method for improving the bearing capacity of the subgrade for better performance. In this method the bores are made and compacted sand or gravel are injected in vertical direction at specific distance intervals in subsoil, which are known as stone column in modern term as shown in figure 5-4. After loading these stones columns bulge into the subsoil top layer and major part of stresses disperse in the top zones rather than reaching to the bottom week zone. Stone column are recommended for the sub soil where the saturated soft clay having layer thickness more than about 3 to 5 meters [12].

65
Figure 5-4: Stone column installation process
Advantages:-This is the most suitable method for the existing operational tracks, because of simplicity and easy to execute, thus can be avoided the extra detention of trains.
5.2.4 Cement -mixed pile
Figure 5-5: Piles in yard
This method is mostly used in station yards and point & crossing or near approaches of major bridges having high embankment, retaining walls, Brest walls and abutments in water log and soft soil area.


67
5.2.7 T-shaped cement -mixed pile
Figure 5-8: Diagram showing the T- shaped piles injection process
These piles have higher bearing capacity and better economy, mostly used method for the track filling/embankment passing through the deep valleys or in the approaches of major bridges.
5.2.8 Removal /replacement
In case of shallow soft soil deposits in the alignment of new proposed railway line the method of removal of soft soil by excavation and then the replacement with suitable fill materials with individual compacted layer is followed which are considered comparatively simple and economical as shown in figure 5-9.

68
Figure 5-9: Diagram showing the typical cross section of removal and replacement works

69
CHAPTER 6
6. TRACK DRAINAGE
The ballast layer in Railway track is provided to serve the drainage besides to transfer the load from sleeper to a large area of formation without progressive settlement. The ideal ballast should be hard, durable, and tough & wear resistance with cubical size, the sharp edges, Non porous and absorbent of water. In the operational track the ballast deteriorates due the crushing of the edges and gets rounded shapes, the resultant products of fine particles referred as fouled materials [2] sink in the subgrade layer due the mud pumping from the subgrade layer under the moving train loading. Due to this continuous process the ballast converted into fouling materials which have considered unsuitable materials for track due to less shear strength capacity.
Proper track drainage is extremely important for the stability and safety of the substructure of the track. But fouling materials reduce the drainage capacity of the ballast due the filling of voids of ideal ballast as shown in figure 6-1.
Figure 6-1: Rain water in the middle of track due to the poor drainage
The water can come into the track from following different sources:
Rain water Surface water flow in hilly area as shown in figure 6-2

70
Figure 6-2: Cross section of drainage in hilly area
Upward seepage from the subgrade or water logged area. Sewerage water from the Passenger Coaches.
The track formation needs proper design and construction in such a way that all water comes from any of the above sources can be drained completely through perforated pipes or open side drains as soon as possible and keep the load bearing layer of the substructure dry, otherwise the following consequences may appear in the track.
i. Uneven longitudinal and cross settlement of the track resulting rough running or cause of derailment if cross-level exceed the permissible limit as shown in figure 6-3.
Figure 6-3: Track settlement due to the poor drainage

71
ii. Decrease the ballast shear strength and load bearing capacity. iii. Sinking of ballast layer into subgrade layer, preparation of mud, slurry under the cyclic
loading as shown as in figure 6-4.
Figure 6-4: Ballast mixed with soil layer
iv. The steel bars of the PSC sleeper get rusted due the entrance of water through small hairy cracks. The poor drainage and fouling materials combine contribute in the developing of hard cake surface after drying under the sleepers which reduce the exact function of ballast and also significantly reduce the serviceability life time of sleepers as shown in figure 6-5

72
Figure 6-5: Cracked sleeper due to the underneath rigid surface (Fouled ballast)
v. All the above problems badly affect overall performance of the track result in the increasing maintenance demand to keep the track for safe train operation.

73
The provision of drainage system of the railway’s tracks depends on the following factors;
I. Catchment Area:- The larger catchment area around the tracks more water can be expected near railway track
II. Water table: - The water table depth decides the surface drainage. e.g the shallow water table more surface drainage can be expected.
III. Permeability of soil:- The type of soil having high coefficient of conductivity (K) value is good in drainage, for example for cohesive soils like silt/clay are poor in drainage while sand/gravel granular soils are good in drainage.
6.1 Causes of failure of drainage system
The drainage system of the track may fail because of the following reasons:
i. Wrong estimation of the catchment area and rain water precipitation data of past and wrong calculation of return period of the expected rain in heavy rain fall region as shown in figure 6-6.
Figure 6-6: The formation washed away by flood water (Multan Division)
ii. Location of the side drains may not correct. iii. Wrong dimension of the drains, either too small or the slopes are not adequate to drain the
water quickly as shown in figure 6-7.

74
Figure 6-7: Inadequate side drains along the track (Rawalpindi-Lahore section)
iv. Poor construction may also one of the main causes of failure which is not stand by the design pressure or discharge of water.

75
CHAPTER 7
7. SPECIFICATIONS AND RECOMMENDATIONS
1) It has been investigated from different field experiments [5] that increasing the speed of moving trains, the demand of ballast sleepers contact pressure in the center & cantilever portion of the sleepers are also increasing. So for the speeds more than 120 Km/h it is recommended to replace all twin-block sleepers by PSC sleepers on main line to get uniform contact pressure under the sleepers.
Figure 7-1: Twin block sleepers in Main line (Rawalpindi to Lahore section)
2) As it is clear from the calculation (figure no. 2-6, Table 3) of load distribution pattern for different types of sleepers are different, so it is strongly recommended to replace the mixed type sleepers (steel, wooden or PSC) on main line to get uniform pressure and thus to get smooth running of the trains.
3) Further it is strongly recommended to provide same types of sleepers at the approaches of all bridges to get uniform contact pressure at the both ends of the bridges.
4) For new track behavior, it is assumed that the pressure distribution are under the rails seat only, for validation of this assumption it is suggested to use track machine for
packing/compacting and squeezing the ballast in the voids under the sleepers which are not

76
practically possible to achieve uniform pressure through manual packing in figure 7-3
Figure 7-2: Track maintenance through track machine
Figure 7-3: Track maintenance through labors (manually)
5) It is strongly recommended to keep the ballast clean from the dust, fines particles and should maintain the uniform depth resting on the compacted subgrade layer and in case of mixing or sinking into the sub grade, it must be replaced by fresh ballast for better performance in the bearing capacity and in effective drainage[2].
6) It is also recommended to encourage the vegetation on the bank of formation to reduce the dust production.it will reduce the contamination of ballast as well as will provide the clean and fresh environment for the passengers with aesthetic view.
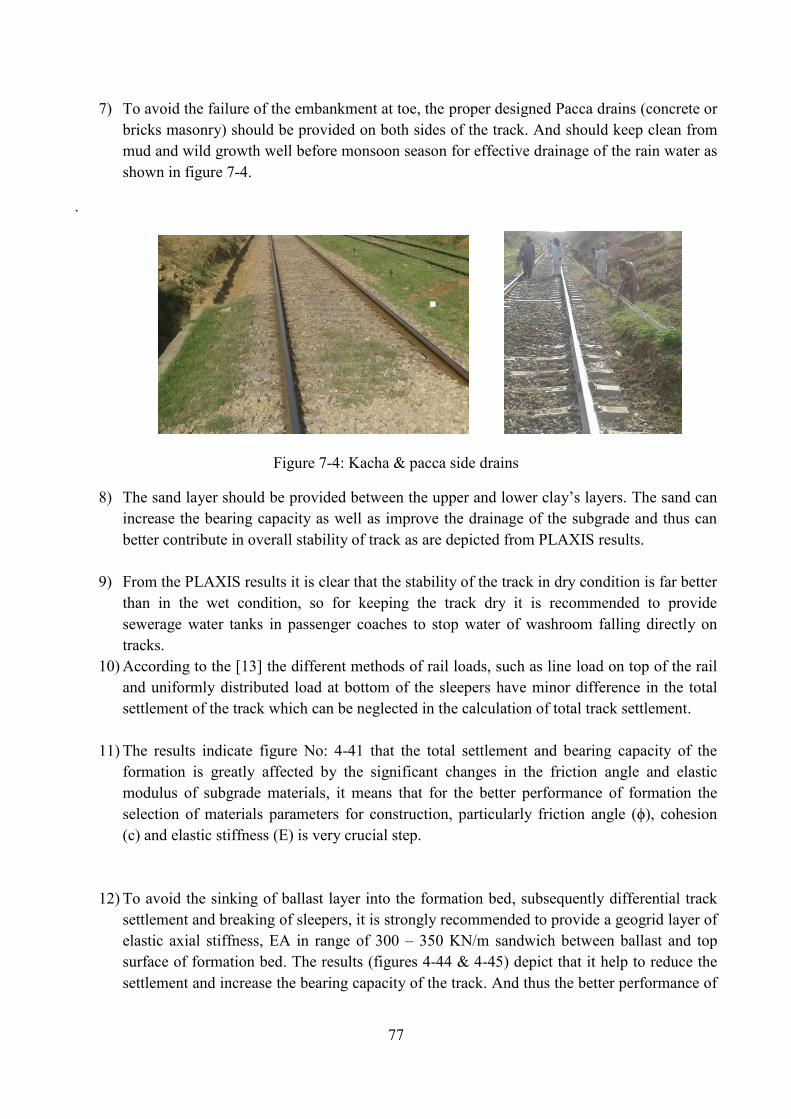
77
7) To avoid the failure of the embankment at toe, the proper designed Pacca drains (concrete or bricks masonry) should be provided on both sides of the track. And should keep clean from mud and wild growth well before monsoon season for effective drainage of the rain water as shown in figure 7-4.
.
Figure 7-4: Kacha & pacca side drains
8) The sand layer should be provided between the upper and lower clay’s layers. The sand can increase the bearing capacity as well as improve the drainage of the subgrade and thus can better contribute in overall stability of track as are depicted from PLAXIS results.
9) From the PLAXIS results it is clear that the stability of the track in dry condition is far better than in the wet condition, so for keeping the track dry it is recommended to provide sewerage water tanks in passenger coaches to stop water of washroom falling directly on tracks.
10) According to the [13] the different methods of rail loads, such as line load on top of the rail and uniformly distributed load at bottom of the sleepers have minor difference in the total settlement of the track which can be neglected in the calculation of total track settlement.
11) The results indicate figure No: 4-41 that the total settlement and bearing capacity of the formation is greatly affected by the significant changes in the friction angle and elastic modulus of subgrade materials, it means that for the better performance of formation the selection of materials parameters for construction, particularly friction angle (ϕ), cohesion (c) and elastic stiffness (E) is very crucial step.
12) To avoid the sinking of ballast layer into the formation bed, subsequently differential track settlement and breaking of sleepers, it is strongly recommended to provide a geogrid layer of elastic axial stiffness, EA in range of 300 – 350 KN/m sandwich between ballast and top surface of formation bed. The results (figures 4-44 & 4-45) depict that it help to reduce the settlement and increase the bearing capacity of the track. And thus the better performance of

78
track can be achieved in the less maintenance efforts and in cost control in form of less BBI and increasing the life time of the serviceability of the sleepers.
13) After the literature review it is recommended to follow the removal and replacement method for the ground improvement in order to construct the railway embankments if there is a soft layer in the alignment, because it is simple, economical and worldwide used ground improvement technique [12].
14) In this study different ballast layer thickness and ballast of different gradation have been investigated, the results illustrate that the gradation of ballast has a vital role in the strength of the track, deformation, better drainage of the sub-structure and overall stability of the tracks. Well graded ballast gives denser packing and frictional interlock and thus helps to reduce the differential settlements of the tracks.

79
8. REFERENCES
[1] “Wolf-et-al-2015-TRB-15-2924.pdf - Google Search.” [Online]. Available: https://www.google.de/search?source=hp&ei=wXyhWrCjA8GjkwWBzpnQAQ&q=Wolf-et-al-2015-TRB-15-2924.pdf&oq=Wolf-et-al-2015-TRB-15-2924.pdf&gs_l=psy-ab.12...34434.34434.0.36614.4.2.0.0.0.0.105.105.0j1.2.0....0...1c.1.64.psy-ab..2.1.183.6..35i39k1.184.p8w-fC856K8. [Accessed: 08-Mar-2018].
[2] B. Indraratna, “Advanced Rail Geotechnology – Ballasted Track,” p. 20, 2011.
[3] J. Sadeghi and P. Barati, “Evaluation of conventional methods in Analysis and Design of Railway Track System,” vol. 8, no. 1, p. 13, 2018.
[4] J. M. Sadeghi and M. Youldashkhan, “INVESTIGATION ON THE ACCURACY OF THE CURRENT PRACTICES IN ANALYSIS OF RAILWAY TRACK CONCRETE SLEEPERS,” Int. J. Civ. Eng., vol. 3, no. 1, p. 15, 2005.
[5] J. Sadeghi, “New Advances in Analysis and Design of Railway Track System,” Reliab. Saf. Railw., p. 28.
[6] C. Choudhury, “Functions – Provide a hard and level bed for sleepers – Hold sleepers in place during passage of trains – Transfers and distributes load from sleepers to larger area – Provides effective drainage and keep sleeper dry – Prevent vegetation growth – Prevents water from percolating (capillary rise) – Provide track stability Design of ballast – Choose material – Determine depth,” p. 11.
[7] S. Lakušić, “Ispitivanje krutosti tucaničkog zastora na željezničkom kolosijeku,” J. Croat. Assoc. Civ. Eng., vol. 68, no. 4, pp. 311–318, May 2016.
[8] B. Indraratna, S. Nimbalkar, C. Rujikiatkamjorn, and A. Heitor, “Ground improvement in transport geotechnics – from theory to practice,” in Computer Methods and Recent Advances in Geomechanics, F. Oka, A. Murakami, R. Uzuoka, and S. Kimoto, Eds. CRC Press, 2014, pp. 35–44.
[9] N. Tennakoon, B. Indraratna, and C. Rujikiatkamjorn, “Effect of ballast contamination on the behaviour of track substructure,” p. 16.
[10] Q. D. Sun, B. Indraratna, and S. Nimbalkar, “Effect of cyclic loading frequency on the permanent deformation and degradation of railway ballast,” Géotechnique, vol. 64, no. 9, pp. 746–751, Jul. 2014.
[11] “Track construction and maintenance guidelines: Guidelines VC1672,” p. 211, 2008.
[12] A. Arulrajah, A. Abdullah, M. W. Bo, and A. Bouazza, “Ground improvement techniques for railway embankments,” Proc. Inst. Civ. Eng. - Ground Improv., vol. 162, no. 1, pp. 3–14, Feb. 2009.
[13] H. C. Yap, H. Khabbaz, and J. Singh, “NUMERICAL ANALYSIS OF GEOSYNTHETICS AND ENGINEERING FILL IN PERFORMANCE OF RECONDITIONED BALLASTED TRACK,” vol. 52, no. 1, p. 13, 2017.
All pictures/photos in this report have been taken from different divisions of PAKISTAN RAILWAYS according to the problems highlighted in the report.