nuclear: a critical role in our 21st century energy...
TRANSCRIPT

Nuclear: A Critical Role in Our 21st Century Energy Portfolio
38th Annual PURC Conference
Paul H. Genoa
Director, Policy Development
Nuclear Energy Institute

Overview
Nuclear Plant performance
License Renewal /Long-Term Operation
Used Fuel Management/Blue Ribbon Com.
Recognition of Environmental Benefits
Public Opinion
Status of New Plant Developments
Current Political Support

U.S. Electricity Production Costs 1995-2009, In 2009 cents per kilowatt-hour
Production Costs = Operations and Maintenance Costs + Fuel Costs. Production costs do not include indirect costs and are based on FERC
Form 1 filings submitted by regulated utilities. Production costs are modeled for utilities that are not regulated.
Source: Ventyx Velocity Suite
Updated: 5/10

Fuel Type Average Capacity Factors (%)
Nuclear 90.5
Geothermal 71.5
Biomass 66.0
Coal (Steam Turbine) 63.1
Gas (Combined Cycle) 44.7
Hydro 29.4
Wind 27.8
Solar 23.5
Gas (Steam Turbine) 13.3
Oil (Steam Turbine) 7.4
U.S. Capacity Factors by Fuel Type2009
Source: Ventyx Velocity Suite / Energy Information Administration
Updated: 5/10

U.S. Nuclear Plant Output Growth Billion kWh
Equivalent to 28 new 1,000-megawatt power plants
576.9
798.7
1990 2009
Source: Energy Information Administration
Updated: 4/10

Cumulative Capacity Additions at U.S. Nuclear Facilities
1977-2014
Source: Nuclear Regulatory Commission
Updated: 10/10

59 Units Granted
23 Units Under
Review
16 Units Intend
to Renew
Applications for License Renewal
Source: Nuclear Regulatory Commission
Updated: 11/10
6 Units
Unannounced

Environmental

U.S. Electricity Sources Which Do Not Emit Greenhouse Gases During Operation
2009
Nuclear
69.3%
Wind
6.1%
Hydro
23.2%
Solar
0.1%Geothermal
1.3%Source: Energy Information Administration
Updated: 4/10

647.2
219.0
57.912.4 0.7
Nuclear Hydro Wind Geothermal Solar
U.S. Electric Power Industry CO2 AvoidedMillion Metric Tons, 2009
Source: Emissions avoided are calculated using regional and national fossil fuel emissions rates from the
Environmental Protection Agency and plant generation data from the Energy Information Administration.
Updated: 5/10

Perspective on CO2 Emissions Prevented By U.S. Nuclear Plants
Million Metric Tons, 2009
647.2
711.9
Source: Emissions avoided by nuclear power are calculated using regional fossil fuel emission rates from the Environmental
Protection Agency and plant generation data from the Energy Information Administration. Car emissions from EPA, Office of
Transportation and Air Quality Emissions Facts (April 2000).
Updated: 5/10
equals CO2 from
125 million cars
CO2 emissions prevented by U.S.
nuclear power plants (2009)
CO2 emitted by all 137 million
U.S. passenger cars (2008)

Comparison of Life-Cycle EmissionsTons of Carbon Dioxide Equivalent per Gigawatt-Hour
1,041
622
46 39 18 17 15 14
Coal Natural Gas Biomass Solar PV Hydro Nuclear Geothermal Wind
Source: "Life-Cycle Assessment of Electricity Generation Systems and Applications for Climate Change Policy Analysis," Paul J.
Meier, University of Wisconsin-Madison, August 2002.

Summary of Studies on Climate Change Mitigation
New Nuclear Generation Capacity Required
Source Study /AnalysisNumber of new
reactors*Gigawatts Timeframe
Energy Information
Administration
Annual Energy Outlook 2010 6 8 2035
Kerry/Lieberman, American Power Act
(2010)52 72 2035
Waxman/Markey (2009) 69 96 2030
Lieberman/Warner (2008) 191 268 2030
Environmental Protection
Agency
Kerry/Lieberman, American Power Act
(2010)181 253 2050
Waxman/Markey (2009) 187 262 2050
Lieberman/Warner (2008) 179 250 2050
National Academy of
Sciences
America’s Energy Future: Technology
and Transformation (2009)77 108 2035
Electric Power Research
InstitutePrism/Merge Analyses: 2009 Update 46 64 2030
McKinsey & Company
U.S. Greenhouse Gas Abatement
Mapping Initiative - Mid-Range Case
(2007)
18 25 2030
*Based on a 1,400 MW average nuclear plant.

Safety

Significant Events at U.S. Nuclear Plants: Annual Industry Average, Fiscal Year 1988-2008
Source: NRC Information Digest, 1988 is the earliest year data is available.
Updated: 4/10
Significant Events are those events that the NRC staff identifies for the
Performance Indicator Program as meeting one or more of the following criteria:
A Yellow or Red Reactor Oversight Process (ROP) finding or performance
indicator
An event with a Conditional Core Damage Probability (CCDP) or increase in
core damage probability (ΔCDP) of 1x10⁻⁵ or higher
An Abnormal Occurrence as defined by Management Directive 8.1,
―Abnormal Occurrence Reporting Procedure‖
An event rated two or higher on the International Nuclear Event Scale

U.S. Industrial Safety Accident Rate2009
0.10
1.70
1.80 1.90
2.70
Nuclear generation Hydro generation Fossil-fuel
generation
Utilities Manufacturing
ISAR = Number of accidents resulting in lost work, restricted work, or fatalities per 200,000 worker hours. Hydro, fossil-fuel, utilities and
manufacturing data do not include fatalities.
Sources: Nuclear (World Association of Nuclear Operators), 2008 data for all others (U.S. Bureau of Labor Statistics).
Updated: 6/10

Average Collective Dose Per Reactor 1973-2008, Person-rem
0
100
200
300
400
500
600
700
800
900
0
200
400
600
800
1,000
1,200
1973 1978 1983 1988 1993 1998 2003 2008
BWR
LWR
PWR
U.S. Nuclear Generation, BkWh
Source: Nuclear Regulatory Commission - Occupational Radiation Exposure at Commercial Nuclear Power Reactors and Other Facilities,
Energy Information Administration
Updated: 6/10
Used Nuclear Fuel
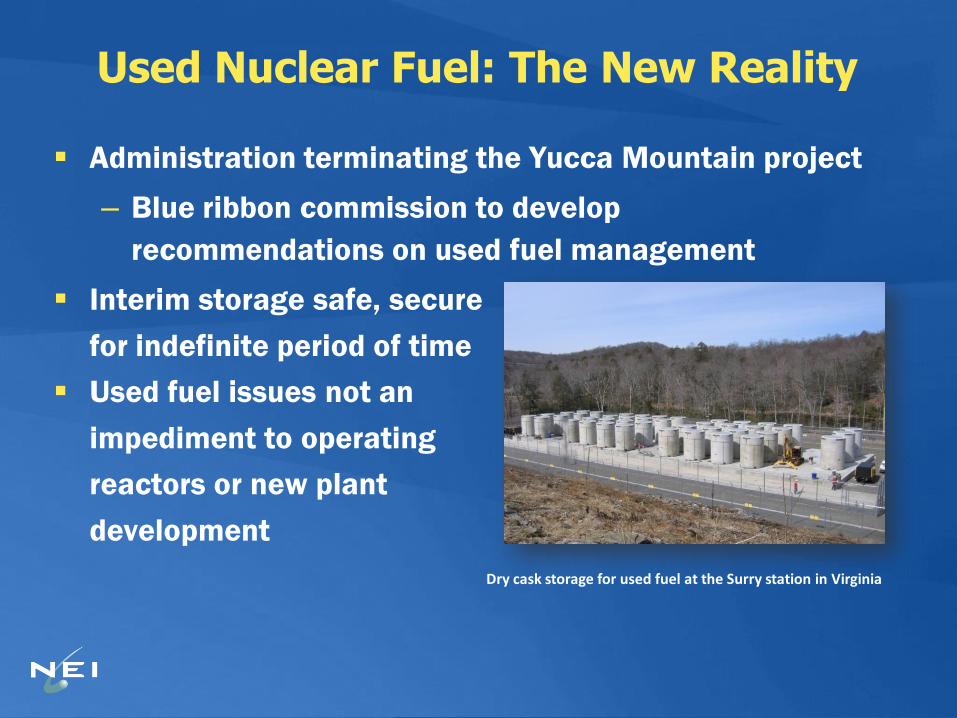
Administration terminating the Yucca Mountain project
– Blue ribbon commission to develop
recommendations on used fuel management
Interim storage safe, secure
for indefinite period of time
Used fuel issues not an
impediment to operating
reactors or new plant
development
Used Nuclear Fuel: The New Reality
Dry cask storage for used fuel at the Surry station in Virginia

Recognition of Environmental Benefits

Yvo de Boer -
Executive Secretary, UNFCCC
―I have never seen a
credible scenario for
reducing emissions
that did not include
nuclear energy‖
June 2007
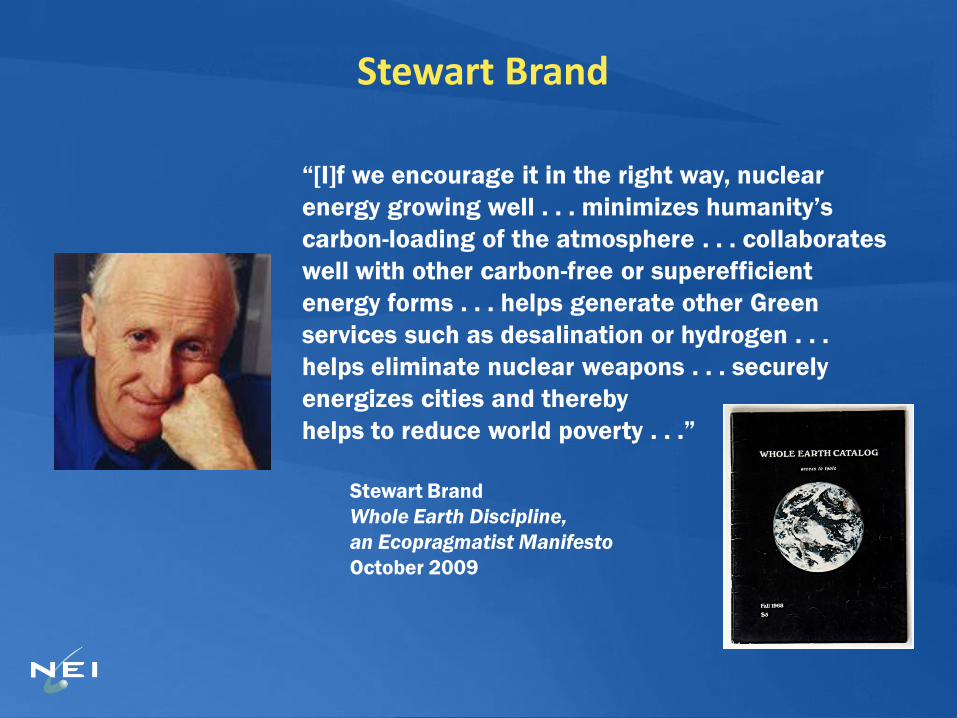
―[I]f we encourage it in the right way, nuclear
energy growing well . . . minimizes humanity’s
carbon-loading of the atmosphere . . . collaborates
well with other carbon-free or superefficient
energy forms . . . helps generate other Green
services such as desalination or hydrogen . . .
helps eliminate nuclear weapons . . . securely
energizes cities and thereby
helps to reduce world poverty . . .‖
Stewart Brand
Whole Earth Discipline,
an Ecopragmatist Manifesto
October 2009
Stewart Brand

―I think that next-generation, safe
nuclear power is an option which
we need to develop. And it is being
developed in many countries
around the world. So if the United
States declines to do that, we're
just going to suffer economically
because other countries will take
the lead in that technology.‖
Dr. James E. Hansen, Director
NASA Goddard Institute for Space Studies
January 26, 2010
Dr. James Hansen, NASA

Public Opinion

U.S. Public Opinion 1983 – 2010: Favorability to the Use of Nuclear Energy for Electricity
Annual Averages Until 2010, Percentages
Bisconti Research, Inc. March 2010 survey of 1,000 U.S. adults; margin of error +/- 3 percentage points

Strong Public Support Continues
74% Favor Use of Nuclear
Energy
87% Favor
RenewingLicenses
87%Important
forOur Energy
Future
70%DefinitelyBuild NewReactors
77%Acceptable
atNearest
Site
Source: Bisconti Research Inc./Gfk Ropper
March 2010 poll of 1,000 U.S. adults; margin of error is +/- 3%

New Plant Information

3,830
4,898
2009 2035
Net Generation to the Grid
U.S. Needs 28 Percent More Electricity by 2035 BkWh
Source: Energy Information Administration’s Annual Energy Outlook 2010
Updated: 2/10

Capacity Brought Online by Fuel Type 1950-2009 (Nameplate Capacity, MW)
0
10,000
20,000
30,000
40,000
50,000
60,000
70,000
80,000
1950 1955 1960 1965 1970 1975 1980 1985 1990 1995 2000 2005
Water
Renew
Petro
Other
Nuclear
Gas
Coal
Source: Ventyx Velocity Suite
Updated: 2/10

Nuclear Units Under Construction and Planned Worldwide
2411
42
51222
11112
11
3314
20126
96
22
222
1
ChinaRussia
IndiaJapan
S. KoreaUS
China, TaiwanBulgariaUkraine
ArgentinaIran
PakistanFrance
SlovakiaBrazil
Finland
Under construction
Planned
Sources: International Atomic Energy Agency for units under construction and World Nuclear Association for units on order or planned.
*Chart includes only countries with units under construction. **Countries planning new units are not all included in the chart.
Planned units = Approvals, funding or major commitment in place, mostly expected in operation within 8-10 years.
Updated: 10/10
Totals:
61 units under construction*
149 units on order or planned**

Near-Term Fundamentals Negative,Long-Term Fundamentals Have Not
Changed
North American electricity demand will not recover
to pre-recession levels until 2012 or so
Most regional power markets likely to remain
oversupplied for at least the next five years
Spot power prices projected to remain soft in
2010-2011 at least
Low natural gas prices likely to persist in near term

Technical questions are being addressed before
construction begins
– Process is transparent and readily available to the public
– Hearing process is proceeding as scheduled where
applicable
Construction inspection in
progress
First facility start-up for
combined license will occur
in 2010 for LES’ National
Enrichment Facility
Part 52 Licensing Process Working as Planned
Photo courtesy Louisiana Energy Services
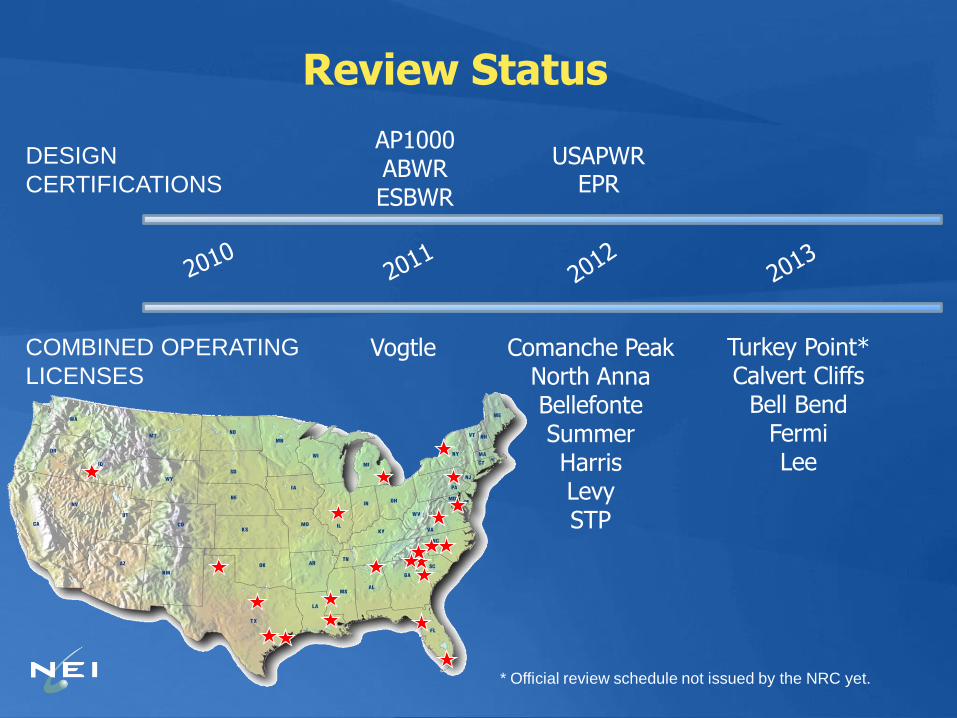
Review Status
Vogtle Comanche PeakNorth Anna BellefonteSummer Harris Levy STP
Turkey Point* Calvert Cliffs
Bell BendFermi Lee
AP1000 ABWRESBWR
USAPWREPR
DESIGN
CERTIFICATIONS
COMBINED OPERATING
LICENSES
* Official review schedule not issued by the NRC yet.

State Policies Supporting New Nuclear
Potential
location for
new nuclear
facility
Legislation
Both legislation and regulation
Regulation

Site Preparations Are UnderwayVogtle Units 3 and 4
Photo Courtesy Southern Company
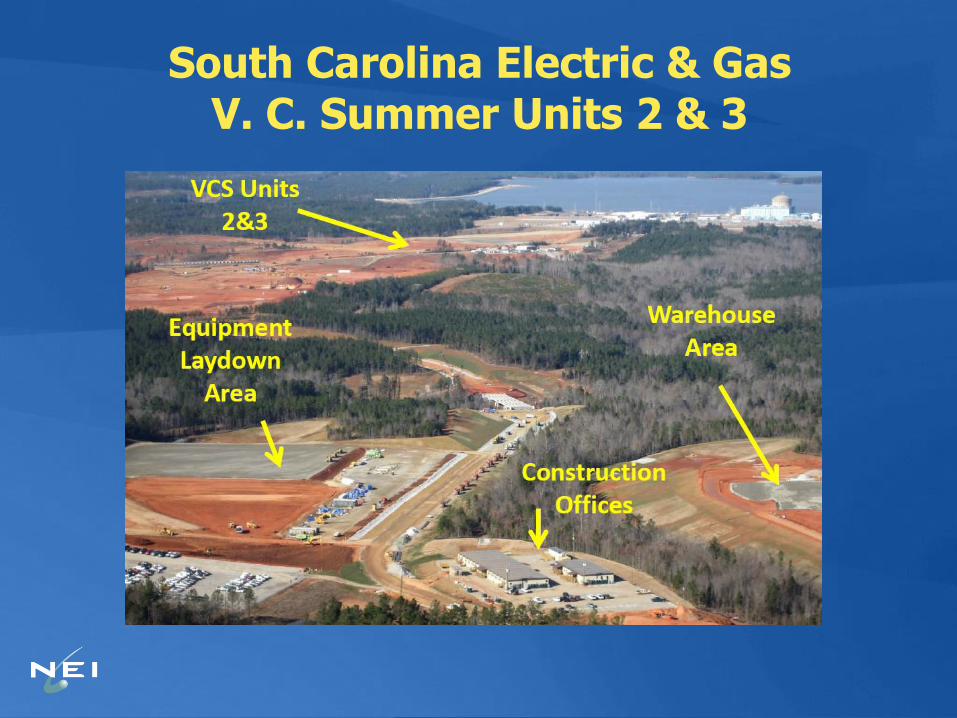
South Carolina Electric & GasV. C. Summer Units 2 & 3

Work Force: Training the Industry’sNext Generation
52 community college nuclear partnership programs
28 state energy work force consortia
More than $90 million in federal grants to support nuclear career and work force development activities

Growth in Nuclear Supply Chain Continues
Shaw Group near completion of new nuclear component
manufacturing facility in Lake Charles, La.
Global Laser Enrichment started test loop in Wilmington, N.C.,
in July 2009
AREVA and Northrop Grumman
broke ground in July 2009 in
Newport News, Va., on nuclear
components manufacturing
facility
10 percent increase in number
of domestic ―N-stamps‖
Groundbreaking for AREVA-Northrop Grumman manufacturing facility
Photo Courtesy AREVA

Economic Benefits of Nuclear PowerJob Creation
1,400 – 1,800 jobs during construction, peak employment up to 2,400 jobs
700 permanent operating jobs: These jobs pay 36% more than average local
salaries
700 equivalent additional jobs in local area to support the plant workforce &
families
Suppliers
400,000 cubic yards of concrete—five times as much the 100-story Sears Tower
66,000 tons of steel
44 miles of piping and 300 miles of electric wiring
130,000 electrical components.
Local Economy
$430 million a year in total output for the local community
$40 million per year in total labor income.
Every $1 spent by the average nuclear plant results in the creation of $1.07 in the
local community.
$20 million per year in state and local taxes. These tax payments support
schools, roads and other state and local infrastructure.
$75 million per year in federal taxes

New Nuclear Will Be Competitive
Source: National Research Council of the National Academies,America’s Energy Future: Technology and Transformation
Combined cycle (low gas price) 4-7
Wind (onshore) 4-10
Coal 5-9
Wind (offshore) 5-18
Nuclear 6-13
Combined cycle with CCS (low gas price) 7-10
Biopower 8-10
Solar CSP 8-20
Coal with CCS 9-15
Geothermal 10
Combined cycle (high gas price) 10-16
Combined cycle with CCS (high gas price) 14-21
Solar PV 14-30
Levelized Cost of Electricity (2007 cents per kilowatt-hour)

Current Political Support
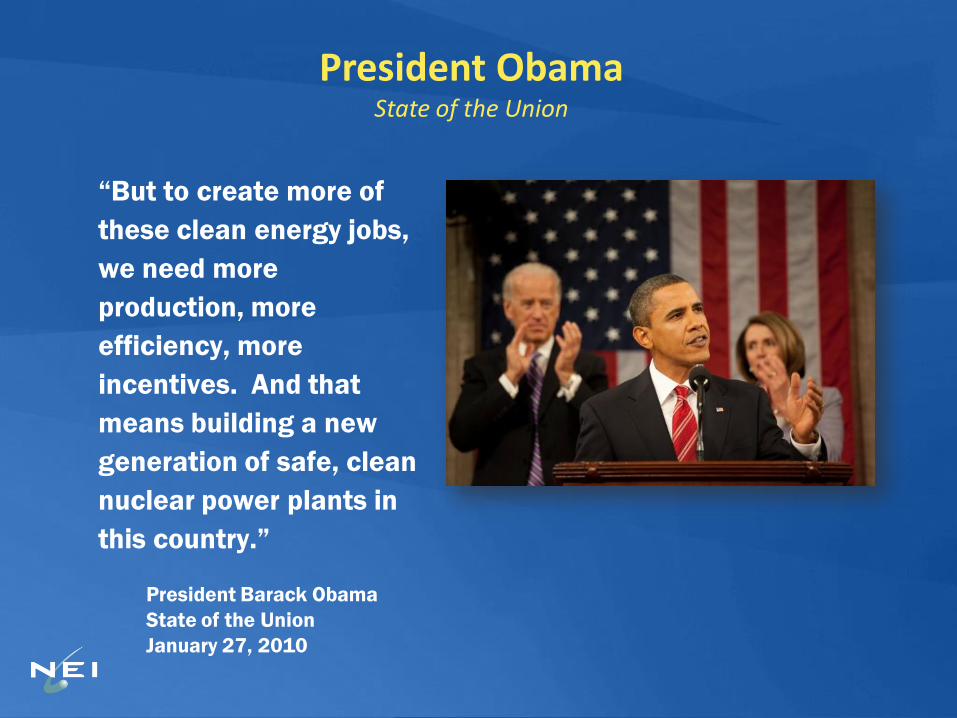
―But to create more of
these clean energy jobs,
we need more
production, more
efficiency, more
incentives. And that
means building a new
generation of safe, clean
nuclear power plants in
this country.‖
President Barack Obama
State of the Union
January 27, 2010
President ObamaState of the Union
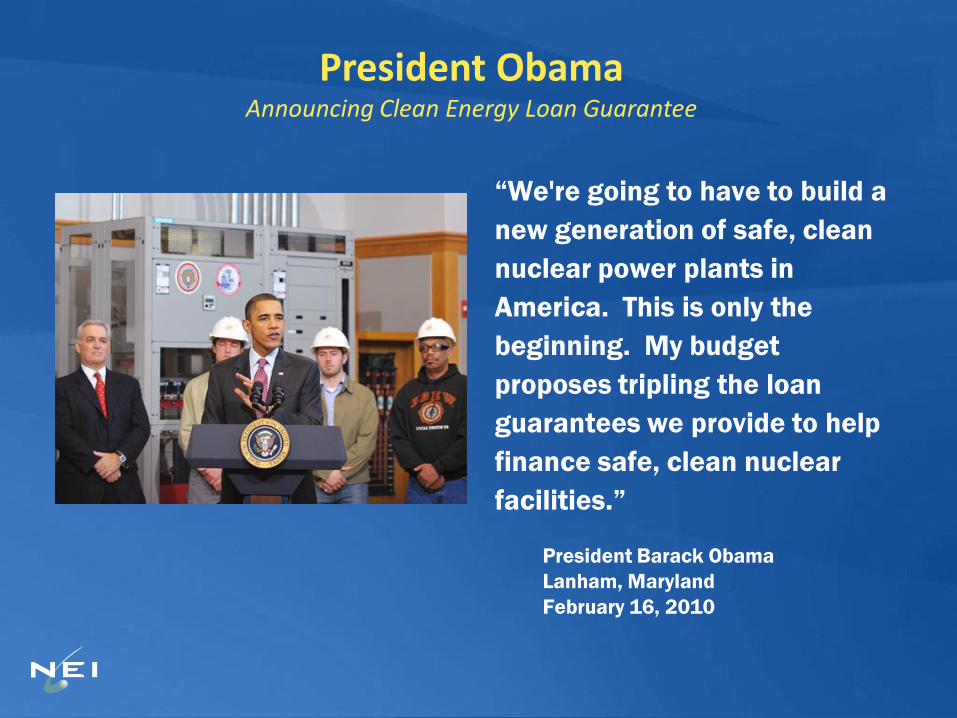
―We're going to have to build a
new generation of safe, clean
nuclear power plants in
America. This is only the
beginning. My budget
proposes tripling the loan
guarantees we provide to help
finance safe, clean nuclear
facilities.‖
President Barack Obama
Lanham, Maryland
February 16, 2010
President ObamaAnnouncing Clean Energy Loan Guarantee
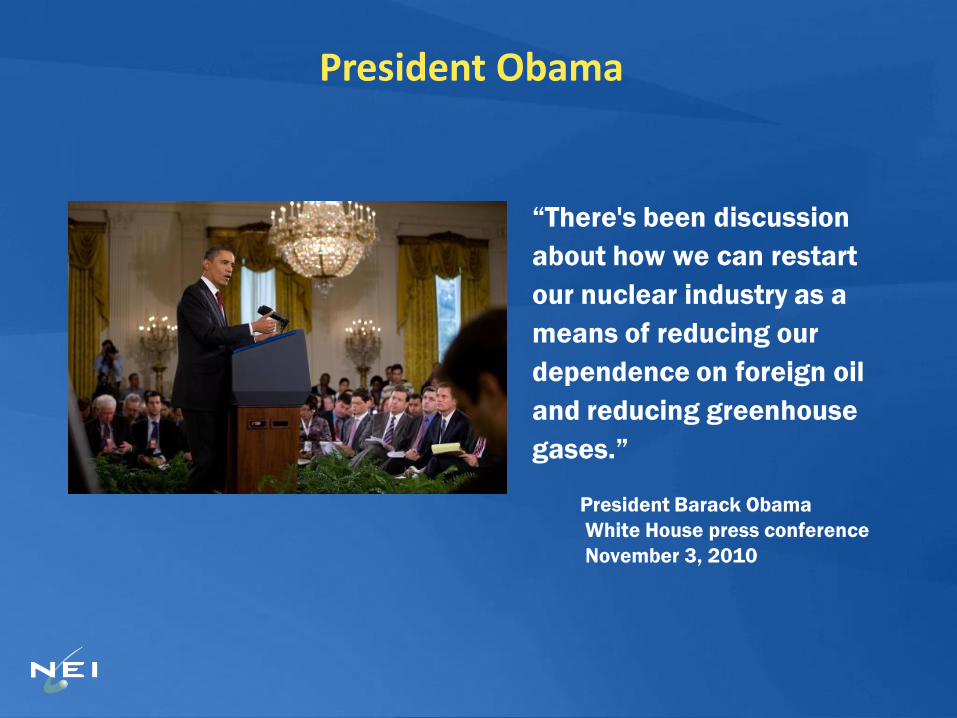
―There's been discussion
about how we can restart
our nuclear industry as a
means of reducing our
dependence on foreign oil
and reducing greenhouse
gases.‖
President Barack Obama
White House press conference
November 3, 2010
President Obama

―investing in nuclear energy will
position America to lead in a
growing industry. If we are serious
about cutting carbon pollution then
nuclear power must be part of the
solution.‖
Dr. Steven Chu
Wall Street Journal
March 3, 2010
Secretary of EnergyDr. Steven Chu

President ObamaState of the Union
―So tonight, I challenge you
to join me in setting a new
goal: By 2035, 80 percent of
America’s electricity will
come from clean energy
sources.‖
―Some folks want wind and
solar. Others want nuclear,
clean coal and natural gas.
To meet this goal, we will
need them all.‖
President Barack Obama
State of the Union
January 25, 2011

One More PerspectiveJust for Fun!
―I love nuclear.‖
Bill Gates
Remarks at MIT
April 21, 2010
Bill Gates