nu skin enterprises - nu viỆtdeannguyen.typepad.com/files/jp-morgan---nse.pdf · we are...
TRANSCRIPT

North America Equity Research 12 July 2010
Nu Skin Enterprises Initiation
Overweight NUS, NUS US
Getting Some Skin in the Game; Initiating at Overweight
Price: $27.26
Price Target: $37.00
Household Products and Personal Care John FaucherAC
(1-212) 622-6443 [email protected]
Peter K Grom (1-212) 622-4876 [email protected]
Sofya Tsinis (1-212) 622-6391 [email protected]
Neal Rudowitz (1-212) 622-0094 [email protected]
J.P. Morgan Securities Inc.
10
20
30
$
Jul-09 Oct-09 Jan-10 Apr-10 Jul-10
Price Performance
YTD 1m 3m 12mAbs -1.2% 5.5% -7.6% 77.2%
Nu Skin Enterprises (NUS;NUS US) 2009A 2010E 2011E 2012EEPS - Recurring ($) Q1 (Mar) 0.28 0.48A Q2 (Jun) 0.37 0.46A Q3 (Sep) 0.41 0.47A Q4 (Dec) 0.46 0.50A FY 1.52 1.91A 2.21 2.50Source: Company data, Bloomberg, J.P. Morgan estimates.
Company Data Price ($) 27.26Date Of Price 09 Jul 1052-week Range ($) 33.99 - 14.69Mkt Cap ($ bn) 1.77Fiscal Year End DecShares O/S (mn) 65Price Target ($) 37.00Price Target End Date 31 Dec 11
See page 31 for analyst certification and important disclosures. J.P. Morgan does and seeks to do business with companies covered in its research reports. As a result, investors should be aware that the firm may have a conflict of interest that could affect the objectivity of this report. Investors should consider this report as only a single factor in making their investment decision.
We are initiating coverage on Nu Skin Enterprises with an Overweight rating and YE’11 price target of $37. We believe that Nu Skin will continue to benefit from the recent rollout of the ageLOC product around the globe. This will drive additional revenue at a significantly higher incremental operating margin, creating EPS upside and multiple expansion.
• ageLOC should drive top-line growth. Nu Skin has launched ageLOC, a new skin care product that has driven significant top-line upside since its launch late last year. They will follow with a nutritional version in 2011. We think ageLOC can help accelerate Nu Skin’s top line from the 6% CAGR over the past few years to more of a 6-8% range going forward. We expect 11% top-line growth in 2010, with 6% for 2011 despite a difficult comparison, and 7-8% in 2012.
• High incremental margins will drive EPS upside. We believe that the incremental operating margin for Nu Skin on revenue growth above 4% is about 35%, or 3x the trailing 12-month margin of 11.9%. We believe that their 6-8% top-line growth rate should deliver margin expansion in the 70 bp range, which could drive operating profit growth at a double-digit rate.
• Our EPS estimates for both 2010 and 2011 are above consensus. For 2010 we are at $1.91 versus consensus of $1.88. For 2011 we are at $2.21 vs. consensus of $2.11. While our top-line estimates are just slightly above consensus, we believe that our margin expectations are a little higher given our views on incremental margins.
• We believe cash flow per share will double from 2008 to 2012, which should help the company buy back 10%-15% of the shares outstanding from 2010 to 2012. The company had $196 million available in repurchase authorization as of June 1st.
• Fx exposure is less negative than for many other staples peers. Nu Skin is predominantly an Asian company, with Japan as the top market. Our Fx model shows currency still favorable in 2010 and neutral in 2011.
• We rate Nu Skin Overweight, with a YE’11 price target of $37, which works out to about 14x our 2012 estimate of $2.50. Valuation is compelling, at 12.8x 2011E numbers, vs an average PE of 15x NTM estimates over the past 5 years. As numbers move higher, and the company buys back more stock, we think that the valuation will improve.
2
North America Equity Research 12 July 2010
John Faucher (1-212) 622-6443 [email protected]
Table of Contents Key Investment Points .............................................................3 Investment Risks......................................................................3 Company Description ..............................................................4 Earnings Growth.......................................................................5 What Is ageLOC?....................................................................10 Company Guidance................................................................11 Earnings Projections..............................................................12 Product Breakout ...................................................................13 Lots of Cash and Little Debt..................................................17 Geographic Breakout .............................................................18 Direct Selling Distribution .....................................................23 Management ...........................................................................26 Valuation .................................................................................27
3
North America Equity Research 12 July 2010
John Faucher (1-212) 622-6443 [email protected]
Key Investment Points • The top-line and incremental margin benefits that will come from the
ageLOC launch should drive growth going forward. The initial results for Nu Skin's new anti-aging product launch, ageLOC, are very encouraging. ageLOC has driven strong top-line growth in the markets where it has been fully launched and where it has pre-launched. We believe the incremental margin on this new product is somewhere around 90% (vs. the overall company average of 80%). We think the top-line benefit, in addition to the incremental margin, will help drive earnings growth over the next few years.
• Our incremental margin analysis shows upside to guidance/consensus. Company guidance is for margin expansion of 60-100 bp in 2010. Our estimate is for about 130 bp of margin. This is because we believe that NUS’s incremental operating margin for revenue growth above 4% is at least 35%, or 3x the 2009 operating margin. As long as the top line comes in better than anticipated for 2010 and 2011, the incremental revenue should flow through at a greater-than-expected rate.
• Geographic exposure represents an area of strength, rather than a reason for concern. International sales represent 84% of total revenues. Given the recent currency fluctuations we have seen, this may pose some concern (similar to what we have seen with Tupperware). We note that while Nu Skin does operate in Europe and Latin America, it is still primarily exposed to Asian countries. Our currency model shows that Fx is still favorable for full-year 2010, and roughly neutral for 2011 at current rates.
• Direct sales combined with strong innovation keeps sales force engaged. Nu Skin has a strong direct sales distribution network, composed of executive and active distributors. Given their recent product innovation and strong pipeline for the future, we feel that this will continue to drive strong distributor growth. Given the strong correlation between overall top-line growth and total number of distributors (73%), we think this bodes well for revenue trends going forward.
• Potential for China is great, while any stabilization in Japan should drive upside. After some initial issues with China and years of declining revenue in Japan, some restructuring seems to be providing the stabilization these two regions needed. The elimination of excess corporate overhead has allowed the company to become more flexible. We expect strong growth in China going forward, and some stabilization going forward in Japan behind the new management team and the ageLOC launch.
Investment Risks • The biggest risk, in our opinion, is slower-than-expected revenue growth for
the ageLOC system. While initial indications are very strong, particularly the 85% repeat rate (of consumers who repurchase), there is no guarantee that growth will continue. It is also difficult to map out how Nu Skin will comp the rollout of the ageLOC product in Q4 2009 (strong convention sales) and Q1 2010.
Nu Skin Enterprises (NUS) Overweight
4
North America Equity Research 12 July 2010
John Faucher (1-212) 622-6443 [email protected]
• Top-line and EPS growth likely will decelerate from highly elevated levels over last 2 quarters. Following very strong results in Q4 ’09 and Q1 ’10, we expect revenue and earnings growth to decelerate over the balance of the year. From almost 20% revenue growth in 1H 2010, we expect only about 4% growth in 2H 2010 and 5-6% in 1H 2011. This will drive a fall-off in EPS growth from 44% to just 10% from 1H 2010 to 2H 2010. While we believe this deceleration is more than priced in at current levels, it could weigh on the multiple going forward.
• Pharmanex sales continue to struggle. With the market's focus almost solely on ageLOC, Pharmanex's decline gets less attention than it probably deserves. Pharmanex sales have declined at a CAGR of -4% since peaking in 2005. In the short term, we believe that incremental sales from ageLOC will offset this headwind, and increased distributor count should help as well. The key will be the launch of the Pharmanex ageLOC product in 2H 2011.
• Regulation is a consistent risk. As a multi-level marketer, Nu Skin does have a greater regulatory risk than the vast majority of our coverage universe. In particular, there is heightened sensitivity surrounding direct sales in China given some concerns about business practices at Avon. At this point, given Nu Skin’s recent restructuring of their business in China to a more simplified, less geographically expansive model, we see limited risk.
Company Description Nu Skin is a global direct selling company that develops innovative and premium-quality anti-aging personal care products and nutritional supplements under their two brands: Nu Skin and Pharmanex. Currently, Nu Skin represents about 60% of total company sales, with Pharmanex representing just over 40%.
The primary drivers of success for Nu Skin have been their product innovation and distributor initiatives. At the end of 2009, Nu skin had 761,000 active distributors, of which 33,000 were qualified as "executive distributors," who are their sales leaders.
Nu Skin is a “multi-level” marketer, in that its distributors benefit from the downstream performance of other distributors that they can recruit to the franchise. As such, the executive distributors carry a lot of clout within the organization. The growth in executive distributors has accelerated over the past few years behind new product launches, and we are seeing a further acceleration behind the ageLOC launch. This should drive downstream distributor growth as well.
With operations in approximately 50 markets worldwide and 84% of 2009 revenue from markets outside of the United States, it is easy to see that Nu Skin is geographically diverse. Despite such a global expansion over the past decade or so, Japan still accounted for 35% of 2009 revenue.

5
North America Equity Research 12 July 2010
John Faucher (1-212) 622-6443 [email protected]
Earnings Growth Strong Top-Line Growth and Incremental Margin Benefits Should Lead to Accelerated Earnings Growth Nu Skin has shown solid sales growth over the past several years, with a CAGR of about 6% since 2006. This growth has been driven by the solid success of the skin care franchise, which has benefited from greater management/distributor focus, as well as a better new product pipeline. Growth on the Nu Skin line has been offset by weakness over time in the Pharmanex business. The 6% CAGR is even more impressive when we consider that their single largest market, Japan (approximately 35% of total revenues), has been underperforming versus the rest of the company’s markets. Excluding currency, Japan's revenues have been down y-o-y every quarter since Q405. We believe that the launch of the ageLOC product can actually get Japanese revenues close to flat. If Japanese revenues come in flat over the next 12 months, that should drive a company-wide 200 bp sequential improvement in revenue growth. Looking ahead to the rest of 2010 and 2011, we assume that sales will grow 11% and 6% for the year, respectively. We are assuming the rollout of ageLOC will accelerate the top line in 2010 and help stabilize some of the markets where LC revenue growth had previously been underperforming. While we are assuming a deceleration in 2011, this is mainly due to tougher comparables as the company will cycle the ageLOC launches that are currently under way. Figure 1: ageLOC Revenue by Quarter $ in millions
$29
$65$70
$80
$90$95
$75 $75
$55
$-
$25
$50
$75
$100
Q4 '09 Q1 '10 Q2 '10 Q3 '10 Q4 '10 Q1 '11 Q2 '11 Q3 '11 Q4 '11
Source: Company reports and J.P. Morgan estimates.

6
North America Equity Research 12 July 2010
John Faucher (1-212) 622-6443 [email protected]
Figure 2: YOY Total Sales Growth 2006-2011E YOY Change in Sales
-5.8%
3.8%
7.8%6.7%
11.1%
6.0%
-8.0%
-6.0%
-4.0%
-2.0%
0.0%
2.0%
4.0%
6.0%
8.0%
10.0%
12.0%
2006 2007 2008 2009 2010E 2011E
Source: J.P. Morgan estimates, Company data.
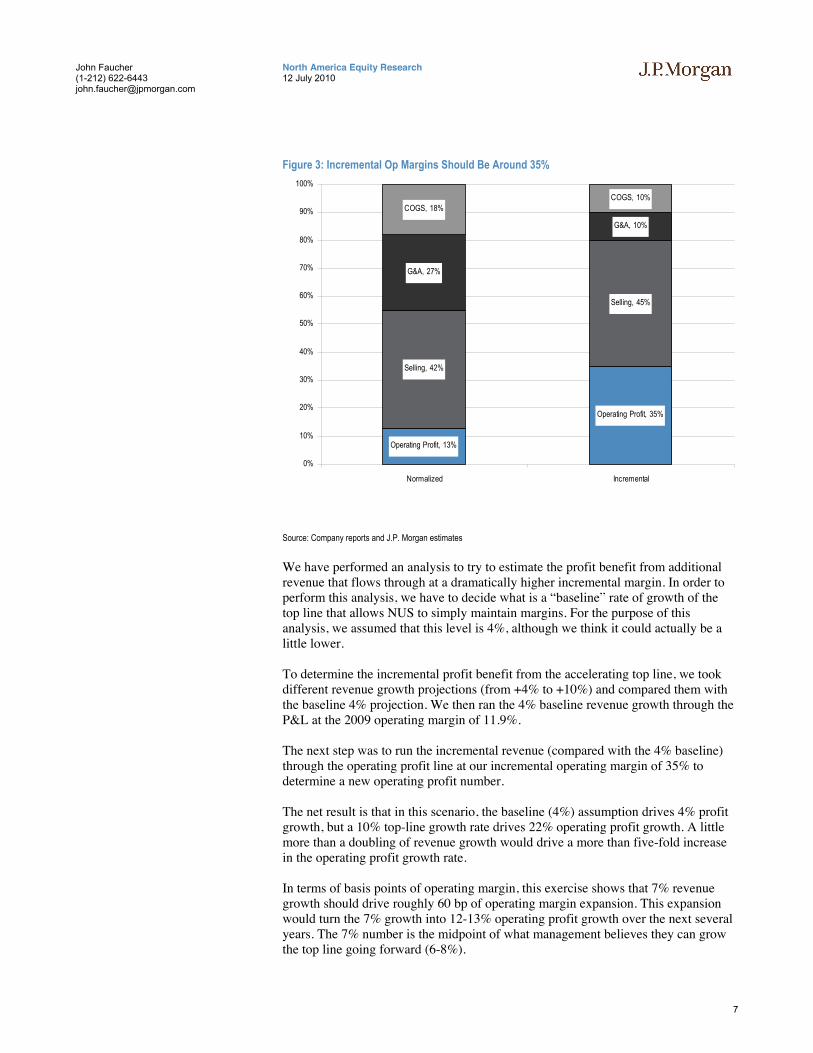
We think the key to delivering above-consensus numbers for NUS over the next twelve months is that the market is not appropriately factoring in the incremental operating margin benefit from better-than-expected top-line growth. This is especially true during the ageLOC launch, as we believe that ageLOC is likely at a higher GM than NUS’s already considerably high base business. We estimate that the incremental gross margin on ageLOC is around 90%. Like many other beauty companies (EL being the prime example), NUS has very high gross margins and relatively low operating margins. While the high SG&A ratio at EL is all about brand building, at NUS it’s about distributor compensation. We estimate that “variable” distributor compensation costs at NUS represent about 45% of sales. We also believe that there is another 10% of SG&A that is somewhat variable, and therefore should be included in determining the incremental operating margin. The net result is that we believe that in a period when NUS is growing their top line above a certain level (we assume 4%), the incremental operating margin is somewhere in the 35% range.
7
North America Equity Research 12 July 2010
John Faucher (1-212) 622-6443 [email protected]
Figure 3: Incremental Op Margins Should Be Around 35%
Operating Profit, 13%
Operating Profit, 35%
Selling, 42%
Selling, 45%
G&A, 27%
G&A, 10%
COGS, 18%COGS, 10%
0%
10%
20%
30%
40%
50%
60%
70%
80%
90%
100%
Normalized Incremental
Source: Company reports and J.P. Morgan estimates
We have performed an analysis to try to estimate the profit benefit from additional revenue that flows through at a dramatically higher incremental margin. In order to perform this analysis, we have to decide what is a “baseline” rate of growth of the top line that allows NUS to simply maintain margins. For the purpose of this analysis, we assumed that this level is 4%, although we think it could actually be a little lower. To determine the incremental profit benefit from the accelerating top line, we took different revenue growth projections (from +4% to +10%) and compared them with the baseline 4% projection. We then ran the 4% baseline revenue growth through the P&L at the 2009 operating margin of 11.9%. The next step was to run the incremental revenue (compared with the 4% baseline) through the operating profit line at our incremental operating margin of 35% to determine a new operating profit number. The net result is that in this scenario, the baseline (4%) assumption drives 4% profit growth, but a 10% top-line growth rate drives 22% operating profit growth. A little more than a doubling of revenue growth would drive a more than five-fold increase in the operating profit growth rate. In terms of basis points of operating margin, this exercise shows that 7% revenue growth should drive roughly 60 bp of operating margin expansion. This expansion would turn the 7% growth into 12-13% operating profit growth over the next several years. The 7% number is the midpoint of what management believes they can grow the top line going forward (6-8%).

8
North America Equity Research 12 July 2010
John Faucher (1-212) 622-6443 [email protected]
Figure 4: OM Expansion from Revenue Growth Levels bps
(43)
(21)
-
21
41
61
81
100
119
(60)
(40)
(20)
-
20
40
60
80
100
120
140
2.0% 3.0% 4.0% 5.0% 6.0% 7.0% 8.0% 9.0% 10.0%
Source: J.P. Morgan estimates.
In order to test this, we went back through historical numbers and used actual revenue growth and operating margin change in order to back test the data. What we found was a solid level of correlation, with an r-squared of 53% using the past 26 quarters of actual data.
Figure 5: Historically, Rev. % Change Shows a Strong Correlation with OM Expansion
y = 2023.2x - 57.471R2 = 0.536
-500
-400
-300
-200
-100
0
100
200
300
400
500
-10% -5% 0% 5% 10% 15% 20% 25%
Rev enue Grow th (X) v s. OM Change in BP (Y)
Source: Company reports and J.P. Morgan estimates.
We then decided to see what the similarities are between the historical data and our analysis. To do this, we determined the slope of the line for our projected OM

9
North America Equity Research 12 July 2010
John Faucher (1-212) 622-6443 [email protected]
expansion from Figure 4 above (because this is a liner projection, the r-squared is, by definition, 100%). We then took the regression equation from Figure 5 above and used it to determine a second trend line. What we see is that historical data would tell us that our OM projections could actually be too conservative, as the historical equation actually provides greater OM expansion, 23 bps greater margin expansion for the same level of revenue growth.
Figure 6: How Revenue (X-axis) Drives Operating Margin (Y-axis)
(50)
(25)
-
25
50
75
100
125
150
0.0% 2.0% 4.0% 6.0% 8.0% 10.0% 12.0%
Formula Using Historical Data
Formula Using JPM Forecasts
Source: Company reports and J.P. Morgan estimates.
After performing this analysis, we have a lot of confidence in our 2010 operating margin estimate of 13.1%, as our simple model shows that our 10% revenue growth target should drive a margin of 13.2% in 2010 (up 126 bp yoy), just slightly ahead of our forecast.
10
North America Equity Research 12 July 2010
John Faucher (1-212) 622-6443 [email protected]
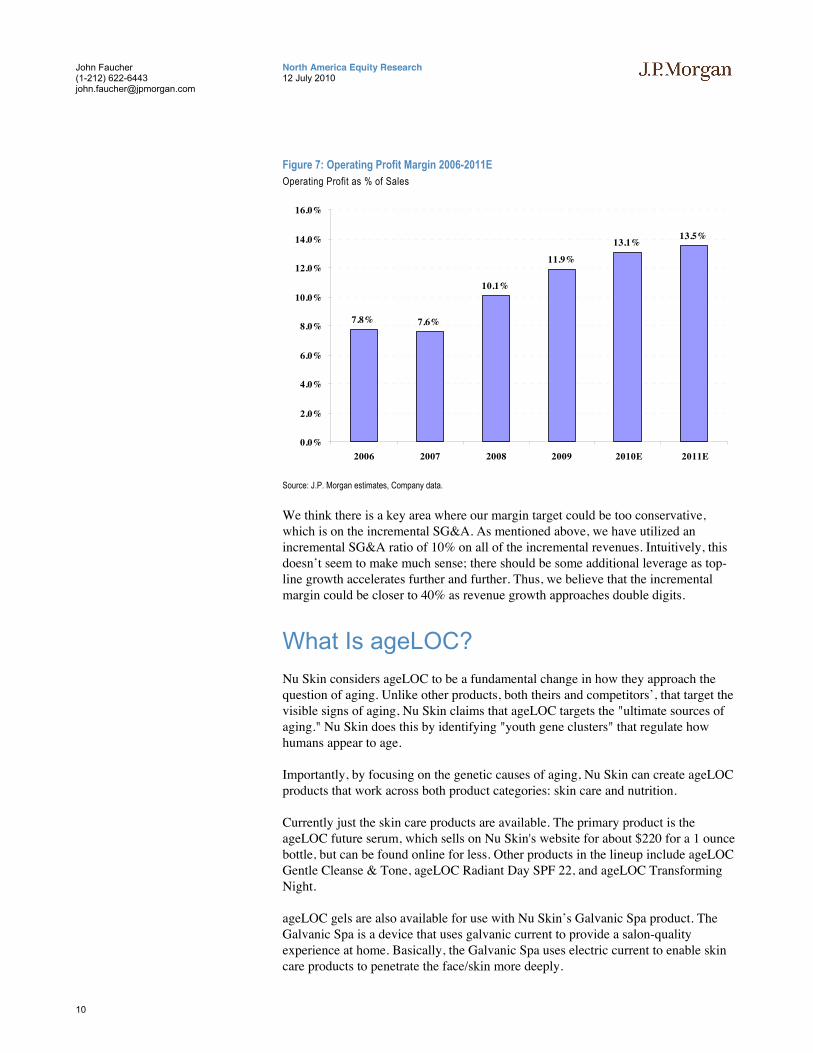
Figure 7: Operating Profit Margin 2006-2011E Operating Profit as % of Sales
7.8% 7.6%
10.1%
11.9%
13.1%13.5%
0.0%
2.0%
4.0%
6.0%
8.0%
10.0%
12.0%
14.0%
16.0%
2006 2007 2008 2009 2010E 2011E
Source: J.P. Morgan estimates, Company data.
We think there is a key area where our margin target could be too conservative, which is on the incremental SG&A. As mentioned above, we have utilized an incremental SG&A ratio of 10% on all of the incremental revenues. Intuitively, this doesn’t seem to make much sense; there should be some additional leverage as top-line growth accelerates further and further. Thus, we believe that the incremental margin could be closer to 40% as revenue growth approaches double digits.
What Is ageLOC? Nu Skin considers ageLOC to be a fundamental change in how they approach the question of aging. Unlike other products, both theirs and competitors’, that target the visible signs of aging, Nu Skin claims that ageLOC targets the "ultimate sources of aging." Nu Skin does this by identifying "youth gene clusters" that regulate how humans appear to age.
Importantly, by focusing on the genetic causes of aging, Nu Skin can create ageLOC products that work across both product categories: skin care and nutrition.
Currently just the skin care products are available. The primary product is the ageLOC future serum, which sells on Nu Skin's website for about $220 for a 1 ounce bottle, but can be found online for less. Other products in the lineup include ageLOC Gentle Cleanse & Tone, ageLOC Radiant Day SPF 22, and ageLOC Transforming Night.
ageLOC gels are also available for use with Nu Skin’s Galvanic Spa product. The Galvanic Spa is a device that uses galvanic current to provide a salon-quality experience at home. Basically, the Galvanic Spa uses electric current to enable skin care products to penetrate the face/skin more deeply.

11
North America Equity Research 12 July 2010
John Faucher (1-212) 622-6443 [email protected]
Company Guidance Too Conservative? Highlighting our view that guidance and consensus are too conservative, we point out that NUS has consistently beaten their own guidance by a wide margin over the past several quarters.
Nu Skin typically gives quarterly and full-year guidance for the next quarter and current year. However, over the past five quarters (Q109-Q110) management has beaten the top end of their guidance range by an average of about 21%. Below we have attached a chart showing NUS’s quarterly EPS guidance range, their actual results, and the percentage by which they beat the top end of their range.
Table 1: Quarterly Guidance vs. Quarterly Results Q109-Q110 Quarterly EPS
Quarter Guidance Actual EPS % Above High End of Range Q110 $0.39-$0.42 $0.48 14.3% Q409 $0.33-$0.35 $0.47 34.3% Q309 $0.30-$0.32* $0.40 25.0% Q209 $0.29-$0.31 $0.36 16.1% Q109 $0.22-$0.24 $0.28 16.7% Average 21.3%
Source: J.P. Morgan estimates, Company data. Note: *NUS pre-announced during Q309, updated guidance to $0.39-$0.40 a week prior to release date.
In their Q110 earnings release, management gave guidance for Q210 and FY10, which are shown below. While our estimate for Q2 remains encompassed in this range, we do believe that management’s full-year EPS estimates are still somewhat conservative. Given the impressive results during Q1, accompanied with the further launch of ageLOC into numerous markets, we think that LC revenue growth of 8-9% may be too conservative. Given their recent track record of beating their guidance, we would not be surprised if this was the case going forward.
Table 2: FY2010 and Q210 Guidance
FY 2010 Guidance Sales $1.44-$1.46 B Currency +1-2% OPM 12.5-12.9% EPS $1.80-$1.88 Q210 Guidance Sales $362-$370M EPS $0.44-$04.46 Currency & Mid-May Convention +3-4% Sales Tax Rate 37.5%
Source: Company reports

12
North America Equity Research 12 July 2010
John Faucher (1-212) 622-6443 [email protected]
Earnings Projections We are above consensus and company guidance for 2010 and 2011, driven, as we mentioned above, by greater-than-expected operating margin expansion.
Q2 2010 Expectation Our Q2 2010 EPS estimate is $0.46, which is at the high end of the company’s guidance range of $0.44-$0.46 and slightly above consensus of $0.45. We note that consensus has moved up by three cents (about 7%) since the company reported Q1, but is still assuming that Q2 is simply in line with company guidance, which we think may prove a little too conservative.
Our top-line estimate is +15%, or $371 million, which is above the company’s guidance range of $362-$370. We are also slightly above consensus, which is about $370 million.
2010 Expectations For FY10, we are anticipating sales growth of 11.1%. Our 2010 estimate, is slightly ahead of company guidance and consensus. We expect GM and OPM for 2010 to be 82.2% and 13.1%, respectively. In FY10, we anticipate a tax rate of about 36%, with interest expense of about $2M. This gets us to FY10 EPS of $1.91, ahead of the company's guidance range of $1.80-$1.88 and ahead of consensus of $1.88.
2011 Expectations For 2011, we are anticipating 6% top-line growth, which is ahead of consensus estimates. We are anticipating further margin expansion, as we estimate GM and OPM for the year to be 82.4% and 13.5%, respectively. Below the line, we expect the tax rate to be 35%, and interest expense of $1-2M. We anticipate FY11 EPS to be $2.21, which is ahead of the consensus estimate of $2.11.

13
North America Equity Research 12 July 2010
John Faucher (1-212) 622-6443 [email protected]
Table 3: J.P. Morgan Earnings Estimates for Q210, FY10, and FY11
($ in millions, except per share) Q210 FY10 FY11
Revenue 371.0 1,478.4 1,567.8 % change 15.0% 11.1% 6.0% Cost of goods sold 66.2 263.6 275.6 as a % of revenue 17.8% 17.8% 17.6% Change as % of revenue (bps) (95) (47) (25) % change 9.2% 8.2% 4.6% Gross Profit 304.8 1,214.8 1,292.2 as a % of revenue 82.2% 82.2% 82.4% Change as % of revenue (bps) 95 47 25 % change 16.4% 11.7% 6.4% Selling Expenses 157.3 625.7 664.3 as a % of revenue 42.4% 42.3% 42.4% Change as % of revenue (bps) 65 95 5 % change 16.8% 13.6% 6.2% General and Administrative Expenses 100.0 395.9 415.7 as a % of revenue 27.0% 26.8% 26.5% Change as % of revenue (bps) (135) (165) (26) % change 9.5% 4.6% 5.0% Restructuring and Other Charges - - - Operating income 47.5 193.2 212.2 as a % of revenue 12.8% 13.1% 13.5% Change as % of revenue (bps) 165 117 46 % change 32.0% 21.9% 9.8% Other Income (Expense), Net (0.5) (1.7) (1.4) Pretax Income 47.0 191.5 210.8 as a % of revenue 12.7% 13.0% 13.4% % change 27.5% 26.1% 10.0% Taxes 17.6 69.1 73.9 Taxes, ex charge 17.6 69.1 73.9 Tax Rate 37.5% 36.1% 35.1% Net income 29.4 122.4 136.9 Diluted EPS $0.46 $1.91 $2.21 % change 22.7% 25.1% 15.8% Diluted shares outstanding (million) 64.5 64.2 62.0 % change 1.2% -10.1% -3.5%
Source: J.P. Morgan estimates.
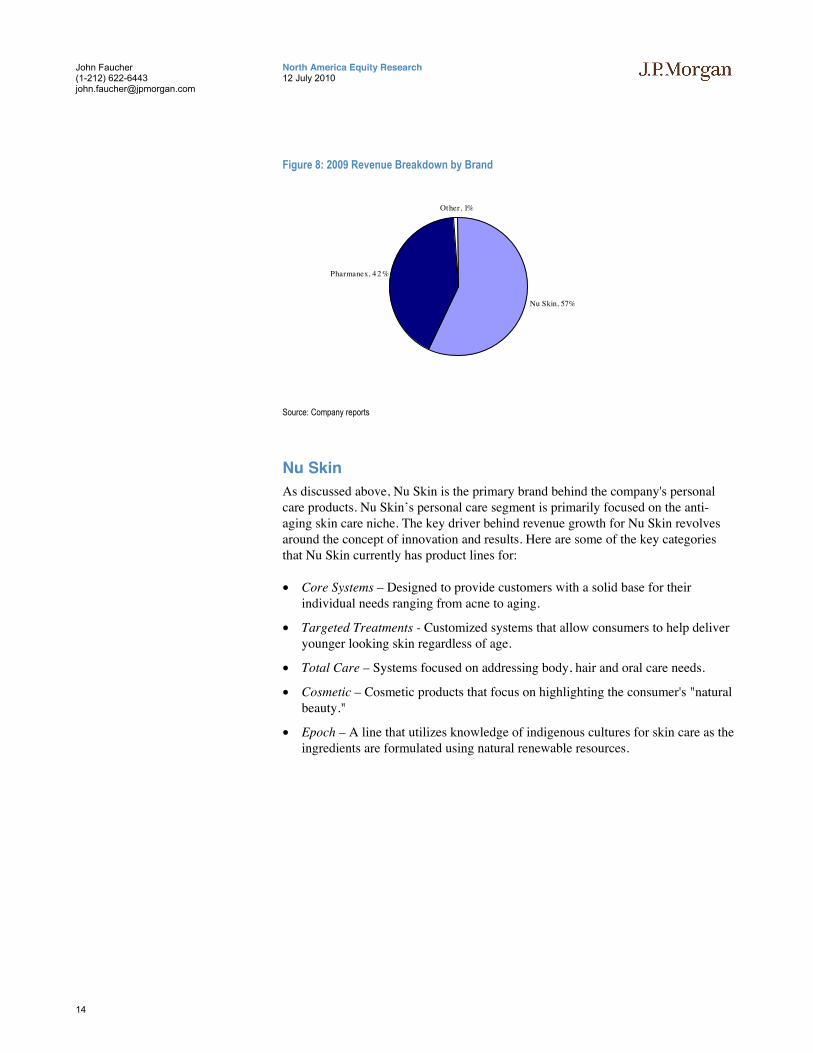
Product Breakout Nu Skin primarily operates under two product categories, each of which is operating under their own brand name. The Nu Skin brand primarily comprises the company's premium personal care segment, while the nutritional supplements are under the Pharmanex brand.
14
North America Equity Research 12 July 2010
John Faucher (1-212) 622-6443 [email protected]
Figure 8: 2009 Revenue Breakdown by Brand
Nu Skin, 57%
Pharmanex, 42 %
Other, 1%
Source: Company reports
Nu Skin As discussed above, Nu Skin is the primary brand behind the company's personal care products. Nu Skin’s personal care segment is primarily focused on the anti-aging skin care niche. The key driver behind revenue growth for Nu Skin revolves around the concept of innovation and results. Here are some of the key categories that Nu Skin currently has product lines for:
• Core Systems – Designed to provide customers with a solid base for their individual needs ranging from acne to aging.
• Targeted Treatments - Customized systems that allow consumers to help deliver younger looking skin regardless of age.
• Total Care – Systems focused on addressing body, hair and oral care needs.
• Cosmetic – Cosmetic products that focus on highlighting the consumer's "natural beauty."
• Epoch – A line that utilizes knowledge of indigenous cultures for skin care as the ingredients are formulated using natural renewable resources.

15
North America Equity Research 12 July 2010
John Faucher (1-212) 622-6443 [email protected]
Figure 9: Nu Skin Revenues 2004-2009 $ in millions
$548
$484$454
$499
$633
$753
$0
$100
$200
$300
$400
$500
$600
$700
$800
2004 2005 2006 2007 2008 2009
Source: Company reports.
ageLOC Should Be the Driver of Future Growth New product innovation has been a key component of successful growth for Nu Skin. Nu Skin recently developed their new ageLOC anti-aging skin care, which we feel will be a key driver of top-line and earnings growth over the next few years. This product is designed not only to hinder the physical signs of aging, but also to attack the source of aging. Thus far, the initial reception of the product has been very strong, and we believe that this strength will continue throughout the remainder of the year.
• The new ageLOC skin care system was offered to a limited number of distributors at a convention during October 2009. Over the course of the week, the company sold $17 million of the new ageLOC system, and the company sold out of the product that week.
• Through 2009 and thus far into 2010, Nu Skin pre-launch and full launches have done very well, and management expects this to continue as they proceed to roll out the product into new regions.
• The most recent Greater China distributor convention, that had over 10,000 distributors in attendance, generated about $20 million in sales of the new ageLOC system.
• While new products often lead to tougher comparisons in the future, ageLOC's subscription process helps temper some of this issue. In addition, the company is planning further product innovation with a new vitamin-based ageLOC to be launched over the course of the next 18 months.

16
North America Equity Research 12 July 2010
John Faucher (1-212) 622-6443 [email protected]
Table 4: 2010 ageLOC Rollout Schedule by Geography
Region Timing of Rollout
Pre-Launch Launch Americas, Europe Q409 Q110 Japan Q409 Q210 South Korea Q110 Q210 Greater China Q110 Q210 SE Asia Q110 Q310 Mainland China Q310 Q410
Source: Company reports
Pharmanex Also as mentioned above, Nu Skin offers numerous anti-aging supplements under the Pharmanex brand. Direct selling has been a key growth driver for this brand, as distributors are able to educate the consumer personally about the benefits of using Pharmanex and differentiating the products from the competition. The largest line under this brand is LifePak, which accounted for 18% of total revenues in 2009 and 43% of revenues under the Pharmanex brand. Below are some of the product lines that the Pharmanex brand currently offers:
• Nutritionals - Broad spectrum of micronutrients that are a foundation for optimal health. The LifePak family of products falls into this category.
• Solutions – Targeted solutions that contain ingredients formulated to meet consumer's daily needs.
• Weight Management – Includes supplements as well as meal-replacement shakes.
• Vitameal – A nutritious meal that can be purchased and donated to help feed starving children and is also purchased for personal food storage.
There is no question that the Pharmanex brand has been struggling mightily over the past few years. We think this is due to somewhat of a lack of major new product activity, but also due to the recent successes of the personal/skin care brands. We think it is not surprising that the distribution network has a difficult time delivering strong results on both product segments at the same time.
We would expect Pharmanex sales to remain weak through the next 12 months until we get to the next new product cycle.

17
North America Equity Research 12 July 2010
John Faucher (1-212) 622-6443 [email protected]
Figure 10: Pharmanex Revenues 2004-2009 $ in millions
$567
$668
$633 $634
$598
$566
$500
$520
$540
$560
$580
$600
$620
$640
$660
$680
2004 2005 2006 2007 2008 2009
Source: Company reports.
Lots of Cash and Little Debt We expect Nu Skin to generate record levels of cash flow over the next several years, which we expect will be primarily returned to shareholders.
We expect that Nu Skin will grow free cash flow by only 4% in 2010 (as they increase cap-ex to build an innovation center), following 30% growth in 2009. We expect 16% FCF growth in 2011, followed by high-single-digit growth (at least) in 2012, as net income rises nicely and cap-ex should be flat.
Based on this CAGR of 14% from 2008 to 2012, Nu Skin will have nearly doubled its free cash flow from $87 million in 2008 to nearly $150 million in 2012. When factoring in share repurchases, Nu Skin will have doubled free cash flow per share over this time period, from $1.23 to about $2.50.
With minimal cap-ex (about 2% of sales), Nu Skin, as we see it, really has only two options for the cash, and both involve returning cash to shareholders. The current dividend is $0.50, which works out to a yield of just over 2%. We would expect that the dividend will grow roughly in line with earnings over time.
This leaves plenty of cash for share repurchase. We are estimating about $55 million in repurchase activity for 2010, with about $70 million per year in 2011 and 2012. We should point out that we think that Nu Skin could buy back more than this. When the company announced a secondary offering in June, they increased their current share repurchase authorization by $150 million, from $46 million to $196 million. Thus, our estimates would have them finishing up this authorization in late 2012.
18
North America Equity Research 12 July 2010
John Faucher (1-212) 622-6443 [email protected]
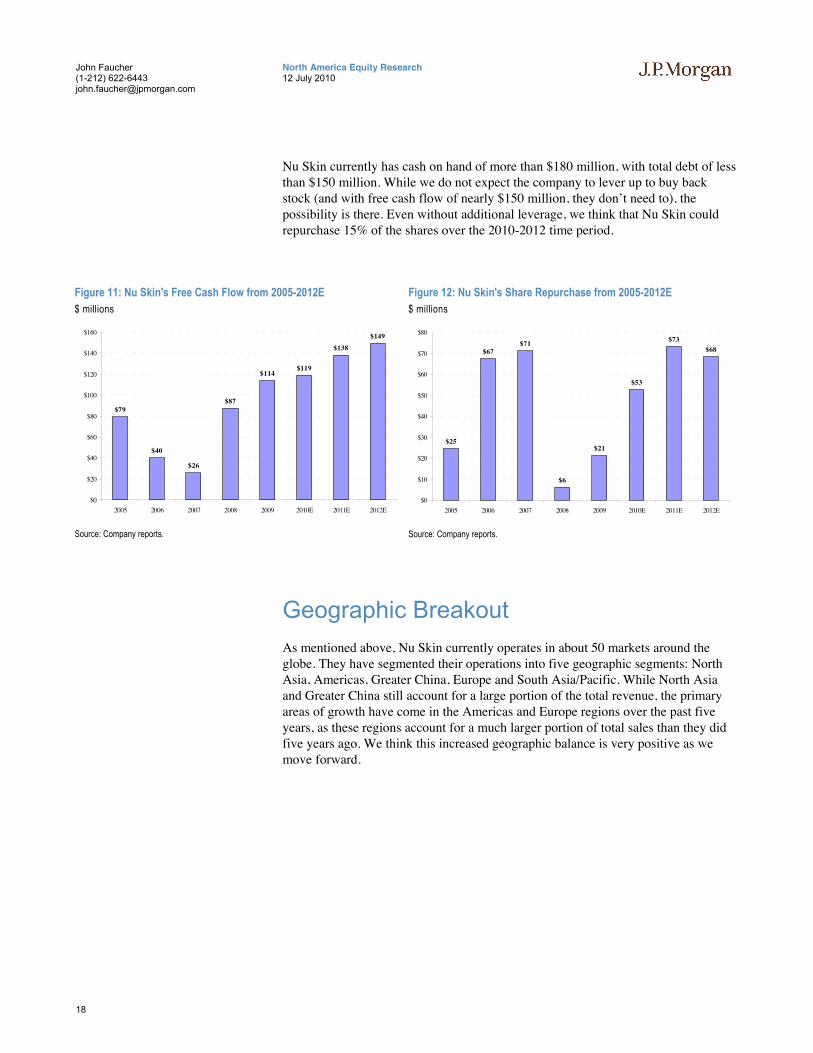
Nu Skin currently has cash on hand of more than $180 million, with total debt of less than $150 million. While we do not expect the company to lever up to buy back stock (and with free cash flow of nearly $150 million, they don’t need to), the possibility is there. Even without additional leverage, we think that Nu Skin could repurchase 15% of the shares over the 2010-2012 time period.
Figure 11: Nu Skin's Free Cash Flow from 2005-2012E $ millions
$79
$40
$26
$87
$114$119
$138$149
$0
$20
$40
$60
$80
$100
$120
$140
$160
2005 2006 2007 2008 2009 2010E 2011E 2012E
Source: Company reports.
Figure 12: Nu Skin's Share Repurchase from 2005-2012E $ millions
$25
$67$71
$6
$21
$53
$73$68
$0
$10
$20
$30
$40
$50
$60
$70
$80
2005 2006 2007 2008 2009 2010E 2011E 2012E
Source: Company reports.
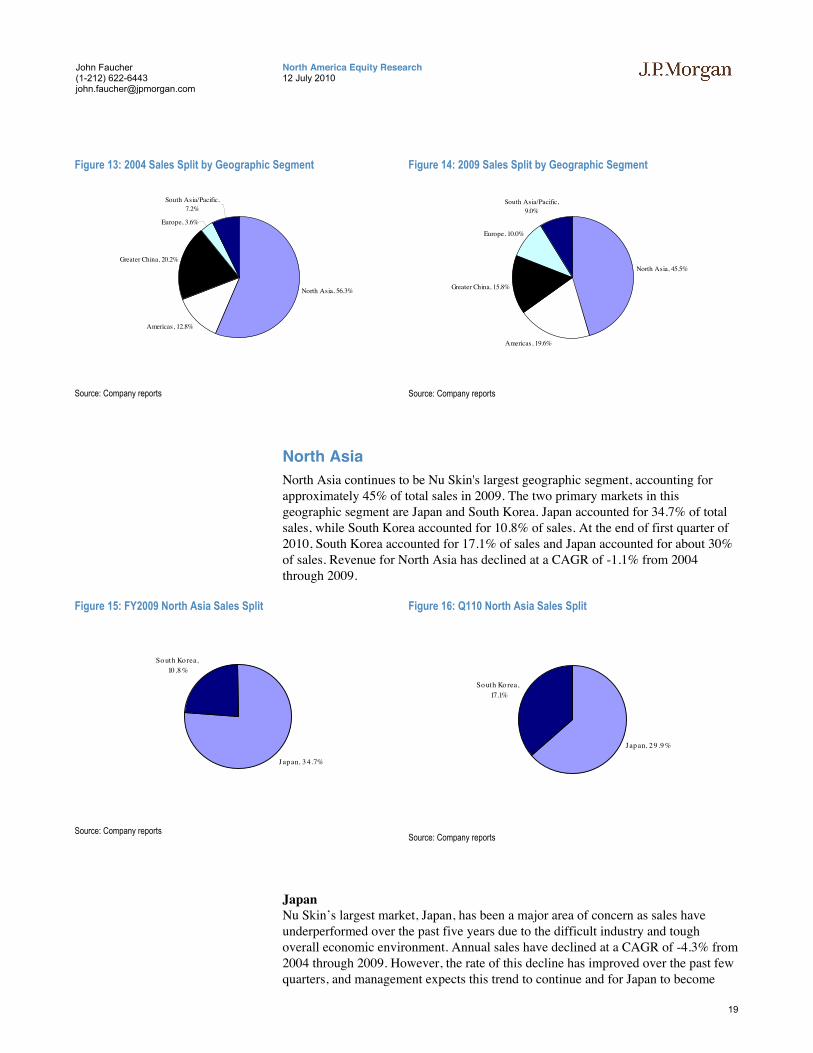
Geographic Breakout As mentioned above, Nu Skin currently operates in about 50 markets around the globe. They have segmented their operations into five geographic segments: North Asia, Americas, Greater China, Europe and South Asia/Pacific. While North Asia and Greater China still account for a large portion of the total revenue, the primary areas of growth have come in the Americas and Europe regions over the past five years, as these regions account for a much larger portion of total sales than they did five years ago. We think this increased geographic balance is very positive as we move forward.
19
North America Equity Research 12 July 2010
John Faucher (1-212) 622-6443 [email protected]
Figure 13: 2004 Sales Split by Geographic Segment
North Asia, 56.3%
Americas, 12.8%
Greater China, 20.2%
Europe, 3.6%
South Asia/Pacific, 7.2%
Source: Company reports
Figure 14: 2009 Sales Split by Geographic Segment
North Asia, 45.5%
Americas, 19.6%
Greater China, 15.8%
Europe, 10.0%
South Asia/Pacific, 9.0%
Source: Company reports
North Asia North Asia continues to be Nu Skin's largest geographic segment, accounting for approximately 45% of total sales in 2009. The two primary markets in this geographic segment are Japan and South Korea. Japan accounted for 34.7% of total sales, while South Korea accounted for 10.8% of sales. At the end of first quarter of 2010, South Korea accounted for 17.1% of sales and Japan accounted for about 30% of sales. Revenue for North Asia has declined at a CAGR of -1.1% from 2004 through 2009.
Figure 15: FY2009 North Asia Sales Split
Japan, 3 4 .7%
So uth Korea, 10 .8 %
Source: Company reports
Figure 16: Q110 North Asia Sales Split
Japan, 29 .9%
So uth Ko rea, 17.1%
Source: Company reports
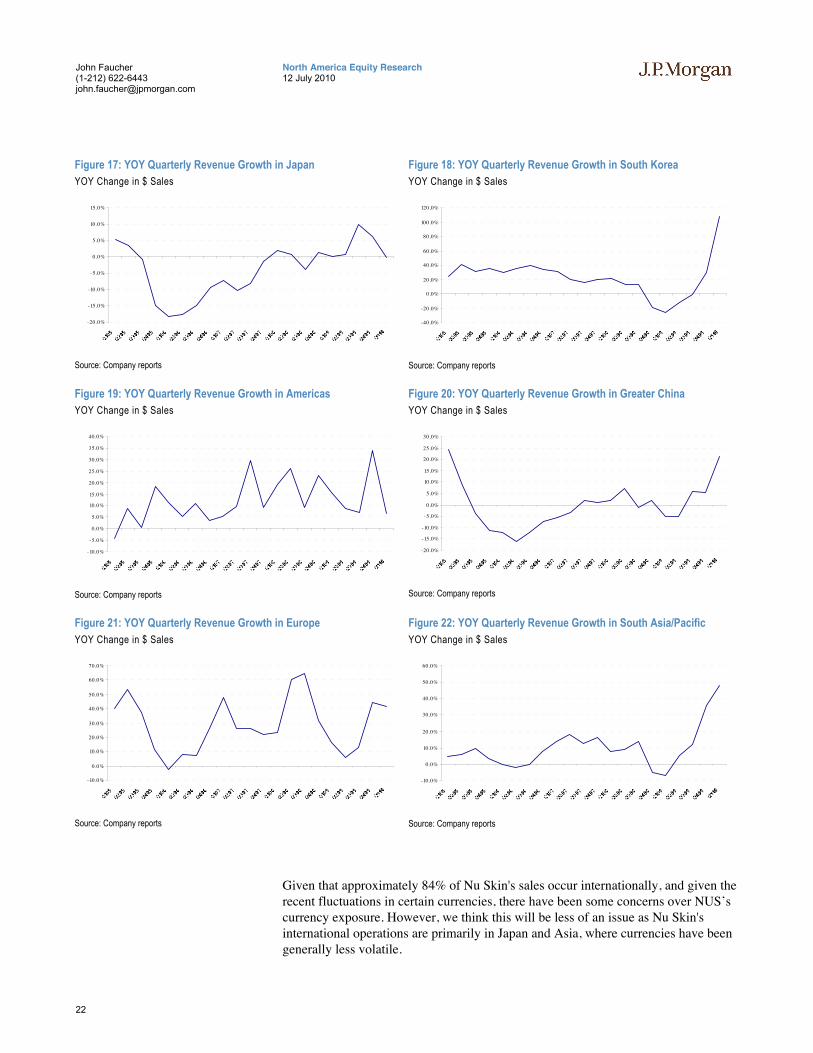
Japan Nu Skin’s largest market, Japan, has been a major area of concern as sales have underperformed over the past five years due to the difficult industry and tough overall economic environment. Annual sales have declined at a CAGR of -4.3% from 2004 through 2009. However, the rate of this decline has improved over the past few quarters, and management expects this trend to continue and for Japan to become
20
North America Equity Research 12 July 2010
John Faucher (1-212) 622-6443 [email protected]
more stable. Some of the key initiatives that management expects to drive stabilization in Japan are: application of proven programs from other markets that will lead to new executive distributors, a new management team, and the launch of the ageLOC skin care system.
South Korea South Korea has been a market of growth for Nu Skin, growing at a CAGR of 17% from 2004 through 2009. This continues to be a strong market for Nu Skin as LC revenue grew 67% during the first quarter in response to a limited time offering of the new ageLOC skin care system in January 2010, with total revenue growing a stunning 101%. The system is now fully available (as of April 2010); however, management does not expect this type of growth to continue. Distributor growth was very encouraging, as active and executive distributors grew 21% and 37%, respectively, during the first quarter of 2010. While such dramatic top-line growth is not likely to continue, we do still expect the launch of ageLOC to continue to drive strong performance in South Korea going forward.
Americas The Americas segment has become an integral part of Nu Skin's business over the past few years, growing at a CAGR of 12.4% from 2004 through 2009. This segment includes sales in the United States, but it does also include Canada and Latin America. In 2009, the US comprised 16% of overall company sales, while Canada and Latin America made up only 2% and 1%, respectively. Essentially all of the Nu Skin and Pharmanex products are available in these markets. In 2009, they launched the ageLOC skin care system and plan to introduce the ageLOC products that were created to help the internal source of aging this year. We expect strong growth to continue behind the launch of the ageLOC skin care system and the number of executive distributors grows.
Greater China This segment has also underperformed in comparison to the overall company growth over the past five years, with the top line declining at a CAGR of -1.8%, making it the worst-performing segment from a revenue standpoint over the past five years. This is largely due to some regulation issues in mainland China with direct selling, but the company believes that they have worked through this issue. The results seem to indicate this to be true, as revenue has been up YOY during the past three quarters. This segment is composed of three primary markets: Taiwan, China and Hong Kong. As a percentage of total company 2009 sales, Taiwan accounted for 7%, China 5%, and Hong Kong 4%. Taiwan and Hong Kong operate using the global direct selling business model, whereas in China they are unable to fully operate under the direct selling model due to regulatory restrictions. The majority of the Nu Skin and Pharmanex products are available in Taiwan and Hong Kong, whereas the personal care products in China are produced and sold under the Scion name. Nu Skin does sell a limited amount of the Pharmanex products, including LifePak.
Europe Over the past few years Europe has become a bigger part of Nu Skin's geographic mix, as it is the fastest growing segment since 2004. In 2004, Europe comprised only 3.6% of total revenues vs. about 10% of sales at the end of 2009. Annual sales have grown at a CAGR of 27% since 2004. Currently the company offers a full range of
21
North America Equity Research 12 July 2010
John Faucher (1-212) 622-6443 [email protected]
their product mix (with the new ageLOC skin care system launched in Q1 2010) in 26 countries across eastern, northern, and central europe, as well as Israel and South Africa.
South Asia/Pacific The South Asia/Pacific region is comprised primarily of five major markets: Singapore/Malaysia/Brunei (4% of 2009 revenues), Thailand (3% of total revenues), Australia/New Zealand, Indonesia, and the Philippines (all of which were only 1% of 2009 revenues). The growth in this region continues to be strong, with revenues growing at an 8% CAGR from 2004 through 2009.With the exception of the new ageLOC skin care system (which will be launched during Q310), this region offers the majority of the Nu Skin and Pharmanex products.
22
North America Equity Research 12 July 2010
John Faucher (1-212) 622-6443 [email protected]
Figure 17: YOY Quarterly Revenue Growth in Japan YOY Change in $ Sales
-20.0%
-15.0%
-10.0%
-5.0%
0.0%
5.0%
10.0%
15.0%
Source: Company reports
Figure 18: YOY Quarterly Revenue Growth in South Korea YOY Change in $ Sales
-40.0%
-20.0%
0.0%
20.0%
40.0%
60.0%
80.0%
100.0%
120.0%
Source: Company reports
Figure 19: YOY Quarterly Revenue Growth in Americas YOY Change in $ Sales
-10.0%
-5.0%
0.0%
5.0%
10.0%
15.0%
20.0%
25.0%
30.0%
35.0%
40.0%
Source: Company reports
Figure 20: YOY Quarterly Revenue Growth in Greater China YOY Change in $ Sales
-20.0%
-15.0%
-10.0%
-5.0%
0.0%
5.0%
10.0%
15.0%
20.0%
25.0%
30.0%
Source: Company reports
Figure 21: YOY Quarterly Revenue Growth in Europe YOY Change in $ Sales
-10.0%
0.0%
10.0%
20.0%
30.0%
40.0%
50.0%
60.0%
70.0%
Source: Company reports
Figure 22: YOY Quarterly Revenue Growth in South Asia/Pacific YOY Change in $ Sales
-10.0%
0.0%
10.0%
20.0%
30.0%
40.0%
50.0%
60.0%
Source: Company reports
Given that approximately 84% of Nu Skin's sales occur internationally, and given the recent fluctuations in certain currencies, there have been some concerns over NUS’s currency exposure. However, we think this will be less of an issue as Nu Skin's international operations are primarily in Japan and Asia, where currencies have been generally less volatile.
23
North America Equity Research 12 July 2010
John Faucher (1-212) 622-6443 [email protected]
At this point, we are expecting an Fx impact of +1-2% for 2010 and essentially flat for 2011. We think this is a much more favorable fx environment than the market currently fears, which is another potential area of upside for NUS over the next several quarters.
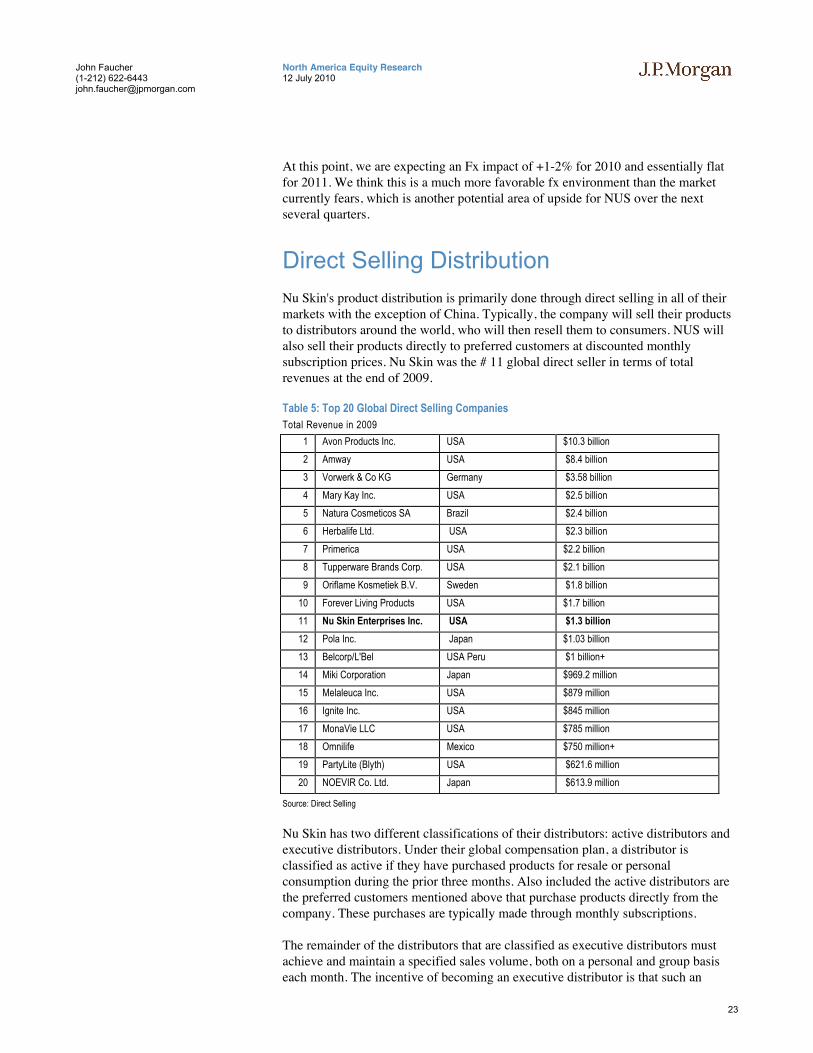
Direct Selling Distribution Nu Skin's product distribution is primarily done through direct selling in all of their markets with the exception of China. Typically, the company will sell their products to distributors around the world, who will then resell them to consumers. NUS will also sell their products directly to preferred customers at discounted monthly subscription prices. Nu Skin was the # 11 global direct seller in terms of total revenues at the end of 2009.
Table 5: Top 20 Global Direct Selling Companies Total Revenue in 2009
1 Avon Products Inc. USA $10.3 billion 2 Amway USA $8.4 billion 3 Vorwerk & Co KG Germany $3.58 billion 4 Mary Kay Inc. USA $2.5 billion 5 Natura Cosmeticos SA Brazil $2.4 billion 6 Herbalife Ltd. USA $2.3 billion 7 Primerica USA $2.2 billion 8 Tupperware Brands Corp. USA $2.1 billion 9 Oriflame Kosmetiek B.V. Sweden $1.8 billion
10 Forever Living Products USA $1.7 billion 11 Nu Skin Enterprises Inc. USA $1.3 billion
12 Pola Inc. Japan $1.03 billion 13 Belcorp/L'Bel USA Peru $1 billion+ 14 Miki Corporation Japan $969.2 million 15 Melaleuca Inc. USA $879 million 16 Ignite Inc. USA $845 million 17 MonaVie LLC USA $785 million 18 Omnilife Mexico $750 million+ 19 PartyLite (Blyth) USA $621.6 million 20 NOEVIR Co. Ltd. Japan $613.9 million
Source: Direct Selling
Nu Skin has two different classifications of their distributors: active distributors and executive distributors. Under their global compensation plan, a distributor is classified as active if they have purchased products for resale or personal consumption during the prior three months. Also included the active distributors are the preferred customers mentioned above that purchase products directly from the company. These purchases are typically made through monthly subscriptions.
The remainder of the distributors that are classified as executive distributors must achieve and maintain a specified sales volume, both on a personal and group basis each month. The incentive of becoming an executive distributor is that such an
24
North America Equity Research 12 July 2010
John Faucher (1-212) 622-6443 [email protected]
individual is able to take advantage of certain benefits such as commission payments. Executive distributors must achieve approximately $2,000 per month in sales volume.
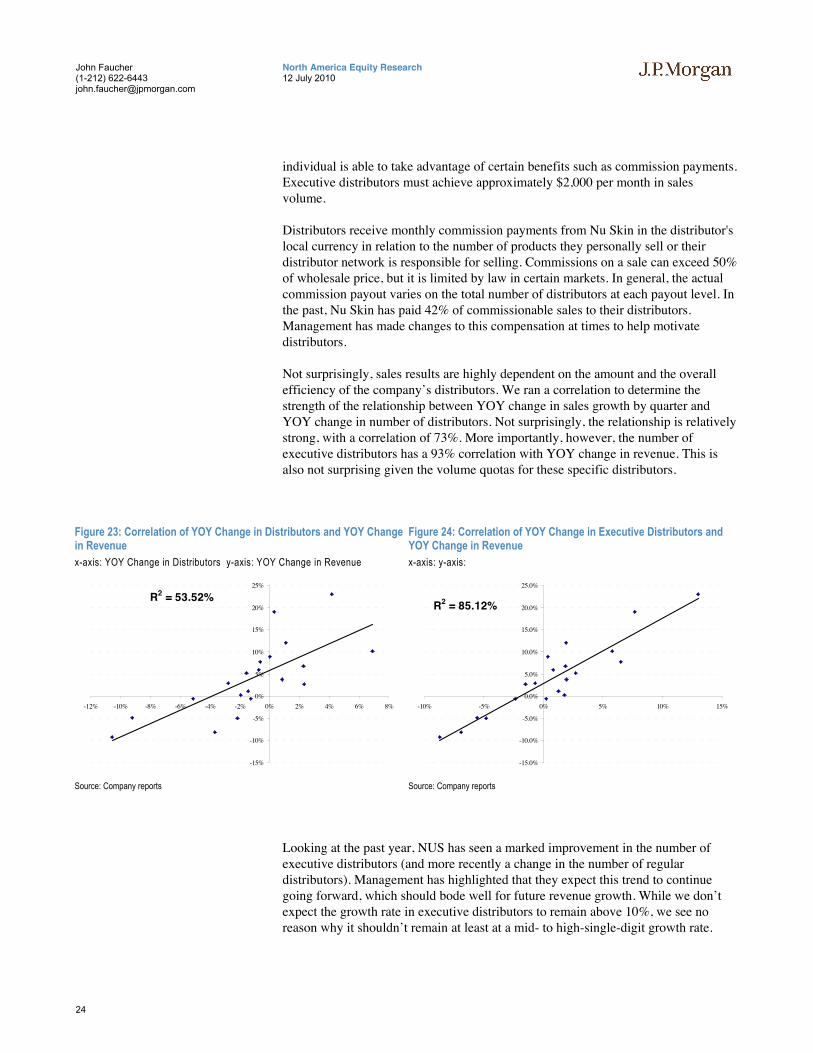
Distributors receive monthly commission payments from Nu Skin in the distributor's local currency in relation to the number of products they personally sell or their distributor network is responsible for selling. Commissions on a sale can exceed 50% of wholesale price, but it is limited by law in certain markets. In general, the actual commission payout varies on the total number of distributors at each payout level. In the past, Nu Skin has paid 42% of commissionable sales to their distributors. Management has made changes to this compensation at times to help motivate distributors.
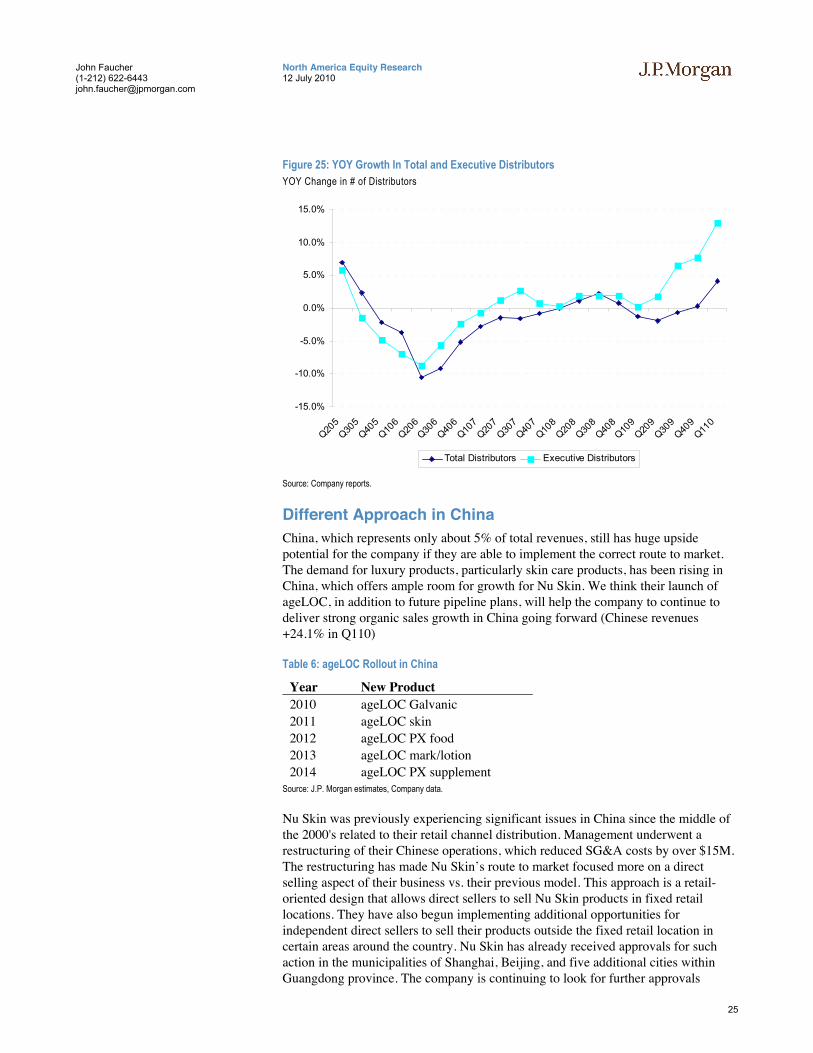
Not surprisingly, sales results are highly dependent on the amount and the overall efficiency of the company’s distributors. We ran a correlation to determine the strength of the relationship between YOY change in sales growth by quarter and YOY change in number of distributors. Not surprisingly, the relationship is relatively strong, with a correlation of 73%. More importantly, however, the number of executive distributors has a 93% correlation with YOY change in revenue. This is also not surprising given the volume quotas for these specific distributors.
Figure 23: Correlation of YOY Change in Distributors and YOY Change in Revenue x-axis: YOY Change in Distributors y-axis: YOY Change in Revenue
R2 = 53.52%
-15%
-10%
-5%
0%
5%
10%
15%
20%
25%
-12% -10% -8% -6% -4% -2% 0% 2% 4% 6% 8%
Source: Company reports
Figure 24: Correlation of YOY Change in Executive Distributors and YOY Change in Revenue x-axis: y-axis:
R2 = 85.12%
-15.0%
-10.0%
-5.0%
0.0%
5.0%
10.0%
15.0%
20.0%
25.0%
-10% -5% 0% 5% 10% 15%
Source: Company reports
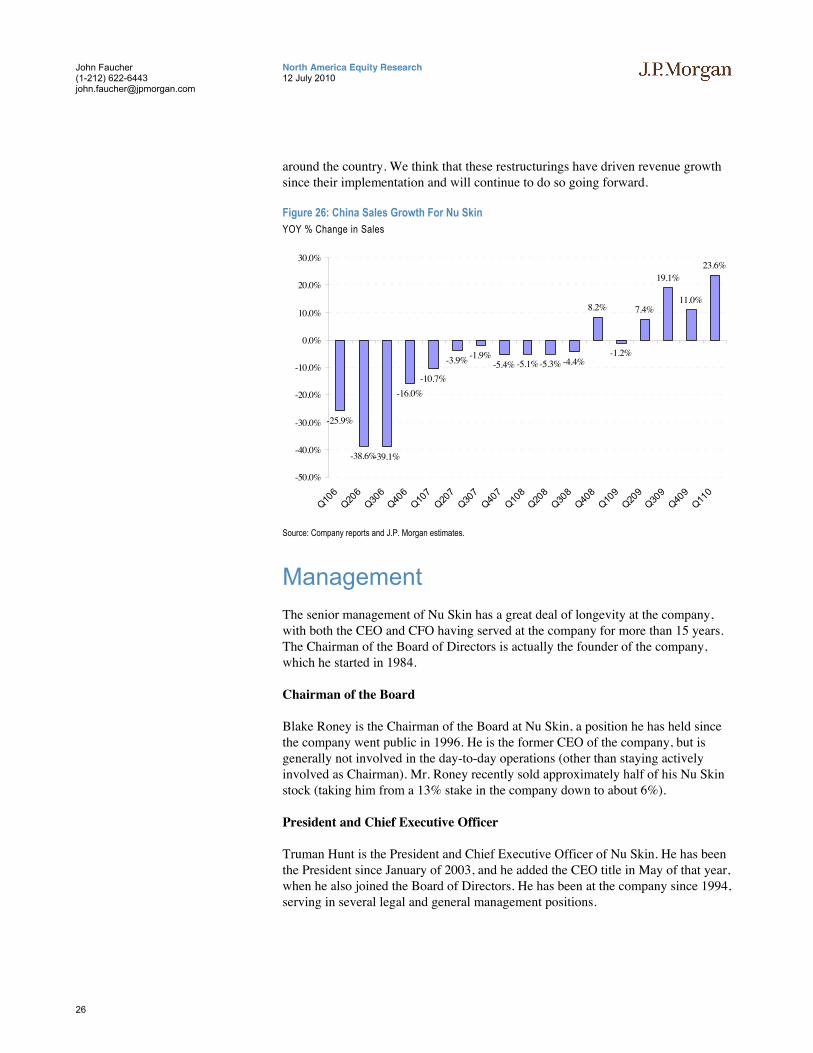
Looking at the past year, NUS has seen a marked improvement in the number of executive distributors (and more recently a change in the number of regular distributors). Management has highlighted that they expect this trend to continue going forward, which should bode well for future revenue growth. While we don’t expect the growth rate in executive distributors to remain above 10%, we see no reason why it shouldn’t remain at least at a mid- to high-single-digit growth rate.
25
North America Equity Research 12 July 2010
John Faucher (1-212) 622-6443 [email protected]
Figure 25: YOY Growth In Total and Executive Distributors YOY Change in # of Distributors
-15.0%
-10.0%
-5.0%
0.0%
5.0%
10.0%
15.0%
Q205
Q305
Q405
Q106
Q206
Q306
Q406
Q107
Q207
Q307
Q407
Q108
Q208
Q308
Q408
Q109
Q209
Q309
Q409
Q110
Total Distributors Executive Distributors
Source: Company reports.
Different Approach in China China, which represents only about 5% of total revenues, still has huge upside potential for the company if they are able to implement the correct route to market. The demand for luxury products, particularly skin care products, has been rising in China, which offers ample room for growth for Nu Skin. We think their launch of ageLOC, in addition to future pipeline plans, will help the company to continue to deliver strong organic sales growth in China going forward (Chinese revenues +24.1% in Q110)
Table 6: ageLOC Rollout in China
Year New Product 2010 ageLOC Galvanic 2011 ageLOC skin 2012 ageLOC PX food 2013 ageLOC mark/lotion 2014 ageLOC PX supplement
Source: J.P. Morgan estimates, Company data.
Nu Skin was previously experiencing significant issues in China since the middle of the 2000's related to their retail channel distribution. Management underwent a restructuring of their Chinese operations, which reduced SG&A costs by over $15M. The restructuring has made Nu Skin’s route to market focused more on a direct selling aspect of their business vs. their previous model. This approach is a retail-oriented design that allows direct sellers to sell Nu Skin products in fixed retail locations. They have also begun implementing additional opportunities for independent direct sellers to sell their products outside the fixed retail location in certain areas around the country. Nu Skin has already received approvals for such action in the municipalities of Shanghai, Beijing, and five additional cities within Guangdong province. The company is continuing to look for further approvals
26
North America Equity Research 12 July 2010
John Faucher (1-212) 622-6443 [email protected]
around the country. We think that these restructurings have driven revenue growth since their implementation and will continue to do so going forward.
Figure 26: China Sales Growth For Nu Skin YOY % Change in Sales
-25.9%
-38.6%-39.1%
-16.0%-10.7%
-3.9% -1.9%-5.4% -5.1%-5.3% -4.4%
8.2%
-1.2%
7.4%
19.1%
11.0%
23.6%
-50.0%
-40.0%
-30.0%
-20.0%
-10.0%
0.0%
10.0%
20.0%
30.0%
Q106
Q206
Q306
Q406
Q107
Q207
Q307
Q407
Q108
Q208
Q308
Q408
Q109
Q209
Q309
Q409
Q110
Source: Company reports and J.P. Morgan estimates.
Management The senior management of Nu Skin has a great deal of longevity at the company, with both the CEO and CFO having served at the company for more than 15 years. The Chairman of the Board of Directors is actually the founder of the company, which he started in 1984.
Chairman of the Board
Blake Roney is the Chairman of the Board at Nu Skin, a position he has held since the company went public in 1996. He is the former CEO of the company, but is generally not involved in the day-to-day operations (other than staying actively involved as Chairman). Mr. Roney recently sold approximately half of his Nu Skin stock (taking him from a 13% stake in the company down to about 6%).
President and Chief Executive Officer
Truman Hunt is the President and Chief Executive Officer of Nu Skin. He has been the President since January of 2003, and he added the CEO title in May of that year, when he also joined the Board of Directors. He has been at the company since 1994, serving in several legal and general management positions.

27
North America Equity Research 12 July 2010
John Faucher (1-212) 622-6443 [email protected]
Chief Financial Officer
Ritch Wood has served as the CFO since November of 2002. Since joining the company in 1993, Ritch has served in several different finance and development positions.
Chief Scientific Officer/EVP Product Development
Joe Chang has been with Nu Skin since 1997, serving on the Pharmanex side of the business until his promotion to his current position in 2006.
Valuation We are initiating coverage of Nu Skin Enterprises with an Overweight rating. We feel that the recent pullback in the stock price from the mid-$30s down to the mid-$20s provides a buying opportunity. We think the valuation is a little cheaper than it should be, but more importantly, we think that numbers will continue to move up through 2011 as the company benefits from the continued rollout of the ageLOC skin care product, followed up by a launch of an ageLOC nutrition product in late 2011. Figure 27: NTM P/E
10.2x
12.5x
19.3x
13.0x
0.0x
5.0x
10.0x
15.0x
20.0x
25.0x
EL NUS AVP TUP
Source: Bloomberg.
We think the valuation is compelling, with NUS currently trading at about 13x NTM consensus estimates, which is below their five-year historical average of 16.0x and their two year historical average of 14.2x. In fact, NUS is trading at only 12.8x 2011E consensus numbers. We think that as we move through the year and 2011 estimates move towards our above consensus numbers, in addition to the company returning cash to shareholders, that valuation will begin to move up. Our December 2011 price target is $37 is based off of 14x our 2012 estimate.
We chose 14x NTM as the target multiple, which is the two-year average, because we believe that the average over the last two years is more relevant than the average
28
North America Equity Research 12 July 2010
John Faucher (1-212) 622-6443 [email protected]
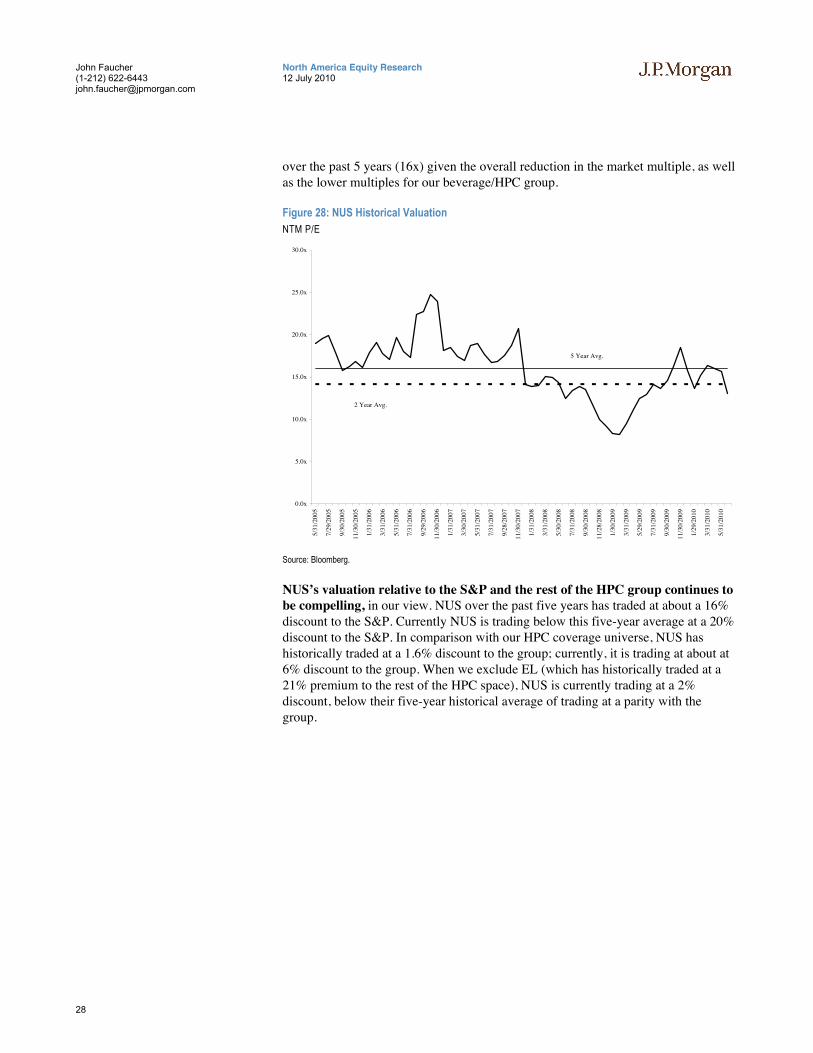
over the past 5 years (16x) given the overall reduction in the market multiple, as well as the lower multiples for our beverage/HPC group.
Figure 28: NUS Historical Valuation NTM P/E
0.0x
5.0x
10.0x
15.0x
20.0x
25.0x
30.0x
5/31
/200
5
7/29
/200
5
9/30
/200
5
11/3
0/20
05
1/31
/200
6
3/31
/200
6
5/31
/200
6
7/31
/200
6
9/29
/200
6
11/3
0/20
06
1/31
/200
7
3/30
/200
7
5/31
/200
7
7/31
/200
7
9/28
/200
7
11/3
0/20
07
1/31
/200
8
3/31
/200
8
5/30
/200
8
7/31
/200
8
9/30
/200
8
11/2
8/20
08
1/30
/200
9
3/31
/200
9
5/29
/200
9
7/31
/200
9
9/30
/200
9
11/3
0/20
09
1/29
/201
0
3/31
/201
0
5/31
/201
0
2 Year Avg.
5 Year Avg.
Source: Bloomberg.
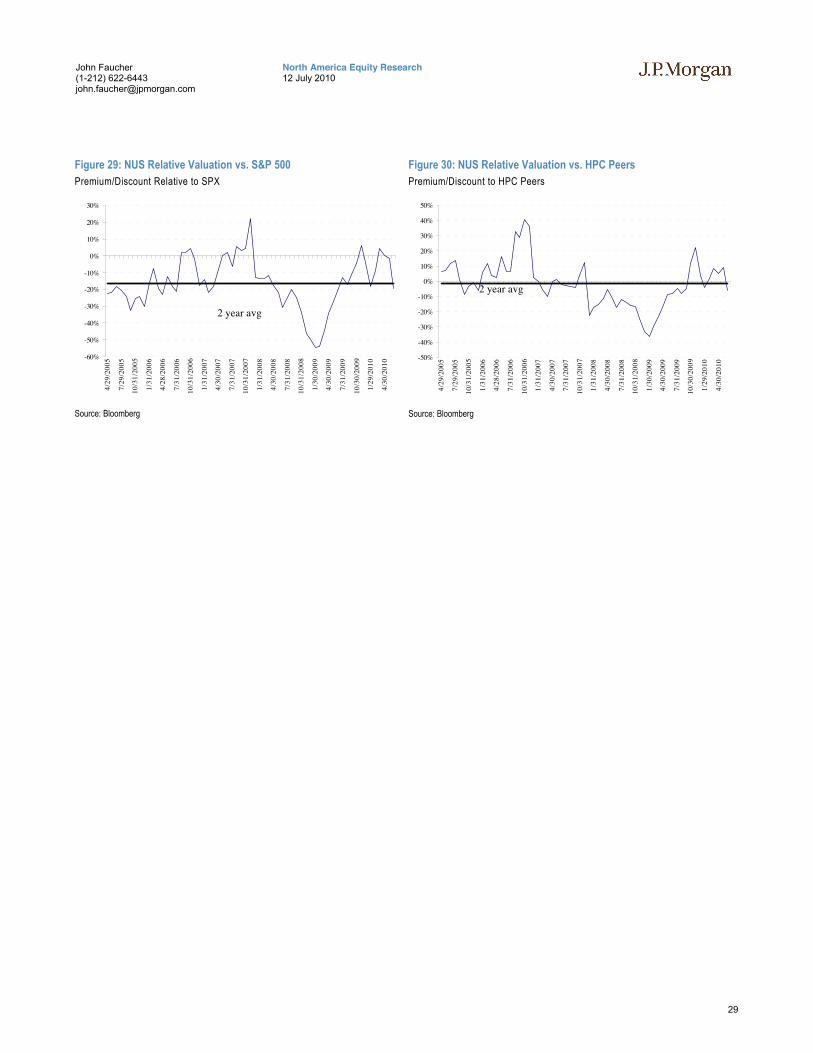
NUS’s valuation relative to the S&P and the rest of the HPC group continues to be compelling, in our view. NUS over the past five years has traded at about a 16% discount to the S&P. Currently NUS is trading below this five-year average at a 20% discount to the S&P. In comparison with our HPC coverage universe, NUS has historically traded at a 1.6% discount to the group; currently, it is trading at about at 6% discount to the group. When we exclude EL (which has historically traded at a 21% premium to the rest of the HPC space), NUS is currently trading at a 2% discount, below their five-year historical average of trading at a parity with the group.
29
North America Equity Research 12 July 2010
John Faucher (1-212) 622-6443 [email protected]
Figure 29: NUS Relative Valuation vs. S&P 500 Premium/Discount Relative to SPX
-60%
-50%
-40%
-30%
-20%
-10%
0%
10%
20%
30%
4/29
/200
5
7/29
/200
5
10/3
1/20
05
1/31
/200
6
4/28
/200
6
7/31
/200
6
10/3
1/20
06
1/31
/200
7
4/30
/200
7
7/31
/200
7
10/3
1/20
07
1/31
/200
8
4/30
/200
8
7/31
/200
8
10/3
1/20
08
1/30
/200
9
4/30
/200
9
7/31
/200
9
10/3
0/20
09
1/29
/201
0
4/30
/201
0
Source: Bloomberg
Figure 30: NUS Relative Valuation vs. HPC Peers Premium/Discount to HPC Peers
-50%
-40%
-30%
-20%
-10%
0%
10%
20%
30%
40%
50%
4/29
/200
5
7/29
/200
5
10/3
1/20
05
1/31
/200
6
4/28
/200
6
7/31
/200
6
10/3
1/20
06
1/31
/200
7
4/30
/200
7
7/31
/200
7
10/3
1/20
07
1/31
/200
8
4/30
/200
8
7/31
/200
8
10/3
1/20
08
1/30
/200
9
4/30
/200
9
7/31
/200
9
10/3
0/20
09
1/29
/201
0
4/30
/201
0
Source: Bloomberg
2 year avg
2 year avg
30
North America Equity Research 12 July 2010
John Faucher (1-212) 622-6443 [email protected]
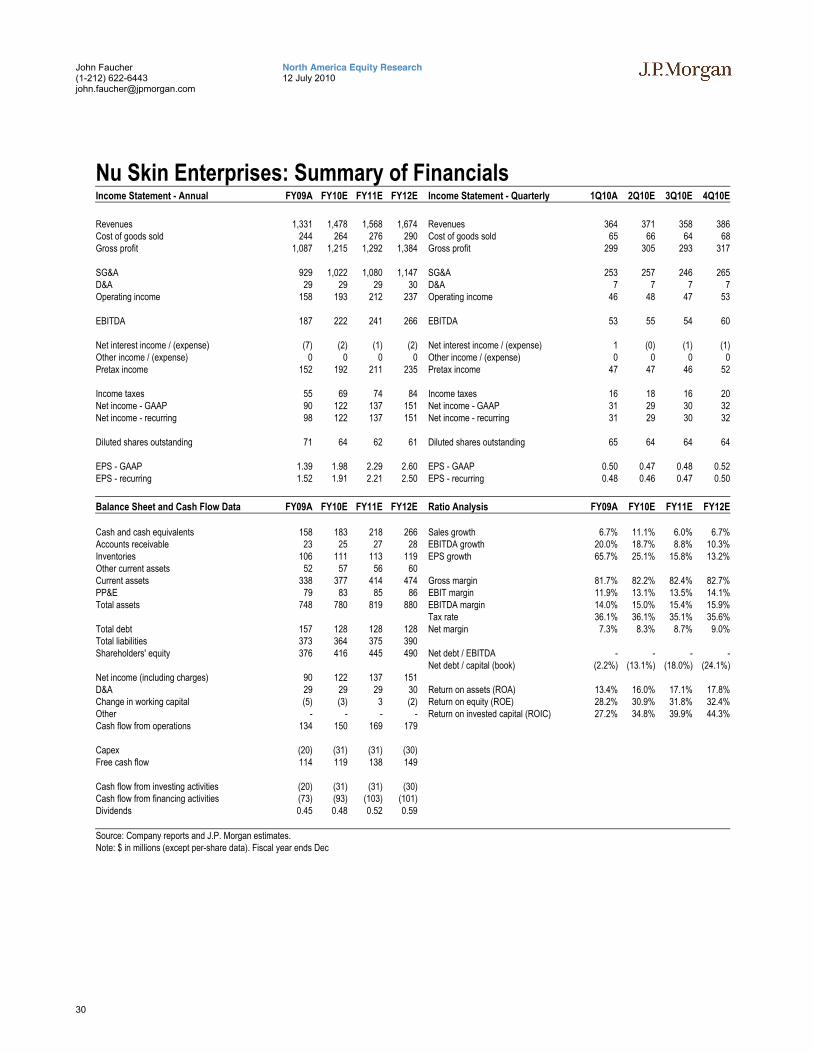
Nu Skin Enterprises: Summary of Financials Income Statement - Annual FY09A FY10E FY11E FY12E Income Statement - Quarterly 1Q10A 2Q10E 3Q10E 4Q10E
Revenues 1,331 1,478 1,568 1,674 Revenues 364 371 358 386Cost of goods sold 244 264 276 290 Cost of goods sold 65 66 64 68Gross profit 1,087 1,215 1,292 1,384 Gross profit 299 305 293 317 SG&A 929 1,022 1,080 1,147 SG&A 253 257 246 265D&A 29 29 29 30 D&A 7 7 7 7Operating income 158 193 212 237 Operating income 46 48 47 53 EBITDA 187 222 241 266 EBITDA 53 55 54 60 Net interest income / (expense) (7) (2) (1) (2) Net interest income / (expense) 1 (0) (1) (1)Other income / (expense) 0 0 0 0 Other income / (expense) 0 0 0 0Pretax income 152 192 211 235 Pretax income 47 47 46 52 Income taxes 55 69 74 84 Income taxes 16 18 16 20Net income - GAAP 90 122 137 151 Net income - GAAP 31 29 30 32Net income - recurring 98 122 137 151 Net income - recurring 31 29 30 32 Diluted shares outstanding 71 64 62 61 Diluted shares outstanding 65 64 64 64 EPS - GAAP 1.39 1.98 2.29 2.60 EPS - GAAP 0.50 0.47 0.48 0.52EPS - recurring 1.52 1.91 2.21 2.50 EPS - recurring 0.48 0.46 0.47 0.50 Balance Sheet and Cash Flow Data FY09A FY10E FY11E FY12E Ratio Analysis FY09A FY10E FY11E FY12E Cash and cash equivalents 158 183 218 266 Sales growth 6.7% 11.1% 6.0% 6.7%Accounts receivable 23 25 27 28 EBITDA growth 20.0% 18.7% 8.8% 10.3%Inventories 106 111 113 119 EPS growth 65.7% 25.1% 15.8% 13.2%Other current assets 52 57 56 60 Current assets 338 377 414 474 Gross margin 81.7% 82.2% 82.4% 82.7%PP&E 79 83 85 86 EBIT margin 11.9% 13.1% 13.5% 14.1%Total assets 748 780 819 880 EBITDA margin 14.0% 15.0% 15.4% 15.9% Tax rate 36.1% 36.1% 35.1% 35.6%Total debt 157 128 128 128 Net margin 7.3% 8.3% 8.7% 9.0%Total liabilities 373 364 375 390 Shareholders' equity 376 416 445 490 Net debt / EBITDA - - - - Net debt / capital (book) (2.2%) (13.1%) (18.0%) (24.1%)Net income (including charges) 90 122 137 151 D&A 29 29 29 30 Return on assets (ROA) 13.4% 16.0% 17.1% 17.8%Change in working capital (5) (3) 3 (2) Return on equity (ROE) 28.2% 30.9% 31.8% 32.4%Other - - - - Return on invested capital (ROIC) 27.2% 34.8% 39.9% 44.3%Cash flow from operations 134 150 169 179 Capex (20) (31) (31) (30) Free cash flow 114 119 138 149 Cash flow from investing activities (20) (31) (31) (30) Cash flow from financing activities (73) (93) (103) (101) Dividends 0.45 0.48 0.52 0.59 Source: Company reports and J.P. Morgan estimates. Note: $ in millions (except per-share data). Fiscal year ends Dec

31
North America Equity Research 12 July 2010
John Faucher (1-212) 622-6443 [email protected]
Analyst Certification: The research analyst(s) denoted by an “AC” on the cover of this report certifies (or, where multiple research analysts are primarily responsible for this report, the research analyst denoted by an “AC” on the cover or within the document individually certifies, with respect to each security or issuer that the research analyst covers in this research) that: (1) all of the views expressed in this report accurately reflect his or her personal views about any and all of the subject securities or issuers; and (2) no part of any of the research analyst’s compensation was, is, or will be directly or indirectly related to the specific recommendations or views expressed by the research analyst(s) in this report.
Important Disclosures
• Lead or Co-manager: JPMSI or its affiliates acted as lead or co-manager in a public offering of equity and/or debt securities for Nu Skin Enterprises within the past 12 months.
• Client of the Firm: Nu Skin Enterprises is or was in the past 12 months a client of JPMSI; during the past 12 months, JPMSI provided to the company investment banking services, non-investment banking securities-related services and non-securities-related services.
• Investment Banking (past 12 months): JPMSI or its affiliates received in the past 12 months compensation for investment banking services from Nu Skin Enterprises.
• Investment Banking (next 3 months): JPMSI or its affiliates expect to receive, or intend to seek, compensation for investment banking services in the next three months from Nu Skin Enterprises.
• Non-Investment Banking Compensation: JPMSI has received compensation in the past 12 months for products or services other than investment banking from Nu Skin Enterprises. An affiliate of JPMSI has received compensation in the past 12 months for products or services other than investment banking from Nu Skin Enterprises.
0
12
24
36
48
60
Price($)
Oct06
Jul07
Apr08
Jan09
Oct09
Jul10
Nu Skin Enterprises (NUS) Price Chart
Source: Bloomberg and J.P. Morgan; price data adjusted for stock splits and dividends.This chart shows J.P. Morgan's continuing coverage of this stock; the current analyst may or may not have covered itover the entire period.J.P. Morgan ratings: OW = Overweight, N = Neutral, UW = Underweight.
Explanation of Equity Research Ratings and Analyst(s) Coverage Universe: J.P. Morgan uses the following rating system: Overweight [Over the next six to twelve months, we expect this stock will outperform the average total return of the stocks in the analyst’s (or the analyst’s team’s) coverage universe.] Neutral [Over the next six to twelve months, we expect this stock will perform in line with the average total return of the stocks in the analyst’s (or the analyst’s team’s) coverage universe.] Underweight [Over the next six to twelve months, we expect this stock will underperform the average total return of the stocks in the analyst’s (or the analyst’s team’s) coverage universe.] J.P. Morgan Cazenove’s UK Small/Mid-Cap dedicated research analysts use the same rating categories; however, each stock’s expected total return is compared to the expected total return of the FTSE All Share Index, not to those analysts’ coverage universe. A list of these analysts is available on request. The analyst or analyst’s team’s coverage universe is the sector and/or country shown on the cover of each publication. See below for the specific stocks in the certifying analyst(s) coverage universe.

32
North America Equity Research 12 July 2010
John Faucher (1-212) 622-6443 [email protected]
Coverage Universe: John Faucher: Alberto-Culver (ACV), Church & Dwight (CHD), Clorox (CLX), Coca-Cola Co. (KO), Coca-Cola Enterprises (CCE), Coca-Cola Hellenic Bottling Company (HLBr.AT), Colgate-Palmolive (CL), Dr Pepper Snapple Group (DPS), Energizer Holdings (ENR), Estee Lauder (EL), Hansen Natural Corp. (HANS), Kimberly-Clark (KMB), Molson Coors Brewing Company (TAP), Newell Rubbermaid Inc. (NWL), PepsiCo (PEP), Procter & Gamble (PG), Tupperware Brands (TUP)
J.P. Morgan Equity Research Ratings Distribution, as of June 30, 2010
Overweight (buy)
Neutral (hold)
Underweight (sell)
JPM Global Equity Research Coverage 46% 42% 12% IB clients* 49% 46% 31% JPMSI Equity Research Coverage 44% 48% 9% IB clients* 68% 61% 53%
*Percentage of investment banking clients in each rating category. For purposes only of NASD/NYSE ratings distribution rules, our Overweight rating falls into a buy rating category; our Neutral rating falls into a hold rating category; and our Underweight rating falls into a sell rating category.
Valuation and Risks: Please see the most recent company-specific research report for an analysis of valuation methodology and risks on any securities recommended herein. Research is available at http://www.morganmarkets.com , or you can contact the analyst named on the front of this note or your J.P. Morgan representative.
Analysts’ Compensation: The equity research analysts responsible for the preparation of this report receive compensation based upon various factors, including the quality and accuracy of research, client feedback, competitive factors, and overall firm revenues, which include revenues from, among other business units, Institutional Equities and Investment Banking.
Other Disclosures
J.P. Morgan is the global brand name for J.P. Morgan Securities Inc. (JPMSI) and its non-US affiliates worldwide. J.P. Morgan Cazenove is a brand name for equity research produced by J.P. Morgan Securities Ltd.; J.P. Morgan Equities Limited; JPMorgan Chase Bank, N.A., Dubai Branch; and J.P. Morgan Bank International LLC.
Options related research: If the information contained herein regards options related research, such information is available only to persons who have received the proper option risk disclosure documents. For a copy of the Option Clearing Corporation’s Characteristics and Risks of Standardized Options, please contact your J.P. Morgan Representative or visit the OCC’s website at http://www.optionsclearing.com/publications/risks/riskstoc.pdf.
Legal Entities Disclosures U.S.: JPMSI is a member of NYSE, FINRA and SIPC. J.P. Morgan Futures Inc. is a member of the NFA. JPMorgan Chase Bank, N.A. is a member of FDIC and is authorized and regulated in the UK by the Financial Services Authority. U.K.: J.P. Morgan Securities Ltd. (JPMSL) is a member of the London Stock Exchange and is authorised and regulated by the Financial Services Authority. Registered in England & Wales No. 2711006. Registered Office 125 London Wall, London EC2Y 5AJ. South Africa: J.P. Morgan Equities Limited is a member of the Johannesburg Securities Exchange and is regulated by the FSB. Hong Kong: J.P. Morgan Securities (Asia Pacific) Limited (CE number AAJ321) is regulated by the Hong Kong Monetary Authority and the Securities and Futures Commission in Hong Kong. Korea: J.P. Morgan Securities (Far East) Ltd, Seoul Branch, is regulated by the Korea Financial Supervisory Service. Australia: J.P. Morgan Australia Limited (ABN 52 002 888 011/AFS Licence No: 238188) is regulated by ASIC and J.P. Morgan Securities Australia Limited (ABN 61 003 245 234/AFS Licence No: 238066) is a Market Participant with the ASX and regulated by ASIC. Taiwan: J.P.Morgan Securities (Taiwan) Limited is a participant of the Taiwan Stock Exchange (company-type) and regulated by the Taiwan Securities and Futures Bureau. India: J.P. Morgan India Private Limited is a member of the National Stock Exchange of India Limited and Bombay Stock Exchange Limited and is regulated by the Securities and Exchange Board of India. Thailand: JPMorgan Securities (Thailand) Limited is a member of the Stock Exchange of Thailand and is regulated by the Ministry of Finance and the Securities and Exchange Commission. Indonesia: PT J.P. Morgan Securities Indonesia is a member of the Indonesia Stock Exchange and is regulated by the BAPEPAM LK. Philippines: J.P. Morgan Securities Philippines Inc. is a member of the Philippine Stock Exchange and is regulated by the Securities and Exchange Commission. Brazil: Banco J.P. Morgan S.A. is regulated by the Comissao de Valores Mobiliarios (CVM) and by the Central Bank of Brazil. Mexico: J.P. Morgan Casa de Bolsa, S.A. de C.V., J.P. Morgan Grupo Financiero is a member of the Mexican Stock Exchange and authorized to act as a broker dealer by the National Banking and Securities Exchange Commission. Singapore: This material is issued and distributed in Singapore by J.P. Morgan Securities Singapore Private Limited (JPMSS) [MICA (P) 020/01/2010 and Co. Reg. No.: 199405335R] which is a member of the Singapore Exchange Securities Trading Limited and is regulated by the Monetary Authority of Singapore (MAS) and/or JPMorgan Chase Bank, N.A., Singapore branch (JPMCB Singapore) which is regulated by the MAS. Malaysia: This material is issued and distributed in Malaysia by JPMorgan Securities (Malaysia) Sdn Bhd (18146-X) which is a Participating Organization of Bursa Malaysia Berhad and a holder of Capital Markets Services License issued by the Securities Commission in Malaysia. Pakistan: J. P. Morgan Pakistan Broking (Pvt.) Ltd is a member of the Karachi Stock Exchange and regulated by the Securities and
33
North America Equity Research 12 July 2010
John Faucher (1-212) 622-6443 [email protected]
Exchange Commission of Pakistan. Saudi Arabia: J.P. Morgan Saudi Arabia Ltd. is authorised by the Capital Market Authority of the Kingdom of Saudi Arabia (CMA) to carry out dealing as an agent, arranging, advising and custody, with respect to securities business under licence number 35-07079 and its registered address is at 8th Floor, Al-Faisaliyah Tower, King Fahad Road, P.O. Box 51907, Riyadh 11553, Kingdom of Saudi Arabia. Dubai: JPMorgan Chase Bank, N.A., Dubai Branch is regulated by the Dubai Financial Services Authority (DFSA) and its registered address is Dubai International Financial Centre - Building 3, Level 7, PO Box 506551, Dubai, UAE.
Country and Region Specific Disclosures U.K. and European Economic Area (EEA): Unless specified to the contrary, issued and approved for distribution in the U.K. and the EEA by JPMSL. Investment research issued by JPMSL has been prepared in accordance with JPMSL's policies for managing conflicts of interest arising as a result of publication and distribution of investment research. Many European regulators require that a firm to establish, implement and maintain such a policy. This report has been issued in the U.K. only to persons of a kind described in Article 19 (5), 38, 47 and 49 of the Financial Services and Markets Act 2000 (Financial Promotion) Order 2005 (all such persons being referred to as "relevant persons"). This document must not be acted on or relied on by persons who are not relevant persons. Any investment or investment activity to which this document relates is only available to relevant persons and will be engaged in only with relevant persons. In other EEA countries, the report has been issued to persons regarded as professional investors (or equivalent) in their home jurisdiction. Australia: This material is issued and distributed by JPMSAL in Australia to “wholesale clients” only. JPMSAL does not issue or distribute this material to “retail clients.” The recipient of this material must not distribute it to any third party or outside Australia without the prior written consent of JPMSAL. For the purposes of this paragraph the terms “wholesale client” and “retail client” have the meanings given to them in section 761G of the Corporations Act 2001. Germany: This material is distributed in Germany by J.P. Morgan Securities Ltd., Frankfurt Branch and J.P.Morgan Chase Bank, N.A., Frankfurt Branch which are regulated by the Bundesanstalt für Finanzdienstleistungsaufsicht. Hong Kong: The 1% ownership disclosure as of the previous month end satisfies the requirements under Paragraph 16.5(a) of the Hong Kong Code of Conduct for Persons Licensed by or Registered with the Securities and Futures Commission. (For research published within the first ten days of the month, the disclosure may be based on the month end data from two months’ prior.) J.P. Morgan Broking (Hong Kong) Limited is the liquidity provider for derivative warrants issued by J.P. Morgan Structured Products B.V. and listed on the Stock Exchange of Hong Kong Limited. An updated list can be found on HKEx website: http://www.hkex.com.hk/prod/dw/Lp.htm. Japan: There is a risk that a loss may occur due to a change in the price of the shares in the case of share trading, and that a loss may occur due to the exchange rate in the case of foreign share trading. In the case of share trading, JPMorgan Securities Japan Co., Ltd., will be receiving a brokerage fee and consumption tax (shouhizei) calculated by multiplying the executed price by the commission rate which was individually agreed between JPMorgan Securities Japan Co., Ltd., and the customer in advance. Financial Instruments Firms: JPMorgan Securities Japan Co., Ltd., Kanto Local Finance Bureau (kinsho) No. 82 Participating Association / Japan Securities Dealers Association, The Financial Futures Association of Japan. Korea: This report may have been edited or contributed to from time to time by affiliates of J.P. Morgan Securities (Far East) Ltd, Seoul Branch. Singapore: JPMSS and/or its affiliates may have a holding in any of the securities discussed in this report; for securities where the holding is 1% or greater, the specific holding is disclosed in the Important Disclosures section above. India: For private circulation only, not for sale. Pakistan: For private circulation only, not for sale. New Zealand: This material is issued and distributed by JPMSAL in New Zealand only to persons whose principal business is the investment of money or who, in the course of and for the purposes of their business, habitually invest money. JPMSAL does not issue or distribute this material to members of "the public" as determined in accordance with section 3 of the Securities Act 1978. The recipient of this material must not distribute it to any third party or outside New Zealand without the prior written consent of JPMSAL. Canada: The information contained herein is not, and under no circumstances is to be construed as, a prospectus, an advertisement, a public offering, an offer to sell securities described herein, or solicitation of an offer to buy securities described herein, in Canada or any province or territory thereof. Any offer or sale of the securities described herein in Canada will be made only under an exemption from the requirements to file a prospectus with the relevant Canadian securities regulators and only by a dealer properly registered under applicable securities laws or, alternatively, pursuant to an exemption from the dealer registration requirement in the relevant province or territory of Canada in which such offer or sale is made. The information contained herein is under no circumstances to be construed as investment advice in any province or territory of Canada and is not tailored to the needs of the recipient. To the extent that the information contained herein references securities of an issuer incorporated, formed or created under the laws of Canada or a province or territory of Canada, any trades in such securities must be conducted through a dealer registered in Canada. No securities commission or similar regulatory authority in Canada has reviewed or in any way passed judgment upon these materials, the information contained herein or the merits of the securities described herein, and any representation to the contrary is an offence. Dubai: This report has been issued to persons regarded as professional clients as defined under the DFSA rules.
General: Additional information is available upon request. Information has been obtained from sources believed to be reliable but JPMorgan Chase & Co. or its affiliates and/or subsidiaries (collectively J.P. Morgan) do not warrant its completeness or accuracy except with respect to any disclosures relative to JPMSI and/or its affiliates and the analyst’s involvement with the issuer that is the subject of the research. All pricing is as of the close of market for the securities discussed, unless otherwise stated. Opinions and estimates constitute our judgment as of the date of this material and are subject to change without notice. Past performance is not indicative of future results. This material is not intended as an offer or solicitation for the purchase or sale of any financial instrument. The opinions and recommendations herein do not take into account individual client circumstances, objectives, or needs and are not intended as recommendations of particular securities, financial instruments or strategies to particular clients. The recipient of this report must make its own independent decisions regarding any securities or financial instruments mentioned herein. JPMSI distributes in the U.S. research published by non-U.S. affiliates and accepts responsibility for its contents. Periodic updates may be provided on companies/industries based on company specific developments or announcements, market conditions or any other publicly available information. Clients should contact analysts and execute transactions through a J.P. Morgan subsidiary or affiliate in their home jurisdiction unless governing law permits otherwise.
“Other Disclosures” last revised March 1, 2010.

34
North America Equity Research 12 July 2010
John Faucher (1-212) 622-6443 [email protected]
Copyright 2010 JPMorgan Chase & Co. All rights reserved. This report or any portion hereof may not be reprinted, sold or redistributed without the written consent of J.P. Morgan.