ntp historical controls report all routes and … historical controls report all routes and vehicles...
TRANSCRIPT
NTP Historical Controls Report
All Routes and Vehicles
F 344/N RATS
May 2011

REPORT DESCRIPTION
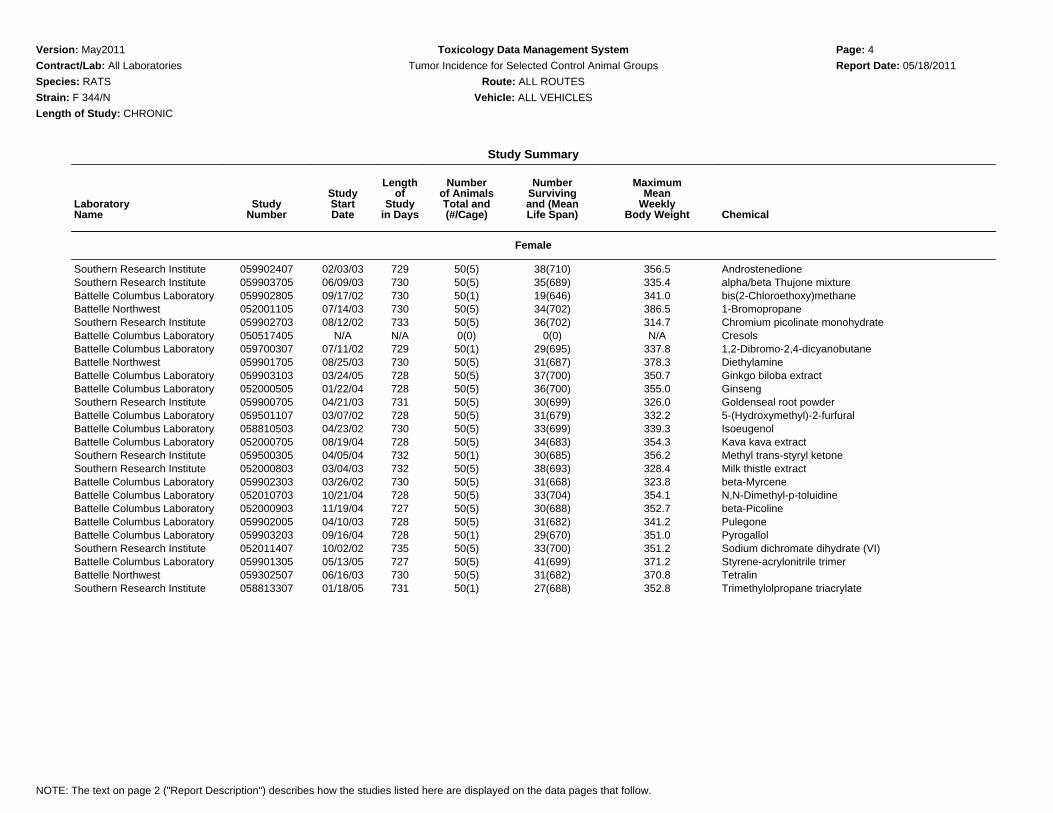
This report shows the tumor rates of control group animals from selected studies. The studies usedare shown on the Study Summary page.
The report combines all the data from all of the historical control studies into one section. To see thisdata broken up by route and vehicle you must run the "By Route And Vehicle" report.
The individual tumor rates shown on the data pages of the report relate to the Study Summary pageas follows: the tumor rates are shown in the same order as the Study Summary page, except thatthey are grouped horizontally in sets of three, with the males in the first set of three and the femalesin the second set. For example if the study summary showed the studies like this:
MaleM1M2M3M4M5
FemaleF1F2F3F4F5
the data would be shown as:
Male FemaleM1 M2 M3 F1 F2 F3M4 M5 F4 F5
Directly beneath the individual tumor rates on the data pages are the overall totals for that tumor/sitecombination. This includes the total tumors/animals, the overall mean (in parentheses), the mean ofthe study means, and the standard deviation of the study means.
Studies with no control animals of a particular gender are listed on the summary page with theNumber of Animals shown as zero and the Start Date and Length of Study shown as "N/A". On thedata pages there are blank spaces where tumor rates for these studies would normally be found, sothat the male and female rates for the remaining studies can be easily compared.

Version: May2011 Toxicology Data Management System Page: 3
Contract/Lab: All Laboratories Tumor Incidence for Selected Control Animal Groups Report Date: 05/18/2011
Species: RATS Route: ALL ROUTES
Strain: F 344/N Vehicle: ALL VEHICLES
Length of Study: CHRONIC
Study Summary
LaboratoryName
StudyNumber
StudyStartDate
Lengthof
Studyin Days
Numberof AnimalsTotal and(#/Cage)
NumberSurvivingand (MeanLife Span)
MaximumMean
WeeklyBody Weight Chemical
Male
Southern Research Institute 059902407 02/03/03 729 50(3) 21(661) 518.7 AndrostenedioneSouthern Research Institute 059903705 06/09/03 729 50(3) 27(662) 523.0 alpha/beta Thujone mixtureBattelle Columbus Laboratory 059902805 09/16/02 729 50(1) 21(676) 506.2 bis(2-Chloroethoxy)methaneBattelle Northwest 052001105 07/14/03 729 50(5) 23(678) 526.9 1-BromopropaneSouthern Research Institute 059902703 08/12/02 729 50(3) 37(705) 452.8 Chromium picolinate monohydrateBattelle Columbus Laboratory 050517405 08/05/02 729 50(3) 33(703) 510.0 CresolsBattelle Columbus Laboratory 059700307 07/10/02 728 50(1) 25(680) 510.4 1,2-Dibromo-2,4-dicyanobutaneBattelle Northwest 059901705 08/25/03 729 50(5) 28(686) 525.6 DiethylamineBattelle Columbus Laboratory 059903103 03/23/05 727 50(3) 38(706) 512.7 Ginkgo biloba extractBattelle Columbus Laboratory 052000505 01/21/04 727 50(3) 30(679) 498.5 GinsengSouthern Research Institute 059900705 04/21/03 729 50(3) 33(679) 460.9 Goldenseal root powderBattelle Columbus Laboratory 059501107 03/06/02 727 50(3) 22(673) 510.3 5-(Hydroxymethyl)-2-furfuralBattelle Columbus Laboratory 058810503 04/22/02 729 50(3) 35(702) 521.9 IsoeugenolBattelle Columbus Laboratory 052000705 08/18/04 727 49(3) 34(692) 515.2 Kava kava extractSouthern Research Institute 059500305 04/05/04 729 50(1) 27(683) 508.5 Methyl trans-styryl ketoneSouthern Research Institute 052000803 03/04/03 729 50(3) 36(704) 452.1 Milk thistle extractBattelle Columbus Laboratory 059902303 03/25/02 729 50(3) 29(683) 501.9 beta-MyrceneBattelle Columbus Laboratory 052010703 10/20/04 727 50(3) 37(702) 503.5 N,N-Dimethyl-p-toluidineBattelle Columbus Laboratory 052000903 11/18/04 726 50(3) 33(668) 516.1 beta-PicolineBattelle Columbus Laboratory 059902005 04/09/03 727 50(3) 39(685) 514.9 PulegoneBattelle Columbus Laboratory 059903203 09/15/04 727 50(1) 23(651) 510.1 PyrogallolSouthern Research Institute 052011407 10/02/02 730 50(3) 28(696) 532.4 Sodium dichromate dihydrate (VI)Battelle Columbus Laboratory 059901305 05/12/05 726 50(3) 36(685) 522.7 Styrene-acrylonitrile trimerBattelle Northwest 059302507 06/16/03 729 50(5) 20(668) 536.2 TetralinSouthern Research Institute 058813307 01/18/05 729 50(1) 23(681) 516.1 Trimethylolpropane triacrylate
NOTE: The text on page 2 ("Report Description") describes how the studies listed here are displayed on the data pages that follow.
Version: May2011 Toxicology Data Management System Page: 4
Contract/Lab: All Laboratories Tumor Incidence for Selected Control Animal Groups Report Date: 05/18/2011
Species: RATS Route: ALL ROUTES
Strain: F 344/N Vehicle: ALL VEHICLES
Length of Study: CHRONIC
Study Summary
LaboratoryName
StudyNumber
StudyStartDate
Lengthof
Studyin Days
Numberof AnimalsTotal and(#/Cage)
NumberSurvivingand (MeanLife Span)
MaximumMean
WeeklyBody Weight Chemical
Female
Southern Research Institute 059902407 02/03/03 729 50(5) 38(710) 356.5 AndrostenedioneSouthern Research Institute 059903705 06/09/03 730 50(5) 35(689) 335.4 alpha/beta Thujone mixtureBattelle Columbus Laboratory 059902805 09/17/02 730 50(1) 19(646) 341.0 bis(2-Chloroethoxy)methaneBattelle Northwest 052001105 07/14/03 730 50(5) 34(702) 386.5 1-BromopropaneSouthern Research Institute 059902703 08/12/02 733 50(5) 36(702) 314.7 Chromium picolinate monohydrateBattelle Columbus Laboratory 050517405 N/A N/A 0(0) 0(0) N/A CresolsBattelle Columbus Laboratory 059700307 07/11/02 729 50(1) 29(695) 337.8 1,2-Dibromo-2,4-dicyanobutaneBattelle Northwest 059901705 08/25/03 730 50(5) 31(687) 378.3 DiethylamineBattelle Columbus Laboratory 059903103 03/24/05 728 50(5) 37(700) 350.7 Ginkgo biloba extractBattelle Columbus Laboratory 052000505 01/22/04 728 50(5) 36(700) 355.0 GinsengSouthern Research Institute 059900705 04/21/03 731 50(5) 30(699) 326.0 Goldenseal root powderBattelle Columbus Laboratory 059501107 03/07/02 728 50(5) 31(679) 332.2 5-(Hydroxymethyl)-2-furfuralBattelle Columbus Laboratory 058810503 04/23/02 730 50(5) 33(699) 339.3 IsoeugenolBattelle Columbus Laboratory 052000705 08/19/04 728 50(5) 34(683) 354.3 Kava kava extractSouthern Research Institute 059500305 04/05/04 732 50(1) 30(685) 356.2 Methyl trans-styryl ketoneSouthern Research Institute 052000803 03/04/03 732 50(5) 38(693) 328.4 Milk thistle extractBattelle Columbus Laboratory 059902303 03/26/02 730 50(5) 31(668) 323.8 beta-MyrceneBattelle Columbus Laboratory 052010703 10/21/04 728 50(5) 33(704) 354.1 N,N-Dimethyl-p-toluidineBattelle Columbus Laboratory 052000903 11/19/04 727 50(5) 30(688) 352.7 beta-PicolineBattelle Columbus Laboratory 059902005 04/10/03 728 50(5) 31(682) 341.2 PulegoneBattelle Columbus Laboratory 059903203 09/16/04 728 50(1) 29(670) 351.0 PyrogallolSouthern Research Institute 052011407 10/02/02 735 50(5) 33(700) 351.2 Sodium dichromate dihydrate (VI)Battelle Columbus Laboratory 059901305 05/13/05 727 50(5) 41(699) 371.2 Styrene-acrylonitrile trimerBattelle Northwest 059302507 06/16/03 730 50(5) 31(682) 370.8 TetralinSouthern Research Institute 058813307 01/18/05 731 50(1) 27(688) 352.8 Trimethylolpropane triacrylate
NOTE: The text on page 2 ("Report Description") describes how the studies listed here are displayed on the data pages that follow.
Version: May2011 Toxicology Data Management System Page: 5
Contract/Lab: All Laboratories Tumor Incidence for Selected Control Animal Groups Report Date: 05/18/2011
Species: RATS Route: ALL ROUTES
Strain: F 344/N Vehicle: ALL VEHICLES
Length of Study: CHRONIC
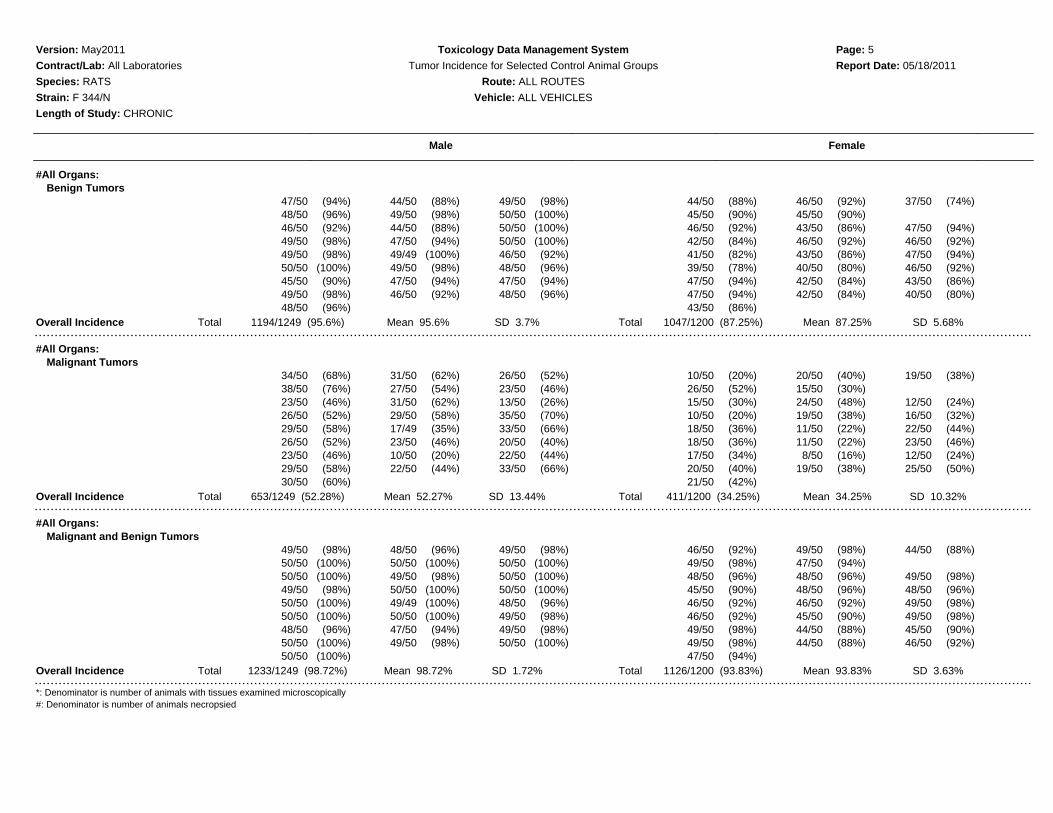
Male Female
#All Organs:Benign Tumors
47/50 (94%) 44/50 (88%) 49/50 (98%) 44/50 (88%) 46/50 (92%) 37/50 (74%)48/50 (96%) 49/50 (98%) 50/50 (100%) 45/50 (90%) 45/50 (90%)46/50 (92%) 44/50 (88%) 50/50 (100%) 46/50 (92%) 43/50 (86%) 47/50 (94%)49/50 (98%) 47/50 (94%) 50/50 (100%) 42/50 (84%) 46/50 (92%) 46/50 (92%)49/50 (98%) 49/49 (100%) 46/50 (92%) 41/50 (82%) 43/50 (86%) 47/50 (94%)50/50 (100%) 49/50 (98%) 48/50 (96%) 39/50 (78%) 40/50 (80%) 46/50 (92%)45/50 (90%) 47/50 (94%) 47/50 (94%) 47/50 (94%) 42/50 (84%) 43/50 (86%)49/50 (98%) 46/50 (92%) 48/50 (96%) 47/50 (94%) 42/50 (84%) 40/50 (80%)48/50 (96%) 43/50 (86%)
Overall Incidence Total 1194/1249 (95.6%) Mean 95.6% SD 3.7% Total 1047/1200 (87.25%) Mean 87.25% SD 5.68%
#All Organs:Malignant Tumors
34/50 (68%) 31/50 (62%) 26/50 (52%) 10/50 (20%) 20/50 (40%) 19/50 (38%)38/50 (76%) 27/50 (54%) 23/50 (46%) 26/50 (52%) 15/50 (30%)23/50 (46%) 31/50 (62%) 13/50 (26%) 15/50 (30%) 24/50 (48%) 12/50 (24%)26/50 (52%) 29/50 (58%) 35/50 (70%) 10/50 (20%) 19/50 (38%) 16/50 (32%)29/50 (58%) 17/49 (35%) 33/50 (66%) 18/50 (36%) 11/50 (22%) 22/50 (44%)26/50 (52%) 23/50 (46%) 20/50 (40%) 18/50 (36%) 11/50 (22%) 23/50 (46%)23/50 (46%) 10/50 (20%) 22/50 (44%) 17/50 (34%) 8/50 (16%) 12/50 (24%)29/50 (58%) 22/50 (44%) 33/50 (66%) 20/50 (40%) 19/50 (38%) 25/50 (50%)30/50 (60%) 21/50 (42%)
Overall Incidence Total 653/1249 (52.28%) Mean 52.27% SD 13.44% Total 411/1200 (34.25%) Mean 34.25% SD 10.32%
#All Organs:Malignant and Benign Tumors
49/50 (98%) 48/50 (96%) 49/50 (98%) 46/50 (92%) 49/50 (98%) 44/50 (88%)50/50 (100%) 50/50 (100%) 50/50 (100%) 49/50 (98%) 47/50 (94%)50/50 (100%) 49/50 (98%) 50/50 (100%) 48/50 (96%) 48/50 (96%) 49/50 (98%)49/50 (98%) 50/50 (100%) 50/50 (100%) 45/50 (90%) 48/50 (96%) 48/50 (96%)50/50 (100%) 49/49 (100%) 48/50 (96%) 46/50 (92%) 46/50 (92%) 49/50 (98%)50/50 (100%) 50/50 (100%) 49/50 (98%) 46/50 (92%) 45/50 (90%) 49/50 (98%)48/50 (96%) 47/50 (94%) 49/50 (98%) 49/50 (98%) 44/50 (88%) 45/50 (90%)50/50 (100%) 49/50 (98%) 50/50 (100%) 49/50 (98%) 44/50 (88%) 46/50 (92%)50/50 (100%) 47/50 (94%)
Overall Incidence Total 1233/1249 (98.72%) Mean 98.72% SD 1.72% Total 1126/1200 (93.83%) Mean 93.83% SD 3.63%
*: Denominator is number of animals with tissues examined microscopically#: Denominator is number of animals necropsied
Version: May2011 Toxicology Data Management System Page: 6
Contract/Lab: All Laboratories Tumor Incidence for Selected Control Animal Groups Report Date: 05/18/2011
Species: RATS Route: ALL ROUTES
Strain: F 344/N Vehicle: ALL VEHICLES
Length of Study: CHRONIC
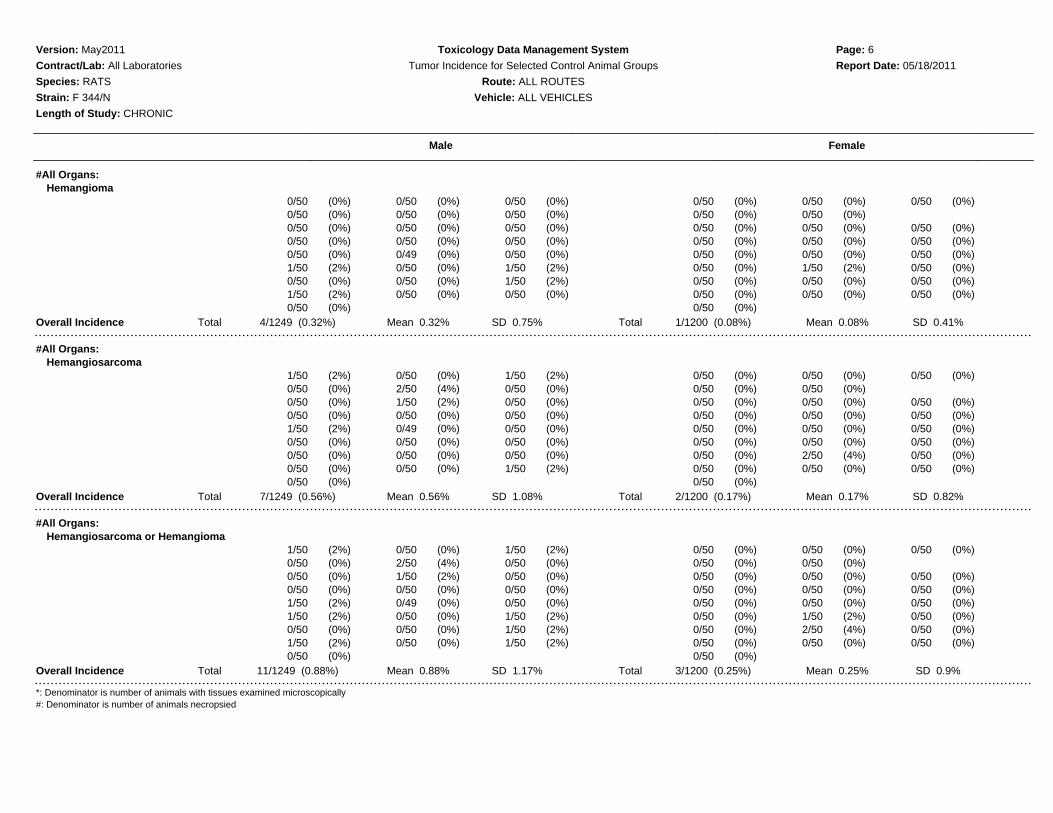
Male Female
#All Organs:Hemangioma
0/50 (0%) 0/50 (0%) 0/50 (0%) 0/50 (0%) 0/50 (0%) 0/50 (0%)0/50 (0%) 0/50 (0%) 0/50 (0%) 0/50 (0%) 0/50 (0%)0/50 (0%) 0/50 (0%) 0/50 (0%) 0/50 (0%) 0/50 (0%) 0/50 (0%)0/50 (0%) 0/50 (0%) 0/50 (0%) 0/50 (0%) 0/50 (0%) 0/50 (0%)0/50 (0%) 0/49 (0%) 0/50 (0%) 0/50 (0%) 0/50 (0%) 0/50 (0%)1/50 (2%) 0/50 (0%) 1/50 (2%) 0/50 (0%) 1/50 (2%) 0/50 (0%)0/50 (0%) 0/50 (0%) 1/50 (2%) 0/50 (0%) 0/50 (0%) 0/50 (0%)1/50 (2%) 0/50 (0%) 0/50 (0%) 0/50 (0%) 0/50 (0%) 0/50 (0%)0/50 (0%) 0/50 (0%)
Overall Incidence Total 4/1249 (0.32%) Mean 0.32% SD 0.75% Total 1/1200 (0.08%) Mean 0.08% SD 0.41%
#All Organs:Hemangiosarcoma
1/50 (2%) 0/50 (0%) 1/50 (2%) 0/50 (0%) 0/50 (0%) 0/50 (0%)0/50 (0%) 2/50 (4%) 0/50 (0%) 0/50 (0%) 0/50 (0%)0/50 (0%) 1/50 (2%) 0/50 (0%) 0/50 (0%) 0/50 (0%) 0/50 (0%)0/50 (0%) 0/50 (0%) 0/50 (0%) 0/50 (0%) 0/50 (0%) 0/50 (0%)1/50 (2%) 0/49 (0%) 0/50 (0%) 0/50 (0%) 0/50 (0%) 0/50 (0%)0/50 (0%) 0/50 (0%) 0/50 (0%) 0/50 (0%) 0/50 (0%) 0/50 (0%)0/50 (0%) 0/50 (0%) 0/50 (0%) 0/50 (0%) 2/50 (4%) 0/50 (0%)0/50 (0%) 0/50 (0%) 1/50 (2%) 0/50 (0%) 0/50 (0%) 0/50 (0%)0/50 (0%) 0/50 (0%)
Overall Incidence Total 7/1249 (0.56%) Mean 0.56% SD 1.08% Total 2/1200 (0.17%) Mean 0.17% SD 0.82%
#All Organs:Hemangiosarcoma or Hemangioma
1/50 (2%) 0/50 (0%) 1/50 (2%) 0/50 (0%) 0/50 (0%) 0/50 (0%)0/50 (0%) 2/50 (4%) 0/50 (0%) 0/50 (0%) 0/50 (0%)0/50 (0%) 1/50 (2%) 0/50 (0%) 0/50 (0%) 0/50 (0%) 0/50 (0%)0/50 (0%) 0/50 (0%) 0/50 (0%) 0/50 (0%) 0/50 (0%) 0/50 (0%)1/50 (2%) 0/49 (0%) 0/50 (0%) 0/50 (0%) 0/50 (0%) 0/50 (0%)1/50 (2%) 0/50 (0%) 1/50 (2%) 0/50 (0%) 1/50 (2%) 0/50 (0%)0/50 (0%) 0/50 (0%) 1/50 (2%) 0/50 (0%) 2/50 (4%) 0/50 (0%)1/50 (2%) 0/50 (0%) 1/50 (2%) 0/50 (0%) 0/50 (0%) 0/50 (0%)0/50 (0%) 0/50 (0%)
Overall Incidence Total 11/1249 (0.88%) Mean 0.88% SD 1.17% Total 3/1200 (0.25%) Mean 0.25% SD 0.9%
*: Denominator is number of animals with tissues examined microscopically#: Denominator is number of animals necropsied

Version: May2011 Toxicology Data Management System Page: 7
Contract/Lab: All Laboratories Tumor Incidence for Selected Control Animal Groups Report Date: 05/18/2011
Species: RATS Route: ALL ROUTES
Strain: F 344/N Vehicle: ALL VEHICLES
Length of Study: CHRONIC
Male Female
#All Organs:Histiocytic Sarcoma
1/50 (2%) 1/50 (2%) 1/50 (2%) 0/50 (0%) 0/50 (0%) 1/50 (2%)0/50 (0%) 0/50 (0%) 0/50 (0%) 0/50 (0%) 1/50 (2%)1/50 (2%) 0/50 (0%) 0/50 (0%) 0/50 (0%) 0/50 (0%) 0/50 (0%)0/50 (0%) 0/50 (0%) 0/50 (0%) 0/50 (0%) 1/50 (2%) 0/50 (0%)0/50 (0%) 0/49 (0%) 0/50 (0%) 0/50 (0%) 0/50 (0%) 0/50 (0%)3/50 (6%) 1/50 (2%) 0/50 (0%) 0/50 (0%) 0/50 (0%) 0/50 (0%)0/50 (0%) 0/50 (0%) 0/50 (0%) 0/50 (0%) 0/50 (0%) 0/50 (0%)0/50 (0%) 1/50 (2%) 0/50 (0%) 0/50 (0%) 0/50 (0%) 2/50 (4%)0/50 (0%) 0/50 (0%)
Overall Incidence Total 9/1249 (0.72%) Mean 0.72% SD 1.4% Total 5/1200 (0.42%) Mean 0.42% SD 1.02%
#All Organs:Leukemia: Erythrocytic
0/50 (0%) 0/50 (0%) 0/50 (0%) 0/50 (0%) 0/50 (0%) 0/50 (0%)0/50 (0%) 0/50 (0%) 0/50 (0%) 0/50 (0%) 0/50 (0%)0/50 (0%) 0/50 (0%) 0/50 (0%) 0/50 (0%) 0/50 (0%) 0/50 (0%)0/50 (0%) 0/50 (0%) 0/50 (0%) 0/50 (0%) 0/50 (0%) 0/50 (0%)0/50 (0%) 0/49 (0%) 0/50 (0%) 0/50 (0%) 0/50 (0%) 0/50 (0%)0/50 (0%) 0/50 (0%) 0/50 (0%) 1/50 (2%) 0/50 (0%) 0/50 (0%)0/50 (0%) 0/50 (0%) 0/50 (0%) 0/50 (0%) 0/50 (0%) 0/50 (0%)0/50 (0%) 0/50 (0%) 0/50 (0%) 0/50 (0%) 0/50 (0%) 0/50 (0%)0/50 (0%) 0/50 (0%)
Overall Incidence Total 0/1249 (0%) Mean 0% SD 0% Total 1/1200 (0.08%) Mean 0.08% SD 0.41%
#All Organs:Leukemia: Lymphocytic, Monocytic, Mononuclear, or Undifferentiated
26/50 (52%) 22/50 (44%) 17/50 (34%) 5/50 (10%) 10/50 (20%) 12/50 (24%)29/50 (58%) 19/50 (38%) 15/50 (30%) 16/50 (32%) 9/50 (18%)17/50 (34%) 25/50 (50%) 9/50 (18%) 10/50 (20%) 15/50 (30%) 8/50 (16%)18/50 (36%) 21/50 (42%) 28/50 (56%) 6/50 (12%) 9/50 (18%) 9/50 (18%)10/50 (20%) 7/49 (14%) 26/50 (52%) 8/50 (16%) 5/50 (10%) 18/50 (36%)17/50 (34%) 9/50 (18%) 14/50 (28%) 6/50 (12%) 5/50 (10%) 15/50 (30%)14/50 (28%) 4/50 (8%) 11/50 (22%) 12/50 (24%) 4/50 (8%) 8/50 (16%)26/50 (52%) 15/50 (30%) 25/50 (50%) 8/50 (16%) 13/50 (26%) 17/50 (34%)26/50 (52%) 12/50 (24%)
Overall Incidence Total 450/1249 (36.03%) Mean 36.01% SD 14.39% Total 240/1200 (20%) Mean 20% SD 8.15%
*: Denominator is number of animals with tissues examined microscopically#: Denominator is number of animals necropsied
Version: May2011 Toxicology Data Management System Page: 8
Contract/Lab: All Laboratories Tumor Incidence for Selected Control Animal Groups Report Date: 05/18/2011
Species: RATS Route: ALL ROUTES
Strain: F 344/N Vehicle: ALL VEHICLES
Length of Study: CHRONIC
Male Female
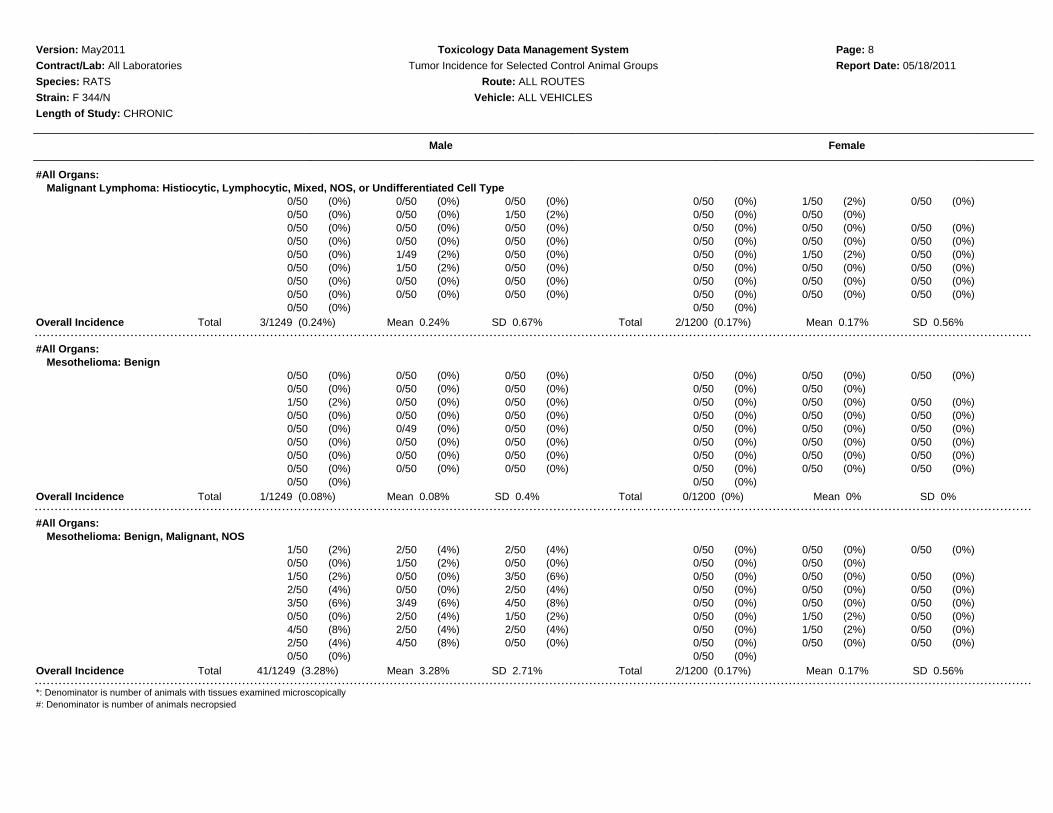
#All Organs:Malignant Lymphoma: Histiocytic, Lymphocytic, Mixed, NOS, or Undifferentiated Cell Type
0/50 (0%) 0/50 (0%) 0/50 (0%) 0/50 (0%) 1/50 (2%) 0/50 (0%)0/50 (0%) 0/50 (0%) 1/50 (2%) 0/50 (0%) 0/50 (0%)0/50 (0%) 0/50 (0%) 0/50 (0%) 0/50 (0%) 0/50 (0%) 0/50 (0%)0/50 (0%) 0/50 (0%) 0/50 (0%) 0/50 (0%) 0/50 (0%) 0/50 (0%)0/50 (0%) 1/49 (2%) 0/50 (0%) 0/50 (0%) 1/50 (2%) 0/50 (0%)0/50 (0%) 1/50 (2%) 0/50 (0%) 0/50 (0%) 0/50 (0%) 0/50 (0%)0/50 (0%) 0/50 (0%) 0/50 (0%) 0/50 (0%) 0/50 (0%) 0/50 (0%)0/50 (0%) 0/50 (0%) 0/50 (0%) 0/50 (0%) 0/50 (0%) 0/50 (0%)0/50 (0%) 0/50 (0%)
Overall Incidence Total 3/1249 (0.24%) Mean 0.24% SD 0.67% Total 2/1200 (0.17%) Mean 0.17% SD 0.56%
#All Organs:Mesothelioma: Benign
0/50 (0%) 0/50 (0%) 0/50 (0%) 0/50 (0%) 0/50 (0%) 0/50 (0%)0/50 (0%) 0/50 (0%) 0/50 (0%) 0/50 (0%) 0/50 (0%)1/50 (2%) 0/50 (0%) 0/50 (0%) 0/50 (0%) 0/50 (0%) 0/50 (0%)0/50 (0%) 0/50 (0%) 0/50 (0%) 0/50 (0%) 0/50 (0%) 0/50 (0%)0/50 (0%) 0/49 (0%) 0/50 (0%) 0/50 (0%) 0/50 (0%) 0/50 (0%)0/50 (0%) 0/50 (0%) 0/50 (0%) 0/50 (0%) 0/50 (0%) 0/50 (0%)0/50 (0%) 0/50 (0%) 0/50 (0%) 0/50 (0%) 0/50 (0%) 0/50 (0%)0/50 (0%) 0/50 (0%) 0/50 (0%) 0/50 (0%) 0/50 (0%) 0/50 (0%)0/50 (0%) 0/50 (0%)
Overall Incidence Total 1/1249 (0.08%) Mean 0.08% SD 0.4% Total 0/1200 (0%) Mean 0% SD 0%
#All Organs:Mesothelioma: Benign, Malignant, NOS
1/50 (2%) 2/50 (4%) 2/50 (4%) 0/50 (0%) 0/50 (0%) 0/50 (0%)0/50 (0%) 1/50 (2%) 0/50 (0%) 0/50 (0%) 0/50 (0%)1/50 (2%) 0/50 (0%) 3/50 (6%) 0/50 (0%) 0/50 (0%) 0/50 (0%)2/50 (4%) 0/50 (0%) 2/50 (4%) 0/50 (0%) 0/50 (0%) 0/50 (0%)3/50 (6%) 3/49 (6%) 4/50 (8%) 0/50 (0%) 0/50 (0%) 0/50 (0%)0/50 (0%) 2/50 (4%) 1/50 (2%) 0/50 (0%) 1/50 (2%) 0/50 (0%)4/50 (8%) 2/50 (4%) 2/50 (4%) 0/50 (0%) 1/50 (2%) 0/50 (0%)2/50 (4%) 4/50 (8%) 0/50 (0%) 0/50 (0%) 0/50 (0%) 0/50 (0%)0/50 (0%) 0/50 (0%)
Overall Incidence Total 41/1249 (3.28%) Mean 3.28% SD 2.71% Total 2/1200 (0.17%) Mean 0.17% SD 0.56%
*: Denominator is number of animals with tissues examined microscopically#: Denominator is number of animals necropsied

Version: May2011 Toxicology Data Management System Page: 9
Contract/Lab: All Laboratories Tumor Incidence for Selected Control Animal Groups Report Date: 05/18/2011
Species: RATS Route: ALL ROUTES
Strain: F 344/N Vehicle: ALL VEHICLES
Length of Study: CHRONIC
Male Female
#All Organs:Mesothelioma: Malignant
1/50 (2%) 2/50 (4%) 2/50 (4%) 0/50 (0%) 0/50 (0%) 0/50 (0%)0/50 (0%) 1/50 (2%) 0/50 (0%) 0/50 (0%) 0/50 (0%)0/50 (0%) 0/50 (0%) 3/50 (6%) 0/50 (0%) 0/50 (0%) 0/50 (0%)2/50 (4%) 0/50 (0%) 2/50 (4%) 0/50 (0%) 0/50 (0%) 0/50 (0%)3/50 (6%) 3/49 (6%) 4/50 (8%) 0/50 (0%) 0/50 (0%) 0/50 (0%)0/50 (0%) 2/50 (4%) 1/50 (2%) 0/50 (0%) 1/50 (2%) 0/50 (0%)4/50 (8%) 2/50 (4%) 2/50 (4%) 0/50 (0%) 1/50 (2%) 0/50 (0%)2/50 (4%) 4/50 (8%) 0/50 (0%) 0/50 (0%) 0/50 (0%) 0/50 (0%)0/50 (0%) 0/50 (0%)
Overall Incidence Total 40/1249 (3.2%) Mean 3.2% SD 2.77% Total 2/1200 (0.17%) Mean 0.17% SD 0.56%
#All Organs:Osteoma
0/50 (0%) 0/50 (0%) 0/50 (0%) 0/50 (0%) 0/50 (0%) 0/50 (0%)0/50 (0%) 0/50 (0%) 0/50 (0%) 0/50 (0%) 0/50 (0%)0/50 (0%) 0/50 (0%) 0/50 (0%) 0/50 (0%) 0/50 (0%) 0/50 (0%)0/50 (0%) 0/50 (0%) 0/50 (0%) 0/50 (0%) 0/50 (0%) 0/50 (0%)0/50 (0%) 0/49 (0%) 0/50 (0%) 0/50 (0%) 0/50 (0%) 0/50 (0%)1/50 (2%) 0/50 (0%) 0/50 (0%) 0/50 (0%) 0/50 (0%) 0/50 (0%)0/50 (0%) 0/50 (0%) 0/50 (0%) 0/50 (0%) 0/50 (0%) 1/50 (2%)0/50 (0%) 0/50 (0%) 0/50 (0%) 0/50 (0%) 0/50 (0%) 0/50 (0%)0/50 (0%) 0/50 (0%)
Overall Incidence Total 1/1249 (0.08%) Mean 0.08% SD 0.4% Total 1/1200 (0.08%) Mean 0.08% SD 0.41%
#All Organs:Osteosarcoma
1/50 (2%) 1/50 (2%) 0/50 (0%) 0/50 (0%) 1/50 (2%) 0/50 (0%)2/50 (4%) 0/50 (0%) 0/50 (0%) 0/50 (0%) 0/50 (0%)0/50 (0%) 0/50 (0%) 0/50 (0%) 0/50 (0%) 0/50 (0%) 0/50 (0%)1/50 (2%) 2/50 (4%) 0/50 (0%) 0/50 (0%) 0/50 (0%) 1/50 (2%)2/50 (4%) 1/49 (2%) 1/50 (2%) 0/50 (0%) 0/50 (0%) 0/50 (0%)0/50 (0%) 1/50 (2%) 1/50 (2%) 0/50 (0%) 0/50 (0%) 0/50 (0%)0/50 (0%) 0/50 (0%) 0/50 (0%) 0/50 (0%) 0/50 (0%) 0/50 (0%)0/50 (0%) 0/50 (0%) 3/50 (6%) 0/50 (0%) 0/50 (0%) 0/50 (0%)2/50 (4%) 0/50 (0%)
Overall Incidence Total 18/1249 (1.44%) Mean 1.44% SD 1.78% Total 2/1200 (0.17%) Mean 0.17% SD 0.56%
*: Denominator is number of animals with tissues examined microscopically#: Denominator is number of animals necropsied

Version: May2011 Toxicology Data Management System Page: 10
Contract/Lab: All Laboratories Tumor Incidence for Selected Control Animal Groups Report Date: 05/18/2011
Species: RATS Route: ALL ROUTES
Strain: F 344/N Vehicle: ALL VEHICLES
Length of Study: CHRONIC
Male Female
#All Organs:Osteosarcoma or Osteoma
1/50 (2%) 1/50 (2%) 0/50 (0%) 0/50 (0%) 1/50 (2%) 0/50 (0%)2/50 (4%) 0/50 (0%) 0/50 (0%) 0/50 (0%) 0/50 (0%)0/50 (0%) 0/50 (0%) 0/50 (0%) 0/50 (0%) 0/50 (0%) 0/50 (0%)1/50 (2%) 2/50 (4%) 0/50 (0%) 0/50 (0%) 0/50 (0%) 1/50 (2%)2/50 (4%) 1/49 (2%) 1/50 (2%) 0/50 (0%) 0/50 (0%) 0/50 (0%)1/50 (2%) 1/50 (2%) 1/50 (2%) 0/50 (0%) 0/50 (0%) 0/50 (0%)0/50 (0%) 0/50 (0%) 0/50 (0%) 0/50 (0%) 0/50 (0%) 1/50 (2%)0/50 (0%) 0/50 (0%) 3/50 (6%) 0/50 (0%) 0/50 (0%) 0/50 (0%)2/50 (4%) 0/50 (0%)
Overall Incidence Total 19/1249 (1.52%) Mean 1.52% SD 1.76% Total 3/1200 (0.25%) Mean 0.25% SD 0.68%
*Adrenal Cortex:Adenoma
3/50 (6%) 1/50 (2%) 0/50 (0%) 0/50 (0%) 1/47 (2%) 0/50 (0%)1/50 (2%) 0/50 (0%) 0/50 (0%) 3/50 (6%) 2/50 (4%)3/50 (6%) 1/50 (2%) 0/50 (0%) 0/50 (0%) 4/50 (8%) 0/50 (0%)0/50 (0%) 0/50 (0%) 0/50 (0%) 0/50 (0%) 1/50 (2%) 1/50 (2%)0/50 (0%) 0/49 (0%) 0/50 (0%) 0/50 (0%) 0/50 (0%) 4/50 (8%)2/50 (4%) 1/50 (2%) 1/50 (2%) 0/48 (0%) 0/50 (0%) 3/50 (6%)1/50 (2%) 2/50 (4%) 0/50 (0%) 2/50 (4%) 0/50 (0%) 1/50 (2%)0/50 (0%) 0/50 (0%) 0/50 (0%) 1/50 (2%) 1/50 (2%) 8/50 (16%)1/50 (2%) 0/50 (0%)
Overall Incidence Total 17/1249 (1.36%) Mean 1.36% SD 1.89% Total 32/1195 (2.68%) Mean 2.67% SD 3.85%
*Adrenal Cortex:Carcinoma
0/50 (0%) 0/50 (0%) 0/50 (0%) 0/50 (0%) 0/47 (0%) 0/50 (0%)0/50 (0%) 0/50 (0%) 0/50 (0%) 0/50 (0%) 0/50 (0%)0/50 (0%) 0/50 (0%) 0/50 (0%) 0/50 (0%) 0/50 (0%) 0/50 (0%)0/50 (0%) 0/50 (0%) 0/50 (0%) 0/50 (0%) 0/50 (0%) 0/50 (0%)0/50 (0%) 1/49 (2%) 1/50 (2%) 0/50 (0%) 0/50 (0%) 0/50 (0%)0/50 (0%) 0/50 (0%) 0/50 (0%) 0/48 (0%) 0/50 (0%) 0/50 (0%)0/50 (0%) 0/50 (0%) 0/50 (0%) 0/50 (0%) 0/50 (0%) 0/50 (0%)0/50 (0%) 0/50 (0%) 0/50 (0%) 0/50 (0%) 0/50 (0%) 0/50 (0%)0/50 (0%) 0/50 (0%)
Overall Incidence Total 2/1249 (0.16%) Mean 0.16% SD 0.56% Total 0/1195 (0%) Mean 0% SD 0%
*: Denominator is number of animals with tissues examined microscopically#: Denominator is number of animals necropsied
Version: May2011 Toxicology Data Management System Page: 11
Contract/Lab: All Laboratories Tumor Incidence for Selected Control Animal Groups Report Date: 05/18/2011
Species: RATS Route: ALL ROUTES
Strain: F 344/N Vehicle: ALL VEHICLES
Length of Study: CHRONIC
Male Female
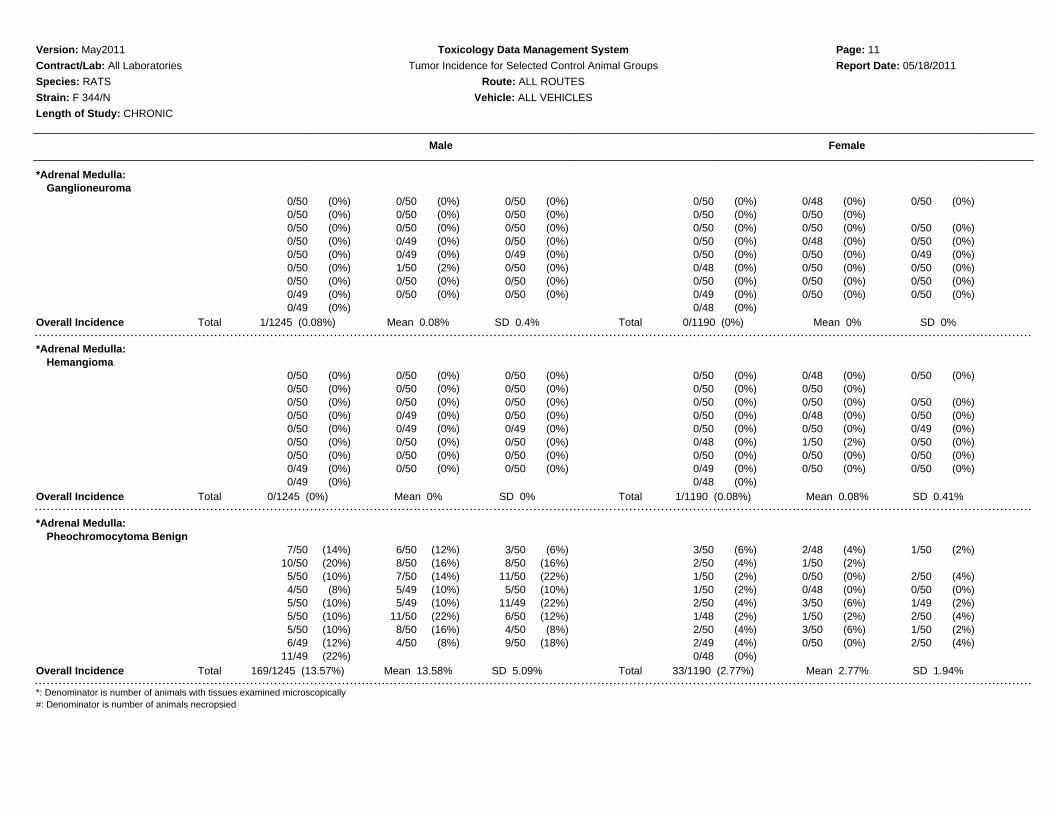
*Adrenal Medulla:Ganglioneuroma
0/50 (0%) 0/50 (0%) 0/50 (0%) 0/50 (0%) 0/48 (0%) 0/50 (0%)0/50 (0%) 0/50 (0%) 0/50 (0%) 0/50 (0%) 0/50 (0%)0/50 (0%) 0/50 (0%) 0/50 (0%) 0/50 (0%) 0/50 (0%) 0/50 (0%)0/50 (0%) 0/49 (0%) 0/50 (0%) 0/50 (0%) 0/48 (0%) 0/50 (0%)0/50 (0%) 0/49 (0%) 0/49 (0%) 0/50 (0%) 0/50 (0%) 0/49 (0%)0/50 (0%) 1/50 (2%) 0/50 (0%) 0/48 (0%) 0/50 (0%) 0/50 (0%)0/50 (0%) 0/50 (0%) 0/50 (0%) 0/50 (0%) 0/50 (0%) 0/50 (0%)0/49 (0%) 0/50 (0%) 0/50 (0%) 0/49 (0%) 0/50 (0%) 0/50 (0%)0/49 (0%) 0/48 (0%)
Overall Incidence Total 1/1245 (0.08%) Mean 0.08% SD 0.4% Total 0/1190 (0%) Mean 0% SD 0%
*Adrenal Medulla:Hemangioma
0/50 (0%) 0/50 (0%) 0/50 (0%) 0/50 (0%) 0/48 (0%) 0/50 (0%)0/50 (0%) 0/50 (0%) 0/50 (0%) 0/50 (0%) 0/50 (0%)0/50 (0%) 0/50 (0%) 0/50 (0%) 0/50 (0%) 0/50 (0%) 0/50 (0%)0/50 (0%) 0/49 (0%) 0/50 (0%) 0/50 (0%) 0/48 (0%) 0/50 (0%)0/50 (0%) 0/49 (0%) 0/49 (0%) 0/50 (0%) 0/50 (0%) 0/49 (0%)0/50 (0%) 0/50 (0%) 0/50 (0%) 0/48 (0%) 1/50 (2%) 0/50 (0%)0/50 (0%) 0/50 (0%) 0/50 (0%) 0/50 (0%) 0/50 (0%) 0/50 (0%)0/49 (0%) 0/50 (0%) 0/50 (0%) 0/49 (0%) 0/50 (0%) 0/50 (0%)0/49 (0%) 0/48 (0%)
Overall Incidence Total 0/1245 (0%) Mean 0% SD 0% Total 1/1190 (0.08%) Mean 0.08% SD 0.41%
*Adrenal Medulla:Pheochromocytoma Benign
7/50 (14%) 6/50 (12%) 3/50 (6%) 3/50 (6%) 2/48 (4%) 1/50 (2%)10/50 (20%) 8/50 (16%) 8/50 (16%) 2/50 (4%) 1/50 (2%)
5/50 (10%) 7/50 (14%) 11/50 (22%) 1/50 (2%) 0/50 (0%) 2/50 (4%)4/50 (8%) 5/49 (10%) 5/50 (10%) 1/50 (2%) 0/48 (0%) 0/50 (0%)5/50 (10%) 5/49 (10%) 11/49 (22%) 2/50 (4%) 3/50 (6%) 1/49 (2%)5/50 (10%) 11/50 (22%) 6/50 (12%) 1/48 (2%) 1/50 (2%) 2/50 (4%)5/50 (10%) 8/50 (16%) 4/50 (8%) 2/50 (4%) 3/50 (6%) 1/50 (2%)6/49 (12%) 4/50 (8%) 9/50 (18%) 2/49 (4%) 0/50 (0%) 2/50 (4%)
11/49 (22%) 0/48 (0%)Overall Incidence Total 169/1245 (13.57%) Mean 13.58% SD 5.09% Total 33/1190 (2.77%) Mean 2.77% SD 1.94%
*: Denominator is number of animals with tissues examined microscopically#: Denominator is number of animals necropsied
Version: May2011 Toxicology Data Management System Page: 12
Contract/Lab: All Laboratories Tumor Incidence for Selected Control Animal Groups Report Date: 05/18/2011
Species: RATS Route: ALL ROUTES
Strain: F 344/N Vehicle: ALL VEHICLES
Length of Study: CHRONIC
Male Female
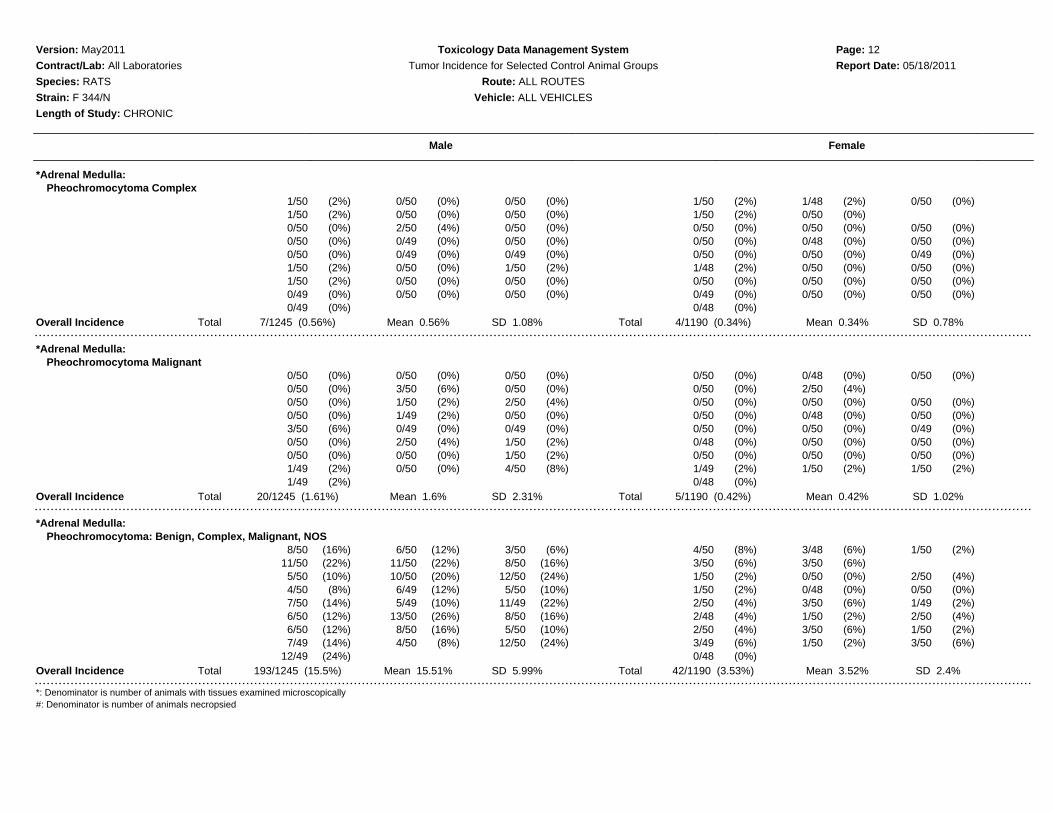
*Adrenal Medulla:Pheochromocytoma Complex
1/50 (2%) 0/50 (0%) 0/50 (0%) 1/50 (2%) 1/48 (2%) 0/50 (0%)1/50 (2%) 0/50 (0%) 0/50 (0%) 1/50 (2%) 0/50 (0%)0/50 (0%) 2/50 (4%) 0/50 (0%) 0/50 (0%) 0/50 (0%) 0/50 (0%)0/50 (0%) 0/49 (0%) 0/50 (0%) 0/50 (0%) 0/48 (0%) 0/50 (0%)0/50 (0%) 0/49 (0%) 0/49 (0%) 0/50 (0%) 0/50 (0%) 0/49 (0%)1/50 (2%) 0/50 (0%) 1/50 (2%) 1/48 (2%) 0/50 (0%) 0/50 (0%)1/50 (2%) 0/50 (0%) 0/50 (0%) 0/50 (0%) 0/50 (0%) 0/50 (0%)0/49 (0%) 0/50 (0%) 0/50 (0%) 0/49 (0%) 0/50 (0%) 0/50 (0%)0/49 (0%) 0/48 (0%)
Overall Incidence Total 7/1245 (0.56%) Mean 0.56% SD 1.08% Total 4/1190 (0.34%) Mean 0.34% SD 0.78%
*Adrenal Medulla:Pheochromocytoma Malignant
0/50 (0%) 0/50 (0%) 0/50 (0%) 0/50 (0%) 0/48 (0%) 0/50 (0%)0/50 (0%) 3/50 (6%) 0/50 (0%) 0/50 (0%) 2/50 (4%)0/50 (0%) 1/50 (2%) 2/50 (4%) 0/50 (0%) 0/50 (0%) 0/50 (0%)0/50 (0%) 1/49 (2%) 0/50 (0%) 0/50 (0%) 0/48 (0%) 0/50 (0%)3/50 (6%) 0/49 (0%) 0/49 (0%) 0/50 (0%) 0/50 (0%) 0/49 (0%)0/50 (0%) 2/50 (4%) 1/50 (2%) 0/48 (0%) 0/50 (0%) 0/50 (0%)0/50 (0%) 0/50 (0%) 1/50 (2%) 0/50 (0%) 0/50 (0%) 0/50 (0%)1/49 (2%) 0/50 (0%) 4/50 (8%) 1/49 (2%) 1/50 (2%) 1/50 (2%)1/49 (2%) 0/48 (0%)
Overall Incidence Total 20/1245 (1.61%) Mean 1.6% SD 2.31% Total 5/1190 (0.42%) Mean 0.42% SD 1.02%
*Adrenal Medulla:Pheochromocytoma: Benign, Complex, Malignant, NOS
8/50 (16%) 6/50 (12%) 3/50 (6%) 4/50 (8%) 3/48 (6%) 1/50 (2%)11/50 (22%) 11/50 (22%) 8/50 (16%) 3/50 (6%) 3/50 (6%)
5/50 (10%) 10/50 (20%) 12/50 (24%) 1/50 (2%) 0/50 (0%) 2/50 (4%)4/50 (8%) 6/49 (12%) 5/50 (10%) 1/50 (2%) 0/48 (0%) 0/50 (0%)7/50 (14%) 5/49 (10%) 11/49 (22%) 2/50 (4%) 3/50 (6%) 1/49 (2%)6/50 (12%) 13/50 (26%) 8/50 (16%) 2/48 (4%) 1/50 (2%) 2/50 (4%)6/50 (12%) 8/50 (16%) 5/50 (10%) 2/50 (4%) 3/50 (6%) 1/50 (2%)7/49 (14%) 4/50 (8%) 12/50 (24%) 3/49 (6%) 1/50 (2%) 3/50 (6%)
12/49 (24%) 0/48 (0%)Overall Incidence Total 193/1245 (15.5%) Mean 15.51% SD 5.99% Total 42/1190 (3.53%) Mean 3.52% SD 2.4%
*: Denominator is number of animals with tissues examined microscopically#: Denominator is number of animals necropsied

Version: May2011 Toxicology Data Management System Page: 13
Contract/Lab: All Laboratories Tumor Incidence for Selected Control Animal Groups Report Date: 05/18/2011
Species: RATS Route: ALL ROUTES
Strain: F 344/N Vehicle: ALL VEHICLES
Length of Study: CHRONIC
Male Female
#Bone:Chordoma
1/50 (2%) 0/50 (0%) 0/50 (0%) 0/50 (0%) 0/50 (0%) 0/50 (0%)1/50 (2%) 0/50 (0%) 1/50 (2%) 0/50 (0%) 0/50 (0%)0/50 (0%) 0/50 (0%) 0/50 (0%) 0/50 (0%) 0/50 (0%) 0/50 (0%)0/50 (0%) 1/50 (2%) 0/50 (0%) 0/50 (0%) 0/50 (0%) 0/50 (0%)0/50 (0%) 0/49 (0%) 0/50 (0%) 0/50 (0%) 0/50 (0%) 0/50 (0%)0/50 (0%) 1/50 (2%) 0/50 (0%) 0/50 (0%) 0/50 (0%) 0/50 (0%)0/50 (0%) 0/50 (0%) 0/50 (0%) 0/50 (0%) 0/50 (0%) 0/50 (0%)0/50 (0%) 0/50 (0%) 0/50 (0%) 0/50 (0%) 0/50 (0%) 0/50 (0%)0/50 (0%) 0/50 (0%)
Overall Incidence Total 5/1249 (0.4%) Mean 0.4% SD 0.82% Total 0/1200 (0%) Mean 0% SD 0%
#Bone:Osteoma
0/50 (0%) 0/50 (0%) 0/50 (0%) 0/50 (0%) 0/50 (0%) 0/50 (0%)0/50 (0%) 0/50 (0%) 0/50 (0%) 0/50 (0%) 0/50 (0%)0/50 (0%) 0/50 (0%) 0/50 (0%) 0/50 (0%) 0/50 (0%) 0/50 (0%)0/50 (0%) 0/50 (0%) 0/50 (0%) 0/50 (0%) 0/50 (0%) 0/50 (0%)0/50 (0%) 0/49 (0%) 0/50 (0%) 0/50 (0%) 0/50 (0%) 0/50 (0%)1/50 (2%) 0/50 (0%) 0/50 (0%) 0/50 (0%) 0/50 (0%) 0/50 (0%)0/50 (0%) 0/50 (0%) 0/50 (0%) 0/50 (0%) 0/50 (0%) 1/50 (2%)0/50 (0%) 0/50 (0%) 0/50 (0%) 0/50 (0%) 0/50 (0%) 0/50 (0%)0/50 (0%) 0/50 (0%)
Overall Incidence Total 1/1249 (0.08%) Mean 0.08% SD 0.4% Total 1/1200 (0.08%) Mean 0.08% SD 0.41%
#Bone:Osteosarcoma
1/50 (2%) 1/50 (2%) 0/50 (0%) 0/50 (0%) 1/50 (2%) 0/50 (0%)1/50 (2%) 0/50 (0%) 0/50 (0%) 0/50 (0%) 0/50 (0%)0/50 (0%) 0/50 (0%) 0/50 (0%) 0/50 (0%) 0/50 (0%) 0/50 (0%)1/50 (2%) 2/50 (4%) 0/50 (0%) 0/50 (0%) 0/50 (0%) 1/50 (2%)2/50 (4%) 1/49 (2%) 1/50 (2%) 0/50 (0%) 0/50 (0%) 0/50 (0%)0/50 (0%) 1/50 (2%) 1/50 (2%) 0/50 (0%) 0/50 (0%) 0/50 (0%)0/50 (0%) 0/50 (0%) 0/50 (0%) 0/50 (0%) 0/50 (0%) 0/50 (0%)0/50 (0%) 0/50 (0%) 3/50 (6%) 0/50 (0%) 0/50 (0%) 0/50 (0%)2/50 (4%) 0/50 (0%)
Overall Incidence Total 17/1249 (1.36%) Mean 1.36% SD 1.71% Total 2/1200 (0.17%) Mean 0.17% SD 0.56%
*: Denominator is number of animals with tissues examined microscopically#: Denominator is number of animals necropsied
Version: May2011 Toxicology Data Management System Page: 14
Contract/Lab: All Laboratories Tumor Incidence for Selected Control Animal Groups Report Date: 05/18/2011
Species: RATS Route: ALL ROUTES
Strain: F 344/N Vehicle: ALL VEHICLES
Length of Study: CHRONIC
Male Female
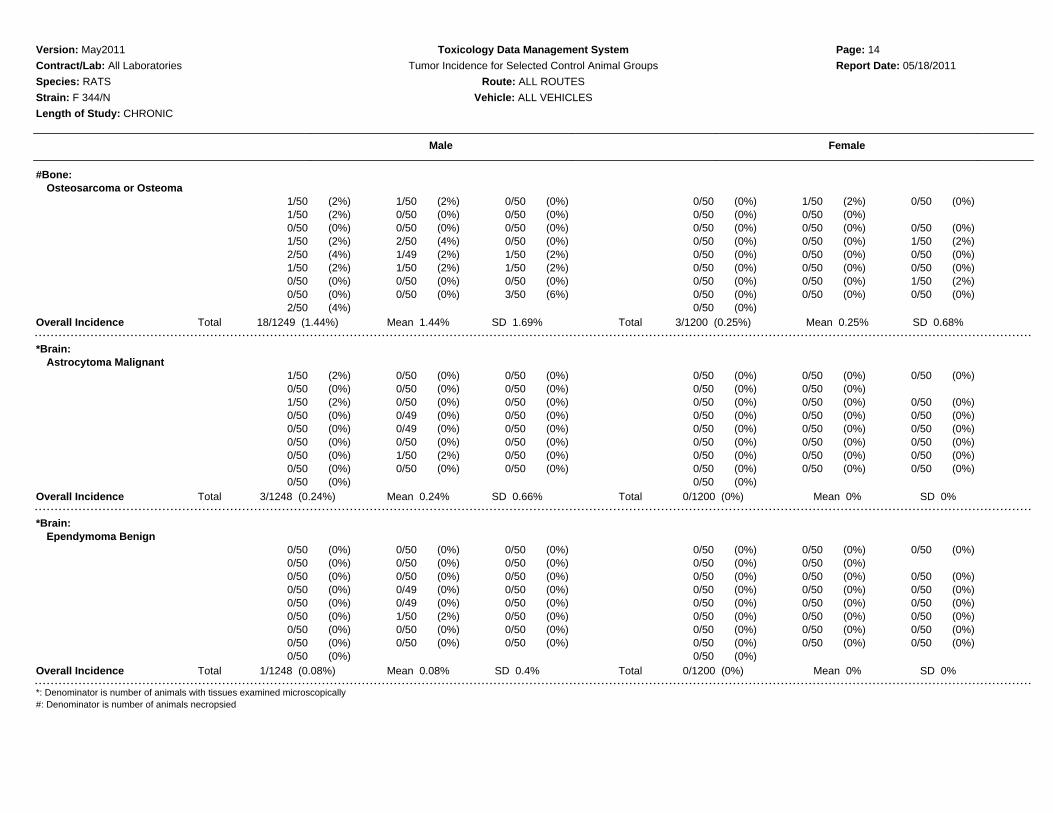
#Bone:Osteosarcoma or Osteoma
1/50 (2%) 1/50 (2%) 0/50 (0%) 0/50 (0%) 1/50 (2%) 0/50 (0%)1/50 (2%) 0/50 (0%) 0/50 (0%) 0/50 (0%) 0/50 (0%)0/50 (0%) 0/50 (0%) 0/50 (0%) 0/50 (0%) 0/50 (0%) 0/50 (0%)1/50 (2%) 2/50 (4%) 0/50 (0%) 0/50 (0%) 0/50 (0%) 1/50 (2%)2/50 (4%) 1/49 (2%) 1/50 (2%) 0/50 (0%) 0/50 (0%) 0/50 (0%)1/50 (2%) 1/50 (2%) 1/50 (2%) 0/50 (0%) 0/50 (0%) 0/50 (0%)0/50 (0%) 0/50 (0%) 0/50 (0%) 0/50 (0%) 0/50 (0%) 1/50 (2%)0/50 (0%) 0/50 (0%) 3/50 (6%) 0/50 (0%) 0/50 (0%) 0/50 (0%)2/50 (4%) 0/50 (0%)
Overall Incidence Total 18/1249 (1.44%) Mean 1.44% SD 1.69% Total 3/1200 (0.25%) Mean 0.25% SD 0.68%
*Brain:Astrocytoma Malignant
1/50 (2%) 0/50 (0%) 0/50 (0%) 0/50 (0%) 0/50 (0%) 0/50 (0%)0/50 (0%) 0/50 (0%) 0/50 (0%) 0/50 (0%) 0/50 (0%)1/50 (2%) 0/50 (0%) 0/50 (0%) 0/50 (0%) 0/50 (0%) 0/50 (0%)0/50 (0%) 0/49 (0%) 0/50 (0%) 0/50 (0%) 0/50 (0%) 0/50 (0%)0/50 (0%) 0/49 (0%) 0/50 (0%) 0/50 (0%) 0/50 (0%) 0/50 (0%)0/50 (0%) 0/50 (0%) 0/50 (0%) 0/50 (0%) 0/50 (0%) 0/50 (0%)0/50 (0%) 1/50 (2%) 0/50 (0%) 0/50 (0%) 0/50 (0%) 0/50 (0%)0/50 (0%) 0/50 (0%) 0/50 (0%) 0/50 (0%) 0/50 (0%) 0/50 (0%)0/50 (0%) 0/50 (0%)
Overall Incidence Total 3/1248 (0.24%) Mean 0.24% SD 0.66% Total 0/1200 (0%) Mean 0% SD 0%
*Brain:Ependymoma Benign
0/50 (0%) 0/50 (0%) 0/50 (0%) 0/50 (0%) 0/50 (0%) 0/50 (0%)0/50 (0%) 0/50 (0%) 0/50 (0%) 0/50 (0%) 0/50 (0%)0/50 (0%) 0/50 (0%) 0/50 (0%) 0/50 (0%) 0/50 (0%) 0/50 (0%)0/50 (0%) 0/49 (0%) 0/50 (0%) 0/50 (0%) 0/50 (0%) 0/50 (0%)0/50 (0%) 0/49 (0%) 0/50 (0%) 0/50 (0%) 0/50 (0%) 0/50 (0%)0/50 (0%) 1/50 (2%) 0/50 (0%) 0/50 (0%) 0/50 (0%) 0/50 (0%)0/50 (0%) 0/50 (0%) 0/50 (0%) 0/50 (0%) 0/50 (0%) 0/50 (0%)0/50 (0%) 0/50 (0%) 0/50 (0%) 0/50 (0%) 0/50 (0%) 0/50 (0%)0/50 (0%) 0/50 (0%)
Overall Incidence Total 1/1248 (0.08%) Mean 0.08% SD 0.4% Total 0/1200 (0%) Mean 0% SD 0%
*: Denominator is number of animals with tissues examined microscopically#: Denominator is number of animals necropsied
Version: May2011 Toxicology Data Management System Page: 15
Contract/Lab: All Laboratories Tumor Incidence for Selected Control Animal Groups Report Date: 05/18/2011
Species: RATS Route: ALL ROUTES
Strain: F 344/N Vehicle: ALL VEHICLES
Length of Study: CHRONIC
Male Female
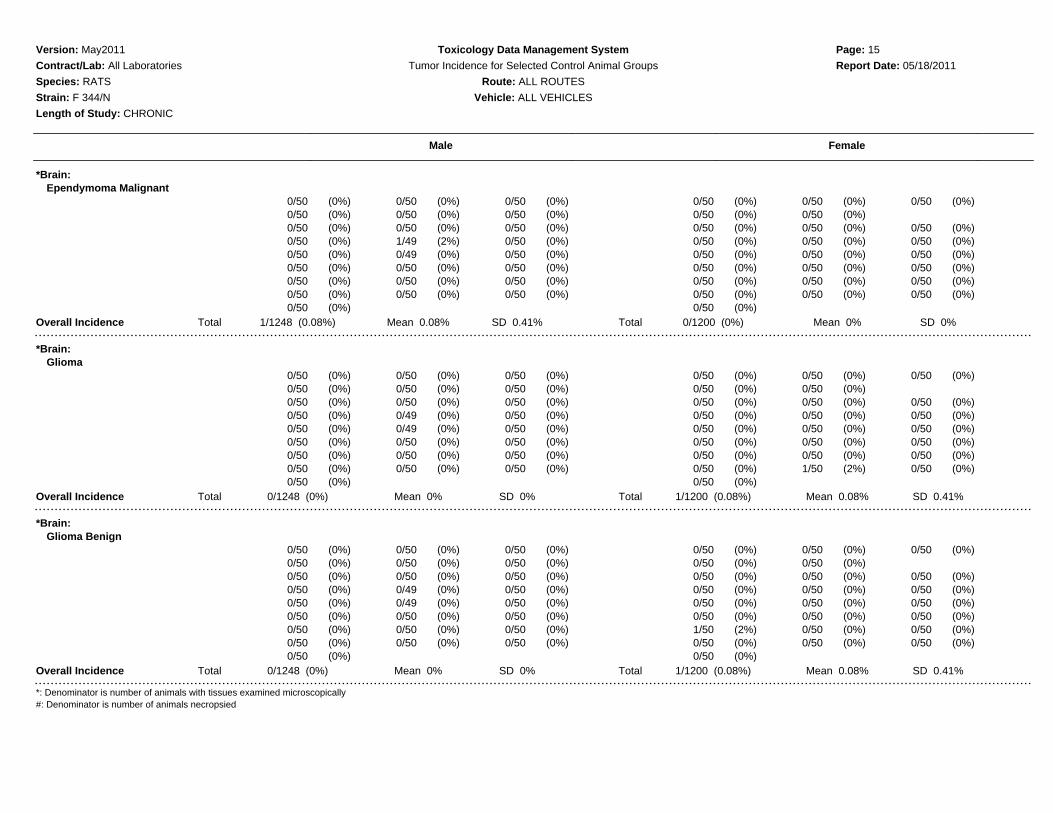
*Brain:Ependymoma Malignant
0/50 (0%) 0/50 (0%) 0/50 (0%) 0/50 (0%) 0/50 (0%) 0/50 (0%)0/50 (0%) 0/50 (0%) 0/50 (0%) 0/50 (0%) 0/50 (0%)0/50 (0%) 0/50 (0%) 0/50 (0%) 0/50 (0%) 0/50 (0%) 0/50 (0%)0/50 (0%) 1/49 (2%) 0/50 (0%) 0/50 (0%) 0/50 (0%) 0/50 (0%)0/50 (0%) 0/49 (0%) 0/50 (0%) 0/50 (0%) 0/50 (0%) 0/50 (0%)0/50 (0%) 0/50 (0%) 0/50 (0%) 0/50 (0%) 0/50 (0%) 0/50 (0%)0/50 (0%) 0/50 (0%) 0/50 (0%) 0/50 (0%) 0/50 (0%) 0/50 (0%)0/50 (0%) 0/50 (0%) 0/50 (0%) 0/50 (0%) 0/50 (0%) 0/50 (0%)0/50 (0%) 0/50 (0%)
Overall Incidence Total 1/1248 (0.08%) Mean 0.08% SD 0.41% Total 0/1200 (0%) Mean 0% SD 0%
*Brain:Glioma
0/50 (0%) 0/50 (0%) 0/50 (0%) 0/50 (0%) 0/50 (0%) 0/50 (0%)0/50 (0%) 0/50 (0%) 0/50 (0%) 0/50 (0%) 0/50 (0%)0/50 (0%) 0/50 (0%) 0/50 (0%) 0/50 (0%) 0/50 (0%) 0/50 (0%)0/50 (0%) 0/49 (0%) 0/50 (0%) 0/50 (0%) 0/50 (0%) 0/50 (0%)0/50 (0%) 0/49 (0%) 0/50 (0%) 0/50 (0%) 0/50 (0%) 0/50 (0%)0/50 (0%) 0/50 (0%) 0/50 (0%) 0/50 (0%) 0/50 (0%) 0/50 (0%)0/50 (0%) 0/50 (0%) 0/50 (0%) 0/50 (0%) 0/50 (0%) 0/50 (0%)0/50 (0%) 0/50 (0%) 0/50 (0%) 0/50 (0%) 1/50 (2%) 0/50 (0%)0/50 (0%) 0/50 (0%)
Overall Incidence Total 0/1248 (0%) Mean 0% SD 0% Total 1/1200 (0.08%) Mean 0.08% SD 0.41%
*Brain:Glioma Benign
0/50 (0%) 0/50 (0%) 0/50 (0%) 0/50 (0%) 0/50 (0%) 0/50 (0%)0/50 (0%) 0/50 (0%) 0/50 (0%) 0/50 (0%) 0/50 (0%)0/50 (0%) 0/50 (0%) 0/50 (0%) 0/50 (0%) 0/50 (0%) 0/50 (0%)0/50 (0%) 0/49 (0%) 0/50 (0%) 0/50 (0%) 0/50 (0%) 0/50 (0%)0/50 (0%) 0/49 (0%) 0/50 (0%) 0/50 (0%) 0/50 (0%) 0/50 (0%)0/50 (0%) 0/50 (0%) 0/50 (0%) 0/50 (0%) 0/50 (0%) 0/50 (0%)0/50 (0%) 0/50 (0%) 0/50 (0%) 1/50 (2%) 0/50 (0%) 0/50 (0%)0/50 (0%) 0/50 (0%) 0/50 (0%) 0/50 (0%) 0/50 (0%) 0/50 (0%)0/50 (0%) 0/50 (0%)
Overall Incidence Total 0/1248 (0%) Mean 0% SD 0% Total 1/1200 (0.08%) Mean 0.08% SD 0.41%
*: Denominator is number of animals with tissues examined microscopically#: Denominator is number of animals necropsied

Version: May2011 Toxicology Data Management System Page: 16
Contract/Lab: All Laboratories Tumor Incidence for Selected Control Animal Groups Report Date: 05/18/2011
Species: RATS Route: ALL ROUTES
Strain: F 344/N Vehicle: ALL VEHICLES
Length of Study: CHRONIC
Male Female
*Brain:Glioma Malignant
0/50 (0%) 0/50 (0%) 0/50 (0%) 0/50 (0%) 1/50 (2%) 0/50 (0%)0/50 (0%) 0/50 (0%) 0/50 (0%) 1/50 (2%) 0/50 (0%)0/50 (0%) 0/50 (0%) 0/50 (0%) 0/50 (0%) 0/50 (0%) 0/50 (0%)0/50 (0%) 0/49 (0%) 0/50 (0%) 0/50 (0%) 0/50 (0%) 0/50 (0%)0/50 (0%) 0/49 (0%) 0/50 (0%) 0/50 (0%) 0/50 (0%) 0/50 (0%)0/50 (0%) 0/50 (0%) 0/50 (0%) 0/50 (0%) 0/50 (0%) 0/50 (0%)0/50 (0%) 0/50 (0%) 0/50 (0%) 0/50 (0%) 0/50 (0%) 0/50 (0%)0/50 (0%) 0/50 (0%) 0/50 (0%) 0/50 (0%) 0/50 (0%) 0/50 (0%)0/50 (0%) 0/50 (0%)
Overall Incidence Total 0/1248 (0%) Mean 0% SD 0% Total 2/1200 (0.17%) Mean 0.17% SD 0.56%
*Brain:Granular Cell Tumor Benign
0/50 (0%) 0/50 (0%) 0/50 (0%) 0/50 (0%) 0/50 (0%) 0/50 (0%)0/50 (0%) 2/50 (4%) 0/50 (0%) 0/50 (0%) 0/50 (0%)0/50 (0%) 0/50 (0%) 0/50 (0%) 0/50 (0%) 0/50 (0%) 0/50 (0%)0/50 (0%) 0/49 (0%) 0/50 (0%) 0/50 (0%) 0/50 (0%) 0/50 (0%)0/50 (0%) 0/49 (0%) 0/50 (0%) 0/50 (0%) 0/50 (0%) 0/50 (0%)0/50 (0%) 0/50 (0%) 0/50 (0%) 0/50 (0%) 0/50 (0%) 0/50 (0%)0/50 (0%) 0/50 (0%) 0/50 (0%) 0/50 (0%) 0/50 (0%) 0/50 (0%)0/50 (0%) 0/50 (0%) 0/50 (0%) 0/50 (0%) 0/50 (0%) 0/50 (0%)0/50 (0%) 0/50 (0%)
Overall Incidence Total 2/1248 (0.16%) Mean 0.16% SD 0.8% Total 0/1200 (0%) Mean 0% SD 0%
*Brain:Oligodendroglioma Benign
0/50 (0%) 0/50 (0%) 0/50 (0%) 0/50 (0%) 0/50 (0%) 0/50 (0%)0/50 (0%) 0/50 (0%) 0/50 (0%) 0/50 (0%) 0/50 (0%)0/50 (0%) 0/50 (0%) 0/50 (0%) 0/50 (0%) 0/50 (0%) 0/50 (0%)0/50 (0%) 0/49 (0%) 0/50 (0%) 0/50 (0%) 0/50 (0%) 0/50 (0%)0/50 (0%) 0/49 (0%) 0/50 (0%) 0/50 (0%) 0/50 (0%) 0/50 (0%)0/50 (0%) 1/50 (2%) 0/50 (0%) 0/50 (0%) 0/50 (0%) 0/50 (0%)0/50 (0%) 0/50 (0%) 0/50 (0%) 0/50 (0%) 0/50 (0%) 0/50 (0%)0/50 (0%) 0/50 (0%) 0/50 (0%) 0/50 (0%) 0/50 (0%) 0/50 (0%)0/50 (0%) 0/50 (0%)
Overall Incidence Total 1/1248 (0.08%) Mean 0.08% SD 0.4% Total 0/1200 (0%) Mean 0% SD 0%
*: Denominator is number of animals with tissues examined microscopically#: Denominator is number of animals necropsied
Version: May2011 Toxicology Data Management System Page: 17
Contract/Lab: All Laboratories Tumor Incidence for Selected Control Animal Groups Report Date: 05/18/2011
Species: RATS Route: ALL ROUTES
Strain: F 344/N Vehicle: ALL VEHICLES
Length of Study: CHRONIC
Male Female
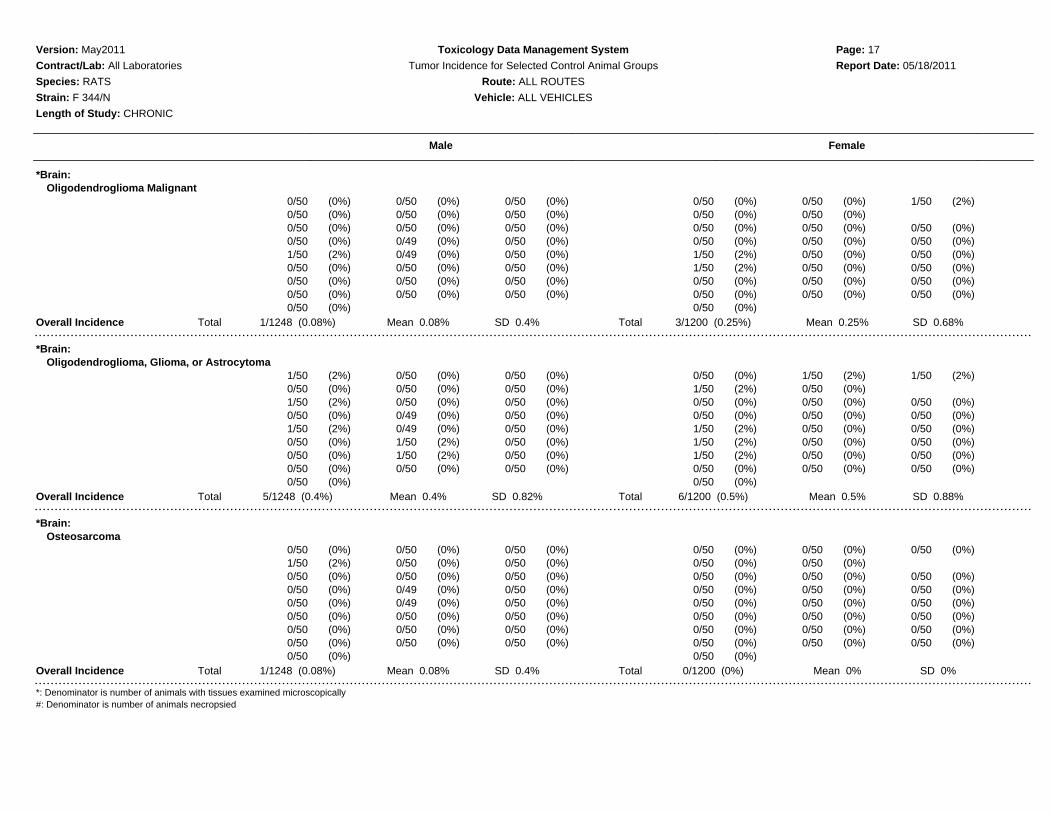
*Brain:Oligodendroglioma Malignant
0/50 (0%) 0/50 (0%) 0/50 (0%) 0/50 (0%) 0/50 (0%) 1/50 (2%)0/50 (0%) 0/50 (0%) 0/50 (0%) 0/50 (0%) 0/50 (0%)0/50 (0%) 0/50 (0%) 0/50 (0%) 0/50 (0%) 0/50 (0%) 0/50 (0%)0/50 (0%) 0/49 (0%) 0/50 (0%) 0/50 (0%) 0/50 (0%) 0/50 (0%)1/50 (2%) 0/49 (0%) 0/50 (0%) 1/50 (2%) 0/50 (0%) 0/50 (0%)0/50 (0%) 0/50 (0%) 0/50 (0%) 1/50 (2%) 0/50 (0%) 0/50 (0%)0/50 (0%) 0/50 (0%) 0/50 (0%) 0/50 (0%) 0/50 (0%) 0/50 (0%)0/50 (0%) 0/50 (0%) 0/50 (0%) 0/50 (0%) 0/50 (0%) 0/50 (0%)0/50 (0%) 0/50 (0%)
Overall Incidence Total 1/1248 (0.08%) Mean 0.08% SD 0.4% Total 3/1200 (0.25%) Mean 0.25% SD 0.68%
*Brain:Oligodendroglioma, Glioma, or Astrocytoma
1/50 (2%) 0/50 (0%) 0/50 (0%) 0/50 (0%) 1/50 (2%) 1/50 (2%)0/50 (0%) 0/50 (0%) 0/50 (0%) 1/50 (2%) 0/50 (0%)1/50 (2%) 0/50 (0%) 0/50 (0%) 0/50 (0%) 0/50 (0%) 0/50 (0%)0/50 (0%) 0/49 (0%) 0/50 (0%) 0/50 (0%) 0/50 (0%) 0/50 (0%)1/50 (2%) 0/49 (0%) 0/50 (0%) 1/50 (2%) 0/50 (0%) 0/50 (0%)0/50 (0%) 1/50 (2%) 0/50 (0%) 1/50 (2%) 0/50 (0%) 0/50 (0%)0/50 (0%) 1/50 (2%) 0/50 (0%) 1/50 (2%) 0/50 (0%) 0/50 (0%)0/50 (0%) 0/50 (0%) 0/50 (0%) 0/50 (0%) 0/50 (0%) 0/50 (0%)0/50 (0%) 0/50 (0%)
Overall Incidence Total 5/1248 (0.4%) Mean 0.4% SD 0.82% Total 6/1200 (0.5%) Mean 0.5% SD 0.88%
*Brain:Osteosarcoma
0/50 (0%) 0/50 (0%) 0/50 (0%) 0/50 (0%) 0/50 (0%) 0/50 (0%)1/50 (2%) 0/50 (0%) 0/50 (0%) 0/50 (0%) 0/50 (0%)0/50 (0%) 0/50 (0%) 0/50 (0%) 0/50 (0%) 0/50 (0%) 0/50 (0%)0/50 (0%) 0/49 (0%) 0/50 (0%) 0/50 (0%) 0/50 (0%) 0/50 (0%)0/50 (0%) 0/49 (0%) 0/50 (0%) 0/50 (0%) 0/50 (0%) 0/50 (0%)0/50 (0%) 0/50 (0%) 0/50 (0%) 0/50 (0%) 0/50 (0%) 0/50 (0%)0/50 (0%) 0/50 (0%) 0/50 (0%) 0/50 (0%) 0/50 (0%) 0/50 (0%)0/50 (0%) 0/50 (0%) 0/50 (0%) 0/50 (0%) 0/50 (0%) 0/50 (0%)0/50 (0%) 0/50 (0%)
Overall Incidence Total 1/1248 (0.08%) Mean 0.08% SD 0.4% Total 0/1200 (0%) Mean 0% SD 0%
*: Denominator is number of animals with tissues examined microscopically#: Denominator is number of animals necropsied

Version: May2011 Toxicology Data Management System Page: 18
Contract/Lab: All Laboratories Tumor Incidence for Selected Control Animal Groups Report Date: 05/18/2011
Species: RATS Route: ALL ROUTES
Strain: F 344/N Vehicle: ALL VEHICLES
Length of Study: CHRONIC
Male Female
*Brain:Schwannoma Malignant
0/50 (0%) 0/50 (0%) 1/50 (2%) 0/50 (0%) 0/50 (0%) 0/50 (0%)0/50 (0%) 0/50 (0%) 0/50 (0%) 0/50 (0%) 0/50 (0%)0/50 (0%) 0/50 (0%) 0/50 (0%) 0/50 (0%) 0/50 (0%) 0/50 (0%)0/50 (0%) 0/49 (0%) 0/50 (0%) 0/50 (0%) 0/50 (0%) 0/50 (0%)0/50 (0%) 0/49 (0%) 0/50 (0%) 0/50 (0%) 0/50 (0%) 0/50 (0%)0/50 (0%) 0/50 (0%) 0/50 (0%) 0/50 (0%) 0/50 (0%) 0/50 (0%)0/50 (0%) 0/50 (0%) 0/50 (0%) 0/50 (0%) 0/50 (0%) 0/50 (0%)0/50 (0%) 0/50 (0%) 0/50 (0%) 0/50 (0%) 0/50 (0%) 0/50 (0%)0/50 (0%) 0/50 (0%)
Overall Incidence Total 1/1248 (0.08%) Mean 0.08% SD 0.4% Total 0/1200 (0%) Mean 0% SD 0%
*Clitoral/Preputial Gland:Adenoma
3/50 (6%) 2/49 (4%) 2/50 (4%) 12/50 (24%) 12/50 (24%) 2/50 (4%)4/50 (8%) 1/50 (2%) 5/50 (10%) 3/49 (6%) 10/50 (20%)2/50 (4%) 0/50 (0%) 4/50 (8%) 6/50 (12%) 1/50 (2%) 5/50 (10%)0/50 (0%) 0/50 (0%) 5/50 (10%) 1/50 (2%) 5/50 (10%) 3/50 (6%)2/50 (4%) 0/49 (0%) 1/50 (2%) 3/48 (6%) 2/50 (4%) 6/50 (12%)1/50 (2%) 5/50 (10%) 0/50 (0%) 11/50 (22%) 7/50 (14%) 5/50 (10%)0/50 (0%) 3/50 (6%) 0/50 (0%) 7/50 (14%) 3/50 (6%) 3/50 (6%)4/50 (8%) 1/50 (2%) 0/50 (0%) 2/50 (4%) 3/50 (6%) 0/50 (0%)3/50 (6%) 4/50 (8%)
Overall Incidence Total 48/1248 (3.85%) Mean 3.84% SD 3.6% Total 116/1197 (9.69%) Mean 9.68% SD 6.94%
*Clitoral/Preputial Gland:Carcinoma
0/50 (0%) 1/49 (2%) 0/50 (0%) 1/50 (2%) 2/50 (4%) 0/50 (0%)2/50 (4%) 0/50 (0%) 0/50 (0%) 1/49 (2%) 0/50 (0%)0/50 (0%) 1/50 (2%) 0/50 (0%) 0/50 (0%) 0/50 (0%) 0/50 (0%)0/50 (0%) 2/50 (4%) 1/50 (2%) 1/50 (2%) 4/50 (8%) 0/50 (0%)2/50 (4%) 1/49 (2%) 3/50 (6%) 2/48 (4%) 2/50 (4%) 3/50 (6%)2/50 (4%) 0/50 (0%) 0/50 (0%) 3/50 (6%) 0/50 (0%) 0/50 (0%)2/50 (4%) 1/50 (2%) 0/50 (0%) 0/50 (0%) 0/50 (0%) 1/50 (2%)1/50 (2%) 1/50 (2%) 0/50 (0%) 8/50 (16%) 0/50 (0%) 4/50 (8%)0/50 (0%) 7/50 (14%)
Overall Incidence Total 20/1248 (1.6%) Mean 1.6% SD 1.83% Total 39/1197 (3.26%) Mean 3.26% SD 4.49%
*: Denominator is number of animals with tissues examined microscopically#: Denominator is number of animals necropsied
Version: May2011 Toxicology Data Management System Page: 19
Contract/Lab: All Laboratories Tumor Incidence for Selected Control Animal Groups Report Date: 05/18/2011
Species: RATS Route: ALL ROUTES
Strain: F 344/N Vehicle: ALL VEHICLES
Length of Study: CHRONIC
Male Female
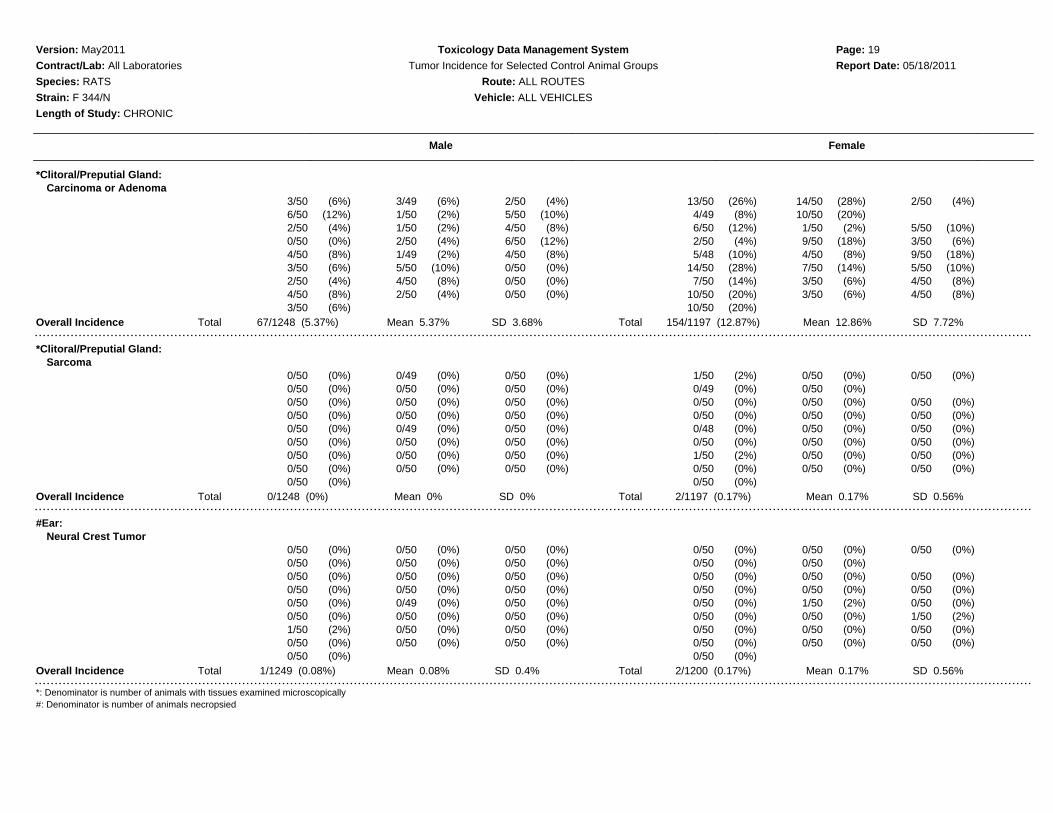
*Clitoral/Preputial Gland:Carcinoma or Adenoma
3/50 (6%) 3/49 (6%) 2/50 (4%) 13/50 (26%) 14/50 (28%) 2/50 (4%)6/50 (12%) 1/50 (2%) 5/50 (10%) 4/49 (8%) 10/50 (20%)2/50 (4%) 1/50 (2%) 4/50 (8%) 6/50 (12%) 1/50 (2%) 5/50 (10%)0/50 (0%) 2/50 (4%) 6/50 (12%) 2/50 (4%) 9/50 (18%) 3/50 (6%)4/50 (8%) 1/49 (2%) 4/50 (8%) 5/48 (10%) 4/50 (8%) 9/50 (18%)3/50 (6%) 5/50 (10%) 0/50 (0%) 14/50 (28%) 7/50 (14%) 5/50 (10%)2/50 (4%) 4/50 (8%) 0/50 (0%) 7/50 (14%) 3/50 (6%) 4/50 (8%)4/50 (8%) 2/50 (4%) 0/50 (0%) 10/50 (20%) 3/50 (6%) 4/50 (8%)3/50 (6%) 10/50 (20%)
Overall Incidence Total 67/1248 (5.37%) Mean 5.37% SD 3.68% Total 154/1197 (12.87%) Mean 12.86% SD 7.72%
*Clitoral/Preputial Gland:Sarcoma
0/50 (0%) 0/49 (0%) 0/50 (0%) 1/50 (2%) 0/50 (0%) 0/50 (0%)0/50 (0%) 0/50 (0%) 0/50 (0%) 0/49 (0%) 0/50 (0%)0/50 (0%) 0/50 (0%) 0/50 (0%) 0/50 (0%) 0/50 (0%) 0/50 (0%)0/50 (0%) 0/50 (0%) 0/50 (0%) 0/50 (0%) 0/50 (0%) 0/50 (0%)0/50 (0%) 0/49 (0%) 0/50 (0%) 0/48 (0%) 0/50 (0%) 0/50 (0%)0/50 (0%) 0/50 (0%) 0/50 (0%) 0/50 (0%) 0/50 (0%) 0/50 (0%)0/50 (0%) 0/50 (0%) 0/50 (0%) 1/50 (2%) 0/50 (0%) 0/50 (0%)0/50 (0%) 0/50 (0%) 0/50 (0%) 0/50 (0%) 0/50 (0%) 0/50 (0%)0/50 (0%) 0/50 (0%)
Overall Incidence Total 0/1248 (0%) Mean 0% SD 0% Total 2/1197 (0.17%) Mean 0.17% SD 0.56%
#Ear:Neural Crest Tumor
0/50 (0%) 0/50 (0%) 0/50 (0%) 0/50 (0%) 0/50 (0%) 0/50 (0%)0/50 (0%) 0/50 (0%) 0/50 (0%) 0/50 (0%) 0/50 (0%)0/50 (0%) 0/50 (0%) 0/50 (0%) 0/50 (0%) 0/50 (0%) 0/50 (0%)0/50 (0%) 0/50 (0%) 0/50 (0%) 0/50 (0%) 0/50 (0%) 0/50 (0%)0/50 (0%) 0/49 (0%) 0/50 (0%) 0/50 (0%) 1/50 (2%) 0/50 (0%)0/50 (0%) 0/50 (0%) 0/50 (0%) 0/50 (0%) 0/50 (0%) 1/50 (2%)1/50 (2%) 0/50 (0%) 0/50 (0%) 0/50 (0%) 0/50 (0%) 0/50 (0%)0/50 (0%) 0/50 (0%) 0/50 (0%) 0/50 (0%) 0/50 (0%) 0/50 (0%)0/50 (0%) 0/50 (0%)
Overall Incidence Total 1/1249 (0.08%) Mean 0.08% SD 0.4% Total 2/1200 (0.17%) Mean 0.17% SD 0.56%
*: Denominator is number of animals with tissues examined microscopically#: Denominator is number of animals necropsied
Version: May2011 Toxicology Data Management System Page: 20
Contract/Lab: All Laboratories Tumor Incidence for Selected Control Animal Groups Report Date: 05/18/2011
Species: RATS Route: ALL ROUTES
Strain: F 344/N Vehicle: ALL VEHICLES
Length of Study: CHRONIC
Male Female
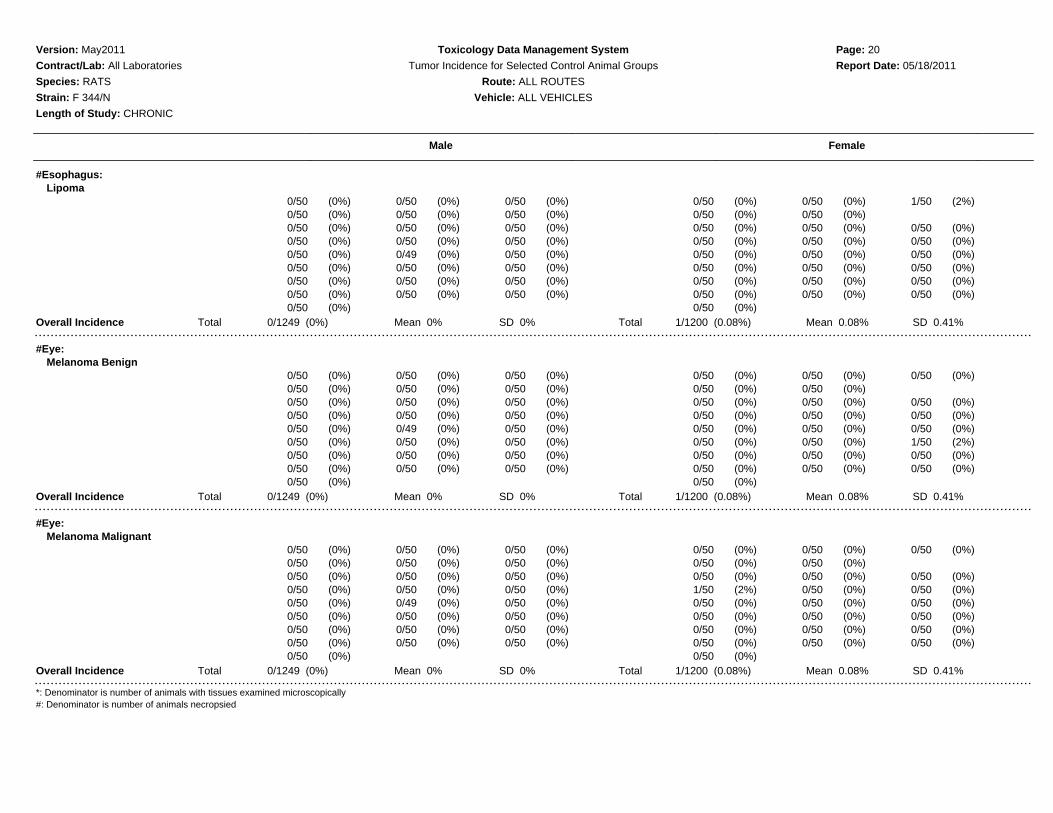
#Esophagus:Lipoma
0/50 (0%) 0/50 (0%) 0/50 (0%) 0/50 (0%) 0/50 (0%) 1/50 (2%)0/50 (0%) 0/50 (0%) 0/50 (0%) 0/50 (0%) 0/50 (0%)0/50 (0%) 0/50 (0%) 0/50 (0%) 0/50 (0%) 0/50 (0%) 0/50 (0%)0/50 (0%) 0/50 (0%) 0/50 (0%) 0/50 (0%) 0/50 (0%) 0/50 (0%)0/50 (0%) 0/49 (0%) 0/50 (0%) 0/50 (0%) 0/50 (0%) 0/50 (0%)0/50 (0%) 0/50 (0%) 0/50 (0%) 0/50 (0%) 0/50 (0%) 0/50 (0%)0/50 (0%) 0/50 (0%) 0/50 (0%) 0/50 (0%) 0/50 (0%) 0/50 (0%)0/50 (0%) 0/50 (0%) 0/50 (0%) 0/50 (0%) 0/50 (0%) 0/50 (0%)0/50 (0%) 0/50 (0%)
Overall Incidence Total 0/1249 (0%) Mean 0% SD 0% Total 1/1200 (0.08%) Mean 0.08% SD 0.41%
#Eye:Melanoma Benign
0/50 (0%) 0/50 (0%) 0/50 (0%) 0/50 (0%) 0/50 (0%) 0/50 (0%)0/50 (0%) 0/50 (0%) 0/50 (0%) 0/50 (0%) 0/50 (0%)0/50 (0%) 0/50 (0%) 0/50 (0%) 0/50 (0%) 0/50 (0%) 0/50 (0%)0/50 (0%) 0/50 (0%) 0/50 (0%) 0/50 (0%) 0/50 (0%) 0/50 (0%)0/50 (0%) 0/49 (0%) 0/50 (0%) 0/50 (0%) 0/50 (0%) 0/50 (0%)0/50 (0%) 0/50 (0%) 0/50 (0%) 0/50 (0%) 0/50 (0%) 1/50 (2%)0/50 (0%) 0/50 (0%) 0/50 (0%) 0/50 (0%) 0/50 (0%) 0/50 (0%)0/50 (0%) 0/50 (0%) 0/50 (0%) 0/50 (0%) 0/50 (0%) 0/50 (0%)0/50 (0%) 0/50 (0%)
Overall Incidence Total 0/1249 (0%) Mean 0% SD 0% Total 1/1200 (0.08%) Mean 0.08% SD 0.41%
#Eye:Melanoma Malignant
0/50 (0%) 0/50 (0%) 0/50 (0%) 0/50 (0%) 0/50 (0%) 0/50 (0%)0/50 (0%) 0/50 (0%) 0/50 (0%) 0/50 (0%) 0/50 (0%)0/50 (0%) 0/50 (0%) 0/50 (0%) 0/50 (0%) 0/50 (0%) 0/50 (0%)0/50 (0%) 0/50 (0%) 0/50 (0%) 1/50 (2%) 0/50 (0%) 0/50 (0%)0/50 (0%) 0/49 (0%) 0/50 (0%) 0/50 (0%) 0/50 (0%) 0/50 (0%)0/50 (0%) 0/50 (0%) 0/50 (0%) 0/50 (0%) 0/50 (0%) 0/50 (0%)0/50 (0%) 0/50 (0%) 0/50 (0%) 0/50 (0%) 0/50 (0%) 0/50 (0%)0/50 (0%) 0/50 (0%) 0/50 (0%) 0/50 (0%) 0/50 (0%) 0/50 (0%)0/50 (0%) 0/50 (0%)
Overall Incidence Total 0/1249 (0%) Mean 0% SD 0% Total 1/1200 (0.08%) Mean 0.08% SD 0.41%
*: Denominator is number of animals with tissues examined microscopically#: Denominator is number of animals necropsied

Version: May2011 Toxicology Data Management System Page: 21
Contract/Lab: All Laboratories Tumor Incidence for Selected Control Animal Groups Report Date: 05/18/2011
Species: RATS Route: ALL ROUTES
Strain: F 344/N Vehicle: ALL VEHICLES
Length of Study: CHRONIC
Male Female
#Eye:Schwannoma Malignant
0/50 (0%) 0/50 (0%) 0/50 (0%) 0/50 (0%) 0/50 (0%) 0/50 (0%)0/50 (0%) 0/50 (0%) 1/50 (2%) 0/50 (0%) 0/50 (0%)0/50 (0%) 0/50 (0%) 0/50 (0%) 0/50 (0%) 0/50 (0%) 0/50 (0%)0/50 (0%) 0/50 (0%) 0/50 (0%) 0/50 (0%) 0/50 (0%) 0/50 (0%)0/50 (0%) 0/49 (0%) 0/50 (0%) 0/50 (0%) 0/50 (0%) 0/50 (0%)0/50 (0%) 0/50 (0%) 0/50 (0%) 0/50 (0%) 0/50 (0%) 0/50 (0%)0/50 (0%) 0/50 (0%) 0/50 (0%) 0/50 (0%) 0/50 (0%) 0/50 (0%)0/50 (0%) 0/50 (0%) 0/50 (0%) 0/50 (0%) 0/50 (0%) 0/50 (0%)0/50 (0%) 0/50 (0%)
Overall Incidence Total 1/1249 (0.08%) Mean 0.08% SD 0.4% Total 0/1200 (0%) Mean 0% SD 0%
#Harderian Gland:Adenoma
0/50 (0%) 0/50 (0%) 0/50 (0%) 0/50 (0%) 0/50 (0%) 0/50 (0%)0/50 (0%) 0/50 (0%) 0/50 (0%) 0/50 (0%) 0/50 (0%)0/50 (0%) 0/50 (0%) 0/50 (0%) 0/50 (0%) 0/50 (0%) 0/50 (0%)0/50 (0%) 0/50 (0%) 0/50 (0%) 0/50 (0%) 0/50 (0%) 0/50 (0%)0/50 (0%) 0/49 (0%) 0/50 (0%) 0/50 (0%) 0/50 (0%) 2/50 (4%)0/50 (0%) 0/50 (0%) 0/50 (0%) 0/50 (0%) 0/50 (0%) 0/50 (0%)0/50 (0%) 0/50 (0%) 0/50 (0%) 0/50 (0%) 0/50 (0%) 0/50 (0%)0/50 (0%) 0/50 (0%) 0/50 (0%) 0/50 (0%) 0/50 (0%) 0/50 (0%)0/50 (0%) 0/50 (0%)
Overall Incidence Total 0/1249 (0%) Mean 0% SD 0% Total 2/1200 (0.17%) Mean 0.17% SD 0.82%
#Harderian Gland:Carcinoma
0/50 (0%) 0/50 (0%) 0/50 (0%) 0/50 (0%) 0/50 (0%) 0/50 (0%)0/50 (0%) 0/50 (0%) 0/50 (0%) 0/50 (0%) 0/50 (0%)0/50 (0%) 0/50 (0%) 0/50 (0%) 0/50 (0%) 0/50 (0%) 0/50 (0%)1/50 (2%) 0/50 (0%) 0/50 (0%) 0/50 (0%) 0/50 (0%) 0/50 (0%)0/50 (0%) 0/49 (0%) 0/50 (0%) 0/50 (0%) 0/50 (0%) 0/50 (0%)0/50 (0%) 0/50 (0%) 0/50 (0%) 0/50 (0%) 0/50 (0%) 0/50 (0%)1/50 (2%) 0/50 (0%) 0/50 (0%) 0/50 (0%) 0/50 (0%) 0/50 (0%)0/50 (0%) 0/50 (0%) 0/50 (0%) 0/50 (0%) 0/50 (0%) 0/50 (0%)0/50 (0%) 0/50 (0%)
Overall Incidence Total 2/1249 (0.16%) Mean 0.16% SD 0.55% Total 0/1200 (0%) Mean 0% SD 0%
*: Denominator is number of animals with tissues examined microscopically#: Denominator is number of animals necropsied
Version: May2011 Toxicology Data Management System Page: 22
Contract/Lab: All Laboratories Tumor Incidence for Selected Control Animal Groups Report Date: 05/18/2011
Species: RATS Route: ALL ROUTES
Strain: F 344/N Vehicle: ALL VEHICLES
Length of Study: CHRONIC
Male Female
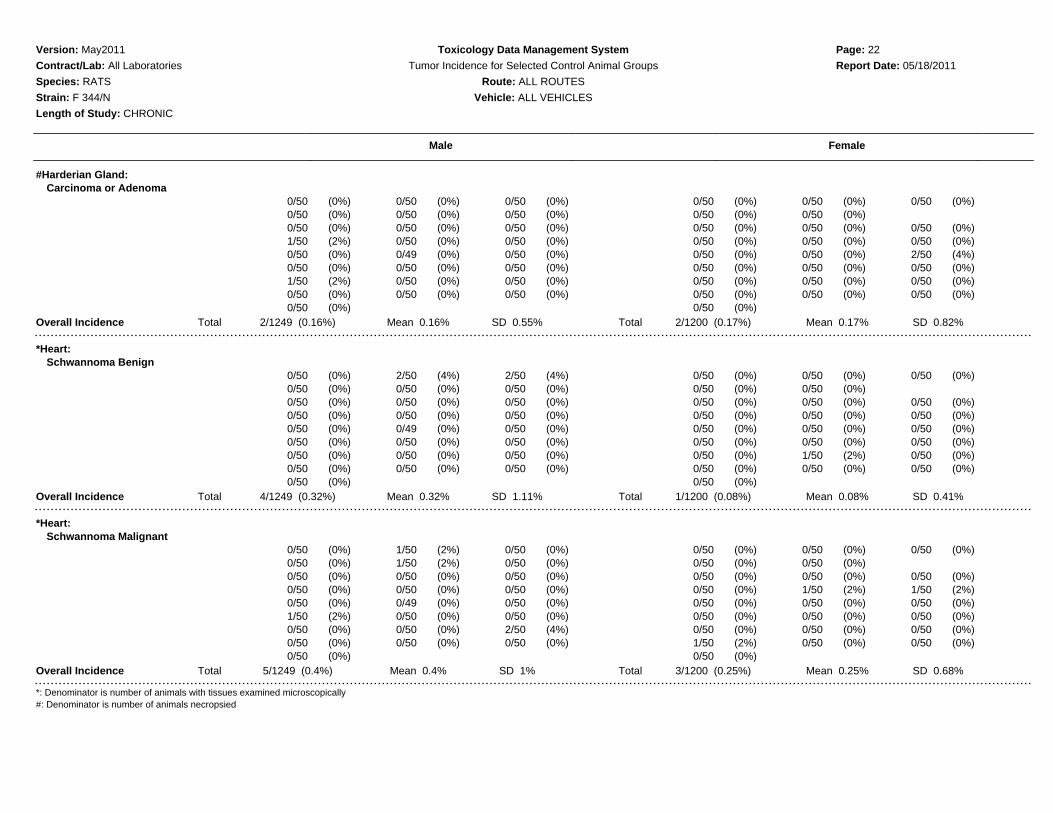
#Harderian Gland:Carcinoma or Adenoma
0/50 (0%) 0/50 (0%) 0/50 (0%) 0/50 (0%) 0/50 (0%) 0/50 (0%)0/50 (0%) 0/50 (0%) 0/50 (0%) 0/50 (0%) 0/50 (0%)0/50 (0%) 0/50 (0%) 0/50 (0%) 0/50 (0%) 0/50 (0%) 0/50 (0%)1/50 (2%) 0/50 (0%) 0/50 (0%) 0/50 (0%) 0/50 (0%) 0/50 (0%)0/50 (0%) 0/49 (0%) 0/50 (0%) 0/50 (0%) 0/50 (0%) 2/50 (4%)0/50 (0%) 0/50 (0%) 0/50 (0%) 0/50 (0%) 0/50 (0%) 0/50 (0%)1/50 (2%) 0/50 (0%) 0/50 (0%) 0/50 (0%) 0/50 (0%) 0/50 (0%)0/50 (0%) 0/50 (0%) 0/50 (0%) 0/50 (0%) 0/50 (0%) 0/50 (0%)0/50 (0%) 0/50 (0%)
Overall Incidence Total 2/1249 (0.16%) Mean 0.16% SD 0.55% Total 2/1200 (0.17%) Mean 0.17% SD 0.82%
*Heart:Schwannoma Benign
0/50 (0%) 2/50 (4%) 2/50 (4%) 0/50 (0%) 0/50 (0%) 0/50 (0%)0/50 (0%) 0/50 (0%) 0/50 (0%) 0/50 (0%) 0/50 (0%)0/50 (0%) 0/50 (0%) 0/50 (0%) 0/50 (0%) 0/50 (0%) 0/50 (0%)0/50 (0%) 0/50 (0%) 0/50 (0%) 0/50 (0%) 0/50 (0%) 0/50 (0%)0/50 (0%) 0/49 (0%) 0/50 (0%) 0/50 (0%) 0/50 (0%) 0/50 (0%)0/50 (0%) 0/50 (0%) 0/50 (0%) 0/50 (0%) 0/50 (0%) 0/50 (0%)0/50 (0%) 0/50 (0%) 0/50 (0%) 0/50 (0%) 1/50 (2%) 0/50 (0%)0/50 (0%) 0/50 (0%) 0/50 (0%) 0/50 (0%) 0/50 (0%) 0/50 (0%)0/50 (0%) 0/50 (0%)
Overall Incidence Total 4/1249 (0.32%) Mean 0.32% SD 1.11% Total 1/1200 (0.08%) Mean 0.08% SD 0.41%
*Heart:Schwannoma Malignant
0/50 (0%) 1/50 (2%) 0/50 (0%) 0/50 (0%) 0/50 (0%) 0/50 (0%)0/50 (0%) 1/50 (2%) 0/50 (0%) 0/50 (0%) 0/50 (0%)0/50 (0%) 0/50 (0%) 0/50 (0%) 0/50 (0%) 0/50 (0%) 0/50 (0%)0/50 (0%) 0/50 (0%) 0/50 (0%) 0/50 (0%) 1/50 (2%) 1/50 (2%)0/50 (0%) 0/49 (0%) 0/50 (0%) 0/50 (0%) 0/50 (0%) 0/50 (0%)1/50 (2%) 0/50 (0%) 0/50 (0%) 0/50 (0%) 0/50 (0%) 0/50 (0%)0/50 (0%) 0/50 (0%) 2/50 (4%) 0/50 (0%) 0/50 (0%) 0/50 (0%)0/50 (0%) 0/50 (0%) 0/50 (0%) 1/50 (2%) 0/50 (0%) 0/50 (0%)0/50 (0%) 0/50 (0%)
Overall Incidence Total 5/1249 (0.4%) Mean 0.4% SD 1% Total 3/1200 (0.25%) Mean 0.25% SD 0.68%
*: Denominator is number of animals with tissues examined microscopically#: Denominator is number of animals necropsied

Version: May2011 Toxicology Data Management System Page: 23
Contract/Lab: All Laboratories Tumor Incidence for Selected Control Animal Groups Report Date: 05/18/2011
Species: RATS Route: ALL ROUTES
Strain: F 344/N Vehicle: ALL VEHICLES
Length of Study: CHRONIC
Male Female
#Intestine Large: Colon/Rectum:Adenoma
0/50 (0%) 0/50 (0%) 0/50 (0%) 0/50 (0%) 1/50 (2%) 1/50 (2%)0/50 (0%) 1/50 (2%) 0/50 (0%) 0/50 (0%) 0/50 (0%)0/50 (0%) 0/50 (0%) 0/50 (0%) 1/50 (2%) 0/50 (0%) 0/50 (0%)0/50 (0%) 0/50 (0%) 0/50 (0%) 0/50 (0%) 0/50 (0%) 1/50 (2%)0/50 (0%) 0/49 (0%) 0/50 (0%) 0/50 (0%) 0/50 (0%) 0/50 (0%)0/50 (0%) 0/50 (0%) 0/50 (0%) 0/50 (0%) 0/50 (0%) 0/50 (0%)1/50 (2%) 0/50 (0%) 1/50 (2%) 0/50 (0%) 0/50 (0%) 0/50 (0%)0/50 (0%) 1/50 (2%) 0/50 (0%) 0/50 (0%) 0/50 (0%) 0/50 (0%)0/50 (0%) 0/50 (0%)
Overall Incidence Total 4/1249 (0.32%) Mean 0.32% SD 0.75% Total 4/1200 (0.33%) Mean 0.33% SD 0.76%
#Intestine Large: Colon/Rectum:Carcinoma or Adenoma
0/50 (0%) 0/50 (0%) 0/50 (0%) 0/50 (0%) 1/50 (2%) 1/50 (2%)0/50 (0%) 1/50 (2%) 0/50 (0%) 0/50 (0%) 0/50 (0%)0/50 (0%) 0/50 (0%) 0/50 (0%) 1/50 (2%) 0/50 (0%) 0/50 (0%)0/50 (0%) 0/50 (0%) 0/50 (0%) 0/50 (0%) 0/50 (0%) 1/50 (2%)0/50 (0%) 0/49 (0%) 0/50 (0%) 0/50 (0%) 0/50 (0%) 0/50 (0%)0/50 (0%) 0/50 (0%) 0/50 (0%) 0/50 (0%) 0/50 (0%) 0/50 (0%)1/50 (2%) 0/50 (0%) 1/50 (2%) 0/50 (0%) 0/50 (0%) 0/50 (0%)0/50 (0%) 1/50 (2%) 0/50 (0%) 0/50 (0%) 0/50 (0%) 0/50 (0%)0/50 (0%) 0/50 (0%)
Overall Incidence Total 4/1249 (0.32%) Mean 0.32% SD 0.75% Total 4/1200 (0.33%) Mean 0.33% SD 0.76%
#Intestine Large: Colon/Rectum:Hemangioma
0/50 (0%) 0/50 (0%) 0/50 (0%) 0/50 (0%) 0/50 (0%) 0/50 (0%)0/50 (0%) 0/50 (0%) 0/50 (0%) 0/50 (0%) 0/50 (0%)0/50 (0%) 0/50 (0%) 0/50 (0%) 0/50 (0%) 0/50 (0%) 0/50 (0%)0/50 (0%) 0/50 (0%) 0/50 (0%) 0/50 (0%) 0/50 (0%) 0/50 (0%)0/50 (0%) 0/49 (0%) 0/50 (0%) 0/50 (0%) 0/50 (0%) 0/50 (0%)1/50 (2%) 0/50 (0%) 0/50 (0%) 0/50 (0%) 0/50 (0%) 0/50 (0%)0/50 (0%) 0/50 (0%) 0/50 (0%) 0/50 (0%) 0/50 (0%) 0/50 (0%)0/50 (0%) 0/50 (0%) 0/50 (0%) 0/50 (0%) 0/50 (0%) 0/50 (0%)0/50 (0%) 0/50 (0%)
Overall Incidence Total 1/1249 (0.08%) Mean 0.08% SD 0.4% Total 0/1200 (0%) Mean 0% SD 0%
*: Denominator is number of animals with tissues examined microscopically#: Denominator is number of animals necropsied

Version: May2011 Toxicology Data Management System Page: 24
Contract/Lab: All Laboratories Tumor Incidence for Selected Control Animal Groups Report Date: 05/18/2011
Species: RATS Route: ALL ROUTES
Strain: F 344/N Vehicle: ALL VEHICLES
Length of Study: CHRONIC
Male Female
#Intestine Small: Duodenum:Carcinoma
0/50 (0%) 0/50 (0%) 0/50 (0%) 0/50 (0%) 0/50 (0%) 0/50 (0%)0/50 (0%) 1/50 (2%) 0/50 (0%) 0/50 (0%) 0/50 (0%)0/50 (0%) 0/50 (0%) 0/50 (0%) 0/50 (0%) 0/50 (0%) 0/50 (0%)0/50 (0%) 0/50 (0%) 0/50 (0%) 0/50 (0%) 0/50 (0%) 0/50 (0%)0/50 (0%) 0/49 (0%) 0/50 (0%) 0/50 (0%) 0/50 (0%) 0/50 (0%)0/50 (0%) 0/50 (0%) 0/50 (0%) 0/50 (0%) 0/50 (0%) 0/50 (0%)0/50 (0%) 0/50 (0%) 0/50 (0%) 0/50 (0%) 0/50 (0%) 0/50 (0%)0/50 (0%) 0/50 (0%) 0/50 (0%) 0/50 (0%) 0/50 (0%) 0/50 (0%)0/50 (0%) 0/50 (0%)
Overall Incidence Total 1/1249 (0.08%) Mean 0.08% SD 0.4% Total 0/1200 (0%) Mean 0% SD 0%
#Intestine Small: Duodenum:Leiomyoma
0/50 (0%) 0/50 (0%) 0/50 (0%) 0/50 (0%) 0/50 (0%) 0/50 (0%)0/50 (0%) 0/50 (0%) 0/50 (0%) 0/50 (0%) 0/50 (0%)0/50 (0%) 1/50 (2%) 0/50 (0%) 0/50 (0%) 0/50 (0%) 0/50 (0%)0/50 (0%) 0/50 (0%) 0/50 (0%) 1/50 (2%) 0/50 (0%) 0/50 (0%)0/50 (0%) 0/49 (0%) 0/50 (0%) 0/50 (0%) 0/50 (0%) 0/50 (0%)0/50 (0%) 0/50 (0%) 0/50 (0%) 0/50 (0%) 0/50 (0%) 0/50 (0%)0/50 (0%) 0/50 (0%) 0/50 (0%) 0/50 (0%) 0/50 (0%) 0/50 (0%)0/50 (0%) 0/50 (0%) 0/50 (0%) 1/50 (2%) 0/50 (0%) 0/50 (0%)0/50 (0%) 0/50 (0%)
Overall Incidence Total 1/1249 (0.08%) Mean 0.08% SD 0.4% Total 2/1200 (0.17%) Mean 0.17% SD 0.56%
#Intestine Small: Duodenum:Schwannoma Malignant
0/50 (0%) 0/50 (0%) 0/50 (0%) 0/50 (0%) 0/50 (0%) 0/50 (0%)0/50 (0%) 0/50 (0%) 0/50 (0%) 0/50 (0%) 0/50 (0%)0/50 (0%) 0/50 (0%) 0/50 (0%) 0/50 (0%) 0/50 (0%) 1/50 (2%)0/50 (0%) 0/50 (0%) 0/50 (0%) 0/50 (0%) 0/50 (0%) 0/50 (0%)0/50 (0%) 0/49 (0%) 0/50 (0%) 0/50 (0%) 0/50 (0%) 0/50 (0%)0/50 (0%) 0/50 (0%) 0/50 (0%) 0/50 (0%) 0/50 (0%) 0/50 (0%)0/50 (0%) 0/50 (0%) 0/50 (0%) 0/50 (0%) 0/50 (0%) 0/50 (0%)0/50 (0%) 0/50 (0%) 0/50 (0%) 0/50 (0%) 0/50 (0%) 0/50 (0%)0/50 (0%) 0/50 (0%)
Overall Incidence Total 0/1249 (0%) Mean 0% SD 0% Total 1/1200 (0.08%) Mean 0.08% SD 0.41%
*: Denominator is number of animals with tissues examined microscopically#: Denominator is number of animals necropsied
Version: May2011 Toxicology Data Management System Page: 25
Contract/Lab: All Laboratories Tumor Incidence for Selected Control Animal Groups Report Date: 05/18/2011
Species: RATS Route: ALL ROUTES
Strain: F 344/N Vehicle: ALL VEHICLES
Length of Study: CHRONIC
Male Female
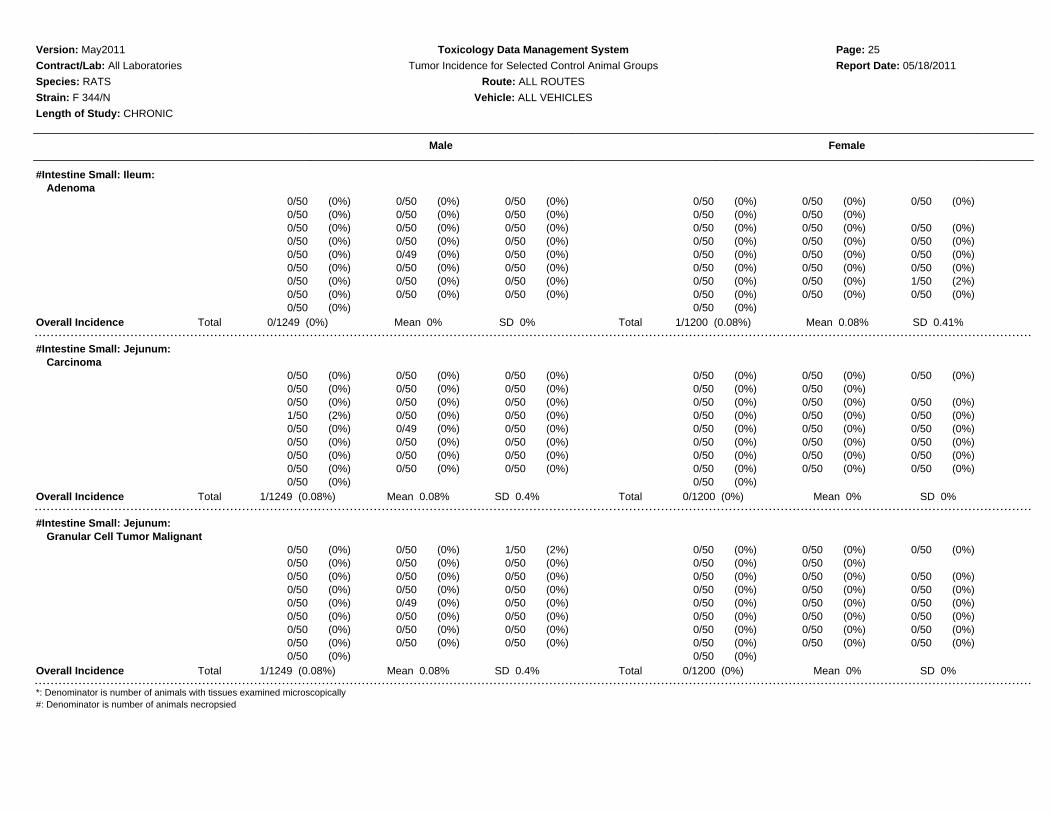
#Intestine Small: Ileum:Adenoma
0/50 (0%) 0/50 (0%) 0/50 (0%) 0/50 (0%) 0/50 (0%) 0/50 (0%)0/50 (0%) 0/50 (0%) 0/50 (0%) 0/50 (0%) 0/50 (0%)0/50 (0%) 0/50 (0%) 0/50 (0%) 0/50 (0%) 0/50 (0%) 0/50 (0%)0/50 (0%) 0/50 (0%) 0/50 (0%) 0/50 (0%) 0/50 (0%) 0/50 (0%)0/50 (0%) 0/49 (0%) 0/50 (0%) 0/50 (0%) 0/50 (0%) 0/50 (0%)0/50 (0%) 0/50 (0%) 0/50 (0%) 0/50 (0%) 0/50 (0%) 0/50 (0%)0/50 (0%) 0/50 (0%) 0/50 (0%) 0/50 (0%) 0/50 (0%) 1/50 (2%)0/50 (0%) 0/50 (0%) 0/50 (0%) 0/50 (0%) 0/50 (0%) 0/50 (0%)0/50 (0%) 0/50 (0%)
Overall Incidence Total 0/1249 (0%) Mean 0% SD 0% Total 1/1200 (0.08%) Mean 0.08% SD 0.41%
#Intestine Small: Jejunum:Carcinoma
0/50 (0%) 0/50 (0%) 0/50 (0%) 0/50 (0%) 0/50 (0%) 0/50 (0%)0/50 (0%) 0/50 (0%) 0/50 (0%) 0/50 (0%) 0/50 (0%)0/50 (0%) 0/50 (0%) 0/50 (0%) 0/50 (0%) 0/50 (0%) 0/50 (0%)1/50 (2%) 0/50 (0%) 0/50 (0%) 0/50 (0%) 0/50 (0%) 0/50 (0%)0/50 (0%) 0/49 (0%) 0/50 (0%) 0/50 (0%) 0/50 (0%) 0/50 (0%)0/50 (0%) 0/50 (0%) 0/50 (0%) 0/50 (0%) 0/50 (0%) 0/50 (0%)0/50 (0%) 0/50 (0%) 0/50 (0%) 0/50 (0%) 0/50 (0%) 0/50 (0%)0/50 (0%) 0/50 (0%) 0/50 (0%) 0/50 (0%) 0/50 (0%) 0/50 (0%)0/50 (0%) 0/50 (0%)
Overall Incidence Total 1/1249 (0.08%) Mean 0.08% SD 0.4% Total 0/1200 (0%) Mean 0% SD 0%
#Intestine Small: Jejunum:Granular Cell Tumor Malignant
0/50 (0%) 0/50 (0%) 1/50 (2%) 0/50 (0%) 0/50 (0%) 0/50 (0%)0/50 (0%) 0/50 (0%) 0/50 (0%) 0/50 (0%) 0/50 (0%)0/50 (0%) 0/50 (0%) 0/50 (0%) 0/50 (0%) 0/50 (0%) 0/50 (0%)0/50 (0%) 0/50 (0%) 0/50 (0%) 0/50 (0%) 0/50 (0%) 0/50 (0%)0/50 (0%) 0/49 (0%) 0/50 (0%) 0/50 (0%) 0/50 (0%) 0/50 (0%)0/50 (0%) 0/50 (0%) 0/50 (0%) 0/50 (0%) 0/50 (0%) 0/50 (0%)0/50 (0%) 0/50 (0%) 0/50 (0%) 0/50 (0%) 0/50 (0%) 0/50 (0%)0/50 (0%) 0/50 (0%) 0/50 (0%) 0/50 (0%) 0/50 (0%) 0/50 (0%)0/50 (0%) 0/50 (0%)
Overall Incidence Total 1/1249 (0.08%) Mean 0.08% SD 0.4% Total 0/1200 (0%) Mean 0% SD 0%
*: Denominator is number of animals with tissues examined microscopically#: Denominator is number of animals necropsied
Version: May2011 Toxicology Data Management System Page: 26
Contract/Lab: All Laboratories Tumor Incidence for Selected Control Animal Groups Report Date: 05/18/2011
Species: RATS Route: ALL ROUTES
Strain: F 344/N Vehicle: ALL VEHICLES
Length of Study: CHRONIC
Male Female
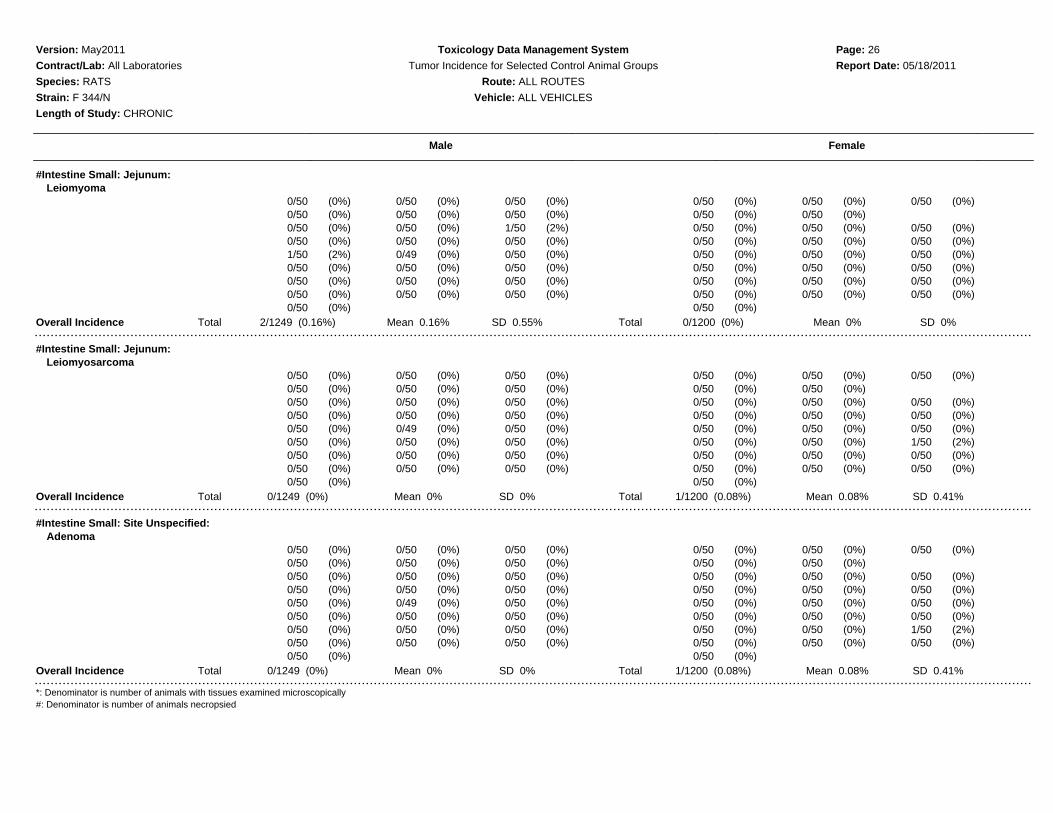
#Intestine Small: Jejunum:Leiomyoma
0/50 (0%) 0/50 (0%) 0/50 (0%) 0/50 (0%) 0/50 (0%) 0/50 (0%)0/50 (0%) 0/50 (0%) 0/50 (0%) 0/50 (0%) 0/50 (0%)0/50 (0%) 0/50 (0%) 1/50 (2%) 0/50 (0%) 0/50 (0%) 0/50 (0%)0/50 (0%) 0/50 (0%) 0/50 (0%) 0/50 (0%) 0/50 (0%) 0/50 (0%)1/50 (2%) 0/49 (0%) 0/50 (0%) 0/50 (0%) 0/50 (0%) 0/50 (0%)0/50 (0%) 0/50 (0%) 0/50 (0%) 0/50 (0%) 0/50 (0%) 0/50 (0%)0/50 (0%) 0/50 (0%) 0/50 (0%) 0/50 (0%) 0/50 (0%) 0/50 (0%)0/50 (0%) 0/50 (0%) 0/50 (0%) 0/50 (0%) 0/50 (0%) 0/50 (0%)0/50 (0%) 0/50 (0%)
Overall Incidence Total 2/1249 (0.16%) Mean 0.16% SD 0.55% Total 0/1200 (0%) Mean 0% SD 0%
#Intestine Small: Jejunum:Leiomyosarcoma
0/50 (0%) 0/50 (0%) 0/50 (0%) 0/50 (0%) 0/50 (0%) 0/50 (0%)0/50 (0%) 0/50 (0%) 0/50 (0%) 0/50 (0%) 0/50 (0%)0/50 (0%) 0/50 (0%) 0/50 (0%) 0/50 (0%) 0/50 (0%) 0/50 (0%)0/50 (0%) 0/50 (0%) 0/50 (0%) 0/50 (0%) 0/50 (0%) 0/50 (0%)0/50 (0%) 0/49 (0%) 0/50 (0%) 0/50 (0%) 0/50 (0%) 0/50 (0%)0/50 (0%) 0/50 (0%) 0/50 (0%) 0/50 (0%) 0/50 (0%) 1/50 (2%)0/50 (0%) 0/50 (0%) 0/50 (0%) 0/50 (0%) 0/50 (0%) 0/50 (0%)0/50 (0%) 0/50 (0%) 0/50 (0%) 0/50 (0%) 0/50 (0%) 0/50 (0%)0/50 (0%) 0/50 (0%)
Overall Incidence Total 0/1249 (0%) Mean 0% SD 0% Total 1/1200 (0.08%) Mean 0.08% SD 0.41%
#Intestine Small: Site Unspecified:Adenoma
0/50 (0%) 0/50 (0%) 0/50 (0%) 0/50 (0%) 0/50 (0%) 0/50 (0%)0/50 (0%) 0/50 (0%) 0/50 (0%) 0/50 (0%) 0/50 (0%)0/50 (0%) 0/50 (0%) 0/50 (0%) 0/50 (0%) 0/50 (0%) 0/50 (0%)0/50 (0%) 0/50 (0%) 0/50 (0%) 0/50 (0%) 0/50 (0%) 0/50 (0%)0/50 (0%) 0/49 (0%) 0/50 (0%) 0/50 (0%) 0/50 (0%) 0/50 (0%)0/50 (0%) 0/50 (0%) 0/50 (0%) 0/50 (0%) 0/50 (0%) 0/50 (0%)0/50 (0%) 0/50 (0%) 0/50 (0%) 0/50 (0%) 0/50 (0%) 1/50 (2%)0/50 (0%) 0/50 (0%) 0/50 (0%) 0/50 (0%) 0/50 (0%) 0/50 (0%)0/50 (0%) 0/50 (0%)
Overall Incidence Total 0/1249 (0%) Mean 0% SD 0% Total 1/1200 (0.08%) Mean 0.08% SD 0.41%
*: Denominator is number of animals with tissues examined microscopically#: Denominator is number of animals necropsied

Version: May2011 Toxicology Data Management System Page: 27
Contract/Lab: All Laboratories Tumor Incidence for Selected Control Animal Groups Report Date: 05/18/2011
Species: RATS Route: ALL ROUTES
Strain: F 344/N Vehicle: ALL VEHICLES
Length of Study: CHRONIC
Male Female
#Intestine Small: Site Unspecified:Carcinoma
0/50 (0%) 0/50 (0%) 0/50 (0%) 0/50 (0%) 0/50 (0%) 0/50 (0%)0/50 (0%) 1/50 (2%) 0/50 (0%) 0/50 (0%) 0/50 (0%)0/50 (0%) 0/50 (0%) 0/50 (0%) 0/50 (0%) 0/50 (0%) 0/50 (0%)1/50 (2%) 0/50 (0%) 0/50 (0%) 0/50 (0%) 0/50 (0%) 0/50 (0%)0/50 (0%) 0/49 (0%) 0/50 (0%) 0/50 (0%) 0/50 (0%) 0/50 (0%)0/50 (0%) 0/50 (0%) 0/50 (0%) 0/50 (0%) 0/50 (0%) 0/50 (0%)0/50 (0%) 0/50 (0%) 0/50 (0%) 0/50 (0%) 0/50 (0%) 0/50 (0%)0/50 (0%) 0/50 (0%) 0/50 (0%) 0/50 (0%) 0/50 (0%) 0/50 (0%)0/50 (0%) 0/50 (0%)
Overall Incidence Total 2/1249 (0.16%) Mean 0.16% SD 0.55% Total 0/1200 (0%) Mean 0% SD 0%
#Intestine Small: Site Unspecified:Carcinoma or Adenoma
0/50 (0%) 0/50 (0%) 0/50 (0%) 0/50 (0%) 0/50 (0%) 0/50 (0%)0/50 (0%) 1/50 (2%) 0/50 (0%) 0/50 (0%) 0/50 (0%)0/50 (0%) 0/50 (0%) 0/50 (0%) 0/50 (0%) 0/50 (0%) 0/50 (0%)1/50 (2%) 0/50 (0%) 0/50 (0%) 0/50 (0%) 0/50 (0%) 0/50 (0%)0/50 (0%) 0/49 (0%) 0/50 (0%) 0/50 (0%) 0/50 (0%) 0/50 (0%)0/50 (0%) 0/50 (0%) 0/50 (0%) 0/50 (0%) 0/50 (0%) 0/50 (0%)0/50 (0%) 0/50 (0%) 0/50 (0%) 0/50 (0%) 0/50 (0%) 1/50 (2%)0/50 (0%) 0/50 (0%) 0/50 (0%) 0/50 (0%) 0/50 (0%) 0/50 (0%)0/50 (0%) 0/50 (0%)
Overall Incidence Total 2/1249 (0.16%) Mean 0.16% SD 0.55% Total 1/1200 (0.08%) Mean 0.08% SD 0.41%
#Intestine Small: Site Unspecified:Granular Cell Tumor Malignant
0/50 (0%) 0/50 (0%) 1/50 (2%) 0/50 (0%) 0/50 (0%) 0/50 (0%)0/50 (0%) 0/50 (0%) 0/50 (0%) 0/50 (0%) 0/50 (0%)0/50 (0%) 0/50 (0%) 0/50 (0%) 0/50 (0%) 0/50 (0%) 0/50 (0%)0/50 (0%) 0/50 (0%) 0/50 (0%) 0/50 (0%) 0/50 (0%) 0/50 (0%)0/50 (0%) 0/49 (0%) 0/50 (0%) 0/50 (0%) 0/50 (0%) 0/50 (0%)0/50 (0%) 0/50 (0%) 0/50 (0%) 0/50 (0%) 0/50 (0%) 0/50 (0%)0/50 (0%) 0/50 (0%) 0/50 (0%) 0/50 (0%) 0/50 (0%) 0/50 (0%)0/50 (0%) 0/50 (0%) 0/50 (0%) 0/50 (0%) 0/50 (0%) 0/50 (0%)0/50 (0%) 0/50 (0%)
Overall Incidence Total 1/1249 (0.08%) Mean 0.08% SD 0.4% Total 0/1200 (0%) Mean 0% SD 0%
*: Denominator is number of animals with tissues examined microscopically#: Denominator is number of animals necropsied
Version: May2011 Toxicology Data Management System Page: 28
Contract/Lab: All Laboratories Tumor Incidence for Selected Control Animal Groups Report Date: 05/18/2011
Species: RATS Route: ALL ROUTES
Strain: F 344/N Vehicle: ALL VEHICLES
Length of Study: CHRONIC
Male Female
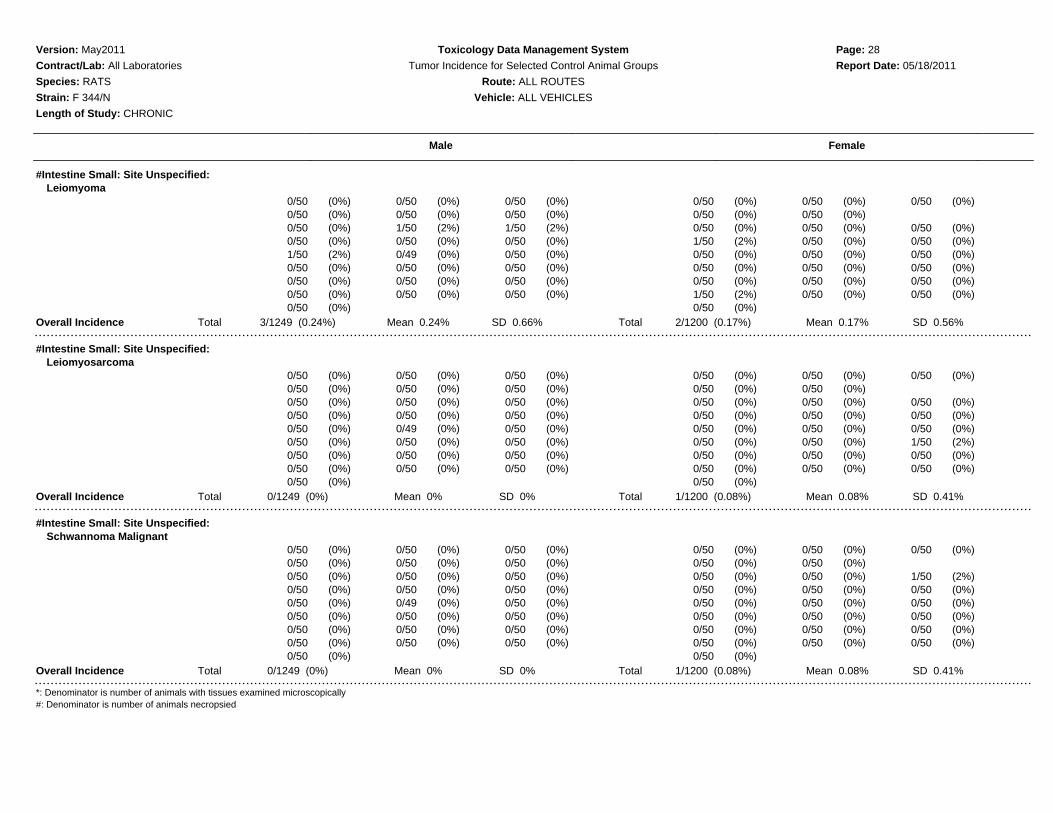
#Intestine Small: Site Unspecified:Leiomyoma
0/50 (0%) 0/50 (0%) 0/50 (0%) 0/50 (0%) 0/50 (0%) 0/50 (0%)0/50 (0%) 0/50 (0%) 0/50 (0%) 0/50 (0%) 0/50 (0%)0/50 (0%) 1/50 (2%) 1/50 (2%) 0/50 (0%) 0/50 (0%) 0/50 (0%)0/50 (0%) 0/50 (0%) 0/50 (0%) 1/50 (2%) 0/50 (0%) 0/50 (0%)1/50 (2%) 0/49 (0%) 0/50 (0%) 0/50 (0%) 0/50 (0%) 0/50 (0%)0/50 (0%) 0/50 (0%) 0/50 (0%) 0/50 (0%) 0/50 (0%) 0/50 (0%)0/50 (0%) 0/50 (0%) 0/50 (0%) 0/50 (0%) 0/50 (0%) 0/50 (0%)0/50 (0%) 0/50 (0%) 0/50 (0%) 1/50 (2%) 0/50 (0%) 0/50 (0%)0/50 (0%) 0/50 (0%)
Overall Incidence Total 3/1249 (0.24%) Mean 0.24% SD 0.66% Total 2/1200 (0.17%) Mean 0.17% SD 0.56%
#Intestine Small: Site Unspecified:Leiomyosarcoma
0/50 (0%) 0/50 (0%) 0/50 (0%) 0/50 (0%) 0/50 (0%) 0/50 (0%)0/50 (0%) 0/50 (0%) 0/50 (0%) 0/50 (0%) 0/50 (0%)0/50 (0%) 0/50 (0%) 0/50 (0%) 0/50 (0%) 0/50 (0%) 0/50 (0%)0/50 (0%) 0/50 (0%) 0/50 (0%) 0/50 (0%) 0/50 (0%) 0/50 (0%)0/50 (0%) 0/49 (0%) 0/50 (0%) 0/50 (0%) 0/50 (0%) 0/50 (0%)0/50 (0%) 0/50 (0%) 0/50 (0%) 0/50 (0%) 0/50 (0%) 1/50 (2%)0/50 (0%) 0/50 (0%) 0/50 (0%) 0/50 (0%) 0/50 (0%) 0/50 (0%)0/50 (0%) 0/50 (0%) 0/50 (0%) 0/50 (0%) 0/50 (0%) 0/50 (0%)0/50 (0%) 0/50 (0%)
Overall Incidence Total 0/1249 (0%) Mean 0% SD 0% Total 1/1200 (0.08%) Mean 0.08% SD 0.41%
#Intestine Small: Site Unspecified:Schwannoma Malignant
0/50 (0%) 0/50 (0%) 0/50 (0%) 0/50 (0%) 0/50 (0%) 0/50 (0%)0/50 (0%) 0/50 (0%) 0/50 (0%) 0/50 (0%) 0/50 (0%)0/50 (0%) 0/50 (0%) 0/50 (0%) 0/50 (0%) 0/50 (0%) 1/50 (2%)0/50 (0%) 0/50 (0%) 0/50 (0%) 0/50 (0%) 0/50 (0%) 0/50 (0%)0/50 (0%) 0/49 (0%) 0/50 (0%) 0/50 (0%) 0/50 (0%) 0/50 (0%)0/50 (0%) 0/50 (0%) 0/50 (0%) 0/50 (0%) 0/50 (0%) 0/50 (0%)0/50 (0%) 0/50 (0%) 0/50 (0%) 0/50 (0%) 0/50 (0%) 0/50 (0%)0/50 (0%) 0/50 (0%) 0/50 (0%) 0/50 (0%) 0/50 (0%) 0/50 (0%)0/50 (0%) 0/50 (0%)
Overall Incidence Total 0/1249 (0%) Mean 0% SD 0% Total 1/1200 (0.08%) Mean 0.08% SD 0.41%
*: Denominator is number of animals with tissues examined microscopically#: Denominator is number of animals necropsied

Version: May2011 Toxicology Data Management System Page: 29
Contract/Lab: All Laboratories Tumor Incidence for Selected Control Animal Groups Report Date: 05/18/2011
Species: RATS Route: ALL ROUTES
Strain: F 344/N Vehicle: ALL VEHICLES
Length of Study: CHRONIC
Male Female
*Islets, Pancreatic:Adenoma
4/50 (8%) 1/50 (2%) 3/50 (6%) 1/50 (2%) 1/49 (2%) 0/50 (0%)0/50 (0%) 1/50 (2%) 1/49 (2%) 0/50 (0%) 2/49 (4%)6/50 (12%) 6/50 (12%) 4/50 (8%) 0/50 (0%) 2/50 (4%) 1/50 (2%)0/50 (0%) 7/50 (14%) 2/50 (4%) 1/50 (2%) 0/49 (0%) 0/50 (0%)4/50 (8%) 4/49 (8%) 5/49 (10%) 0/50 (0%) 1/50 (2%) 3/49 (6%)3/50 (6%) 2/50 (4%) 2/50 (4%) 0/48 (0%) 1/50 (2%) 0/50 (0%)4/50 (8%) 2/50 (4%) 3/50 (6%) 0/50 (0%) 1/50 (2%) 2/50 (4%)4/50 (8%) 0/50 (0%) 3/50 (6%) 2/50 (4%) 1/50 (2%) 0/50 (0%)
18/50 (36%) 3/50 (6%)Overall Incidence Total 89/1247 (7.14%) Mean 7.14% SD 7.12% Total 22/1194 (1.84%) Mean 1.84% SD 1.96%
*Islets, Pancreatic:Carcinoma
0/50 (0%) 2/50 (4%) 0/50 (0%) 1/50 (2%) 0/49 (0%) 1/50 (2%)3/50 (6%) 1/50 (2%) 1/49 (2%) 1/50 (2%) 0/49 (0%)0/50 (0%) 1/50 (2%) 0/50 (0%) 0/50 (0%) 0/50 (0%) 0/50 (0%)0/50 (0%) 0/50 (0%) 2/50 (4%) 0/50 (0%) 0/49 (0%) 0/50 (0%)0/50 (0%) 0/49 (0%) 3/49 (6%) 0/50 (0%) 0/50 (0%) 0/49 (0%)1/50 (2%) 1/50 (2%) 1/50 (2%) 0/48 (0%) 0/50 (0%) 0/50 (0%)0/50 (0%) 0/50 (0%) 0/50 (0%) 0/50 (0%) 0/50 (0%) 0/50 (0%)0/50 (0%) 0/50 (0%) 1/50 (2%) 0/50 (0%) 0/50 (0%) 0/50 (0%)0/50 (0%) 0/50 (0%)
Overall Incidence Total 17/1247 (1.36%) Mean 1.37% SD 1.9% Total 3/1194 (0.25%) Mean 0.25% SD 0.68%
*Islets, Pancreatic:Carcinoma or Adenoma
4/50 (8%) 3/50 (6%) 3/50 (6%) 2/50 (4%) 1/49 (2%) 1/50 (2%)3/50 (6%) 2/50 (4%) 2/49 (4%) 1/50 (2%) 2/49 (4%)6/50 (12%) 7/50 (14%) 4/50 (8%) 0/50 (0%) 2/50 (4%) 1/50 (2%)0/50 (0%) 7/50 (14%) 4/50 (8%) 1/50 (2%) 0/49 (0%) 0/50 (0%)4/50 (8%) 4/49 (8%) 8/49 (16%) 0/50 (0%) 1/50 (2%) 3/49 (6%)4/50 (8%) 3/50 (6%) 3/50 (6%) 0/48 (0%) 1/50 (2%) 0/50 (0%)4/50 (8%) 2/50 (4%) 3/50 (6%) 0/50 (0%) 1/50 (2%) 2/50 (4%)4/50 (8%) 0/50 (0%) 4/50 (8%) 2/50 (4%) 1/50 (2%) 0/50 (0%)
18/50 (36%) 3/50 (6%)Overall Incidence Total 106/1247 (8.5%) Mean 8.5% SD 6.88% Total 25/1194 (2.09%) Mean 2.09% SD 1.92%
*: Denominator is number of animals with tissues examined microscopically#: Denominator is number of animals necropsied
Version: May2011 Toxicology Data Management System Page: 30
Contract/Lab: All Laboratories Tumor Incidence for Selected Control Animal Groups Report Date: 05/18/2011
Species: RATS Route: ALL ROUTES
Strain: F 344/N Vehicle: ALL VEHICLES
Length of Study: CHRONIC
Male Female
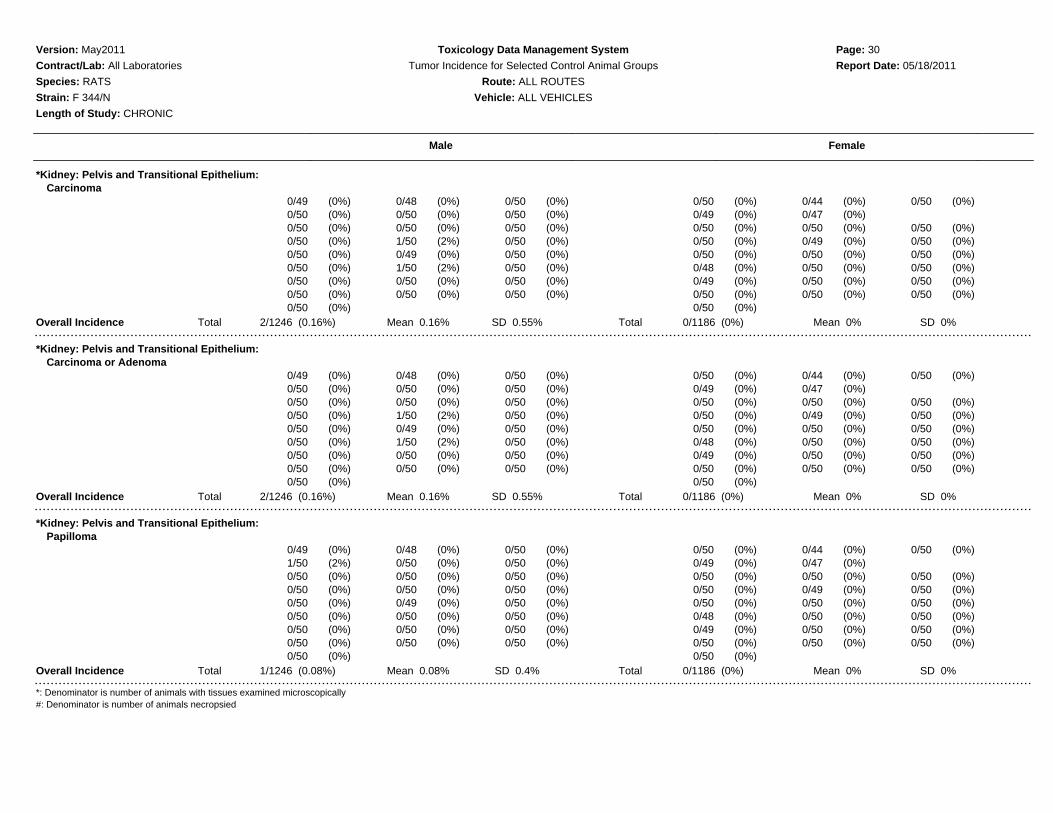
*Kidney: Pelvis and Transitional Epithelium:Carcinoma
0/49 (0%) 0/48 (0%) 0/50 (0%) 0/50 (0%) 0/44 (0%) 0/50 (0%)0/50 (0%) 0/50 (0%) 0/50 (0%) 0/49 (0%) 0/47 (0%)0/50 (0%) 0/50 (0%) 0/50 (0%) 0/50 (0%) 0/50 (0%) 0/50 (0%)0/50 (0%) 1/50 (2%) 0/50 (0%) 0/50 (0%) 0/49 (0%) 0/50 (0%)0/50 (0%) 0/49 (0%) 0/50 (0%) 0/50 (0%) 0/50 (0%) 0/50 (0%)0/50 (0%) 1/50 (2%) 0/50 (0%) 0/48 (0%) 0/50 (0%) 0/50 (0%)0/50 (0%) 0/50 (0%) 0/50 (0%) 0/49 (0%) 0/50 (0%) 0/50 (0%)0/50 (0%) 0/50 (0%) 0/50 (0%) 0/50 (0%) 0/50 (0%) 0/50 (0%)0/50 (0%) 0/50 (0%)
Overall Incidence Total 2/1246 (0.16%) Mean 0.16% SD 0.55% Total 0/1186 (0%) Mean 0% SD 0%
*Kidney: Pelvis and Transitional Epithelium:Carcinoma or Adenoma
0/49 (0%) 0/48 (0%) 0/50 (0%) 0/50 (0%) 0/44 (0%) 0/50 (0%)0/50 (0%) 0/50 (0%) 0/50 (0%) 0/49 (0%) 0/47 (0%)0/50 (0%) 0/50 (0%) 0/50 (0%) 0/50 (0%) 0/50 (0%) 0/50 (0%)0/50 (0%) 1/50 (2%) 0/50 (0%) 0/50 (0%) 0/49 (0%) 0/50 (0%)0/50 (0%) 0/49 (0%) 0/50 (0%) 0/50 (0%) 0/50 (0%) 0/50 (0%)0/50 (0%) 1/50 (2%) 0/50 (0%) 0/48 (0%) 0/50 (0%) 0/50 (0%)0/50 (0%) 0/50 (0%) 0/50 (0%) 0/49 (0%) 0/50 (0%) 0/50 (0%)0/50 (0%) 0/50 (0%) 0/50 (0%) 0/50 (0%) 0/50 (0%) 0/50 (0%)0/50 (0%) 0/50 (0%)
Overall Incidence Total 2/1246 (0.16%) Mean 0.16% SD 0.55% Total 0/1186 (0%) Mean 0% SD 0%
*Kidney: Pelvis and Transitional Epithelium:Papilloma
0/49 (0%) 0/48 (0%) 0/50 (0%) 0/50 (0%) 0/44 (0%) 0/50 (0%)1/50 (2%) 0/50 (0%) 0/50 (0%) 0/49 (0%) 0/47 (0%)0/50 (0%) 0/50 (0%) 0/50 (0%) 0/50 (0%) 0/50 (0%) 0/50 (0%)0/50 (0%) 0/50 (0%) 0/50 (0%) 0/50 (0%) 0/49 (0%) 0/50 (0%)0/50 (0%) 0/49 (0%) 0/50 (0%) 0/50 (0%) 0/50 (0%) 0/50 (0%)0/50 (0%) 0/50 (0%) 0/50 (0%) 0/48 (0%) 0/50 (0%) 0/50 (0%)0/50 (0%) 0/50 (0%) 0/50 (0%) 0/49 (0%) 0/50 (0%) 0/50 (0%)0/50 (0%) 0/50 (0%) 0/50 (0%) 0/50 (0%) 0/50 (0%) 0/50 (0%)0/50 (0%) 0/50 (0%)
Overall Incidence Total 1/1246 (0.08%) Mean 0.08% SD 0.4% Total 0/1186 (0%) Mean 0% SD 0%
*: Denominator is number of animals with tissues examined microscopically#: Denominator is number of animals necropsied

Version: May2011 Toxicology Data Management System Page: 31
Contract/Lab: All Laboratories Tumor Incidence for Selected Control Animal Groups Report Date: 05/18/2011
Species: RATS Route: ALL ROUTES
Strain: F 344/N Vehicle: ALL VEHICLES
Length of Study: CHRONIC
Male Female
*Kidney: Renal Tubule:Adenoma
0/49 (0%) 0/48 (0%) 0/50 (0%) 0/50 (0%) 0/44 (0%) 0/50 (0%)1/50 (2%) 0/50 (0%) 0/50 (0%) 0/49 (0%) 0/47 (0%)1/50 (2%) 0/50 (0%) 0/50 (0%) 0/50 (0%) 0/50 (0%) 0/50 (0%)1/50 (2%) 0/50 (0%) 0/50 (0%) 0/50 (0%) 0/49 (0%) 0/50 (0%)0/50 (0%) 0/49 (0%) 0/50 (0%) 0/50 (0%) 0/50 (0%) 0/50 (0%)0/50 (0%) 0/50 (0%) 1/50 (2%) 0/48 (0%) 0/50 (0%) 0/50 (0%)0/50 (0%) 1/50 (2%) 0/50 (0%) 0/49 (0%) 0/50 (0%) 0/50 (0%)0/50 (0%) 1/50 (2%) 0/50 (0%) 0/50 (0%) 0/50 (0%) 0/50 (0%)0/50 (0%) 0/50 (0%)
Overall Incidence Total 6/1246 (0.48%) Mean 0.48% SD 0.87% Total 0/1186 (0%) Mean 0% SD 0%
*Kidney: Renal Tubule:Carcinoma
0/49 (0%) 0/48 (0%) 0/50 (0%) 0/50 (0%) 0/44 (0%) 0/50 (0%)0/50 (0%) 0/50 (0%) 0/50 (0%) 1/49 (2%) 0/47 (0%)0/50 (0%) 0/50 (0%) 0/50 (0%) 0/50 (0%) 0/50 (0%) 0/50 (0%)1/50 (2%) 0/50 (0%) 0/50 (0%) 0/50 (0%) 0/49 (0%) 0/50 (0%)0/50 (0%) 0/49 (0%) 0/50 (0%) 0/50 (0%) 0/50 (0%) 0/50 (0%)0/50 (0%) 0/50 (0%) 0/50 (0%) 0/48 (0%) 0/50 (0%) 0/50 (0%)0/50 (0%) 0/50 (0%) 0/50 (0%) 0/49 (0%) 0/50 (0%) 0/50 (0%)0/50 (0%) 0/50 (0%) 0/50 (0%) 0/50 (0%) 0/50 (0%) 0/50 (0%)0/50 (0%) 0/50 (0%)
Overall Incidence Total 1/1246 (0.08%) Mean 0.08% SD 0.4% Total 1/1186 (0.08%) Mean 0.09% SD 0.42%
*Kidney: Renal Tubule:Carcinoma or Adenoma
0/49 (0%) 0/48 (0%) 0/50 (0%) 0/50 (0%) 0/44 (0%) 0/50 (0%)1/50 (2%) 0/50 (0%) 0/50 (0%) 1/49 (2%) 0/47 (0%)1/50 (2%) 0/50 (0%) 0/50 (0%) 0/50 (0%) 0/50 (0%) 0/50 (0%)2/50 (4%) 0/50 (0%) 0/50 (0%) 0/50 (0%) 0/49 (0%) 0/50 (0%)0/50 (0%) 0/49 (0%) 0/50 (0%) 0/50 (0%) 0/50 (0%) 0/50 (0%)0/50 (0%) 0/50 (0%) 1/50 (2%) 0/48 (0%) 0/50 (0%) 0/50 (0%)0/50 (0%) 1/50 (2%) 0/50 (0%) 0/49 (0%) 0/50 (0%) 0/50 (0%)0/50 (0%) 1/50 (2%) 0/50 (0%) 0/50 (0%) 0/50 (0%) 0/50 (0%)0/50 (0%) 0/50 (0%)
Overall Incidence Total 7/1246 (0.56%) Mean 0.56% SD 1.08% Total 1/1186 (0.08%) Mean 0.09% SD 0.42%
*: Denominator is number of animals with tissues examined microscopically#: Denominator is number of animals necropsied

Version: May2011 Toxicology Data Management System Page: 32
Contract/Lab: All Laboratories Tumor Incidence for Selected Control Animal Groups Report Date: 05/18/2011
Species: RATS Route: ALL ROUTES
Strain: F 344/N Vehicle: ALL VEHICLES
Length of Study: CHRONIC
Male Female
*Kidney: Renal Tubule:Hemangiosarcoma
0/49 (0%) 0/48 (0%) 0/50 (0%) 0/50 (0%) 0/44 (0%) 0/50 (0%)0/50 (0%) 0/50 (0%) 0/50 (0%) 0/49 (0%) 0/47 (0%)0/50 (0%) 0/50 (0%) 0/50 (0%) 0/50 (0%) 0/50 (0%) 0/50 (0%)0/50 (0%) 0/50 (0%) 0/50 (0%) 0/50 (0%) 0/49 (0%) 0/50 (0%)1/50 (2%) 0/49 (0%) 0/50 (0%) 0/50 (0%) 0/50 (0%) 0/50 (0%)0/50 (0%) 0/50 (0%) 0/50 (0%) 0/48 (0%) 0/50 (0%) 0/50 (0%)0/50 (0%) 0/50 (0%) 0/50 (0%) 0/49 (0%) 0/50 (0%) 0/50 (0%)0/50 (0%) 0/50 (0%) 0/50 (0%) 0/50 (0%) 0/50 (0%) 0/50 (0%)0/50 (0%) 0/50 (0%)
Overall Incidence Total 1/1246 (0.08%) Mean 0.08% SD 0.4% Total 0/1186 (0%) Mean 0% SD 0%
*Kidney: Renal Tubule:Lipoma
0/49 (0%) 0/48 (0%) 1/50 (2%) 0/50 (0%) 0/44 (0%) 0/50 (0%)0/50 (0%) 0/50 (0%) 0/50 (0%) 0/49 (0%) 0/47 (0%)0/50 (0%) 0/50 (0%) 1/50 (2%) 0/50 (0%) 0/50 (0%) 0/50 (0%)0/50 (0%) 0/50 (0%) 0/50 (0%) 0/50 (0%) 0/49 (0%) 0/50 (0%)0/50 (0%) 0/49 (0%) 0/50 (0%) 0/50 (0%) 0/50 (0%) 0/50 (0%)0/50 (0%) 1/50 (2%) 0/50 (0%) 0/48 (0%) 0/50 (0%) 0/50 (0%)0/50 (0%) 0/50 (0%) 0/50 (0%) 0/49 (0%) 0/50 (0%) 1/50 (2%)0/50 (0%) 0/50 (0%) 0/50 (0%) 0/50 (0%) 0/50 (0%) 0/50 (0%)0/50 (0%) 0/50 (0%)
Overall Incidence Total 3/1246 (0.24%) Mean 0.24% SD 0.66% Total 1/1186 (0.08%) Mean 0.08% SD 0.41%
*Kidney: Renal Tubule:Mesenchymal Tumor Benign
0/49 (0%) 0/48 (0%) 0/50 (0%) 0/50 (0%) 0/44 (0%) 0/50 (0%)0/50 (0%) 0/50 (0%) 0/50 (0%) 0/49 (0%) 0/47 (0%)1/50 (2%) 0/50 (0%) 0/50 (0%) 0/50 (0%) 0/50 (0%) 0/50 (0%)0/50 (0%) 0/50 (0%) 0/50 (0%) 0/50 (0%) 0/49 (0%) 0/50 (0%)0/50 (0%) 0/49 (0%) 0/50 (0%) 0/50 (0%) 0/50 (0%) 0/50 (0%)0/50 (0%) 0/50 (0%) 0/50 (0%) 0/48 (0%) 0/50 (0%) 0/50 (0%)0/50 (0%) 0/50 (0%) 0/50 (0%) 0/49 (0%) 0/50 (0%) 0/50 (0%)0/50 (0%) 0/50 (0%) 0/50 (0%) 0/50 (0%) 0/50 (0%) 0/50 (0%)0/50 (0%) 0/50 (0%)
Overall Incidence Total 1/1246 (0.08%) Mean 0.08% SD 0.4% Total 0/1186 (0%) Mean 0% SD 0%
*: Denominator is number of animals with tissues examined microscopically#: Denominator is number of animals necropsied

Version: May2011 Toxicology Data Management System Page: 33
Contract/Lab: All Laboratories Tumor Incidence for Selected Control Animal Groups Report Date: 05/18/2011
Species: RATS Route: ALL ROUTES
Strain: F 344/N Vehicle: ALL VEHICLES
Length of Study: CHRONIC
Male Female
*Kidney: Renal Tubule:Mesenchymal Tumor Malignant
0/49 (0%) 0/48 (0%) 0/50 (0%) 0/50 (0%) 1/44 (2%) 0/50 (0%)0/50 (0%) 0/50 (0%) 0/50 (0%) 0/49 (0%) 0/47 (0%)0/50 (0%) 0/50 (0%) 0/50 (0%) 0/50 (0%) 0/50 (0%) 0/50 (0%)0/50 (0%) 0/50 (0%) 0/50 (0%) 0/50 (0%) 0/49 (0%) 0/50 (0%)0/50 (0%) 0/49 (0%) 0/50 (0%) 0/50 (0%) 0/50 (0%) 0/50 (0%)0/50 (0%) 0/50 (0%) 0/50 (0%) 0/48 (0%) 0/50 (0%) 0/50 (0%)0/50 (0%) 0/50 (0%) 0/50 (0%) 0/49 (0%) 0/50 (0%) 0/50 (0%)0/50 (0%) 0/50 (0%) 0/50 (0%) 0/50 (0%) 0/50 (0%) 0/50 (0%)0/50 (0%) 0/50 (0%)
Overall Incidence Total 0/1246 (0%) Mean 0% SD 0% Total 1/1186 (0.08%) Mean 0.09% SD 0.46%
*Kidney: Renal Tubule:Nephroblastoma
0/49 (0%) 0/48 (0%) 0/50 (0%) 0/50 (0%) 0/44 (0%) 0/50 (0%)0/50 (0%) 0/50 (0%) 0/50 (0%) 0/49 (0%) 0/47 (0%)0/50 (0%) 0/50 (0%) 0/50 (0%) 0/50 (0%) 0/50 (0%) 0/50 (0%)0/50 (0%) 0/50 (0%) 0/50 (0%) 0/50 (0%) 0/49 (0%) 0/50 (0%)0/50 (0%) 0/49 (0%) 0/50 (0%) 0/50 (0%) 0/50 (0%) 0/50 (0%)0/50 (0%) 0/50 (0%) 0/50 (0%) 0/48 (0%) 1/50 (2%) 0/50 (0%)0/50 (0%) 0/50 (0%) 0/50 (0%) 0/49 (0%) 0/50 (0%) 0/50 (0%)0/50 (0%) 0/50 (0%) 0/50 (0%) 0/50 (0%) 0/50 (0%) 0/50 (0%)0/50 (0%) 0/50 (0%)
Overall Incidence Total 0/1246 (0%) Mean 0% SD 0% Total 1/1186 (0.08%) Mean 0.08% SD 0.41%
*Kidney: Renal Tubule:Sarcoma
0/49 (0%) 0/48 (0%) 0/50 (0%) 0/50 (0%) 0/44 (0%) 1/50 (2%)0/50 (0%) 0/50 (0%) 0/50 (0%) 0/49 (0%) 0/47 (0%)0/50 (0%) 0/50 (0%) 0/50 (0%) 0/50 (0%) 0/50 (0%) 0/50 (0%)0/50 (0%) 0/50 (0%) 0/50 (0%) 0/50 (0%) 1/49 (2%) 0/50 (0%)0/50 (0%) 0/49 (0%) 0/50 (0%) 0/50 (0%) 0/50 (0%) 0/50 (0%)0/50 (0%) 0/50 (0%) 0/50 (0%) 0/48 (0%) 0/50 (0%) 0/50 (0%)0/50 (0%) 0/50 (0%) 0/50 (0%) 0/49 (0%) 0/50 (0%) 0/50 (0%)0/50 (0%) 0/50 (0%) 0/50 (0%) 0/50 (0%) 0/50 (0%) 0/50 (0%)0/50 (0%) 1/50 (2%)
Overall Incidence Total 0/1246 (0%) Mean 0% SD 0% Total 3/1186 (0.25%) Mean 0.25% SD 0.68%
*: Denominator is number of animals with tissues examined microscopically#: Denominator is number of animals necropsied
Version: May2011 Toxicology Data Management System Page: 34
Contract/Lab: All Laboratories Tumor Incidence for Selected Control Animal Groups Report Date: 05/18/2011
Species: RATS Route: ALL ROUTES
Strain: F 344/N Vehicle: ALL VEHICLES
Length of Study: CHRONIC
Male Female
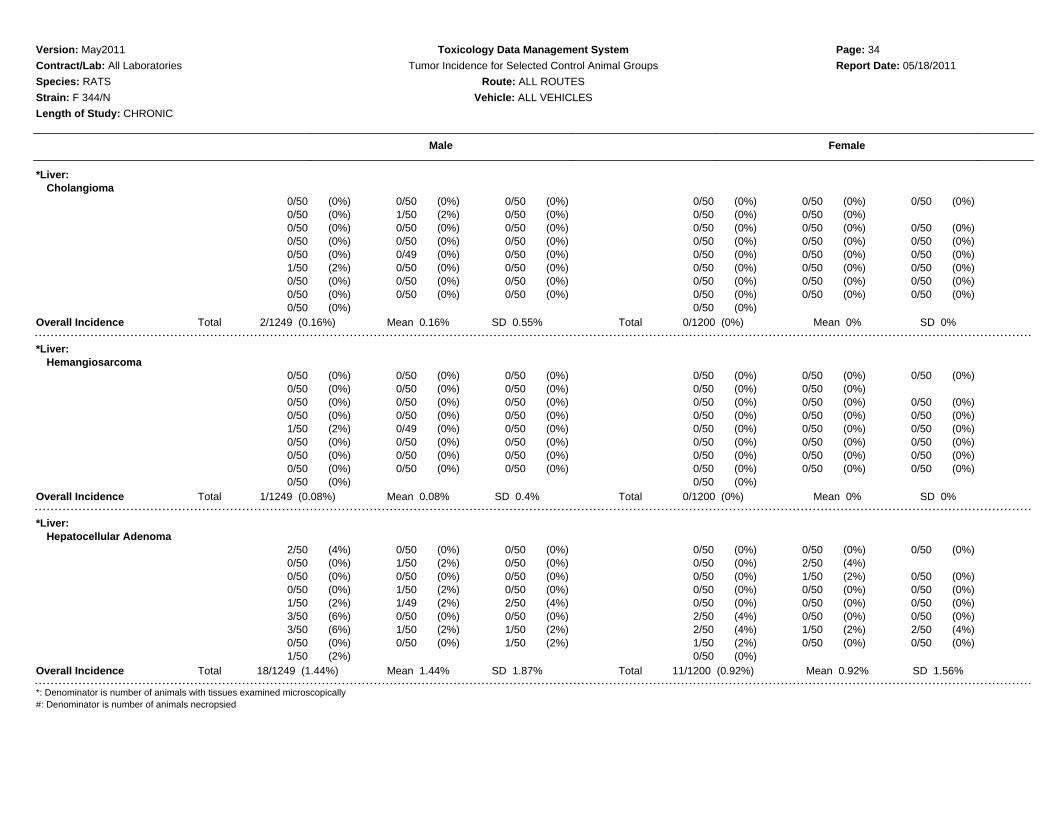
*Liver:Cholangioma
0/50 (0%) 0/50 (0%) 0/50 (0%) 0/50 (0%) 0/50 (0%) 0/50 (0%)0/50 (0%) 1/50 (2%) 0/50 (0%) 0/50 (0%) 0/50 (0%)0/50 (0%) 0/50 (0%) 0/50 (0%) 0/50 (0%) 0/50 (0%) 0/50 (0%)0/50 (0%) 0/50 (0%) 0/50 (0%) 0/50 (0%) 0/50 (0%) 0/50 (0%)0/50 (0%) 0/49 (0%) 0/50 (0%) 0/50 (0%) 0/50 (0%) 0/50 (0%)1/50 (2%) 0/50 (0%) 0/50 (0%) 0/50 (0%) 0/50 (0%) 0/50 (0%)0/50 (0%) 0/50 (0%) 0/50 (0%) 0/50 (0%) 0/50 (0%) 0/50 (0%)0/50 (0%) 0/50 (0%) 0/50 (0%) 0/50 (0%) 0/50 (0%) 0/50 (0%)0/50 (0%) 0/50 (0%)
Overall Incidence Total 2/1249 (0.16%) Mean 0.16% SD 0.55% Total 0/1200 (0%) Mean 0% SD 0%
*Liver:Hemangiosarcoma
0/50 (0%) 0/50 (0%) 0/50 (0%) 0/50 (0%) 0/50 (0%) 0/50 (0%)0/50 (0%) 0/50 (0%) 0/50 (0%) 0/50 (0%) 0/50 (0%)0/50 (0%) 0/50 (0%) 0/50 (0%) 0/50 (0%) 0/50 (0%) 0/50 (0%)0/50 (0%) 0/50 (0%) 0/50 (0%) 0/50 (0%) 0/50 (0%) 0/50 (0%)1/50 (2%) 0/49 (0%) 0/50 (0%) 0/50 (0%) 0/50 (0%) 0/50 (0%)0/50 (0%) 0/50 (0%) 0/50 (0%) 0/50 (0%) 0/50 (0%) 0/50 (0%)0/50 (0%) 0/50 (0%) 0/50 (0%) 0/50 (0%) 0/50 (0%) 0/50 (0%)0/50 (0%) 0/50 (0%) 0/50 (0%) 0/50 (0%) 0/50 (0%) 0/50 (0%)0/50 (0%) 0/50 (0%)
Overall Incidence Total 1/1249 (0.08%) Mean 0.08% SD 0.4% Total 0/1200 (0%) Mean 0% SD 0%
*Liver:Hepatocellular Adenoma
2/50 (4%) 0/50 (0%) 0/50 (0%) 0/50 (0%) 0/50 (0%) 0/50 (0%)0/50 (0%) 1/50 (2%) 0/50 (0%) 0/50 (0%) 2/50 (4%)0/50 (0%) 0/50 (0%) 0/50 (0%) 0/50 (0%) 1/50 (2%) 0/50 (0%)0/50 (0%) 1/50 (2%) 0/50 (0%) 0/50 (0%) 0/50 (0%) 0/50 (0%)1/50 (2%) 1/49 (2%) 2/50 (4%) 0/50 (0%) 0/50 (0%) 0/50 (0%)3/50 (6%) 0/50 (0%) 0/50 (0%) 2/50 (4%) 0/50 (0%) 0/50 (0%)3/50 (6%) 1/50 (2%) 1/50 (2%) 2/50 (4%) 1/50 (2%) 2/50 (4%)0/50 (0%) 0/50 (0%) 1/50 (2%) 1/50 (2%) 0/50 (0%) 0/50 (0%)1/50 (2%) 0/50 (0%)
Overall Incidence Total 18/1249 (1.44%) Mean 1.44% SD 1.87% Total 11/1200 (0.92%) Mean 0.92% SD 1.56%
*: Denominator is number of animals with tissues examined microscopically#: Denominator is number of animals necropsied

Version: May2011 Toxicology Data Management System Page: 35
Contract/Lab: All Laboratories Tumor Incidence for Selected Control Animal Groups Report Date: 05/18/2011
Species: RATS Route: ALL ROUTES
Strain: F 344/N Vehicle: ALL VEHICLES
Length of Study: CHRONIC
Male Female
*Liver:Hepatocellular Carcinoma
0/50 (0%) 0/50 (0%) 0/50 (0%) 0/50 (0%) 0/50 (0%) 0/50 (0%)2/50 (4%) 0/50 (0%) 0/50 (0%) 1/50 (2%) 0/50 (0%)1/50 (2%) 0/50 (0%) 0/50 (0%) 0/50 (0%) 0/50 (0%) 0/50 (0%)1/50 (2%) 0/50 (0%) 0/50 (0%) 0/50 (0%) 0/50 (0%) 0/50 (0%)0/50 (0%) 0/49 (0%) 0/50 (0%) 0/50 (0%) 0/50 (0%) 0/50 (0%)0/50 (0%) 0/50 (0%) 0/50 (0%) 0/50 (0%) 0/50 (0%) 0/50 (0%)0/50 (0%) 0/50 (0%) 0/50 (0%) 0/50 (0%) 0/50 (0%) 0/50 (0%)0/50 (0%) 0/50 (0%) 0/50 (0%) 0/50 (0%) 0/50 (0%) 0/50 (0%)1/50 (2%) 0/50 (0%)
Overall Incidence Total 5/1249 (0.4%) Mean 0.4% SD 1% Total 1/1200 (0.08%) Mean 0.08% SD 0.41%
*Liver:Hepatocellular Carcinoma or Hepatoblastoma
0/50 (0%) 0/50 (0%) 0/50 (0%) 0/50 (0%) 0/50 (0%) 0/50 (0%)2/50 (4%) 0/50 (0%) 0/50 (0%) 1/50 (2%) 0/50 (0%)1/50 (2%) 0/50 (0%) 0/50 (0%) 0/50 (0%) 0/50 (0%) 0/50 (0%)1/50 (2%) 0/50 (0%) 0/50 (0%) 0/50 (0%) 0/50 (0%) 0/50 (0%)0/50 (0%) 0/49 (0%) 0/50 (0%) 0/50 (0%) 0/50 (0%) 0/50 (0%)0/50 (0%) 0/50 (0%) 0/50 (0%) 0/50 (0%) 0/50 (0%) 0/50 (0%)0/50 (0%) 0/50 (0%) 0/50 (0%) 0/50 (0%) 0/50 (0%) 0/50 (0%)0/50 (0%) 0/50 (0%) 0/50 (0%) 0/50 (0%) 0/50 (0%) 0/50 (0%)1/50 (2%) 0/50 (0%)
Overall Incidence Total 5/1249 (0.4%) Mean 0.4% SD 1% Total 1/1200 (0.08%) Mean 0.08% SD 0.41%
*Liver:Hepatocellular Carcinoma or Hepatocellular Adenoma
2/50 (4%) 0/50 (0%) 0/50 (0%) 0/50 (0%) 0/50 (0%) 0/50 (0%)2/50 (4%) 1/50 (2%) 0/50 (0%) 1/50 (2%) 2/50 (4%)1/50 (2%) 0/50 (0%) 0/50 (0%) 0/50 (0%) 1/50 (2%) 0/50 (0%)1/50 (2%) 1/50 (2%) 0/50 (0%) 0/50 (0%) 0/50 (0%) 0/50 (0%)1/50 (2%) 1/49 (2%) 2/50 (4%) 0/50 (0%) 0/50 (0%) 0/50 (0%)3/50 (6%) 0/50 (0%) 0/50 (0%) 2/50 (4%) 0/50 (0%) 0/50 (0%)3/50 (6%) 1/50 (2%) 1/50 (2%) 2/50 (4%) 1/50 (2%) 2/50 (4%)0/50 (0%) 0/50 (0%) 1/50 (2%) 1/50 (2%) 0/50 (0%) 0/50 (0%)2/50 (4%) 0/50 (0%)
Overall Incidence Total 23/1249 (1.84%) Mean 1.84% SD 1.91% Total 12/1200 (1%) Mean 1% SD 1.56%
*: Denominator is number of animals with tissues examined microscopically#: Denominator is number of animals necropsied
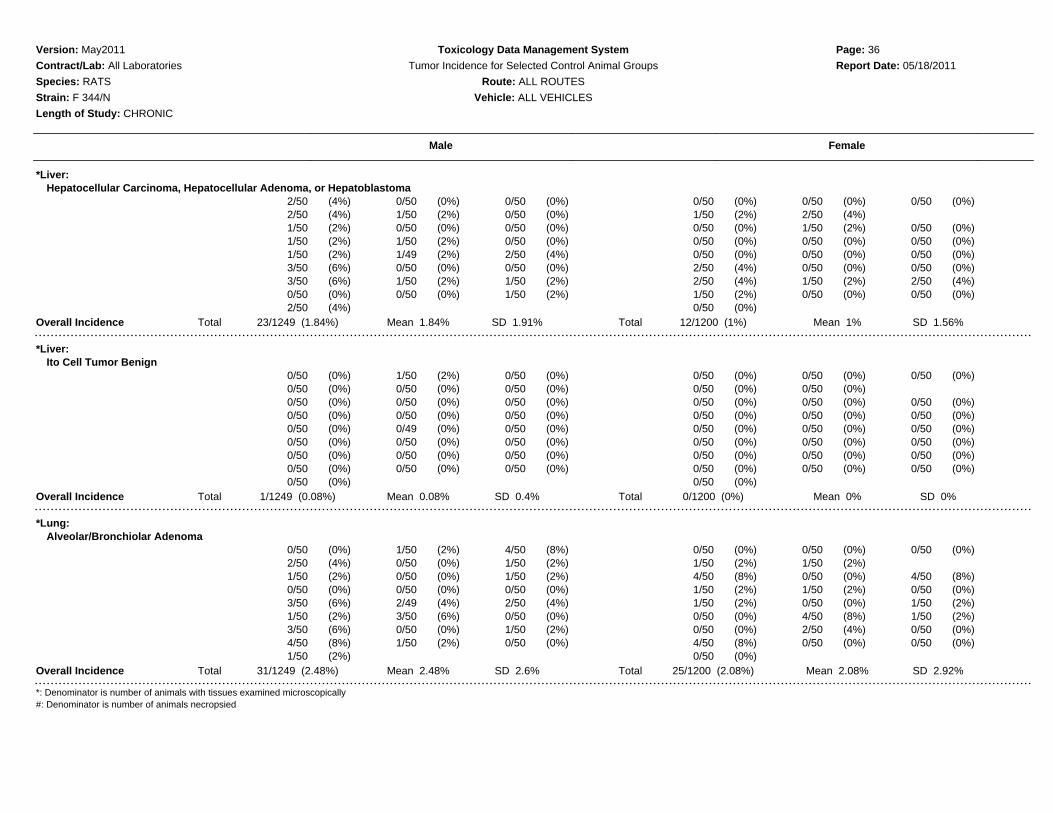
Version: May2011 Toxicology Data Management System Page: 36
Contract/Lab: All Laboratories Tumor Incidence for Selected Control Animal Groups Report Date: 05/18/2011
Species: RATS Route: ALL ROUTES
Strain: F 344/N Vehicle: ALL VEHICLES
Length of Study: CHRONIC
Male Female
*Liver:Hepatocellular Carcinoma, Hepatocellular Adenoma, or Hepatoblastoma
2/50 (4%) 0/50 (0%) 0/50 (0%) 0/50 (0%) 0/50 (0%) 0/50 (0%)2/50 (4%) 1/50 (2%) 0/50 (0%) 1/50 (2%) 2/50 (4%)1/50 (2%) 0/50 (0%) 0/50 (0%) 0/50 (0%) 1/50 (2%) 0/50 (0%)1/50 (2%) 1/50 (2%) 0/50 (0%) 0/50 (0%) 0/50 (0%) 0/50 (0%)1/50 (2%) 1/49 (2%) 2/50 (4%) 0/50 (0%) 0/50 (0%) 0/50 (0%)3/50 (6%) 0/50 (0%) 0/50 (0%) 2/50 (4%) 0/50 (0%) 0/50 (0%)3/50 (6%) 1/50 (2%) 1/50 (2%) 2/50 (4%) 1/50 (2%) 2/50 (4%)0/50 (0%) 0/50 (0%) 1/50 (2%) 1/50 (2%) 0/50 (0%) 0/50 (0%)2/50 (4%) 0/50 (0%)
Overall Incidence Total 23/1249 (1.84%) Mean 1.84% SD 1.91% Total 12/1200 (1%) Mean 1% SD 1.56%
*Liver:Ito Cell Tumor Benign
0/50 (0%) 1/50 (2%) 0/50 (0%) 0/50 (0%) 0/50 (0%) 0/50 (0%)0/50 (0%) 0/50 (0%) 0/50 (0%) 0/50 (0%) 0/50 (0%)0/50 (0%) 0/50 (0%) 0/50 (0%) 0/50 (0%) 0/50 (0%) 0/50 (0%)0/50 (0%) 0/50 (0%) 0/50 (0%) 0/50 (0%) 0/50 (0%) 0/50 (0%)0/50 (0%) 0/49 (0%) 0/50 (0%) 0/50 (0%) 0/50 (0%) 0/50 (0%)0/50 (0%) 0/50 (0%) 0/50 (0%) 0/50 (0%) 0/50 (0%) 0/50 (0%)0/50 (0%) 0/50 (0%) 0/50 (0%) 0/50 (0%) 0/50 (0%) 0/50 (0%)0/50 (0%) 0/50 (0%) 0/50 (0%) 0/50 (0%) 0/50 (0%) 0/50 (0%)0/50 (0%) 0/50 (0%)
Overall Incidence Total 1/1249 (0.08%) Mean 0.08% SD 0.4% Total 0/1200 (0%) Mean 0% SD 0%
*Lung:Alveolar/Bronchiolar Adenoma
0/50 (0%) 1/50 (2%) 4/50 (8%) 0/50 (0%) 0/50 (0%) 0/50 (0%)2/50 (4%) 0/50 (0%) 1/50 (2%) 1/50 (2%) 1/50 (2%)1/50 (2%) 0/50 (0%) 1/50 (2%) 4/50 (8%) 0/50 (0%) 4/50 (8%)0/50 (0%) 0/50 (0%) 0/50 (0%) 1/50 (2%) 1/50 (2%) 0/50 (0%)3/50 (6%) 2/49 (4%) 2/50 (4%) 1/50 (2%) 0/50 (0%) 1/50 (2%)1/50 (2%) 3/50 (6%) 0/50 (0%) 0/50 (0%) 4/50 (8%) 1/50 (2%)3/50 (6%) 0/50 (0%) 1/50 (2%) 0/50 (0%) 2/50 (4%) 0/50 (0%)4/50 (8%) 1/50 (2%) 0/50 (0%) 4/50 (8%) 0/50 (0%) 0/50 (0%)1/50 (2%) 0/50 (0%)
Overall Incidence Total 31/1249 (2.48%) Mean 2.48% SD 2.6% Total 25/1200 (2.08%) Mean 2.08% SD 2.92%
*: Denominator is number of animals with tissues examined microscopically#: Denominator is number of animals necropsied

Version: May2011 Toxicology Data Management System Page: 37
Contract/Lab: All Laboratories Tumor Incidence for Selected Control Animal Groups Report Date: 05/18/2011
Species: RATS Route: ALL ROUTES
Strain: F 344/N Vehicle: ALL VEHICLES
Length of Study: CHRONIC
Male Female
*Lung:Alveolar/Bronchiolar Carcinoma
0/50 (0%) 1/50 (2%) 1/50 (2%) 0/50 (0%) 0/50 (0%) 0/50 (0%)1/50 (2%) 0/50 (0%) 0/50 (0%) 1/50 (2%) 0/50 (0%)1/50 (2%) 1/50 (2%) 0/50 (0%) 1/50 (2%) 0/50 (0%) 0/50 (0%)0/50 (0%) 1/50 (2%) 1/50 (2%) 0/50 (0%) 0/50 (0%) 0/50 (0%)1/50 (2%) 1/49 (2%) 0/50 (0%) 0/50 (0%) 0/50 (0%) 0/50 (0%)0/50 (0%) 0/50 (0%) 0/50 (0%) 1/50 (2%) 0/50 (0%) 0/50 (0%)0/50 (0%) 1/50 (2%) 3/50 (6%) 0/50 (0%) 0/50 (0%) 0/50 (0%)0/50 (0%) 0/50 (0%) 1/50 (2%) 0/50 (0%) 0/50 (0%) 0/50 (0%)1/50 (2%) 0/50 (0%)
Overall Incidence Total 15/1249 (1.2%) Mean 1.2% SD 1.42% Total 3/1200 (0.25%) Mean 0.25% SD 0.68%
*Lung:Alveolar/Bronchiolar Carcinoma or Alveolar/Bronchiolar Adenoma
0/50 (0%) 2/50 (4%) 5/50 (10%) 0/50 (0%) 0/50 (0%) 0/50 (0%)3/50 (6%) 0/50 (0%) 1/50 (2%) 2/50 (4%) 1/50 (2%)2/50 (4%) 1/50 (2%) 1/50 (2%) 4/50 (8%) 0/50 (0%) 4/50 (8%)0/50 (0%) 1/50 (2%) 1/50 (2%) 1/50 (2%) 1/50 (2%) 0/50 (0%)4/50 (8%) 2/49 (4%) 2/50 (4%) 1/50 (2%) 0/50 (0%) 1/50 (2%)1/50 (2%) 3/50 (6%) 0/50 (0%) 1/50 (2%) 4/50 (8%) 1/50 (2%)3/50 (6%) 1/50 (2%) 4/50 (8%) 0/50 (0%) 2/50 (4%) 0/50 (0%)4/50 (8%) 1/50 (2%) 1/50 (2%) 4/50 (8%) 0/50 (0%) 0/50 (0%)2/50 (4%) 0/50 (0%)
Overall Incidence Total 45/1249 (3.6%) Mean 3.6% SD 2.83% Total 27/1200 (2.25%) Mean 2.25% SD 2.91%
*Lung:Fibrosarcoma
0/50 (0%) 0/50 (0%) 0/50 (0%) 0/50 (0%) 0/50 (0%) 0/50 (0%)0/50 (0%) 0/50 (0%) 0/50 (0%) 0/50 (0%) 0/50 (0%)0/50 (0%) 0/50 (0%) 0/50 (0%) 0/50 (0%) 0/50 (0%) 0/50 (0%)0/50 (0%) 0/50 (0%) 0/50 (0%) 0/50 (0%) 0/50 (0%) 0/50 (0%)0/50 (0%) 0/49 (0%) 0/50 (0%) 0/50 (0%) 1/50 (2%) 0/50 (0%)0/50 (0%) 0/50 (0%) 0/50 (0%) 0/50 (0%) 0/50 (0%) 0/50 (0%)0/50 (0%) 0/50 (0%) 0/50 (0%) 0/50 (0%) 0/50 (0%) 0/50 (0%)0/50 (0%) 0/50 (0%) 0/50 (0%) 0/50 (0%) 0/50 (0%) 0/50 (0%)0/50 (0%) 0/50 (0%)
Overall Incidence Total 0/1249 (0%) Mean 0% SD 0% Total 1/1200 (0.08%) Mean 0.08% SD 0.41%
*: Denominator is number of animals with tissues examined microscopically#: Denominator is number of animals necropsied

Version: May2011 Toxicology Data Management System Page: 38
Contract/Lab: All Laboratories Tumor Incidence for Selected Control Animal Groups Report Date: 05/18/2011
Species: RATS Route: ALL ROUTES
Strain: F 344/N Vehicle: ALL VEHICLES
Length of Study: CHRONIC
Male Female
*Lung:Hemangiosarcoma
1/50 (2%) 0/50 (0%) 0/50 (0%) 0/50 (0%) 0/50 (0%) 0/50 (0%)0/50 (0%) 0/50 (0%) 0/50 (0%) 0/50 (0%) 0/50 (0%)0/50 (0%) 0/50 (0%) 0/50 (0%) 0/50 (0%) 0/50 (0%) 0/50 (0%)0/50 (0%) 0/50 (0%) 0/50 (0%) 0/50 (0%) 0/50 (0%) 0/50 (0%)1/50 (2%) 0/49 (0%) 0/50 (0%) 0/50 (0%) 0/50 (0%) 0/50 (0%)0/50 (0%) 0/50 (0%) 0/50 (0%) 0/50 (0%) 0/50 (0%) 0/50 (0%)0/50 (0%) 0/50 (0%) 0/50 (0%) 0/50 (0%) 0/50 (0%) 0/50 (0%)0/50 (0%) 0/50 (0%) 0/50 (0%) 0/50 (0%) 0/50 (0%) 0/50 (0%)0/50 (0%) 0/50 (0%)
Overall Incidence Total 2/1249 (0.16%) Mean 0.16% SD 0.55% Total 0/1200 (0%) Mean 0% SD 0%
*Lung:Squamous Cell Carcinoma
0/50 (0%) 0/50 (0%) 0/50 (0%) 0/50 (0%) 0/50 (0%) 0/50 (0%)0/50 (0%) 1/50 (2%) 0/50 (0%) 0/50 (0%) 0/50 (0%)0/50 (0%) 0/50 (0%) 0/50 (0%) 0/50 (0%) 0/50 (0%) 0/50 (0%)0/50 (0%) 0/50 (0%) 0/50 (0%) 0/50 (0%) 0/50 (0%) 0/50 (0%)0/50 (0%) 0/49 (0%) 0/50 (0%) 0/50 (0%) 0/50 (0%) 0/50 (0%)0/50 (0%) 0/50 (0%) 0/50 (0%) 0/50 (0%) 1/50 (2%) 0/50 (0%)0/50 (0%) 0/50 (0%) 0/50 (0%) 0/50 (0%) 0/50 (0%) 0/50 (0%)0/50 (0%) 0/50 (0%) 0/50 (0%) 0/50 (0%) 0/50 (0%) 0/50 (0%)0/50 (0%) 0/50 (0%)
Overall Incidence Total 1/1249 (0.08%) Mean 0.08% SD 0.4% Total 1/1200 (0.08%) Mean 0.08% SD 0.41%
#Lymph Node:Hemangiosarcoma
1/50 (2%) 0/50 (0%) 0/50 (0%) 0/50 (0%) 0/50 (0%) 0/50 (0%)0/50 (0%) 0/50 (0%) 0/50 (0%) 0/50 (0%) 0/50 (0%)0/50 (0%) 0/50 (0%) 0/50 (0%) 0/50 (0%) 0/50 (0%) 0/50 (0%)0/50 (0%) 0/50 (0%) 0/50 (0%) 0/50 (0%) 0/50 (0%) 0/50 (0%)0/50 (0%) 0/49 (0%) 0/50 (0%) 0/50 (0%) 0/50 (0%) 0/50 (0%)0/50 (0%) 0/50 (0%) 0/50 (0%) 0/50 (0%) 0/50 (0%) 0/50 (0%)0/50 (0%) 0/50 (0%) 0/50 (0%) 0/50 (0%) 0/50 (0%) 0/50 (0%)0/50 (0%) 0/50 (0%) 0/50 (0%) 0/50 (0%) 0/50 (0%) 0/50 (0%)0/50 (0%) 0/50 (0%)
Overall Incidence Total 1/1249 (0.08%) Mean 0.08% SD 0.4% Total 0/1200 (0%) Mean 0% SD 0%
*: Denominator is number of animals with tissues examined microscopically#: Denominator is number of animals necropsied

Version: May2011 Toxicology Data Management System Page: 39
Contract/Lab: All Laboratories Tumor Incidence for Selected Control Animal Groups Report Date: 05/18/2011
Species: RATS Route: ALL ROUTES
Strain: F 344/N Vehicle: ALL VEHICLES
Length of Study: CHRONIC
Male Female
#Mammary Gland:Adenolipoma
0/50 (0%) 0/50 (0%) 0/50 (0%) 0/50 (0%) 0/50 (0%) 0/50 (0%)0/50 (0%) 0/50 (0%) 0/50 (0%) 0/50 (0%) 0/50 (0%)0/50 (0%) 0/50 (0%) 0/50 (0%) 0/50 (0%) 0/50 (0%) 0/50 (0%)0/50 (0%) 0/50 (0%) 0/50 (0%) 0/50 (0%) 0/50 (0%) 0/50 (0%)0/50 (0%) 0/49 (0%) 0/50 (0%) 0/50 (0%) 1/50 (2%) 0/50 (0%)0/50 (0%) 0/50 (0%) 0/50 (0%) 0/50 (0%) 0/50 (0%) 0/50 (0%)0/50 (0%) 0/50 (0%) 0/50 (0%) 0/50 (0%) 0/50 (0%) 0/50 (0%)0/50 (0%) 0/50 (0%) 0/50 (0%) 0/50 (0%) 0/50 (0%) 0/50 (0%)0/50 (0%) 0/50 (0%)
Overall Incidence Total 0/1249 (0%) Mean 0% SD 0% Total 1/1200 (0.08%) Mean 0.08% SD 0.41%
#Mammary Gland:Adenoma
0/50 (0%) 0/50 (0%) 0/50 (0%) 1/50 (2%) 1/50 (2%) 0/50 (0%)0/50 (0%) 0/50 (0%) 1/50 (2%) 0/50 (0%) 1/50 (2%)0/50 (0%) 0/50 (0%) 0/50 (0%) 1/50 (2%) 1/50 (2%) 0/50 (0%)0/50 (0%) 0/50 (0%) 0/50 (0%) 2/50 (4%) 2/50 (4%) 2/50 (4%)0/50 (0%) 0/49 (0%) 0/50 (0%) 0/50 (0%) 2/50 (4%) 1/50 (2%)0/50 (0%) 0/50 (0%) 0/50 (0%) 0/50 (0%) 0/50 (0%) 0/50 (0%)0/50 (0%) 0/50 (0%) 0/50 (0%) 0/50 (0%) 2/50 (4%) 2/50 (4%)0/50 (0%) 0/50 (0%) 0/50 (0%) 2/50 (4%) 0/50 (0%) 0/50 (0%)0/50 (0%) 4/50 (8%)
Overall Incidence Total 1/1249 (0.08%) Mean 0.08% SD 0.4% Total 24/1200 (2%) Mean 2% SD 2.13%
#Mammary Gland:Carcinoma
0/50 (0%) 0/50 (0%) 0/50 (0%) 2/50 (4%) 2/50 (4%) 1/50 (2%)0/50 (0%) 0/50 (0%) 0/50 (0%) 4/50 (8%) 0/50 (0%)0/50 (0%) 0/50 (0%) 0/50 (0%) 2/50 (4%) 9/50 (18%) 0/50 (0%)0/50 (0%) 0/50 (0%) 0/50 (0%) 0/50 (0%) 4/50 (8%) 0/50 (0%)0/50 (0%) 0/49 (0%) 0/50 (0%) 4/50 (8%) 1/50 (2%) 2/50 (4%)0/50 (0%) 0/50 (0%) 0/50 (0%) 4/50 (8%) 0/50 (0%) 1/50 (2%)0/50 (0%) 0/50 (0%) 1/50 (2%) 2/50 (4%) 0/50 (0%) 1/50 (2%)1/50 (2%) 0/50 (0%) 0/50 (0%) 0/50 (0%) 2/50 (4%) 3/50 (6%)0/50 (0%) 3/50 (6%)
Overall Incidence Total 2/1249 (0.16%) Mean 0.16% SD 0.55% Total 47/1200 (3.92%) Mean 3.92% SD 4.15%
*: Denominator is number of animals with tissues examined microscopically#: Denominator is number of animals necropsied

Version: May2011 Toxicology Data Management System Page: 40
Contract/Lab: All Laboratories Tumor Incidence for Selected Control Animal Groups Report Date: 05/18/2011
Species: RATS Route: ALL ROUTES
Strain: F 344/N Vehicle: ALL VEHICLES
Length of Study: CHRONIC
Male Female
#Mammary Gland:Carcinoma or Adenoma
0/50 (0%) 0/50 (0%) 0/50 (0%) 3/50 (6%) 3/50 (6%) 1/50 (2%)0/50 (0%) 0/50 (0%) 1/50 (2%) 4/50 (8%) 1/50 (2%)0/50 (0%) 0/50 (0%) 0/50 (0%) 3/50 (6%) 10/50 (20%) 0/50 (0%)0/50 (0%) 0/50 (0%) 0/50 (0%) 2/50 (4%) 6/50 (12%) 2/50 (4%)0/50 (0%) 0/49 (0%) 0/50 (0%) 4/50 (8%) 3/50 (6%) 3/50 (6%)0/50 (0%) 0/50 (0%) 0/50 (0%) 4/50 (8%) 0/50 (0%) 1/50 (2%)0/50 (0%) 0/50 (0%) 1/50 (2%) 2/50 (4%) 2/50 (4%) 3/50 (6%)1/50 (2%) 0/50 (0%) 0/50 (0%) 2/50 (4%) 2/50 (4%) 3/50 (6%)0/50 (0%) 6/50 (12%)
Overall Incidence Total 3/1249 (0.24%) Mean 0.24% SD 0.66% Total 70/1200 (5.83%) Mean 5.83% SD 4.29%
#Mammary Gland:Fibroadenoma
2/50 (4%) 3/50 (6%) 3/50 (6%) 35/50 (70%) 26/50 (52%) 16/50 (32%)2/50 (4%) 2/50 (4%) 0/50 (0%) 25/50 (50%) 29/50 (58%)1/50 (2%) 2/50 (4%) 2/50 (4%) 14/50 (28%) 27/50 (54%) 23/50 (46%)2/50 (4%) 1/50 (2%) 1/50 (2%) 32/50 (64%) 30/50 (60%) 29/50 (58%)4/50 (8%) 0/49 (0%) 2/50 (4%) 26/50 (52%) 24/50 (48%) 19/50 (38%)0/50 (0%) 0/50 (0%) 0/50 (0%) 28/50 (56%) 17/50 (34%) 29/50 (58%)1/50 (2%) 1/50 (2%) 0/50 (0%) 34/50 (68%) 21/50 (42%) 24/50 (48%)2/50 (4%) 1/50 (2%) 1/50 (2%) 37/50 (74%) 36/50 (72%) 14/50 (28%)1/50 (2%) 22/50 (44%)
Overall Incidence Total 34/1249 (2.72%) Mean 2.72% SD 2.15% Total 617/1200 (51.42%) Mean 51.42% SD 13.35%
#Mammary Gland:Fibroma
1/50 (2%) 0/50 (0%) 0/50 (0%) 0/50 (0%) 1/50 (2%) 0/50 (0%)0/50 (0%) 0/50 (0%) 0/50 (0%) 0/50 (0%) 0/50 (0%)0/50 (0%) 0/50 (0%) 0/50 (0%) 0/50 (0%) 0/50 (0%) 0/50 (0%)0/50 (0%) 0/50 (0%) 0/50 (0%) 0/50 (0%) 0/50 (0%) 0/50 (0%)0/50 (0%) 0/49 (0%) 0/50 (0%) 0/50 (0%) 0/50 (0%) 0/50 (0%)0/50 (0%) 0/50 (0%) 0/50 (0%) 0/50 (0%) 0/50 (0%) 0/50 (0%)0/50 (0%) 0/50 (0%) 0/50 (0%) 0/50 (0%) 0/50 (0%) 0/50 (0%)0/50 (0%) 0/50 (0%) 0/50 (0%) 0/50 (0%) 0/50 (0%) 0/50 (0%)0/50 (0%) 0/50 (0%)
Overall Incidence Total 1/1249 (0.08%) Mean 0.08% SD 0.4% Total 1/1200 (0.08%) Mean 0.08% SD 0.41%
*: Denominator is number of animals with tissues examined microscopically#: Denominator is number of animals necropsied

Version: May2011 Toxicology Data Management System Page: 41
Contract/Lab: All Laboratories Tumor Incidence for Selected Control Animal Groups Report Date: 05/18/2011
Species: RATS Route: ALL ROUTES
Strain: F 344/N Vehicle: ALL VEHICLES
Length of Study: CHRONIC
Male Female
#Mammary Gland:Fibroma, Fibroadenoma or Adenoma
3/50 (6%) 3/50 (6%) 3/50 (6%) 36/50 (72%) 28/50 (56%) 16/50 (32%)2/50 (4%) 2/50 (4%) 1/50 (2%) 25/50 (50%) 30/50 (60%)1/50 (2%) 2/50 (4%) 2/50 (4%) 15/50 (30%) 27/50 (54%) 23/50 (46%)2/50 (4%) 1/50 (2%) 1/50 (2%) 33/50 (66%) 30/50 (60%) 30/50 (60%)4/50 (8%) 0/49 (0%) 2/50 (4%) 26/50 (52%) 25/50 (50%) 19/50 (38%)0/50 (0%) 0/50 (0%) 0/50 (0%) 28/50 (56%) 17/50 (34%) 29/50 (58%)1/50 (2%) 1/50 (2%) 0/50 (0%) 34/50 (68%) 22/50 (44%) 25/50 (50%)2/50 (4%) 1/50 (2%) 1/50 (2%) 37/50 (74%) 36/50 (72%) 14/50 (28%)1/50 (2%) 25/50 (50%)
Overall Incidence Total 36/1249 (2.88%) Mean 2.88% SD 2.17% Total 630/1200 (52.5%) Mean 52.5% SD 13.34%
#Mammary Gland:Fibroma, Fibroadenoma, Carcinoma, or Adenoma
3/50 (6%) 3/50 (6%) 3/50 (6%) 37/50 (74%) 30/50 (60%) 17/50 (34%)2/50 (4%) 2/50 (4%) 1/50 (2%) 27/50 (54%) 30/50 (60%)1/50 (2%) 2/50 (4%) 2/50 (4%) 17/50 (34%) 30/50 (60%) 23/50 (46%)2/50 (4%) 1/50 (2%) 1/50 (2%) 33/50 (66%) 31/50 (62%) 30/50 (60%)4/50 (8%) 0/49 (0%) 2/50 (4%) 28/50 (56%) 26/50 (52%) 21/50 (42%)0/50 (0%) 0/50 (0%) 0/50 (0%) 28/50 (56%) 17/50 (34%) 30/50 (60%)1/50 (2%) 1/50 (2%) 1/50 (2%) 34/50 (68%) 22/50 (44%) 26/50 (52%)3/50 (6%) 1/50 (2%) 1/50 (2%) 37/50 (74%) 36/50 (72%) 16/50 (32%)1/50 (2%) 25/50 (50%)
Overall Incidence Total 38/1249 (3.04%) Mean 3.04% SD 2.17% Total 651/1200 (54.25%) Mean 54.25% SD 12.74%
#Mesentery:Fibrous Histiocytoma
0/50 (0%) 0/50 (0%) 0/50 (0%) 0/50 (0%) 0/50 (0%) 0/50 (0%)0/50 (0%) 0/50 (0%) 0/50 (0%) 0/50 (0%) 0/50 (0%)0/50 (0%) 0/50 (0%) 0/50 (0%) 0/50 (0%) 0/50 (0%) 0/50 (0%)0/50 (0%) 0/50 (0%) 0/50 (0%) 0/50 (0%) 0/50 (0%) 0/50 (0%)0/50 (0%) 0/49 (0%) 0/50 (0%) 0/50 (0%) 0/50 (0%) 0/50 (0%)0/50 (0%) 0/50 (0%) 0/50 (0%) 0/50 (0%) 0/50 (0%) 0/50 (0%)0/50 (0%) 0/50 (0%) 1/50 (2%) 0/50 (0%) 0/50 (0%) 0/50 (0%)0/50 (0%) 0/50 (0%) 0/50 (0%) 0/50 (0%) 0/50 (0%) 0/50 (0%)0/50 (0%) 0/50 (0%)
Overall Incidence Total 1/1249 (0.08%) Mean 0.08% SD 0.4% Total 0/1200 (0%) Mean 0% SD 0%
*: Denominator is number of animals with tissues examined microscopically#: Denominator is number of animals necropsied

Version: May2011 Toxicology Data Management System Page: 42
Contract/Lab: All Laboratories Tumor Incidence for Selected Control Animal Groups Report Date: 05/18/2011
Species: RATS Route: ALL ROUTES
Strain: F 344/N Vehicle: ALL VEHICLES
Length of Study: CHRONIC
Male Female
#Mesentery:Hemangiosarcoma
0/50 (0%) 0/50 (0%) 0/50 (0%) 0/50 (0%) 0/50 (0%) 0/50 (0%)0/50 (0%) 1/50 (2%) 0/50 (0%) 0/50 (0%) 0/50 (0%)0/50 (0%) 0/50 (0%) 0/50 (0%) 0/50 (0%) 0/50 (0%) 0/50 (0%)0/50 (0%) 0/50 (0%) 0/50 (0%) 0/50 (0%) 0/50 (0%) 0/50 (0%)0/50 (0%) 0/49 (0%) 0/50 (0%) 0/50 (0%) 0/50 (0%) 0/50 (0%)0/50 (0%) 0/50 (0%) 0/50 (0%) 0/50 (0%) 0/50 (0%) 0/50 (0%)0/50 (0%) 0/50 (0%) 0/50 (0%) 0/50 (0%) 0/50 (0%) 0/50 (0%)0/50 (0%) 0/50 (0%) 0/50 (0%) 0/50 (0%) 0/50 (0%) 0/50 (0%)0/50 (0%) 0/50 (0%)
Overall Incidence Total 1/1249 (0.08%) Mean 0.08% SD 0.4% Total 0/1200 (0%) Mean 0% SD 0%
#Mesentery:Lipoma
0/50 (0%) 0/50 (0%) 0/50 (0%) 0/50 (0%) 0/50 (0%) 0/50 (0%)0/50 (0%) 0/50 (0%) 0/50 (0%) 0/50 (0%) 0/50 (0%)0/50 (0%) 0/50 (0%) 0/50 (0%) 0/50 (0%) 0/50 (0%) 0/50 (0%)0/50 (0%) 1/50 (2%) 0/50 (0%) 0/50 (0%) 0/50 (0%) 0/50 (0%)0/50 (0%) 0/49 (0%) 0/50 (0%) 0/50 (0%) 0/50 (0%) 0/50 (0%)0/50 (0%) 0/50 (0%) 0/50 (0%) 0/50 (0%) 0/50 (0%) 0/50 (0%)0/50 (0%) 0/50 (0%) 0/50 (0%) 0/50 (0%) 0/50 (0%) 0/50 (0%)0/50 (0%) 0/50 (0%) 0/50 (0%) 0/50 (0%) 0/50 (0%) 0/50 (0%)0/50 (0%) 0/50 (0%)
Overall Incidence Total 1/1249 (0.08%) Mean 0.08% SD 0.4% Total 0/1200 (0%) Mean 0% SD 0%
#Mesentery:Schwannoma Malignant
0/50 (0%) 0/50 (0%) 0/50 (0%) 0/50 (0%) 0/50 (0%) 0/50 (0%)0/50 (0%) 0/50 (0%) 0/50 (0%) 0/50 (0%) 0/50 (0%)0/50 (0%) 0/50 (0%) 0/50 (0%) 0/50 (0%) 0/50 (0%) 0/50 (0%)0/50 (0%) 0/50 (0%) 0/50 (0%) 0/50 (0%) 0/50 (0%) 0/50 (0%)0/50 (0%) 0/49 (0%) 1/50 (2%) 0/50 (0%) 0/50 (0%) 0/50 (0%)0/50 (0%) 0/50 (0%) 0/50 (0%) 0/50 (0%) 0/50 (0%) 0/50 (0%)0/50 (0%) 0/50 (0%) 0/50 (0%) 0/50 (0%) 0/50 (0%) 2/50 (4%)0/50 (0%) 0/50 (0%) 0/50 (0%) 0/50 (0%) 0/50 (0%) 0/50 (0%)0/50 (0%) 0/50 (0%)
Overall Incidence Total 1/1249 (0.08%) Mean 0.08% SD 0.4% Total 2/1200 (0.17%) Mean 0.17% SD 0.82%
*: Denominator is number of animals with tissues examined microscopically#: Denominator is number of animals necropsied
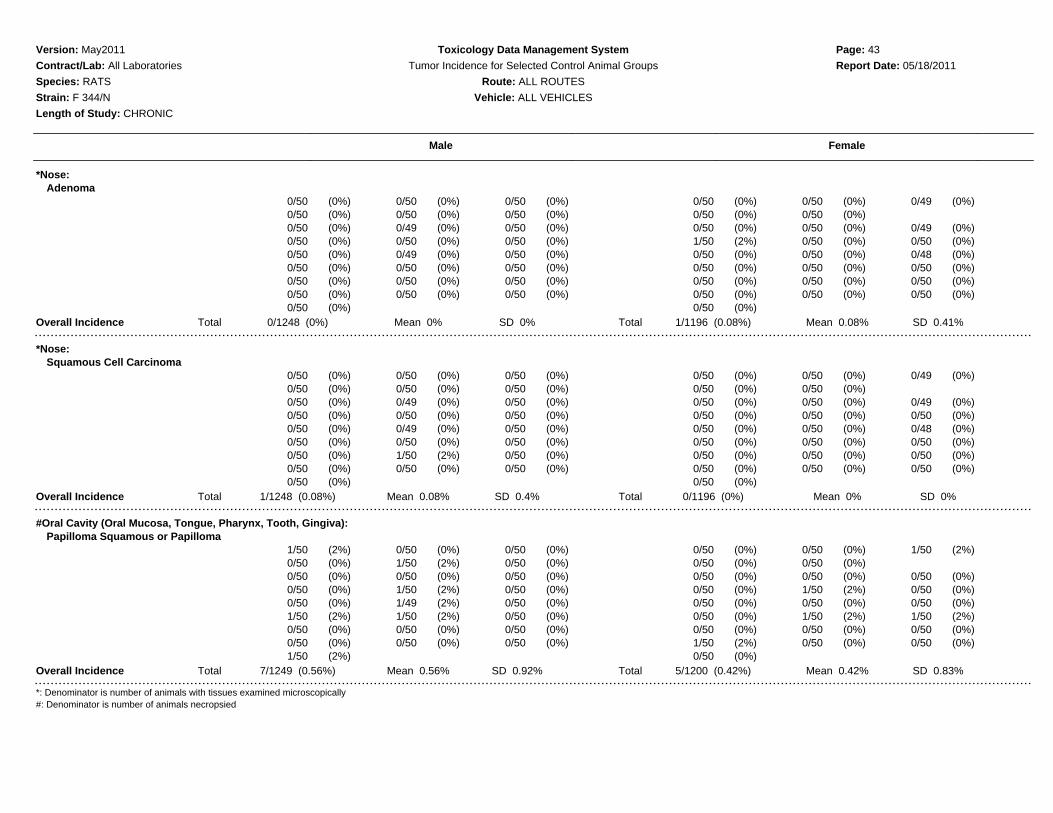
Version: May2011 Toxicology Data Management System Page: 43
Contract/Lab: All Laboratories Tumor Incidence for Selected Control Animal Groups Report Date: 05/18/2011
Species: RATS Route: ALL ROUTES
Strain: F 344/N Vehicle: ALL VEHICLES
Length of Study: CHRONIC
Male Female
*Nose:Adenoma
0/50 (0%) 0/50 (0%) 0/50 (0%) 0/50 (0%) 0/50 (0%) 0/49 (0%)0/50 (0%) 0/50 (0%) 0/50 (0%) 0/50 (0%) 0/50 (0%)0/50 (0%) 0/49 (0%) 0/50 (0%) 0/50 (0%) 0/50 (0%) 0/49 (0%)0/50 (0%) 0/50 (0%) 0/50 (0%) 1/50 (2%) 0/50 (0%) 0/50 (0%)0/50 (0%) 0/49 (0%) 0/50 (0%) 0/50 (0%) 0/50 (0%) 0/48 (0%)0/50 (0%) 0/50 (0%) 0/50 (0%) 0/50 (0%) 0/50 (0%) 0/50 (0%)0/50 (0%) 0/50 (0%) 0/50 (0%) 0/50 (0%) 0/50 (0%) 0/50 (0%)0/50 (0%) 0/50 (0%) 0/50 (0%) 0/50 (0%) 0/50 (0%) 0/50 (0%)0/50 (0%) 0/50 (0%)
Overall Incidence Total 0/1248 (0%) Mean 0% SD 0% Total 1/1196 (0.08%) Mean 0.08% SD 0.41%
*Nose:Squamous Cell Carcinoma
0/50 (0%) 0/50 (0%) 0/50 (0%) 0/50 (0%) 0/50 (0%) 0/49 (0%)0/50 (0%) 0/50 (0%) 0/50 (0%) 0/50 (0%) 0/50 (0%)0/50 (0%) 0/49 (0%) 0/50 (0%) 0/50 (0%) 0/50 (0%) 0/49 (0%)0/50 (0%) 0/50 (0%) 0/50 (0%) 0/50 (0%) 0/50 (0%) 0/50 (0%)0/50 (0%) 0/49 (0%) 0/50 (0%) 0/50 (0%) 0/50 (0%) 0/48 (0%)0/50 (0%) 0/50 (0%) 0/50 (0%) 0/50 (0%) 0/50 (0%) 0/50 (0%)0/50 (0%) 1/50 (2%) 0/50 (0%) 0/50 (0%) 0/50 (0%) 0/50 (0%)0/50 (0%) 0/50 (0%) 0/50 (0%) 0/50 (0%) 0/50 (0%) 0/50 (0%)0/50 (0%) 0/50 (0%)
Overall Incidence Total 1/1248 (0.08%) Mean 0.08% SD 0.4% Total 0/1196 (0%) Mean 0% SD 0%
#Oral Cavity (Oral Mucosa, Tongue, Pharynx, Tooth, Gingiva):Papilloma Squamous or Papilloma
1/50 (2%) 0/50 (0%) 0/50 (0%) 0/50 (0%) 0/50 (0%) 1/50 (2%)0/50 (0%) 1/50 (2%) 0/50 (0%) 0/50 (0%) 0/50 (0%)0/50 (0%) 0/50 (0%) 0/50 (0%) 0/50 (0%) 0/50 (0%) 0/50 (0%)0/50 (0%) 1/50 (2%) 0/50 (0%) 0/50 (0%) 1/50 (2%) 0/50 (0%)0/50 (0%) 1/49 (2%) 0/50 (0%) 0/50 (0%) 0/50 (0%) 0/50 (0%)1/50 (2%) 1/50 (2%) 0/50 (0%) 0/50 (0%) 1/50 (2%) 1/50 (2%)0/50 (0%) 0/50 (0%) 0/50 (0%) 0/50 (0%) 0/50 (0%) 0/50 (0%)0/50 (0%) 0/50 (0%) 0/50 (0%) 1/50 (2%) 0/50 (0%) 0/50 (0%)1/50 (2%) 0/50 (0%)
Overall Incidence Total 7/1249 (0.56%) Mean 0.56% SD 0.92% Total 5/1200 (0.42%) Mean 0.42% SD 0.83%
*: Denominator is number of animals with tissues examined microscopically#: Denominator is number of animals necropsied
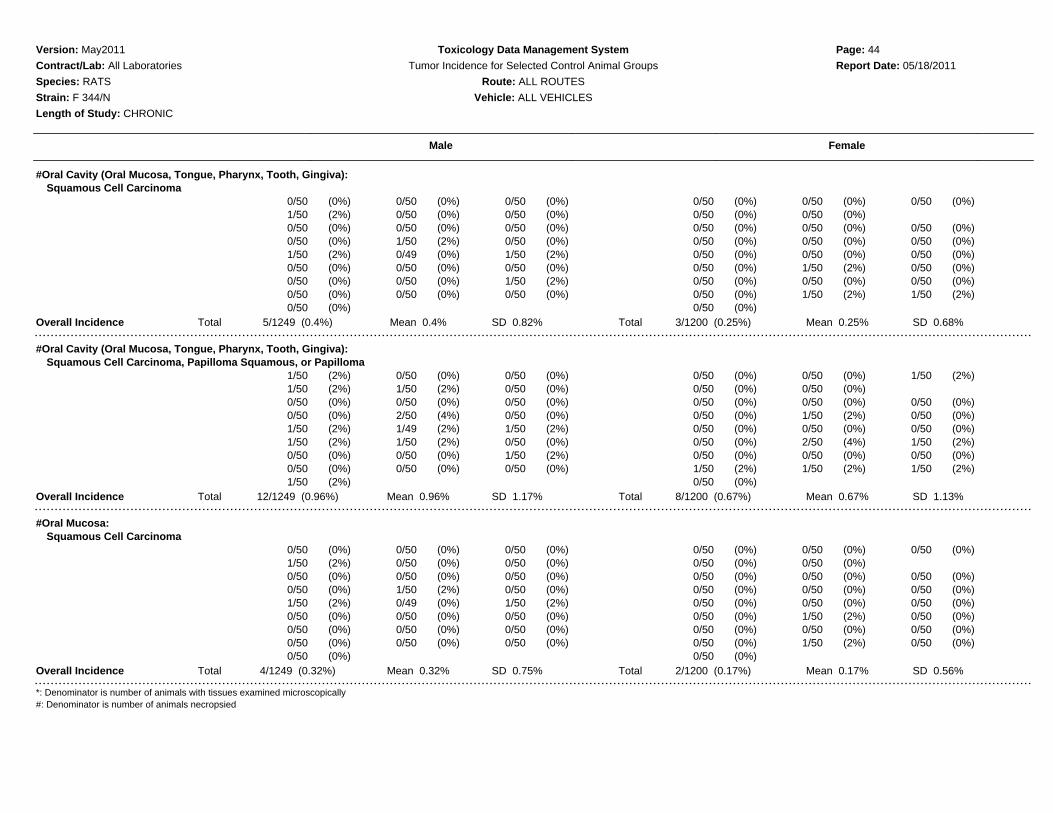
Version: May2011 Toxicology Data Management System Page: 44
Contract/Lab: All Laboratories Tumor Incidence for Selected Control Animal Groups Report Date: 05/18/2011
Species: RATS Route: ALL ROUTES
Strain: F 344/N Vehicle: ALL VEHICLES
Length of Study: CHRONIC
Male Female
#Oral Cavity (Oral Mucosa, Tongue, Pharynx, Tooth, Gingiva):Squamous Cell Carcinoma
0/50 (0%) 0/50 (0%) 0/50 (0%) 0/50 (0%) 0/50 (0%) 0/50 (0%)1/50 (2%) 0/50 (0%) 0/50 (0%) 0/50 (0%) 0/50 (0%)0/50 (0%) 0/50 (0%) 0/50 (0%) 0/50 (0%) 0/50 (0%) 0/50 (0%)0/50 (0%) 1/50 (2%) 0/50 (0%) 0/50 (0%) 0/50 (0%) 0/50 (0%)1/50 (2%) 0/49 (0%) 1/50 (2%) 0/50 (0%) 0/50 (0%) 0/50 (0%)0/50 (0%) 0/50 (0%) 0/50 (0%) 0/50 (0%) 1/50 (2%) 0/50 (0%)0/50 (0%) 0/50 (0%) 1/50 (2%) 0/50 (0%) 0/50 (0%) 0/50 (0%)0/50 (0%) 0/50 (0%) 0/50 (0%) 0/50 (0%) 1/50 (2%) 1/50 (2%)0/50 (0%) 0/50 (0%)
Overall Incidence Total 5/1249 (0.4%) Mean 0.4% SD 0.82% Total 3/1200 (0.25%) Mean 0.25% SD 0.68%
#Oral Cavity (Oral Mucosa, Tongue, Pharynx, Tooth, Gingiva):Squamous Cell Carcinoma, Papilloma Squamous, or Papilloma
1/50 (2%) 0/50 (0%) 0/50 (0%) 0/50 (0%) 0/50 (0%) 1/50 (2%)1/50 (2%) 1/50 (2%) 0/50 (0%) 0/50 (0%) 0/50 (0%)0/50 (0%) 0/50 (0%) 0/50 (0%) 0/50 (0%) 0/50 (0%) 0/50 (0%)0/50 (0%) 2/50 (4%) 0/50 (0%) 0/50 (0%) 1/50 (2%) 0/50 (0%)1/50 (2%) 1/49 (2%) 1/50 (2%) 0/50 (0%) 0/50 (0%) 0/50 (0%)1/50 (2%) 1/50 (2%) 0/50 (0%) 0/50 (0%) 2/50 (4%) 1/50 (2%)0/50 (0%) 0/50 (0%) 1/50 (2%) 0/50 (0%) 0/50 (0%) 0/50 (0%)0/50 (0%) 0/50 (0%) 0/50 (0%) 1/50 (2%) 1/50 (2%) 1/50 (2%)1/50 (2%) 0/50 (0%)
Overall Incidence Total 12/1249 (0.96%) Mean 0.96% SD 1.17% Total 8/1200 (0.67%) Mean 0.67% SD 1.13%
#Oral Mucosa:Squamous Cell Carcinoma
0/50 (0%) 0/50 (0%) 0/50 (0%) 0/50 (0%) 0/50 (0%) 0/50 (0%)1/50 (2%) 0/50 (0%) 0/50 (0%) 0/50 (0%) 0/50 (0%)0/50 (0%) 0/50 (0%) 0/50 (0%) 0/50 (0%) 0/50 (0%) 0/50 (0%)0/50 (0%) 1/50 (2%) 0/50 (0%) 0/50 (0%) 0/50 (0%) 0/50 (0%)1/50 (2%) 0/49 (0%) 1/50 (2%) 0/50 (0%) 0/50 (0%) 0/50 (0%)0/50 (0%) 0/50 (0%) 0/50 (0%) 0/50 (0%) 1/50 (2%) 0/50 (0%)0/50 (0%) 0/50 (0%) 0/50 (0%) 0/50 (0%) 0/50 (0%) 0/50 (0%)0/50 (0%) 0/50 (0%) 0/50 (0%) 0/50 (0%) 1/50 (2%) 0/50 (0%)0/50 (0%) 0/50 (0%)
Overall Incidence Total 4/1249 (0.32%) Mean 0.32% SD 0.75% Total 2/1200 (0.17%) Mean 0.17% SD 0.56%
*: Denominator is number of animals with tissues examined microscopically#: Denominator is number of animals necropsied

Version: May2011 Toxicology Data Management System Page: 45
Contract/Lab: All Laboratories Tumor Incidence for Selected Control Animal Groups Report Date: 05/18/2011
Species: RATS Route: ALL ROUTES
Strain: F 344/N Vehicle: ALL VEHICLES
Length of Study: CHRONIC
Male Female
#Oral Mucosa:Squamous Cell Papilloma
0/50 (0%) 0/50 (0%) 0/50 (0%) 0/50 (0%) 0/50 (0%) 1/50 (2%)0/50 (0%) 0/50 (0%) 0/50 (0%) 0/50 (0%) 0/50 (0%)0/50 (0%) 0/50 (0%) 0/50 (0%) 0/50 (0%) 0/50 (0%) 0/50 (0%)0/50 (0%) 0/50 (0%) 0/50 (0%) 0/50 (0%) 0/50 (0%) 0/50 (0%)0/50 (0%) 1/49 (2%) 0/50 (0%) 0/50 (0%) 0/50 (0%) 0/50 (0%)0/50 (0%) 1/50 (2%) 0/50 (0%) 0/50 (0%) 0/50 (0%) 0/50 (0%)0/50 (0%) 0/50 (0%) 0/50 (0%) 0/50 (0%) 0/50 (0%) 0/50 (0%)0/50 (0%) 0/50 (0%) 0/50 (0%) 0/50 (0%) 0/50 (0%) 0/50 (0%)0/50 (0%) 0/50 (0%)
Overall Incidence Total 2/1249 (0.16%) Mean 0.16% SD 0.56% Total 1/1200 (0.08%) Mean 0.08% SD 0.41%
*Ovary:Cystadenoma
0/50 (0%) 0/50 (0%) 0/50 (0%)0/50 (0%) 0/50 (0%)0/50 (0%) 0/50 (0%) 0/50 (0%)0/50 (0%) 0/50 (0%) 0/49 (0%)0/50 (0%) 1/50 (2%) 0/50 (0%)0/50 (0%) 0/50 (0%) 0/50 (0%)0/50 (0%) 0/50 (0%) 0/50 (0%)0/49 (0%) 0/50 (0%) 0/50 (0%)0/50 (0%)
Overall Incidence Total 1/1198 (0.08%) Mean 0.08% SD 0.41%
*Ovary:Fibrosarcoma
0/50 (0%) 0/50 (0%) 0/50 (0%)0/50 (0%) 0/50 (0%)0/50 (0%) 0/50 (0%) 0/50 (0%)0/50 (0%) 0/50 (0%) 0/49 (0%)0/50 (0%) 0/50 (0%) 0/50 (0%)0/50 (0%) 0/50 (0%) 1/50 (2%)0/50 (0%) 0/50 (0%) 0/50 (0%)0/49 (0%) 0/50 (0%) 0/50 (0%)0/50 (0%)
Overall Incidence Total 1/1198 (0.08%) Mean 0.08% SD 0.41%
*: Denominator is number of animals with tissues examined microscopically#: Denominator is number of animals necropsied
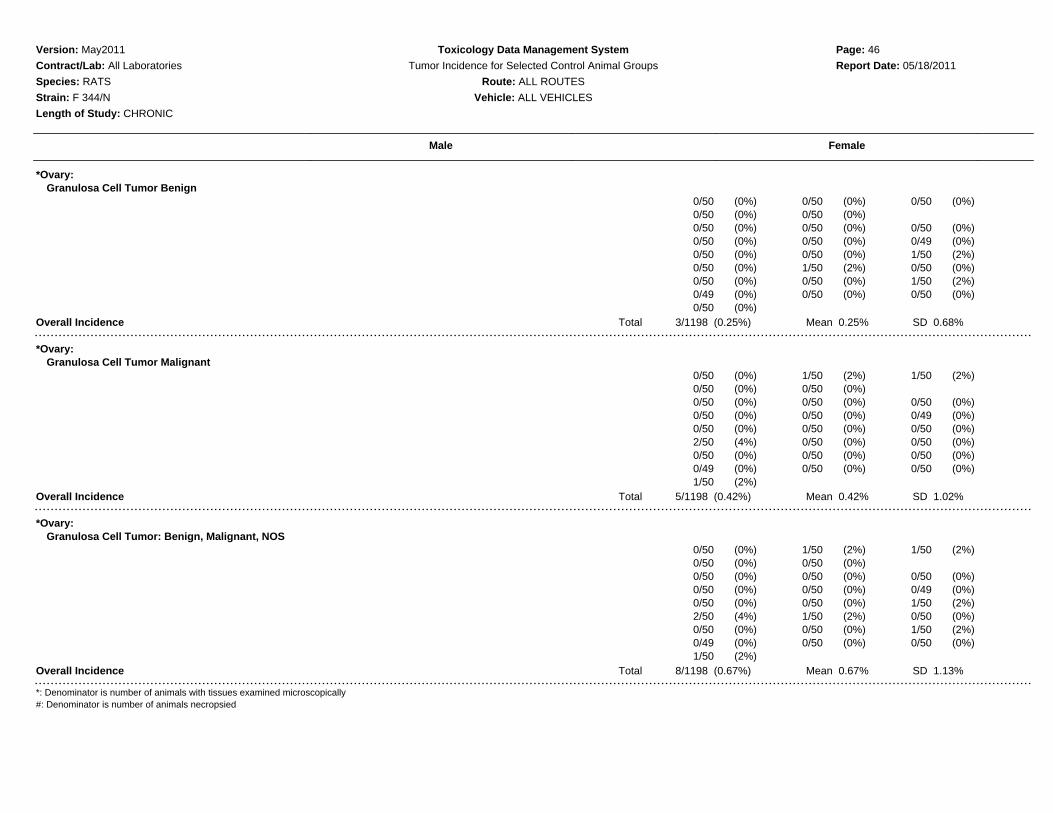
Version: May2011 Toxicology Data Management System Page: 46
Contract/Lab: All Laboratories Tumor Incidence for Selected Control Animal Groups Report Date: 05/18/2011
Species: RATS Route: ALL ROUTES
Strain: F 344/N Vehicle: ALL VEHICLES
Length of Study: CHRONIC
Male Female
*Ovary:Granulosa Cell Tumor Benign
0/50 (0%) 0/50 (0%) 0/50 (0%)0/50 (0%) 0/50 (0%)0/50 (0%) 0/50 (0%) 0/50 (0%)0/50 (0%) 0/50 (0%) 0/49 (0%)0/50 (0%) 0/50 (0%) 1/50 (2%)0/50 (0%) 1/50 (2%) 0/50 (0%)0/50 (0%) 0/50 (0%) 1/50 (2%)0/49 (0%) 0/50 (0%) 0/50 (0%)0/50 (0%)
Overall Incidence Total 3/1198 (0.25%) Mean 0.25% SD 0.68%
*Ovary:Granulosa Cell Tumor Malignant
0/50 (0%) 1/50 (2%) 1/50 (2%)0/50 (0%) 0/50 (0%)0/50 (0%) 0/50 (0%) 0/50 (0%)0/50 (0%) 0/50 (0%) 0/49 (0%)0/50 (0%) 0/50 (0%) 0/50 (0%)2/50 (4%) 0/50 (0%) 0/50 (0%)0/50 (0%) 0/50 (0%) 0/50 (0%)0/49 (0%) 0/50 (0%) 0/50 (0%)1/50 (2%)
Overall Incidence Total 5/1198 (0.42%) Mean 0.42% SD 1.02%
*Ovary:Granulosa Cell Tumor: Benign, Malignant, NOS
0/50 (0%) 1/50 (2%) 1/50 (2%)0/50 (0%) 0/50 (0%)0/50 (0%) 0/50 (0%) 0/50 (0%)0/50 (0%) 0/50 (0%) 0/49 (0%)0/50 (0%) 0/50 (0%) 1/50 (2%)2/50 (4%) 1/50 (2%) 0/50 (0%)0/50 (0%) 0/50 (0%) 1/50 (2%)0/49 (0%) 0/50 (0%) 0/50 (0%)1/50 (2%)
Overall Incidence Total 8/1198 (0.67%) Mean 0.67% SD 1.13%
*: Denominator is number of animals with tissues examined microscopically#: Denominator is number of animals necropsied

Version: May2011 Toxicology Data Management System Page: 47
Contract/Lab: All Laboratories Tumor Incidence for Selected Control Animal Groups Report Date: 05/18/2011
Species: RATS Route: ALL ROUTES
Strain: F 344/N Vehicle: ALL VEHICLES
Length of Study: CHRONIC
Male Female
*Ovary:Granulosa-Theca Tumor Benign
0/50 (0%) 0/50 (0%) 0/50 (0%)0/50 (0%) 1/50 (2%)0/50 (0%) 0/50 (0%) 0/50 (0%)0/50 (0%) 0/50 (0%) 0/49 (0%)0/50 (0%) 0/50 (0%) 0/50 (0%)0/50 (0%) 0/50 (0%) 0/50 (0%)0/50 (0%) 0/50 (0%) 0/50 (0%)0/49 (0%) 0/50 (0%) 0/50 (0%)0/50 (0%)
Overall Incidence Total 1/1198 (0.08%) Mean 0.08% SD 0.41%
*Ovary:Granulosa-Theca Tumor Malignant
0/50 (0%) 0/50 (0%) 0/50 (0%)2/50 (4%) 0/50 (0%)0/50 (0%) 0/50 (0%) 0/50 (0%)0/50 (0%) 0/50 (0%) 0/49 (0%)0/50 (0%) 0/50 (0%) 0/50 (0%)0/50 (0%) 0/50 (0%) 0/50 (0%)0/50 (0%) 0/50 (0%) 0/50 (0%)0/49 (0%) 0/50 (0%) 0/50 (0%)0/50 (0%)
Overall Incidence Total 2/1198 (0.17%) Mean 0.17% SD 0.82%
*Ovary:Schwannoma Malignant
0/50 (0%) 0/50 (0%) 0/50 (0%)0/50 (0%) 0/50 (0%)0/50 (0%) 0/50 (0%) 0/50 (0%)0/50 (0%) 0/50 (0%) 0/49 (0%)0/50 (0%) 0/50 (0%) 0/50 (0%)0/50 (0%) 0/50 (0%) 0/50 (0%)1/50 (2%) 0/50 (0%) 0/50 (0%)0/49 (0%) 0/50 (0%) 0/50 (0%)0/50 (0%)
Overall Incidence Total 1/1198 (0.08%) Mean 0.08% SD 0.41%
*: Denominator is number of animals with tissues examined microscopically#: Denominator is number of animals necropsied

Version: May2011 Toxicology Data Management System Page: 48
Contract/Lab: All Laboratories Tumor Incidence for Selected Control Animal Groups Report Date: 05/18/2011
Species: RATS Route: ALL ROUTES
Strain: F 344/N Vehicle: ALL VEHICLES
Length of Study: CHRONIC
Male Female
*Ovary:Tubulostromal Adenoma
1/50 (2%) 0/50 (0%) 0/50 (0%)0/50 (0%) 0/50 (0%)0/50 (0%) 0/50 (0%) 1/50 (2%)0/50 (0%) 0/50 (0%) 0/49 (0%)0/50 (0%) 0/50 (0%) 0/50 (0%)0/50 (0%) 0/50 (0%) 0/50 (0%)0/50 (0%) 0/50 (0%) 0/50 (0%)0/49 (0%) 0/50 (0%) 0/50 (0%)0/50 (0%)
Overall Incidence Total 2/1198 (0.17%) Mean 0.17% SD 0.56%
*Pancreas:Adenoma
3/50 (6%) 0/50 (0%) 0/50 (0%) 0/50 (0%) 0/49 (0%) 0/50 (0%)0/50 (0%) 0/49 (0%) 0/49 (0%) 0/50 (0%) 0/49 (0%)0/50 (0%) 0/49 (0%) 0/50 (0%) 0/50 (0%) 0/50 (0%) 0/50 (0%)0/50 (0%) 0/50 (0%) 1/50 (2%) 0/50 (0%) 0/49 (0%) 0/50 (0%)7/50 (14%) 1/49 (2%) 0/49 (0%) 0/50 (0%) 0/50 (0%) 0/49 (0%)2/50 (4%) 1/50 (2%) 0/50 (0%) 0/48 (0%) 0/50 (0%) 0/50 (0%)1/49 (2%) 2/50 (4%) 0/50 (0%) 0/50 (0%) 0/50 (0%) 0/50 (0%)1/50 (2%) 1/50 (2%) 0/50 (0%) 0/50 (0%) 1/50 (2%) 0/50 (0%)1/50 (2%) 0/50 (0%)
Overall Incidence Total 21/1244 (1.69%) Mean 1.68% SD 3.04% Total 1/1194 (0.08%) Mean 0.08% SD 0.41%
*Pancreas:Carcinoma
0/50 (0%) 0/50 (0%) 0/50 (0%) 0/50 (0%) 0/49 (0%) 0/50 (0%)0/50 (0%) 0/49 (0%) 0/49 (0%) 0/50 (0%) 0/49 (0%)0/50 (0%) 0/49 (0%) 0/50 (0%) 0/50 (0%) 0/50 (0%) 0/50 (0%)0/50 (0%) 0/50 (0%) 0/50 (0%) 0/50 (0%) 0/49 (0%) 0/50 (0%)1/50 (2%) 0/49 (0%) 0/49 (0%) 0/50 (0%) 0/50 (0%) 0/49 (0%)0/50 (0%) 0/50 (0%) 0/50 (0%) 0/48 (0%) 0/50 (0%) 0/50 (0%)0/49 (0%) 0/50 (0%) 0/50 (0%) 0/50 (0%) 0/50 (0%) 0/50 (0%)0/50 (0%) 0/50 (0%) 0/50 (0%) 0/50 (0%) 0/50 (0%) 0/50 (0%)0/50 (0%) 0/50 (0%)
Overall Incidence Total 1/1244 (0.08%) Mean 0.08% SD 0.4% Total 0/1194 (0%) Mean 0% SD 0%
*: Denominator is number of animals with tissues examined microscopically#: Denominator is number of animals necropsied

Version: May2011 Toxicology Data Management System Page: 49
Contract/Lab: All Laboratories Tumor Incidence for Selected Control Animal Groups Report Date: 05/18/2011
Species: RATS Route: ALL ROUTES
Strain: F 344/N Vehicle: ALL VEHICLES
Length of Study: CHRONIC
Male Female
*Pancreas:Carcinoma or Adenoma
3/50 (6%) 0/50 (0%) 0/50 (0%) 0/50 (0%) 0/49 (0%) 0/50 (0%)0/50 (0%) 0/49 (0%) 0/49 (0%) 0/50 (0%) 0/49 (0%)0/50 (0%) 0/49 (0%) 0/50 (0%) 0/50 (0%) 0/50 (0%) 0/50 (0%)0/50 (0%) 0/50 (0%) 1/50 (2%) 0/50 (0%) 0/49 (0%) 0/50 (0%)8/50 (16%) 1/49 (2%) 0/49 (0%) 0/50 (0%) 0/50 (0%) 0/49 (0%)2/50 (4%) 1/50 (2%) 0/50 (0%) 0/48 (0%) 0/50 (0%) 0/50 (0%)1/49 (2%) 2/50 (4%) 0/50 (0%) 0/50 (0%) 0/50 (0%) 0/50 (0%)1/50 (2%) 1/50 (2%) 0/50 (0%) 0/50 (0%) 1/50 (2%) 0/50 (0%)1/50 (2%) 0/50 (0%)
Overall Incidence Total 22/1244 (1.77%) Mean 1.76% SD 3.38% Total 1/1194 (0.08%) Mean 0.08% SD 0.41%
*Pancreas:Mixed Tumor Benign
0/50 (0%) 1/50 (2%) 0/50 (0%) 0/50 (0%) 0/49 (0%) 0/50 (0%)0/50 (0%) 0/49 (0%) 0/49 (0%) 0/50 (0%) 0/49 (0%)0/50 (0%) 0/49 (0%) 0/50 (0%) 0/50 (0%) 0/50 (0%) 0/50 (0%)0/50 (0%) 0/50 (0%) 0/50 (0%) 0/50 (0%) 0/49 (0%) 0/50 (0%)0/50 (0%) 0/49 (0%) 0/49 (0%) 0/50 (0%) 0/50 (0%) 0/49 (0%)0/50 (0%) 0/50 (0%) 0/50 (0%) 0/48 (0%) 0/50 (0%) 0/50 (0%)0/49 (0%) 0/50 (0%) 0/50 (0%) 0/50 (0%) 0/50 (0%) 0/50 (0%)0/50 (0%) 1/50 (2%) 0/50 (0%) 0/50 (0%) 0/50 (0%) 0/50 (0%)1/50 (2%) 0/50 (0%)
Overall Incidence Total 3/1244 (0.24%) Mean 0.24% SD 0.66% Total 0/1194 (0%) Mean 0% SD 0%
*Pancreas:Mixed Tumor Malignant
0/50 (0%) 0/50 (0%) 0/50 (0%) 0/50 (0%) 0/49 (0%) 0/50 (0%)0/50 (0%) 0/49 (0%) 0/49 (0%) 0/50 (0%) 0/49 (0%)0/50 (0%) 0/49 (0%) 0/50 (0%) 0/50 (0%) 0/50 (0%) 0/50 (0%)0/50 (0%) 1/50 (2%) 0/50 (0%) 0/50 (0%) 0/49 (0%) 0/50 (0%)0/50 (0%) 0/49 (0%) 0/49 (0%) 0/50 (0%) 0/50 (0%) 0/49 (0%)0/50 (0%) 0/50 (0%) 0/50 (0%) 0/48 (0%) 0/50 (0%) 0/50 (0%)0/49 (0%) 0/50 (0%) 0/50 (0%) 0/50 (0%) 0/50 (0%) 0/50 (0%)0/50 (0%) 0/50 (0%) 0/50 (0%) 0/50 (0%) 0/50 (0%) 0/50 (0%)0/50 (0%) 0/50 (0%)
Overall Incidence Total 1/1244 (0.08%) Mean 0.08% SD 0.4% Total 0/1194 (0%) Mean 0% SD 0%
*: Denominator is number of animals with tissues examined microscopically#: Denominator is number of animals necropsied

Version: May2011 Toxicology Data Management System Page: 50
Contract/Lab: All Laboratories Tumor Incidence for Selected Control Animal Groups Report Date: 05/18/2011
Species: RATS Route: ALL ROUTES
Strain: F 344/N Vehicle: ALL VEHICLES
Length of Study: CHRONIC
Male Female
*Parathyroid Gland:Adenoma
0/48 (0%) 0/48 (0%) 0/49 (0%) 0/49 (0%) 0/47 (0%) 0/43 (0%)0/46 (0%) 1/45 (2%) 1/46 (2%) 0/47 (0%) 0/48 (0%)0/49 (0%) 0/48 (0%) 0/47 (0%) 0/46 (0%) 1/43 (2%) 1/38 (3%)0/50 (0%) 0/49 (0%) 0/49 (0%) 0/48 (0%) 0/49 (0%) 0/48 (0%)0/47 (0%) 1/49 (2%) 0/49 (0%) 0/47 (0%) 0/44 (0%) 1/50 (2%)0/50 (0%) 1/45 (2%) 0/49 (0%) 0/49 (0%) 0/47 (0%) 0/50 (0%)0/50 (0%) 1/49 (2%) 0/50 (0%) 0/47 (0%) 2/46 (4%) 0/49 (0%)0/46 (0%) 0/35 (0%) 0/48 (0%) 0/46 (0%) 0/48 (0%) 0/49 (0%)0/45 (0%) 0/45 (0%)
Overall Incidence Total 5/1186 (0.42%) Mean 0.43% SD 0.87% Total 5/1123 (0.45%) Mean 0.47% SD 1.14%
*Pituitary Gland: Pars Distalis or Unspecified Site:Adenoma
19/50 (38%) 24/50 (48%) 35/49 (71%) 19/50 (38%) 25/50 (50%) 22/50 (44%)37/50 (74%) 10/50 (20%) 20/50 (40%) 35/50 (70%) 24/49 (49%)32/50 (64%) 31/50 (62%) 38/50 (76%) 35/50 (70%) 29/50 (58%) 34/50 (68%)20/50 (40%) 8/50 (16%) 15/50 (30%) 16/50 (32%) 25/50 (50%) 24/50 (48%)19/50 (38%) 21/49 (43%) 33/50 (66%) 25/50 (50%) 29/50 (58%) 31/50 (62%)13/50 (26%) 6/50 (12%) 23/50 (46%) 20/50 (40%) 25/50 (50%) 31/50 (62%)28/50 (56%) 11/50 (22%) 33/50 (66%) 30/50 (60%) 27/50 (54%) 25/50 (50%)16/50 (32%) 16/50 (32%) 36/50 (72%) 28/50 (56%) 22/50 (44%) 36/49 (73%)34/49 (69%) 36/50 (72%)
Overall Incidence Total 578/1247 (46.35%) Mean 46.39% SD 20% Total 653/1198 (54.51%) Mean 54.52% SD 11.19%
*Pituitary Gland: Pars Distalis or Unspecified Site:Carcinoma
0/50 (0%) 0/50 (0%) 0/49 (0%) 0/50 (0%) 1/50 (2%) 0/50 (0%)0/50 (0%) 0/50 (0%) 0/50 (0%) 0/50 (0%) 1/49 (2%)0/50 (0%) 0/50 (0%) 0/50 (0%) 0/50 (0%) 2/50 (4%) 2/50 (4%)0/50 (0%) 0/50 (0%) 0/50 (0%) 0/50 (0%) 0/50 (0%) 1/50 (2%)0/50 (0%) 0/49 (0%) 2/50 (4%) 0/50 (0%) 1/50 (2%) 2/50 (4%)0/50 (0%) 0/50 (0%) 1/50 (2%) 1/50 (2%) 0/50 (0%) 0/50 (0%)0/50 (0%) 0/50 (0%) 0/50 (0%) 0/50 (0%) 0/50 (0%) 0/50 (0%)0/50 (0%) 0/50 (0%) 1/50 (2%) 2/50 (4%) 0/50 (0%) 0/49 (0%)0/49 (0%) 2/50 (4%)
Overall Incidence Total 4/1247 (0.32%) Mean 0.32% SD 0.95% Total 15/1198 (1.25%) Mean 1.25% SD 1.65%
*: Denominator is number of animals with tissues examined microscopically#: Denominator is number of animals necropsied

Version: May2011 Toxicology Data Management System Page: 51
Contract/Lab: All Laboratories Tumor Incidence for Selected Control Animal Groups Report Date: 05/18/2011
Species: RATS Route: ALL ROUTES
Strain: F 344/N Vehicle: ALL VEHICLES
Length of Study: CHRONIC
Male Female
*Pituitary Gland: Pars Distalis or Unspecified Site:Carcinoma or Adenoma
19/50 (38%) 24/50 (48%) 35/49 (71%) 19/50 (38%) 26/50 (52%) 22/50 (44%)37/50 (74%) 10/50 (20%) 20/50 (40%) 35/50 (70%) 25/49 (51%)32/50 (64%) 31/50 (62%) 38/50 (76%) 35/50 (70%) 31/50 (62%) 36/50 (72%)20/50 (40%) 8/50 (16%) 15/50 (30%) 16/50 (32%) 25/50 (50%) 25/50 (50%)19/50 (38%) 21/49 (43%) 35/50 (70%) 25/50 (50%) 30/50 (60%) 33/50 (66%)13/50 (26%) 6/50 (12%) 24/50 (48%) 21/50 (42%) 25/50 (50%) 31/50 (62%)28/50 (56%) 11/50 (22%) 33/50 (66%) 30/50 (60%) 27/50 (54%) 25/50 (50%)16/50 (32%) 16/50 (32%) 37/50 (74%) 30/50 (60%) 22/50 (44%) 36/49 (73%)34/49 (69%) 38/50 (76%)
Overall Incidence Total 582/1247 (46.67%) Mean 46.71% SD 20.29% Total 668/1198 (55.76%) Mean 55.77% SD 11.76%
*Pituitary Gland: Pars Distalis or Unspecified Site:Ganglioneuroma
0/50 (0%) 0/50 (0%) 0/49 (0%) 0/50 (0%) 1/50 (2%) 0/50 (0%)0/50 (0%) 0/50 (0%) 0/50 (0%) 0/50 (0%) 0/49 (0%)0/50 (0%) 1/50 (2%) 0/50 (0%) 0/50 (0%) 0/50 (0%) 0/50 (0%)0/50 (0%) 0/50 (0%) 0/50 (0%) 0/50 (0%) 0/50 (0%) 0/50 (0%)0/50 (0%) 0/49 (0%) 0/50 (0%) 0/50 (0%) 0/50 (0%) 0/50 (0%)0/50 (0%) 0/50 (0%) 0/50 (0%) 0/50 (0%) 0/50 (0%) 0/50 (0%)0/50 (0%) 0/50 (0%) 0/50 (0%) 0/50 (0%) 0/50 (0%) 0/50 (0%)0/50 (0%) 0/50 (0%) 0/50 (0%) 0/50 (0%) 0/50 (0%) 0/49 (0%)0/49 (0%) 0/50 (0%)
Overall Incidence Total 1/1247 (0.08%) Mean 0.08% SD 0.4% Total 1/1198 (0.08%) Mean 0.08% SD 0.41%
*Pituitary Gland: Pars Intermedia:Adenoma
0/50 (0%) 0/50 (0%) 0/49 (0%) 0/50 (0%) 1/50 (2%) 1/50 (2%)0/50 (0%) 0/50 (0%) 1/50 (2%) 0/50 (0%) 0/49 (0%)0/50 (0%) 0/50 (0%) 1/50 (2%) 0/50 (0%) 0/50 (0%) 1/50 (2%)0/50 (0%) 0/50 (0%) 0/50 (0%) 0/50 (0%) 0/50 (0%) 0/50 (0%)1/50 (2%) 0/49 (0%) 0/50 (0%) 0/50 (0%) 0/50 (0%) 0/50 (0%)0/50 (0%) 0/50 (0%) 0/50 (0%) 0/50 (0%) 0/50 (0%) 0/50 (0%)0/50 (0%) 0/50 (0%) 1/50 (2%) 0/50 (0%) 0/50 (0%) 0/50 (0%)0/50 (0%) 0/50 (0%) 0/50 (0%) 0/50 (0%) 0/50 (0%) 0/49 (0%)0/49 (0%) 1/50 (2%)
Overall Incidence Total 4/1247 (0.32%) Mean 0.32% SD 0.75% Total 4/1198 (0.33%) Mean 0.33% SD 0.76%
*: Denominator is number of animals with tissues examined microscopically#: Denominator is number of animals necropsied

Version: May2011 Toxicology Data Management System Page: 52
Contract/Lab: All Laboratories Tumor Incidence for Selected Control Animal Groups Report Date: 05/18/2011
Species: RATS Route: ALL ROUTES
Strain: F 344/N Vehicle: ALL VEHICLES
Length of Study: CHRONIC
Male Female
*Pituitary Gland: Pars Intermedia:Carcinoma or Adenoma
0/50 (0%) 0/50 (0%) 0/49 (0%) 0/50 (0%) 1/50 (2%) 1/50 (2%)0/50 (0%) 0/50 (0%) 1/50 (2%) 0/50 (0%) 0/49 (0%)0/50 (0%) 0/50 (0%) 1/50 (2%) 0/50 (0%) 0/50 (0%) 1/50 (2%)0/50 (0%) 0/50 (0%) 0/50 (0%) 0/50 (0%) 0/50 (0%) 0/50 (0%)1/50 (2%) 0/49 (0%) 0/50 (0%) 0/50 (0%) 0/50 (0%) 0/50 (0%)0/50 (0%) 0/50 (0%) 0/50 (0%) 0/50 (0%) 0/50 (0%) 0/50 (0%)0/50 (0%) 0/50 (0%) 1/50 (2%) 0/50 (0%) 0/50 (0%) 0/50 (0%)0/50 (0%) 0/50 (0%) 0/50 (0%) 0/50 (0%) 0/50 (0%) 0/49 (0%)0/49 (0%) 1/50 (2%)
Overall Incidence Total 4/1247 (0.32%) Mean 0.32% SD 0.75% Total 4/1198 (0.33%) Mean 0.33% SD 0.76%
*Pituitary Gland: Pars Nervosa:Craniopharyngioma
0/50 (0%) 0/50 (0%) 0/49 (0%) 0/50 (0%) 0/50 (0%) 0/50 (0%)0/50 (0%) 0/50 (0%) 0/50 (0%) 0/50 (0%) 0/49 (0%)0/50 (0%) 0/50 (0%) 0/50 (0%) 0/50 (0%) 0/50 (0%) 0/50 (0%)0/50 (0%) 0/50 (0%) 0/50 (0%) 0/50 (0%) 0/50 (0%) 0/50 (0%)0/50 (0%) 0/49 (0%) 0/50 (0%) 0/50 (0%) 0/50 (0%) 0/50 (0%)0/50 (0%) 0/50 (0%) 0/50 (0%) 0/50 (0%) 0/50 (0%) 0/50 (0%)0/50 (0%) 0/50 (0%) 0/50 (0%) 0/50 (0%) 0/50 (0%) 0/50 (0%)0/50 (0%) 0/50 (0%) 0/50 (0%) 0/50 (0%) 0/50 (0%) 0/49 (0%)0/49 (0%) 1/50 (2%)
Overall Incidence Total 0/1247 (0%) Mean 0% SD 0% Total 1/1198 (0.08%) Mean 0.08% SD 0.41%
*Prostate:Adenoma
0/50 (0%) 2/50 (4%) 0/50 (0%)0/50 (0%) 0/50 (0%) 0/50 (0%)0/50 (0%) 0/50 (0%) 0/50 (0%)1/50 (2%) 1/50 (2%) 0/50 (0%)0/50 (0%) 0/49 (0%) 0/50 (0%)0/50 (0%) 0/50 (0%) 0/50 (0%)0/49 (0%) 0/50 (0%) 0/50 (0%)2/50 (4%) 0/50 (0%) 0/50 (0%)0/50 (0%)
Overall Incidence Total 6/1248 (0.48%) Mean 0.48% SD 1.19%
*: Denominator is number of animals with tissues examined microscopically#: Denominator is number of animals necropsied
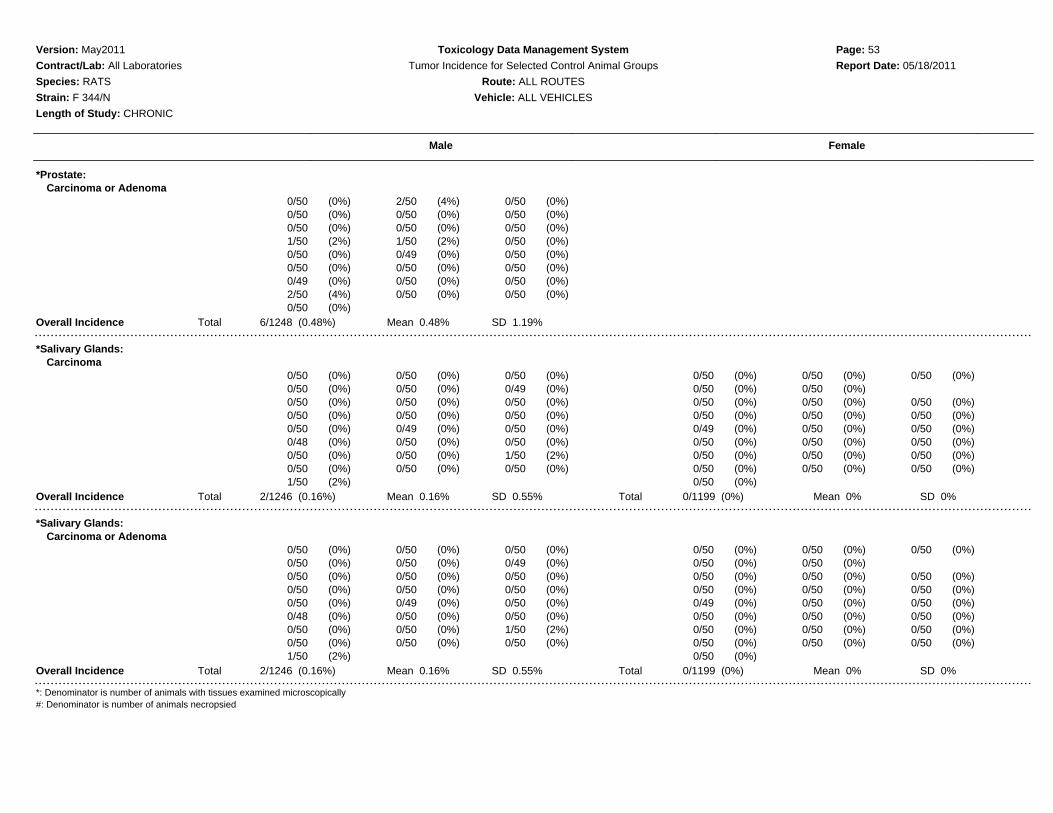
Version: May2011 Toxicology Data Management System Page: 53
Contract/Lab: All Laboratories Tumor Incidence for Selected Control Animal Groups Report Date: 05/18/2011
Species: RATS Route: ALL ROUTES
Strain: F 344/N Vehicle: ALL VEHICLES
Length of Study: CHRONIC
Male Female
*Prostate:Carcinoma or Adenoma
0/50 (0%) 2/50 (4%) 0/50 (0%)0/50 (0%) 0/50 (0%) 0/50 (0%)0/50 (0%) 0/50 (0%) 0/50 (0%)1/50 (2%) 1/50 (2%) 0/50 (0%)0/50 (0%) 0/49 (0%) 0/50 (0%)0/50 (0%) 0/50 (0%) 0/50 (0%)0/49 (0%) 0/50 (0%) 0/50 (0%)2/50 (4%) 0/50 (0%) 0/50 (0%)0/50 (0%)
Overall Incidence Total 6/1248 (0.48%) Mean 0.48% SD 1.19%
*Salivary Glands:Carcinoma
0/50 (0%) 0/50 (0%) 0/50 (0%) 0/50 (0%) 0/50 (0%) 0/50 (0%)0/50 (0%) 0/50 (0%) 0/49 (0%) 0/50 (0%) 0/50 (0%)0/50 (0%) 0/50 (0%) 0/50 (0%) 0/50 (0%) 0/50 (0%) 0/50 (0%)0/50 (0%) 0/50 (0%) 0/50 (0%) 0/50 (0%) 0/50 (0%) 0/50 (0%)0/50 (0%) 0/49 (0%) 0/50 (0%) 0/49 (0%) 0/50 (0%) 0/50 (0%)0/48 (0%) 0/50 (0%) 0/50 (0%) 0/50 (0%) 0/50 (0%) 0/50 (0%)0/50 (0%) 0/50 (0%) 1/50 (2%) 0/50 (0%) 0/50 (0%) 0/50 (0%)0/50 (0%) 0/50 (0%) 0/50 (0%) 0/50 (0%) 0/50 (0%) 0/50 (0%)1/50 (2%) 0/50 (0%)
Overall Incidence Total 2/1246 (0.16%) Mean 0.16% SD 0.55% Total 0/1199 (0%) Mean 0% SD 0%
*Salivary Glands:Carcinoma or Adenoma
0/50 (0%) 0/50 (0%) 0/50 (0%) 0/50 (0%) 0/50 (0%) 0/50 (0%)0/50 (0%) 0/50 (0%) 0/49 (0%) 0/50 (0%) 0/50 (0%)0/50 (0%) 0/50 (0%) 0/50 (0%) 0/50 (0%) 0/50 (0%) 0/50 (0%)0/50 (0%) 0/50 (0%) 0/50 (0%) 0/50 (0%) 0/50 (0%) 0/50 (0%)0/50 (0%) 0/49 (0%) 0/50 (0%) 0/49 (0%) 0/50 (0%) 0/50 (0%)0/48 (0%) 0/50 (0%) 0/50 (0%) 0/50 (0%) 0/50 (0%) 0/50 (0%)0/50 (0%) 0/50 (0%) 1/50 (2%) 0/50 (0%) 0/50 (0%) 0/50 (0%)0/50 (0%) 0/50 (0%) 0/50 (0%) 0/50 (0%) 0/50 (0%) 0/50 (0%)1/50 (2%) 0/50 (0%)
Overall Incidence Total 2/1246 (0.16%) Mean 0.16% SD 0.55% Total 0/1199 (0%) Mean 0% SD 0%
*: Denominator is number of animals with tissues examined microscopically#: Denominator is number of animals necropsied
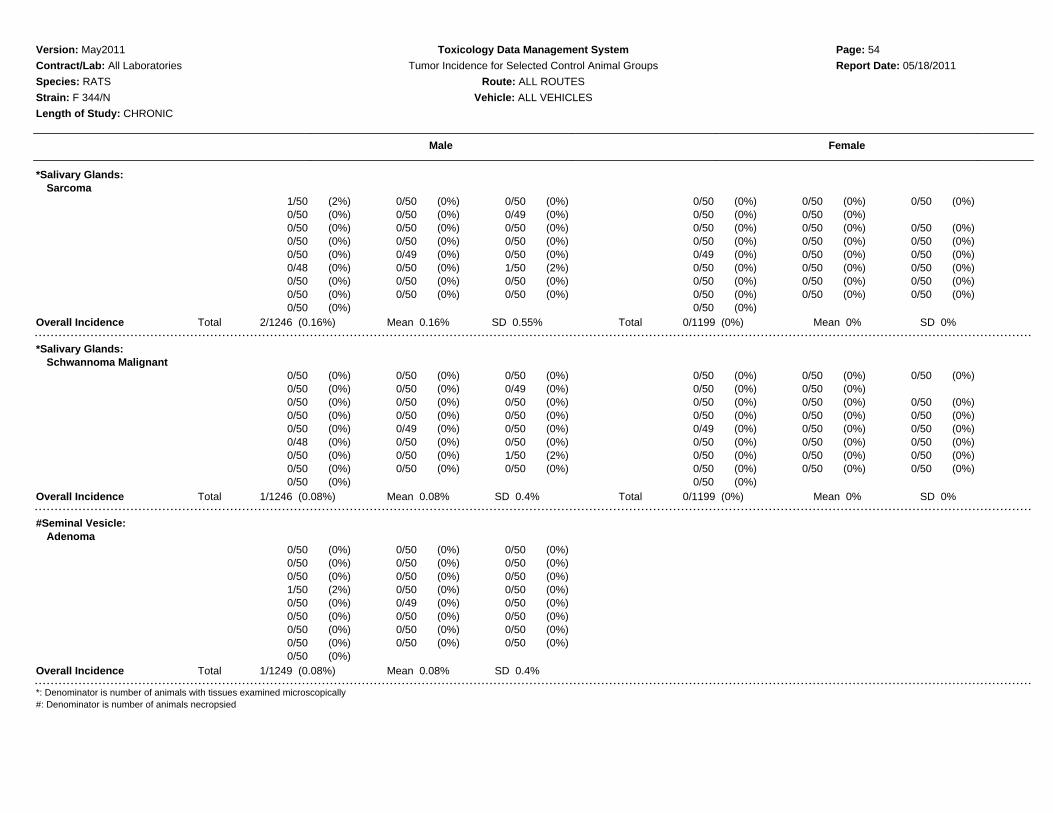
Version: May2011 Toxicology Data Management System Page: 54
Contract/Lab: All Laboratories Tumor Incidence for Selected Control Animal Groups Report Date: 05/18/2011
Species: RATS Route: ALL ROUTES
Strain: F 344/N Vehicle: ALL VEHICLES
Length of Study: CHRONIC
Male Female
*Salivary Glands:Sarcoma
1/50 (2%) 0/50 (0%) 0/50 (0%) 0/50 (0%) 0/50 (0%) 0/50 (0%)0/50 (0%) 0/50 (0%) 0/49 (0%) 0/50 (0%) 0/50 (0%)0/50 (0%) 0/50 (0%) 0/50 (0%) 0/50 (0%) 0/50 (0%) 0/50 (0%)0/50 (0%) 0/50 (0%) 0/50 (0%) 0/50 (0%) 0/50 (0%) 0/50 (0%)0/50 (0%) 0/49 (0%) 0/50 (0%) 0/49 (0%) 0/50 (0%) 0/50 (0%)0/48 (0%) 0/50 (0%) 1/50 (2%) 0/50 (0%) 0/50 (0%) 0/50 (0%)0/50 (0%) 0/50 (0%) 0/50 (0%) 0/50 (0%) 0/50 (0%) 0/50 (0%)0/50 (0%) 0/50 (0%) 0/50 (0%) 0/50 (0%) 0/50 (0%) 0/50 (0%)0/50 (0%) 0/50 (0%)
Overall Incidence Total 2/1246 (0.16%) Mean 0.16% SD 0.55% Total 0/1199 (0%) Mean 0% SD 0%
*Salivary Glands:Schwannoma Malignant
0/50 (0%) 0/50 (0%) 0/50 (0%) 0/50 (0%) 0/50 (0%) 0/50 (0%)0/50 (0%) 0/50 (0%) 0/49 (0%) 0/50 (0%) 0/50 (0%)0/50 (0%) 0/50 (0%) 0/50 (0%) 0/50 (0%) 0/50 (0%) 0/50 (0%)0/50 (0%) 0/50 (0%) 0/50 (0%) 0/50 (0%) 0/50 (0%) 0/50 (0%)0/50 (0%) 0/49 (0%) 0/50 (0%) 0/49 (0%) 0/50 (0%) 0/50 (0%)0/48 (0%) 0/50 (0%) 0/50 (0%) 0/50 (0%) 0/50 (0%) 0/50 (0%)0/50 (0%) 0/50 (0%) 1/50 (2%) 0/50 (0%) 0/50 (0%) 0/50 (0%)0/50 (0%) 0/50 (0%) 0/50 (0%) 0/50 (0%) 0/50 (0%) 0/50 (0%)0/50 (0%) 0/50 (0%)
Overall Incidence Total 1/1246 (0.08%) Mean 0.08% SD 0.4% Total 0/1199 (0%) Mean 0% SD 0%
#Seminal Vesicle:Adenoma
0/50 (0%) 0/50 (0%) 0/50 (0%)0/50 (0%) 0/50 (0%) 0/50 (0%)0/50 (0%) 0/50 (0%) 0/50 (0%)1/50 (2%) 0/50 (0%) 0/50 (0%)0/50 (0%) 0/49 (0%) 0/50 (0%)0/50 (0%) 0/50 (0%) 0/50 (0%)0/50 (0%) 0/50 (0%) 0/50 (0%)0/50 (0%) 0/50 (0%) 0/50 (0%)0/50 (0%)
Overall Incidence Total 1/1249 (0.08%) Mean 0.08% SD 0.4%
*: Denominator is number of animals with tissues examined microscopically#: Denominator is number of animals necropsied

Version: May2011 Toxicology Data Management System Page: 55
Contract/Lab: All Laboratories Tumor Incidence for Selected Control Animal Groups Report Date: 05/18/2011
Species: RATS Route: ALL ROUTES
Strain: F 344/N Vehicle: ALL VEHICLES
Length of Study: CHRONIC
Male Female
#Skeletal Muscle:Fibrous Histiocytoma
0/50 (0%) 0/50 (0%) 0/50 (0%) 0/50 (0%) 0/50 (0%) 0/50 (0%)0/50 (0%) 0/50 (0%) 0/50 (0%) 0/50 (0%) 0/50 (0%)0/50 (0%) 0/50 (0%) 0/50 (0%) 0/50 (0%) 0/50 (0%) 0/50 (0%)0/50 (0%) 0/50 (0%) 0/50 (0%) 0/50 (0%) 0/50 (0%) 0/50 (0%)0/50 (0%) 1/49 (2%) 0/50 (0%) 0/50 (0%) 0/50 (0%) 0/50 (0%)0/50 (0%) 0/50 (0%) 0/50 (0%) 0/50 (0%) 0/50 (0%) 0/50 (0%)0/50 (0%) 0/50 (0%) 0/50 (0%) 0/50 (0%) 0/50 (0%) 0/50 (0%)0/50 (0%) 0/50 (0%) 0/50 (0%) 0/50 (0%) 0/50 (0%) 0/50 (0%)0/50 (0%) 0/50 (0%)
Overall Incidence Total 1/1249 (0.08%) Mean 0.08% SD 0.41% Total 0/1200 (0%) Mean 0% SD 0%
#Skeletal Muscle:Hemangiosarcoma
0/50 (0%) 0/50 (0%) 1/50 (2%) 0/50 (0%) 0/50 (0%) 0/50 (0%)0/50 (0%) 0/50 (0%) 0/50 (0%) 0/50 (0%) 0/50 (0%)0/50 (0%) 0/50 (0%) 0/50 (0%) 0/50 (0%) 0/50 (0%) 0/50 (0%)0/50 (0%) 0/50 (0%) 0/50 (0%) 0/50 (0%) 0/50 (0%) 0/50 (0%)0/50 (0%) 0/49 (0%) 0/50 (0%) 0/50 (0%) 0/50 (0%) 0/50 (0%)0/50 (0%) 0/50 (0%) 0/50 (0%) 0/50 (0%) 0/50 (0%) 0/50 (0%)0/50 (0%) 0/50 (0%) 0/50 (0%) 0/50 (0%) 0/50 (0%) 0/50 (0%)0/50 (0%) 0/50 (0%) 0/50 (0%) 0/50 (0%) 0/50 (0%) 0/50 (0%)0/50 (0%) 0/50 (0%)
Overall Incidence Total 1/1249 (0.08%) Mean 0.08% SD 0.4% Total 0/1200 (0%) Mean 0% SD 0%
#Skeletal Muscle:Rhabdomyosarcoma
0/50 (0%) 0/50 (0%) 0/50 (0%) 0/50 (0%) 0/50 (0%) 0/50 (0%)0/50 (0%) 0/50 (0%) 0/50 (0%) 0/50 (0%) 0/50 (0%)0/50 (0%) 0/50 (0%) 0/50 (0%) 1/50 (2%) 0/50 (0%) 0/50 (0%)0/50 (0%) 1/50 (2%) 0/50 (0%) 0/50 (0%) 0/50 (0%) 0/50 (0%)0/50 (0%) 0/49 (0%) 0/50 (0%) 0/50 (0%) 0/50 (0%) 0/50 (0%)0/50 (0%) 1/50 (2%) 0/50 (0%) 0/50 (0%) 0/50 (0%) 0/50 (0%)0/50 (0%) 0/50 (0%) 0/50 (0%) 0/50 (0%) 0/50 (0%) 0/50 (0%)0/50 (0%) 0/50 (0%) 0/50 (0%) 0/50 (0%) 0/50 (0%) 0/50 (0%)0/50 (0%) 0/50 (0%)
Overall Incidence Total 2/1249 (0.16%) Mean 0.16% SD 0.55% Total 1/1200 (0.08%) Mean 0.08% SD 0.41%
*: Denominator is number of animals with tissues examined microscopically#: Denominator is number of animals necropsied
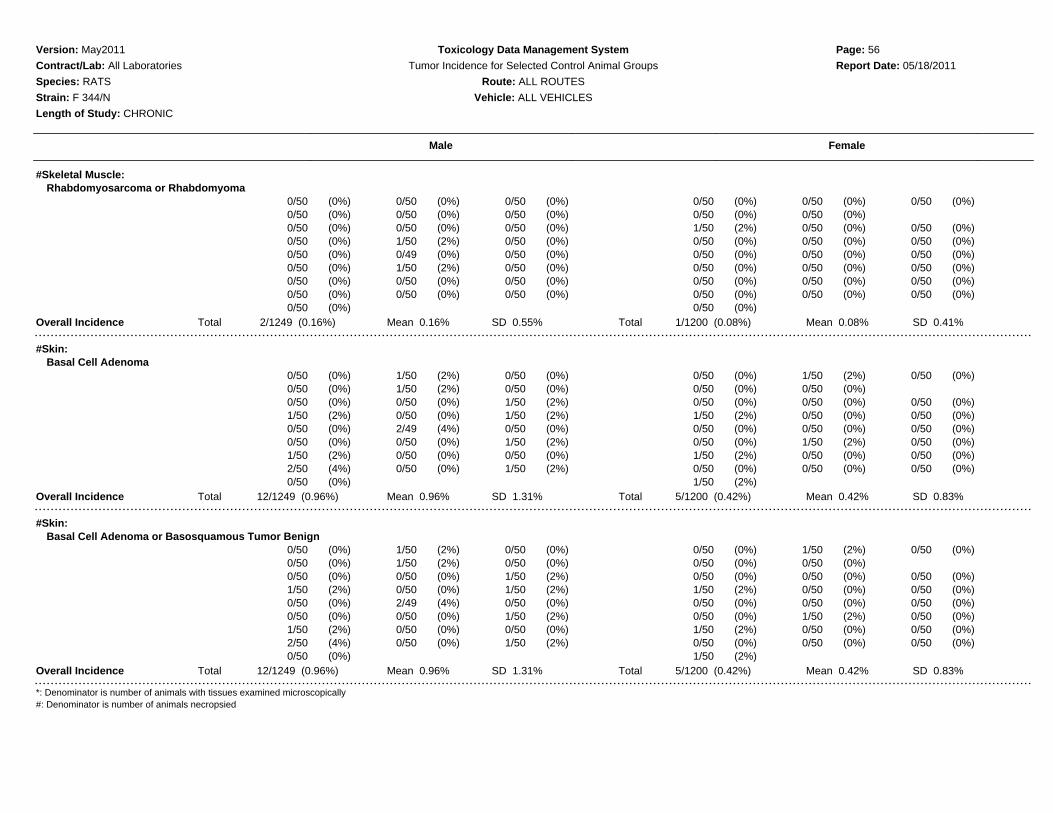
Version: May2011 Toxicology Data Management System Page: 56
Contract/Lab: All Laboratories Tumor Incidence for Selected Control Animal Groups Report Date: 05/18/2011
Species: RATS Route: ALL ROUTES
Strain: F 344/N Vehicle: ALL VEHICLES
Length of Study: CHRONIC
Male Female
#Skeletal Muscle:Rhabdomyosarcoma or Rhabdomyoma
0/50 (0%) 0/50 (0%) 0/50 (0%) 0/50 (0%) 0/50 (0%) 0/50 (0%)0/50 (0%) 0/50 (0%) 0/50 (0%) 0/50 (0%) 0/50 (0%)0/50 (0%) 0/50 (0%) 0/50 (0%) 1/50 (2%) 0/50 (0%) 0/50 (0%)0/50 (0%) 1/50 (2%) 0/50 (0%) 0/50 (0%) 0/50 (0%) 0/50 (0%)0/50 (0%) 0/49 (0%) 0/50 (0%) 0/50 (0%) 0/50 (0%) 0/50 (0%)0/50 (0%) 1/50 (2%) 0/50 (0%) 0/50 (0%) 0/50 (0%) 0/50 (0%)0/50 (0%) 0/50 (0%) 0/50 (0%) 0/50 (0%) 0/50 (0%) 0/50 (0%)0/50 (0%) 0/50 (0%) 0/50 (0%) 0/50 (0%) 0/50 (0%) 0/50 (0%)0/50 (0%) 0/50 (0%)
Overall Incidence Total 2/1249 (0.16%) Mean 0.16% SD 0.55% Total 1/1200 (0.08%) Mean 0.08% SD 0.41%
#Skin:Basal Cell Adenoma
0/50 (0%) 1/50 (2%) 0/50 (0%) 0/50 (0%) 1/50 (2%) 0/50 (0%)0/50 (0%) 1/50 (2%) 0/50 (0%) 0/50 (0%) 0/50 (0%)0/50 (0%) 0/50 (0%) 1/50 (2%) 0/50 (0%) 0/50 (0%) 0/50 (0%)1/50 (2%) 0/50 (0%) 1/50 (2%) 1/50 (2%) 0/50 (0%) 0/50 (0%)0/50 (0%) 2/49 (4%) 0/50 (0%) 0/50 (0%) 0/50 (0%) 0/50 (0%)0/50 (0%) 0/50 (0%) 1/50 (2%) 0/50 (0%) 1/50 (2%) 0/50 (0%)1/50 (2%) 0/50 (0%) 0/50 (0%) 1/50 (2%) 0/50 (0%) 0/50 (0%)2/50 (4%) 0/50 (0%) 1/50 (2%) 0/50 (0%) 0/50 (0%) 0/50 (0%)0/50 (0%) 1/50 (2%)
Overall Incidence Total 12/1249 (0.96%) Mean 0.96% SD 1.31% Total 5/1200 (0.42%) Mean 0.42% SD 0.83%
#Skin:Basal Cell Adenoma or Basosquamous Tumor Benign
0/50 (0%) 1/50 (2%) 0/50 (0%) 0/50 (0%) 1/50 (2%) 0/50 (0%)0/50 (0%) 1/50 (2%) 0/50 (0%) 0/50 (0%) 0/50 (0%)0/50 (0%) 0/50 (0%) 1/50 (2%) 0/50 (0%) 0/50 (0%) 0/50 (0%)1/50 (2%) 0/50 (0%) 1/50 (2%) 1/50 (2%) 0/50 (0%) 0/50 (0%)0/50 (0%) 2/49 (4%) 0/50 (0%) 0/50 (0%) 0/50 (0%) 0/50 (0%)0/50 (0%) 0/50 (0%) 1/50 (2%) 0/50 (0%) 1/50 (2%) 0/50 (0%)1/50 (2%) 0/50 (0%) 0/50 (0%) 1/50 (2%) 0/50 (0%) 0/50 (0%)2/50 (4%) 0/50 (0%) 1/50 (2%) 0/50 (0%) 0/50 (0%) 0/50 (0%)0/50 (0%) 1/50 (2%)
Overall Incidence Total 12/1249 (0.96%) Mean 0.96% SD 1.31% Total 5/1200 (0.42%) Mean 0.42% SD 0.83%
*: Denominator is number of animals with tissues examined microscopically#: Denominator is number of animals necropsied
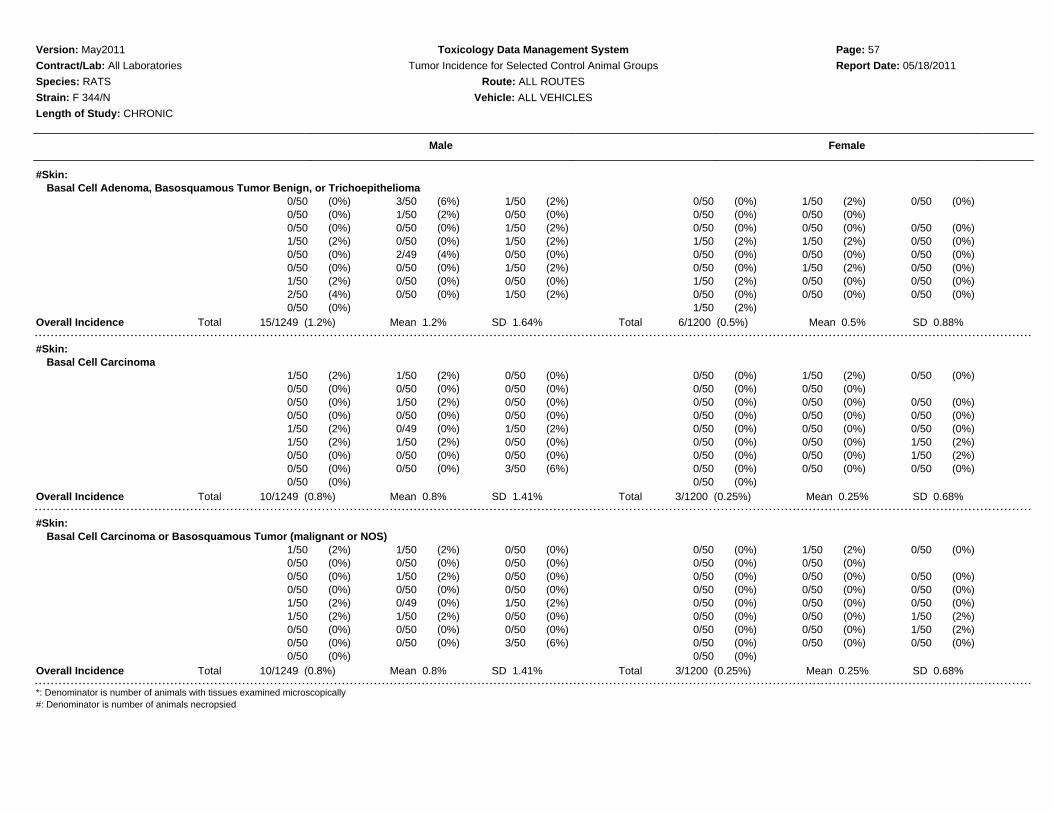
Version: May2011 Toxicology Data Management System Page: 57
Contract/Lab: All Laboratories Tumor Incidence for Selected Control Animal Groups Report Date: 05/18/2011
Species: RATS Route: ALL ROUTES
Strain: F 344/N Vehicle: ALL VEHICLES
Length of Study: CHRONIC
Male Female
#Skin:Basal Cell Adenoma, Basosquamous Tumor Benign, or Trichoepithelioma
0/50 (0%) 3/50 (6%) 1/50 (2%) 0/50 (0%) 1/50 (2%) 0/50 (0%)0/50 (0%) 1/50 (2%) 0/50 (0%) 0/50 (0%) 0/50 (0%)0/50 (0%) 0/50 (0%) 1/50 (2%) 0/50 (0%) 0/50 (0%) 0/50 (0%)1/50 (2%) 0/50 (0%) 1/50 (2%) 1/50 (2%) 1/50 (2%) 0/50 (0%)0/50 (0%) 2/49 (4%) 0/50 (0%) 0/50 (0%) 0/50 (0%) 0/50 (0%)0/50 (0%) 0/50 (0%) 1/50 (2%) 0/50 (0%) 1/50 (2%) 0/50 (0%)1/50 (2%) 0/50 (0%) 0/50 (0%) 1/50 (2%) 0/50 (0%) 0/50 (0%)2/50 (4%) 0/50 (0%) 1/50 (2%) 0/50 (0%) 0/50 (0%) 0/50 (0%)0/50 (0%) 1/50 (2%)
Overall Incidence Total 15/1249 (1.2%) Mean 1.2% SD 1.64% Total 6/1200 (0.5%) Mean 0.5% SD 0.88%
#Skin:Basal Cell Carcinoma
1/50 (2%) 1/50 (2%) 0/50 (0%) 0/50 (0%) 1/50 (2%) 0/50 (0%)0/50 (0%) 0/50 (0%) 0/50 (0%) 0/50 (0%) 0/50 (0%)0/50 (0%) 1/50 (2%) 0/50 (0%) 0/50 (0%) 0/50 (0%) 0/50 (0%)0/50 (0%) 0/50 (0%) 0/50 (0%) 0/50 (0%) 0/50 (0%) 0/50 (0%)1/50 (2%) 0/49 (0%) 1/50 (2%) 0/50 (0%) 0/50 (0%) 0/50 (0%)1/50 (2%) 1/50 (2%) 0/50 (0%) 0/50 (0%) 0/50 (0%) 1/50 (2%)0/50 (0%) 0/50 (0%) 0/50 (0%) 0/50 (0%) 0/50 (0%) 1/50 (2%)0/50 (0%) 0/50 (0%) 3/50 (6%) 0/50 (0%) 0/50 (0%) 0/50 (0%)0/50 (0%) 0/50 (0%)
Overall Incidence Total 10/1249 (0.8%) Mean 0.8% SD 1.41% Total 3/1200 (0.25%) Mean 0.25% SD 0.68%
#Skin:Basal Cell Carcinoma or Basosquamous Tumor (malignant or NOS)
1/50 (2%) 1/50 (2%) 0/50 (0%) 0/50 (0%) 1/50 (2%) 0/50 (0%)0/50 (0%) 0/50 (0%) 0/50 (0%) 0/50 (0%) 0/50 (0%)0/50 (0%) 1/50 (2%) 0/50 (0%) 0/50 (0%) 0/50 (0%) 0/50 (0%)0/50 (0%) 0/50 (0%) 0/50 (0%) 0/50 (0%) 0/50 (0%) 0/50 (0%)1/50 (2%) 0/49 (0%) 1/50 (2%) 0/50 (0%) 0/50 (0%) 0/50 (0%)1/50 (2%) 1/50 (2%) 0/50 (0%) 0/50 (0%) 0/50 (0%) 1/50 (2%)0/50 (0%) 0/50 (0%) 0/50 (0%) 0/50 (0%) 0/50 (0%) 1/50 (2%)0/50 (0%) 0/50 (0%) 3/50 (6%) 0/50 (0%) 0/50 (0%) 0/50 (0%)0/50 (0%) 0/50 (0%)
Overall Incidence Total 10/1249 (0.8%) Mean 0.8% SD 1.41% Total 3/1200 (0.25%) Mean 0.25% SD 0.68%
*: Denominator is number of animals with tissues examined microscopically#: Denominator is number of animals necropsied

Version: May2011 Toxicology Data Management System Page: 58
Contract/Lab: All Laboratories Tumor Incidence for Selected Control Animal Groups Report Date: 05/18/2011
Species: RATS Route: ALL ROUTES
Strain: F 344/N Vehicle: ALL VEHICLES
Length of Study: CHRONIC
Male Female
#Skin:Basal Cell Carcinoma, Basal Cell Adenoma, Basosquamous Tumor (benign, malignant orNOS), or Trichoepithelioma
1/50 (2%) 4/50 (8%) 1/50 (2%) 0/50 (0%) 2/50 (4%) 0/50 (0%)0/50 (0%) 1/50 (2%) 0/50 (0%) 0/50 (0%) 0/50 (0%)0/50 (0%) 1/50 (2%) 1/50 (2%) 0/50 (0%) 0/50 (0%) 0/50 (0%)1/50 (2%) 0/50 (0%) 1/50 (2%) 1/50 (2%) 1/50 (2%) 0/50 (0%)1/50 (2%) 2/49 (4%) 1/50 (2%) 0/50 (0%) 0/50 (0%) 0/50 (0%)1/50 (2%) 1/50 (2%) 1/50 (2%) 0/50 (0%) 1/50 (2%) 1/50 (2%)1/50 (2%) 0/50 (0%) 0/50 (0%) 1/50 (2%) 0/50 (0%) 1/50 (2%)2/50 (4%) 0/50 (0%) 4/50 (8%) 0/50 (0%) 0/50 (0%) 0/50 (0%)0/50 (0%) 1/50 (2%)
Overall Incidence Total 25/1249 (2%) Mean 2% SD 2.16% Total 9/1200 (0.75%) Mean 0.75% SD 1.15%
#Skin:Basal or Sq. Cell Carcinoma, Carcinoma, Basosq. Tumor (M or B), Basal Cell Adenoma,Adenoma, Papilloma, Sq Papilloma, Keratoacanthoma, Trichoepithelioma
5/50 (10%) 9/50 (18%) 2/50 (4%) 0/50 (0%) 2/50 (4%) 0/50 (0%)1/50 (2%) 4/50 (8%) 1/50 (2%) 1/50 (2%) 0/50 (0%)2/50 (4%) 1/50 (2%) 2/50 (4%) 1/50 (2%) 1/50 (2%) 1/50 (2%)2/50 (4%) 2/50 (4%) 4/50 (8%) 3/50 (6%) 1/50 (2%) 0/50 (0%)8/50 (16%) 2/49 (4%) 7/50 (14%) 0/50 (0%) 0/50 (0%) 0/50 (0%)6/50 (12%) 3/50 (6%) 4/50 (8%) 1/50 (2%) 1/50 (2%) 2/50 (4%)6/50 (12%) 3/50 (6%) 3/50 (6%) 1/50 (2%) 1/50 (2%) 1/50 (2%)5/50 (10%) 4/50 (8%) 5/50 (10%) 1/50 (2%) 1/50 (2%) 1/50 (2%)5/50 (10%) 1/50 (2%)
Overall Incidence Total 96/1249 (7.69%) Mean 7.68% SD 4.38% Total 21/1200 (1.75%) Mean 1.75% SD 1.48%
#Skin:Fibroma
5/50 (10%) 11/50 (22%) 1/50 (2%) 3/50 (6%) 2/50 (4%) 2/50 (4%)3/50 (6%) 4/50 (8%) 1/50 (2%) 2/50 (4%) 0/50 (0%)7/50 (14%) 1/50 (2%) 1/50 (2%) 0/50 (0%) 1/50 (2%) 1/50 (2%)2/50 (4%) 5/50 (10%) 5/50 (10%) 0/50 (0%) 1/50 (2%) 1/50 (2%)5/50 (10%) 7/49 (14%) 5/50 (10%) 0/50 (0%) 1/50 (2%) 3/50 (6%)3/50 (6%) 3/50 (6%) 6/50 (12%) 1/50 (2%) 2/50 (4%) 1/50 (2%)3/50 (6%) 3/50 (6%) 1/50 (2%) 2/50 (4%) 3/50 (6%) 1/50 (2%)8/50 (16%) 5/50 (10%) 3/50 (6%) 1/50 (2%) 0/50 (0%) 0/50 (0%)4/50 (8%) 0/50 (0%)
Overall Incidence Total 102/1249 (8.17%) Mean 8.17% SD 4.98% Total 28/1200 (2.33%) Mean 2.33% SD 2.01%
*: Denominator is number of animals with tissues examined microscopically#: Denominator is number of animals necropsied
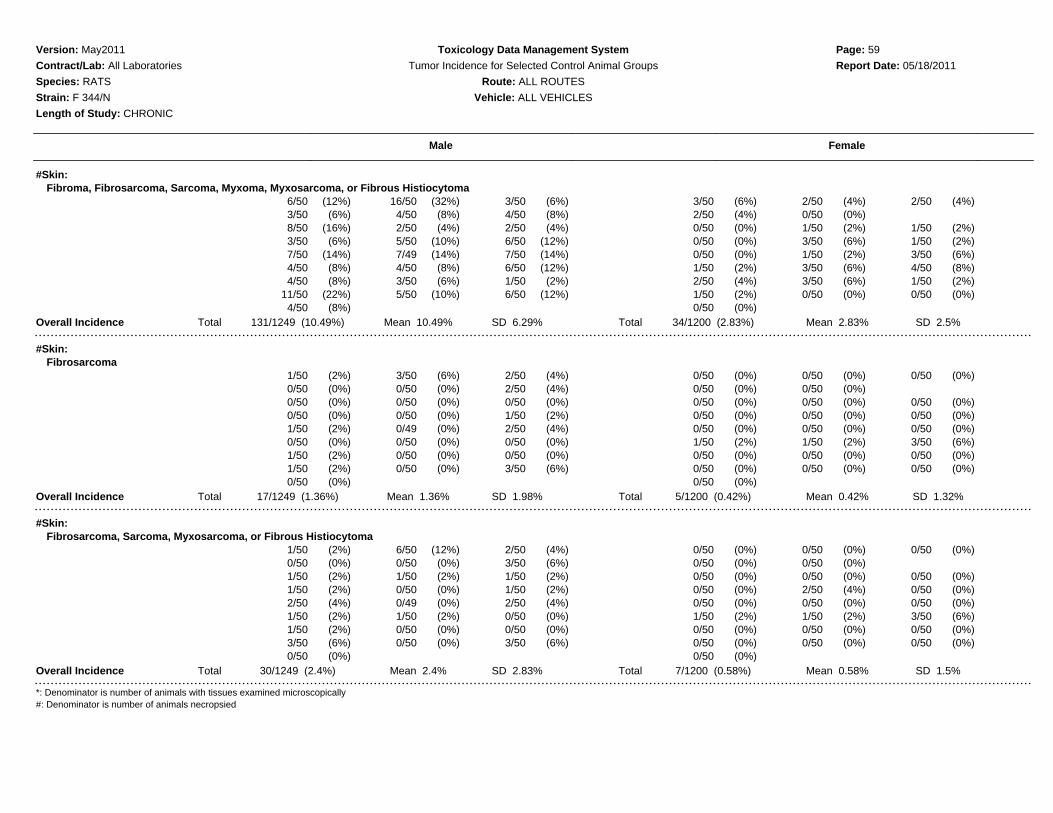
Version: May2011 Toxicology Data Management System Page: 59
Contract/Lab: All Laboratories Tumor Incidence for Selected Control Animal Groups Report Date: 05/18/2011
Species: RATS Route: ALL ROUTES
Strain: F 344/N Vehicle: ALL VEHICLES
Length of Study: CHRONIC
Male Female
#Skin:Fibroma, Fibrosarcoma, Sarcoma, Myxoma, Myxosarcoma, or Fibrous Histiocytoma
6/50 (12%) 16/50 (32%) 3/50 (6%) 3/50 (6%) 2/50 (4%) 2/50 (4%)3/50 (6%) 4/50 (8%) 4/50 (8%) 2/50 (4%) 0/50 (0%)8/50 (16%) 2/50 (4%) 2/50 (4%) 0/50 (0%) 1/50 (2%) 1/50 (2%)3/50 (6%) 5/50 (10%) 6/50 (12%) 0/50 (0%) 3/50 (6%) 1/50 (2%)7/50 (14%) 7/49 (14%) 7/50 (14%) 0/50 (0%) 1/50 (2%) 3/50 (6%)4/50 (8%) 4/50 (8%) 6/50 (12%) 1/50 (2%) 3/50 (6%) 4/50 (8%)4/50 (8%) 3/50 (6%) 1/50 (2%) 2/50 (4%) 3/50 (6%) 1/50 (2%)
11/50 (22%) 5/50 (10%) 6/50 (12%) 1/50 (2%) 0/50 (0%) 0/50 (0%)4/50 (8%) 0/50 (0%)
Overall Incidence Total 131/1249 (10.49%) Mean 10.49% SD 6.29% Total 34/1200 (2.83%) Mean 2.83% SD 2.5%
#Skin:Fibrosarcoma
1/50 (2%) 3/50 (6%) 2/50 (4%) 0/50 (0%) 0/50 (0%) 0/50 (0%)0/50 (0%) 0/50 (0%) 2/50 (4%) 0/50 (0%) 0/50 (0%)0/50 (0%) 0/50 (0%) 0/50 (0%) 0/50 (0%) 0/50 (0%) 0/50 (0%)0/50 (0%) 0/50 (0%) 1/50 (2%) 0/50 (0%) 0/50 (0%) 0/50 (0%)1/50 (2%) 0/49 (0%) 2/50 (4%) 0/50 (0%) 0/50 (0%) 0/50 (0%)0/50 (0%) 0/50 (0%) 0/50 (0%) 1/50 (2%) 1/50 (2%) 3/50 (6%)1/50 (2%) 0/50 (0%) 0/50 (0%) 0/50 (0%) 0/50 (0%) 0/50 (0%)1/50 (2%) 0/50 (0%) 3/50 (6%) 0/50 (0%) 0/50 (0%) 0/50 (0%)0/50 (0%) 0/50 (0%)
Overall Incidence Total 17/1249 (1.36%) Mean 1.36% SD 1.98% Total 5/1200 (0.42%) Mean 0.42% SD 1.32%
#Skin:Fibrosarcoma, Sarcoma, Myxosarcoma, or Fibrous Histiocytoma
1/50 (2%) 6/50 (12%) 2/50 (4%) 0/50 (0%) 0/50 (0%) 0/50 (0%)0/50 (0%) 0/50 (0%) 3/50 (6%) 0/50 (0%) 0/50 (0%)1/50 (2%) 1/50 (2%) 1/50 (2%) 0/50 (0%) 0/50 (0%) 0/50 (0%)1/50 (2%) 0/50 (0%) 1/50 (2%) 0/50 (0%) 2/50 (4%) 0/50 (0%)2/50 (4%) 0/49 (0%) 2/50 (4%) 0/50 (0%) 0/50 (0%) 0/50 (0%)1/50 (2%) 1/50 (2%) 0/50 (0%) 1/50 (2%) 1/50 (2%) 3/50 (6%)1/50 (2%) 0/50 (0%) 0/50 (0%) 0/50 (0%) 0/50 (0%) 0/50 (0%)3/50 (6%) 0/50 (0%) 3/50 (6%) 0/50 (0%) 0/50 (0%) 0/50 (0%)0/50 (0%) 0/50 (0%)
Overall Incidence Total 30/1249 (2.4%) Mean 2.4% SD 2.83% Total 7/1200 (0.58%) Mean 0.58% SD 1.5%
*: Denominator is number of animals with tissues examined microscopically#: Denominator is number of animals necropsied

Version: May2011 Toxicology Data Management System Page: 60
Contract/Lab: All Laboratories Tumor Incidence for Selected Control Animal Groups Report Date: 05/18/2011
Species: RATS Route: ALL ROUTES
Strain: F 344/N Vehicle: ALL VEHICLES
Length of Study: CHRONIC
Male Female
#Skin:Fibrous Histiocytoma
0/50 (0%) 0/50 (0%) 0/50 (0%) 0/50 (0%) 0/50 (0%) 0/50 (0%)0/50 (0%) 0/50 (0%) 0/50 (0%) 0/50 (0%) 0/50 (0%)1/50 (2%) 1/50 (2%) 1/50 (2%) 0/50 (0%) 0/50 (0%) 0/50 (0%)1/50 (2%) 0/50 (0%) 0/50 (0%) 0/50 (0%) 0/50 (0%) 0/50 (0%)0/50 (0%) 0/49 (0%) 0/50 (0%) 0/50 (0%) 0/50 (0%) 0/50 (0%)0/50 (0%) 0/50 (0%) 0/50 (0%) 0/50 (0%) 0/50 (0%) 0/50 (0%)0/50 (0%) 0/50 (0%) 0/50 (0%) 0/50 (0%) 0/50 (0%) 0/50 (0%)0/50 (0%) 0/50 (0%) 0/50 (0%) 0/50 (0%) 0/50 (0%) 0/50 (0%)0/50 (0%) 0/50 (0%)
Overall Incidence Total 4/1249 (0.32%) Mean 0.32% SD 0.75% Total 0/1200 (0%) Mean 0% SD 0%
#Skin:Hemangioma
0/50 (0%) 0/50 (0%) 0/50 (0%) 0/50 (0%) 0/50 (0%) 0/50 (0%)0/50 (0%) 0/50 (0%) 0/50 (0%) 0/50 (0%) 0/50 (0%)0/50 (0%) 0/50 (0%) 0/50 (0%) 0/50 (0%) 0/50 (0%) 0/50 (0%)0/50 (0%) 0/50 (0%) 0/50 (0%) 0/50 (0%) 0/50 (0%) 0/50 (0%)0/50 (0%) 0/49 (0%) 0/50 (0%) 0/50 (0%) 0/50 (0%) 0/50 (0%)0/50 (0%) 0/50 (0%) 0/50 (0%) 0/50 (0%) 0/50 (0%) 0/50 (0%)0/50 (0%) 0/50 (0%) 0/50 (0%) 0/50 (0%) 0/50 (0%) 0/50 (0%)1/50 (2%) 0/50 (0%) 0/50 (0%) 0/50 (0%) 0/50 (0%) 0/50 (0%)0/50 (0%) 0/50 (0%)
Overall Incidence Total 1/1249 (0.08%) Mean 0.08% SD 0.4% Total 0/1200 (0%) Mean 0% SD 0%
#Skin:Hemangiosarcoma
0/50 (0%) 0/50 (0%) 0/50 (0%) 0/50 (0%) 0/50 (0%) 0/50 (0%)0/50 (0%) 0/50 (0%) 0/50 (0%) 0/50 (0%) 0/50 (0%)0/50 (0%) 0/50 (0%) 0/50 (0%) 0/50 (0%) 0/50 (0%) 0/50 (0%)0/50 (0%) 0/50 (0%) 0/50 (0%) 0/50 (0%) 0/50 (0%) 0/50 (0%)0/50 (0%) 0/49 (0%) 0/50 (0%) 0/50 (0%) 0/50 (0%) 0/50 (0%)0/50 (0%) 0/50 (0%) 0/50 (0%) 0/50 (0%) 0/50 (0%) 0/50 (0%)0/50 (0%) 0/50 (0%) 0/50 (0%) 0/50 (0%) 0/50 (0%) 0/50 (0%)0/50 (0%) 0/50 (0%) 1/50 (2%) 0/50 (0%) 0/50 (0%) 0/50 (0%)0/50 (0%) 0/50 (0%)
Overall Incidence Total 1/1249 (0.08%) Mean 0.08% SD 0.4% Total 0/1200 (0%) Mean 0% SD 0%
*: Denominator is number of animals with tissues examined microscopically#: Denominator is number of animals necropsied

Version: May2011 Toxicology Data Management System Page: 61
Contract/Lab: All Laboratories Tumor Incidence for Selected Control Animal Groups Report Date: 05/18/2011
Species: RATS Route: ALL ROUTES
Strain: F 344/N Vehicle: ALL VEHICLES
Length of Study: CHRONIC
Male Female
#Skin:Keratoacanthoma
3/50 (6%) 5/50 (10%) 0/50 (0%) 0/50 (0%) 0/50 (0%) 0/50 (0%)0/50 (0%) 3/50 (6%) 1/50 (2%) 1/50 (2%) 0/50 (0%)2/50 (4%) 0/50 (0%) 2/50 (4%) 0/50 (0%) 1/50 (2%) 0/50 (0%)0/50 (0%) 2/50 (4%) 2/50 (4%) 2/50 (4%) 0/50 (0%) 0/50 (0%)7/50 (14%) 0/49 (0%) 4/50 (8%) 0/50 (0%) 0/50 (0%) 0/50 (0%)4/50 (8%) 2/50 (4%) 3/50 (6%) 0/50 (0%) 0/50 (0%) 1/50 (2%)5/50 (10%) 3/50 (6%) 2/50 (4%) 0/50 (0%) 0/50 (0%) 0/50 (0%)2/50 (4%) 2/50 (4%) 1/50 (2%) 1/50 (2%) 1/50 (2%) 0/50 (0%)4/50 (8%) 0/50 (0%)
Overall Incidence Total 59/1249 (4.72%) Mean 4.72% SD 3.6% Total 7/1200 (0.58%) Mean 0.58% SD 1.1%
#Skin:Lipoma
1/50 (2%) 0/50 (0%) 0/50 (0%) 0/50 (0%) 0/50 (0%) 0/50 (0%)2/50 (4%) 0/50 (0%) 1/50 (2%) 0/50 (0%) 0/50 (0%)1/50 (2%) 0/50 (0%) 0/50 (0%) 0/50 (0%) 0/50 (0%) 0/50 (0%)0/50 (0%) 1/50 (2%) 0/50 (0%) 0/50 (0%) 0/50 (0%) 0/50 (0%)2/50 (4%) 1/49 (2%) 0/50 (0%) 0/50 (0%) 0/50 (0%) 0/50 (0%)1/50 (2%) 0/50 (0%) 0/50 (0%) 0/50 (0%) 0/50 (0%) 0/50 (0%)0/50 (0%) 0/50 (0%) 0/50 (0%) 0/50 (0%) 0/50 (0%) 0/50 (0%)0/50 (0%) 1/50 (2%) 0/50 (0%) 0/50 (0%) 0/50 (0%) 0/50 (0%)2/50 (4%) 0/50 (0%)
Overall Incidence Total 13/1249 (1.04%) Mean 1.04% SD 1.43% Total 0/1200 (0%) Mean 0% SD 0%
#Skin:Liposarcoma
0/50 (0%) 0/50 (0%) 0/50 (0%) 0/50 (0%) 0/50 (0%) 0/50 (0%)0/50 (0%) 0/50 (0%) 0/50 (0%) 0/50 (0%) 0/50 (0%)0/50 (0%) 0/50 (0%) 0/50 (0%) 0/50 (0%) 0/50 (0%) 0/50 (0%)0/50 (0%) 0/50 (0%) 0/50 (0%) 0/50 (0%) 0/50 (0%) 0/50 (0%)0/50 (0%) 1/49 (2%) 0/50 (0%) 0/50 (0%) 0/50 (0%) 0/50 (0%)0/50 (0%) 0/50 (0%) 0/50 (0%) 0/50 (0%) 0/50 (0%) 1/50 (2%)0/50 (0%) 0/50 (0%) 0/50 (0%) 0/50 (0%) 0/50 (0%) 0/50 (0%)0/50 (0%) 0/50 (0%) 0/50 (0%) 0/50 (0%) 0/50 (0%) 0/50 (0%)0/50 (0%) 0/50 (0%)
Overall Incidence Total 1/1249 (0.08%) Mean 0.08% SD 0.41% Total 1/1200 (0.08%) Mean 0.08% SD 0.41%
*: Denominator is number of animals with tissues examined microscopically#: Denominator is number of animals necropsied
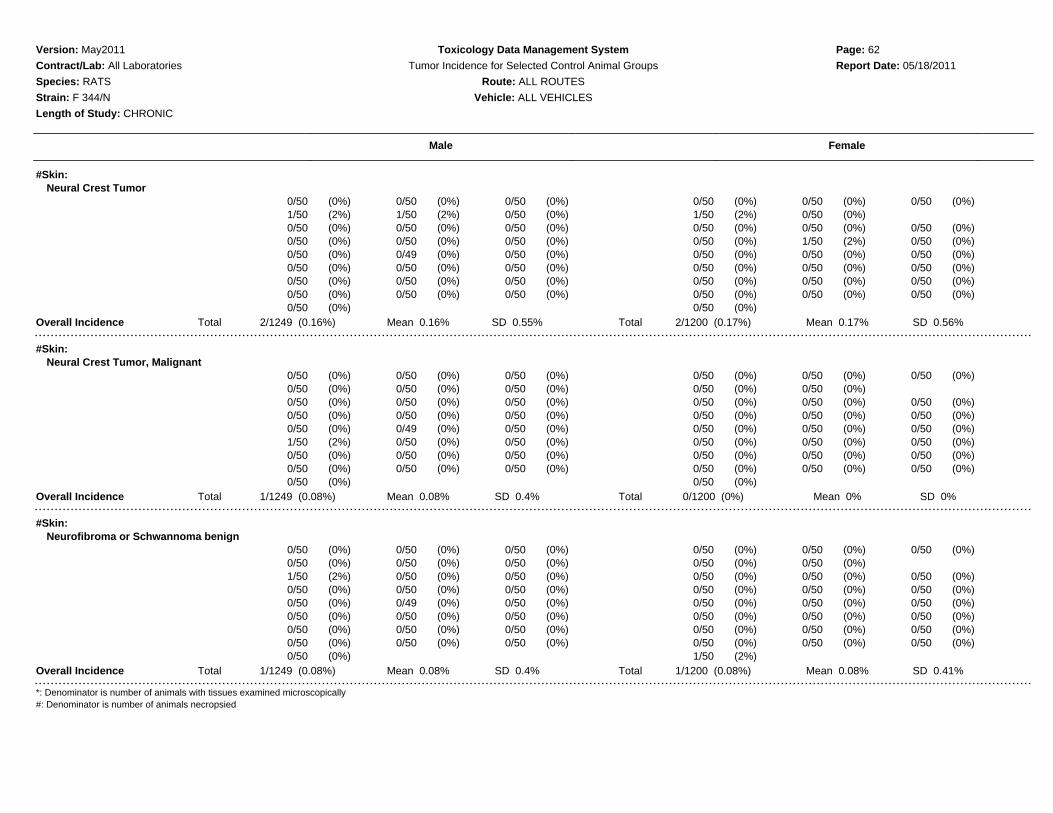
Version: May2011 Toxicology Data Management System Page: 62
Contract/Lab: All Laboratories Tumor Incidence for Selected Control Animal Groups Report Date: 05/18/2011
Species: RATS Route: ALL ROUTES
Strain: F 344/N Vehicle: ALL VEHICLES
Length of Study: CHRONIC
Male Female
#Skin:Neural Crest Tumor
0/50 (0%) 0/50 (0%) 0/50 (0%) 0/50 (0%) 0/50 (0%) 0/50 (0%)1/50 (2%) 1/50 (2%) 0/50 (0%) 1/50 (2%) 0/50 (0%)0/50 (0%) 0/50 (0%) 0/50 (0%) 0/50 (0%) 0/50 (0%) 0/50 (0%)0/50 (0%) 0/50 (0%) 0/50 (0%) 0/50 (0%) 1/50 (2%) 0/50 (0%)0/50 (0%) 0/49 (0%) 0/50 (0%) 0/50 (0%) 0/50 (0%) 0/50 (0%)0/50 (0%) 0/50 (0%) 0/50 (0%) 0/50 (0%) 0/50 (0%) 0/50 (0%)0/50 (0%) 0/50 (0%) 0/50 (0%) 0/50 (0%) 0/50 (0%) 0/50 (0%)0/50 (0%) 0/50 (0%) 0/50 (0%) 0/50 (0%) 0/50 (0%) 0/50 (0%)0/50 (0%) 0/50 (0%)
Overall Incidence Total 2/1249 (0.16%) Mean 0.16% SD 0.55% Total 2/1200 (0.17%) Mean 0.17% SD 0.56%
#Skin:Neural Crest Tumor, Malignant
0/50 (0%) 0/50 (0%) 0/50 (0%) 0/50 (0%) 0/50 (0%) 0/50 (0%)0/50 (0%) 0/50 (0%) 0/50 (0%) 0/50 (0%) 0/50 (0%)0/50 (0%) 0/50 (0%) 0/50 (0%) 0/50 (0%) 0/50 (0%) 0/50 (0%)0/50 (0%) 0/50 (0%) 0/50 (0%) 0/50 (0%) 0/50 (0%) 0/50 (0%)0/50 (0%) 0/49 (0%) 0/50 (0%) 0/50 (0%) 0/50 (0%) 0/50 (0%)1/50 (2%) 0/50 (0%) 0/50 (0%) 0/50 (0%) 0/50 (0%) 0/50 (0%)0/50 (0%) 0/50 (0%) 0/50 (0%) 0/50 (0%) 0/50 (0%) 0/50 (0%)0/50 (0%) 0/50 (0%) 0/50 (0%) 0/50 (0%) 0/50 (0%) 0/50 (0%)0/50 (0%) 0/50 (0%)
Overall Incidence Total 1/1249 (0.08%) Mean 0.08% SD 0.4% Total 0/1200 (0%) Mean 0% SD 0%
#Skin:Neurofibroma or Schwannoma benign
0/50 (0%) 0/50 (0%) 0/50 (0%) 0/50 (0%) 0/50 (0%) 0/50 (0%)0/50 (0%) 0/50 (0%) 0/50 (0%) 0/50 (0%) 0/50 (0%)1/50 (2%) 0/50 (0%) 0/50 (0%) 0/50 (0%) 0/50 (0%) 0/50 (0%)0/50 (0%) 0/50 (0%) 0/50 (0%) 0/50 (0%) 0/50 (0%) 0/50 (0%)0/50 (0%) 0/49 (0%) 0/50 (0%) 0/50 (0%) 0/50 (0%) 0/50 (0%)0/50 (0%) 0/50 (0%) 0/50 (0%) 0/50 (0%) 0/50 (0%) 0/50 (0%)0/50 (0%) 0/50 (0%) 0/50 (0%) 0/50 (0%) 0/50 (0%) 0/50 (0%)0/50 (0%) 0/50 (0%) 0/50 (0%) 0/50 (0%) 0/50 (0%) 0/50 (0%)0/50 (0%) 1/50 (2%)
Overall Incidence Total 1/1249 (0.08%) Mean 0.08% SD 0.4% Total 1/1200 (0.08%) Mean 0.08% SD 0.41%
*: Denominator is number of animals with tissues examined microscopically#: Denominator is number of animals necropsied

Version: May2011 Toxicology Data Management System Page: 63
Contract/Lab: All Laboratories Tumor Incidence for Selected Control Animal Groups Report Date: 05/18/2011
Species: RATS Route: ALL ROUTES
Strain: F 344/N Vehicle: ALL VEHICLES
Length of Study: CHRONIC
Male Female
#Skin:Neurofibrosarcoma or Schwannoma (malignant or NOS)
0/50 (0%) 0/50 (0%) 1/50 (2%) 0/50 (0%) 0/50 (0%) 0/50 (0%)0/50 (0%) 0/50 (0%) 0/50 (0%) 0/50 (0%) 0/50 (0%)1/50 (2%) 0/50 (0%) 1/50 (2%) 0/50 (0%) 0/50 (0%) 0/50 (0%)0/50 (0%) 0/50 (0%) 1/50 (2%) 0/50 (0%) 0/50 (0%) 1/50 (2%)0/50 (0%) 0/49 (0%) 0/50 (0%) 0/50 (0%) 0/50 (0%) 0/50 (0%)0/50 (0%) 0/50 (0%) 0/50 (0%) 0/50 (0%) 0/50 (0%) 0/50 (0%)0/50 (0%) 3/50 (6%) 0/50 (0%) 0/50 (0%) 0/50 (0%) 1/50 (2%)0/50 (0%) 0/50 (0%) 1/50 (2%) 0/50 (0%) 1/50 (2%) 0/50 (0%)0/50 (0%) 0/50 (0%)
Overall Incidence Total 8/1249 (0.64%) Mean 0.64% SD 1.38% Total 3/1200 (0.25%) Mean 0.25% SD 0.68%
#Skin:Neurofibrosarcoma, Neurofibroma, or Schwannoma (benign, malignant or NOS)
0/50 (0%) 0/50 (0%) 1/50 (2%) 0/50 (0%) 0/50 (0%) 0/50 (0%)0/50 (0%) 0/50 (0%) 0/50 (0%) 0/50 (0%) 0/50 (0%)2/50 (4%) 0/50 (0%) 1/50 (2%) 0/50 (0%) 0/50 (0%) 0/50 (0%)0/50 (0%) 0/50 (0%) 1/50 (2%) 0/50 (0%) 0/50 (0%) 1/50 (2%)0/50 (0%) 0/49 (0%) 0/50 (0%) 0/50 (0%) 0/50 (0%) 0/50 (0%)0/50 (0%) 0/50 (0%) 0/50 (0%) 0/50 (0%) 0/50 (0%) 0/50 (0%)0/50 (0%) 3/50 (6%) 0/50 (0%) 0/50 (0%) 0/50 (0%) 1/50 (2%)0/50 (0%) 0/50 (0%) 1/50 (2%) 0/50 (0%) 1/50 (2%) 0/50 (0%)0/50 (0%) 1/50 (2%)
Overall Incidence Total 9/1249 (0.72%) Mean 0.72% SD 1.51% Total 4/1200 (0.33%) Mean 0.33% SD 0.76%
#Skin:Sarcoma
0/50 (0%) 3/50 (6%) 0/50 (0%) 0/50 (0%) 0/50 (0%) 0/50 (0%)0/50 (0%) 0/50 (0%) 1/50 (2%) 0/50 (0%) 0/50 (0%)0/50 (0%) 0/50 (0%) 0/50 (0%) 0/50 (0%) 0/50 (0%) 0/50 (0%)0/50 (0%) 0/50 (0%) 0/50 (0%) 0/50 (0%) 2/50 (4%) 0/50 (0%)1/50 (2%) 0/49 (0%) 0/50 (0%) 0/50 (0%) 0/50 (0%) 0/50 (0%)1/50 (2%) 1/50 (2%) 0/50 (0%) 0/50 (0%) 0/50 (0%) 0/50 (0%)0/50 (0%) 0/50 (0%) 0/50 (0%) 0/50 (0%) 0/50 (0%) 0/50 (0%)2/50 (4%) 0/50 (0%) 0/50 (0%) 0/50 (0%) 0/50 (0%) 0/50 (0%)0/50 (0%) 0/50 (0%)
Overall Incidence Total 9/1249 (0.72%) Mean 0.72% SD 1.51% Total 2/1200 (0.17%) Mean 0.17% SD 0.82%
*: Denominator is number of animals with tissues examined microscopically#: Denominator is number of animals necropsied
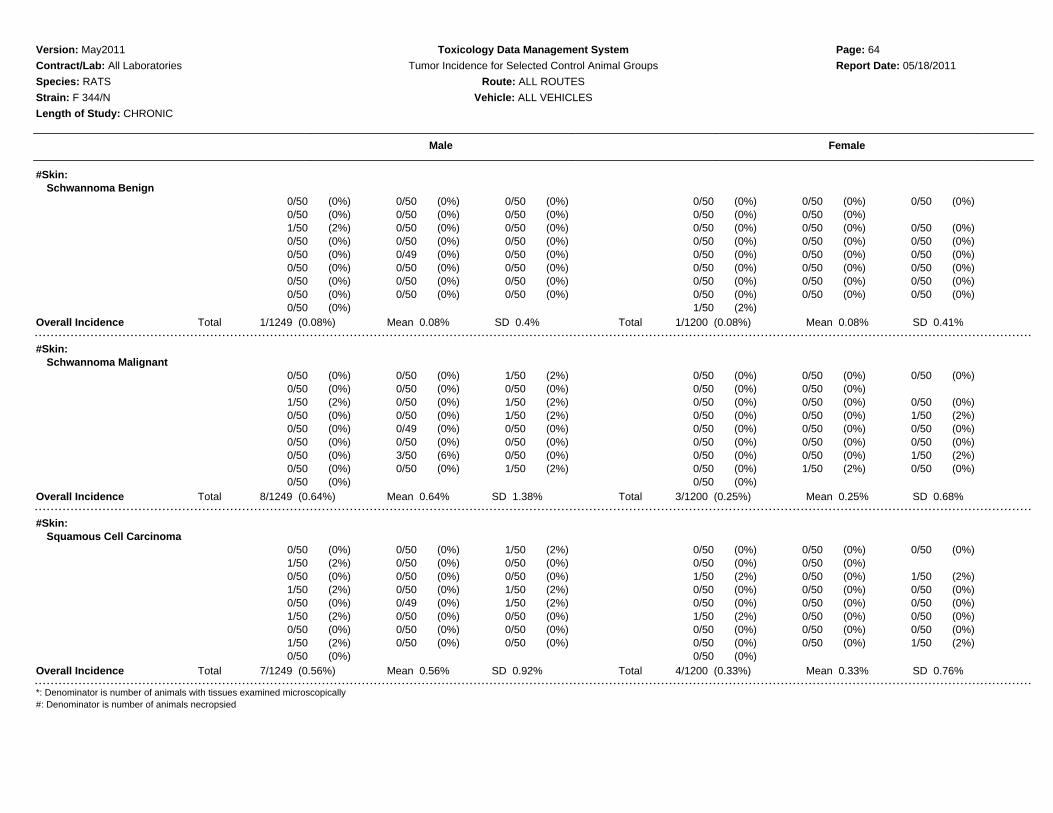
Version: May2011 Toxicology Data Management System Page: 64
Contract/Lab: All Laboratories Tumor Incidence for Selected Control Animal Groups Report Date: 05/18/2011
Species: RATS Route: ALL ROUTES
Strain: F 344/N Vehicle: ALL VEHICLES
Length of Study: CHRONIC
Male Female
#Skin:Schwannoma Benign
0/50 (0%) 0/50 (0%) 0/50 (0%) 0/50 (0%) 0/50 (0%) 0/50 (0%)0/50 (0%) 0/50 (0%) 0/50 (0%) 0/50 (0%) 0/50 (0%)1/50 (2%) 0/50 (0%) 0/50 (0%) 0/50 (0%) 0/50 (0%) 0/50 (0%)0/50 (0%) 0/50 (0%) 0/50 (0%) 0/50 (0%) 0/50 (0%) 0/50 (0%)0/50 (0%) 0/49 (0%) 0/50 (0%) 0/50 (0%) 0/50 (0%) 0/50 (0%)0/50 (0%) 0/50 (0%) 0/50 (0%) 0/50 (0%) 0/50 (0%) 0/50 (0%)0/50 (0%) 0/50 (0%) 0/50 (0%) 0/50 (0%) 0/50 (0%) 0/50 (0%)0/50 (0%) 0/50 (0%) 0/50 (0%) 0/50 (0%) 0/50 (0%) 0/50 (0%)0/50 (0%) 1/50 (2%)
Overall Incidence Total 1/1249 (0.08%) Mean 0.08% SD 0.4% Total 1/1200 (0.08%) Mean 0.08% SD 0.41%
#Skin:Schwannoma Malignant
0/50 (0%) 0/50 (0%) 1/50 (2%) 0/50 (0%) 0/50 (0%) 0/50 (0%)0/50 (0%) 0/50 (0%) 0/50 (0%) 0/50 (0%) 0/50 (0%)1/50 (2%) 0/50 (0%) 1/50 (2%) 0/50 (0%) 0/50 (0%) 0/50 (0%)0/50 (0%) 0/50 (0%) 1/50 (2%) 0/50 (0%) 0/50 (0%) 1/50 (2%)0/50 (0%) 0/49 (0%) 0/50 (0%) 0/50 (0%) 0/50 (0%) 0/50 (0%)0/50 (0%) 0/50 (0%) 0/50 (0%) 0/50 (0%) 0/50 (0%) 0/50 (0%)0/50 (0%) 3/50 (6%) 0/50 (0%) 0/50 (0%) 0/50 (0%) 1/50 (2%)0/50 (0%) 0/50 (0%) 1/50 (2%) 0/50 (0%) 1/50 (2%) 0/50 (0%)0/50 (0%) 0/50 (0%)
Overall Incidence Total 8/1249 (0.64%) Mean 0.64% SD 1.38% Total 3/1200 (0.25%) Mean 0.25% SD 0.68%
#Skin:Squamous Cell Carcinoma
0/50 (0%) 0/50 (0%) 1/50 (2%) 0/50 (0%) 0/50 (0%) 0/50 (0%)1/50 (2%) 0/50 (0%) 0/50 (0%) 0/50 (0%) 0/50 (0%)0/50 (0%) 0/50 (0%) 0/50 (0%) 1/50 (2%) 0/50 (0%) 1/50 (2%)1/50 (2%) 0/50 (0%) 1/50 (2%) 0/50 (0%) 0/50 (0%) 0/50 (0%)0/50 (0%) 0/49 (0%) 1/50 (2%) 0/50 (0%) 0/50 (0%) 0/50 (0%)1/50 (2%) 0/50 (0%) 0/50 (0%) 1/50 (2%) 0/50 (0%) 0/50 (0%)0/50 (0%) 0/50 (0%) 0/50 (0%) 0/50 (0%) 0/50 (0%) 0/50 (0%)1/50 (2%) 0/50 (0%) 0/50 (0%) 0/50 (0%) 0/50 (0%) 1/50 (2%)0/50 (0%) 0/50 (0%)
Overall Incidence Total 7/1249 (0.56%) Mean 0.56% SD 0.92% Total 4/1200 (0.33%) Mean 0.33% SD 0.76%
*: Denominator is number of animals with tissues examined microscopically#: Denominator is number of animals necropsied

Version: May2011 Toxicology Data Management System Page: 65
Contract/Lab: All Laboratories Tumor Incidence for Selected Control Animal Groups Report Date: 05/18/2011
Species: RATS Route: ALL ROUTES
Strain: F 344/N Vehicle: ALL VEHICLES
Length of Study: CHRONIC
Male Female
#Skin:Squamous Cell Carcinoma, Basal Cell Carcinoma, Basosquamous Tumor (malignant or NOS),or Carcinoma
1/50 (2%) 1/50 (2%) 1/50 (2%) 0/50 (0%) 1/50 (2%) 0/50 (0%)1/50 (2%) 0/50 (0%) 0/50 (0%) 0/50 (0%) 0/50 (0%)0/50 (0%) 1/50 (2%) 0/50 (0%) 1/50 (2%) 0/50 (0%) 1/50 (2%)1/50 (2%) 0/50 (0%) 1/50 (2%) 0/50 (0%) 0/50 (0%) 0/50 (0%)1/50 (2%) 0/49 (0%) 2/50 (4%) 0/50 (0%) 0/50 (0%) 0/50 (0%)2/50 (4%) 1/50 (2%) 0/50 (0%) 1/50 (2%) 0/50 (0%) 1/50 (2%)0/50 (0%) 0/50 (0%) 0/50 (0%) 0/50 (0%) 0/50 (0%) 1/50 (2%)1/50 (2%) 0/50 (0%) 3/50 (6%) 0/50 (0%) 0/50 (0%) 1/50 (2%)0/50 (0%) 0/50 (0%)
Overall Incidence Total 17/1249 (1.36%) Mean 1.36% SD 1.6% Total 7/1200 (0.58%) Mean 0.58% SD 0.93%
#Skin:Squamous Cell Papilloma
1/50 (2%) 0/50 (0%) 0/50 (0%) 0/50 (0%) 0/50 (0%) 0/50 (0%)0/50 (0%) 0/50 (0%) 0/50 (0%) 0/50 (0%) 0/50 (0%)0/50 (0%) 0/50 (0%) 0/50 (0%) 0/50 (0%) 0/50 (0%) 0/50 (0%)0/50 (0%) 0/50 (0%) 0/50 (0%) 1/50 (2%) 0/50 (0%) 0/50 (0%)0/50 (0%) 0/49 (0%) 1/50 (2%) 0/50 (0%) 0/50 (0%) 0/50 (0%)1/50 (2%) 0/50 (0%) 0/50 (0%) 0/50 (0%) 0/50 (0%) 0/50 (0%)0/50 (0%) 0/50 (0%) 1/50 (2%) 0/50 (0%) 1/50 (2%) 0/50 (0%)1/50 (2%) 2/50 (4%) 0/50 (0%) 0/50 (0%) 0/50 (0%) 0/50 (0%)1/50 (2%) 0/50 (0%)
Overall Incidence Total 8/1249 (0.64%) Mean 0.64% SD 1.11% Total 2/1200 (0.17%) Mean 0.17% SD 0.56%
#Skin:Squamous Cell Papilloma or Papilloma
1/50 (2%) 0/50 (0%) 0/50 (0%) 0/50 (0%) 0/50 (0%) 0/50 (0%)0/50 (0%) 0/50 (0%) 0/50 (0%) 0/50 (0%) 0/50 (0%)0/50 (0%) 0/50 (0%) 0/50 (0%) 0/50 (0%) 0/50 (0%) 0/50 (0%)0/50 (0%) 0/50 (0%) 0/50 (0%) 1/50 (2%) 0/50 (0%) 0/50 (0%)0/50 (0%) 0/49 (0%) 1/50 (2%) 0/50 (0%) 0/50 (0%) 0/50 (0%)1/50 (2%) 0/50 (0%) 0/50 (0%) 0/50 (0%) 0/50 (0%) 0/50 (0%)0/50 (0%) 0/50 (0%) 1/50 (2%) 0/50 (0%) 1/50 (2%) 0/50 (0%)1/50 (2%) 2/50 (4%) 0/50 (0%) 0/50 (0%) 0/50 (0%) 0/50 (0%)1/50 (2%) 0/50 (0%)
Overall Incidence Total 8/1249 (0.64%) Mean 0.64% SD 1.11% Total 2/1200 (0.17%) Mean 0.17% SD 0.56%
*: Denominator is number of animals with tissues examined microscopically#: Denominator is number of animals necropsied
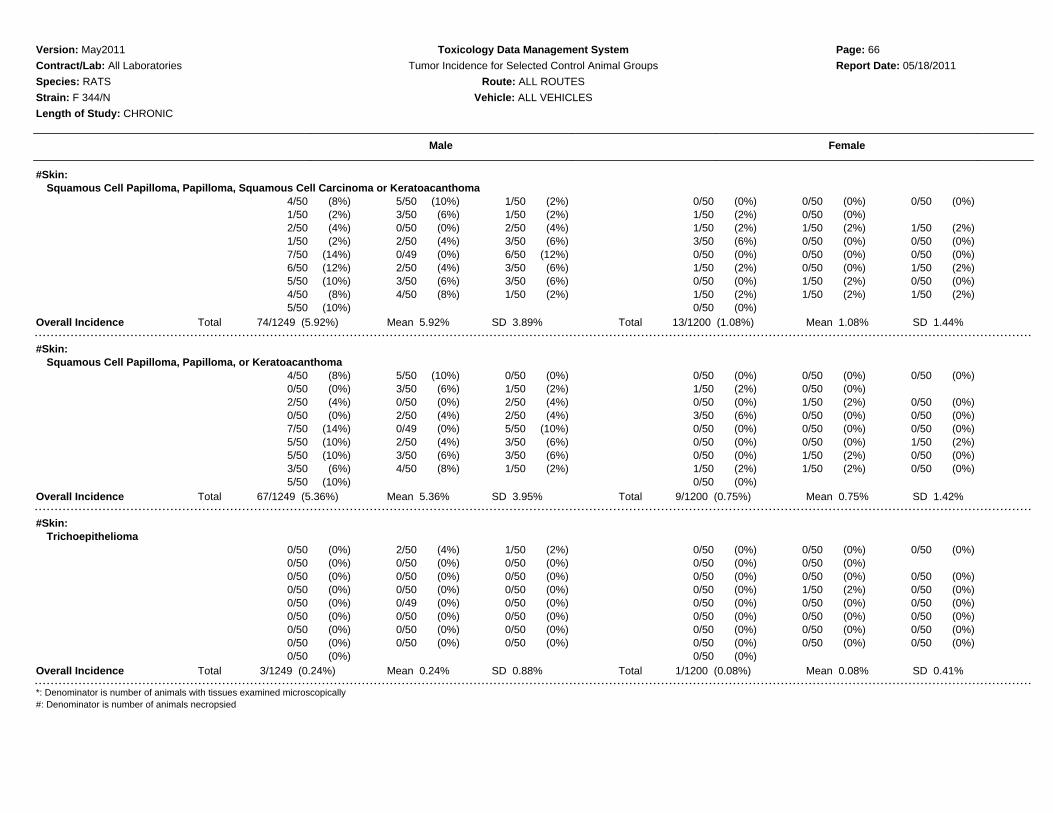
Version: May2011 Toxicology Data Management System Page: 66
Contract/Lab: All Laboratories Tumor Incidence for Selected Control Animal Groups Report Date: 05/18/2011
Species: RATS Route: ALL ROUTES
Strain: F 344/N Vehicle: ALL VEHICLES
Length of Study: CHRONIC
Male Female
#Skin:Squamous Cell Papilloma, Papilloma, Squamous Cell Carcinoma or Keratoacanthoma
4/50 (8%) 5/50 (10%) 1/50 (2%) 0/50 (0%) 0/50 (0%) 0/50 (0%)1/50 (2%) 3/50 (6%) 1/50 (2%) 1/50 (2%) 0/50 (0%)2/50 (4%) 0/50 (0%) 2/50 (4%) 1/50 (2%) 1/50 (2%) 1/50 (2%)1/50 (2%) 2/50 (4%) 3/50 (6%) 3/50 (6%) 0/50 (0%) 0/50 (0%)7/50 (14%) 0/49 (0%) 6/50 (12%) 0/50 (0%) 0/50 (0%) 0/50 (0%)6/50 (12%) 2/50 (4%) 3/50 (6%) 1/50 (2%) 0/50 (0%) 1/50 (2%)5/50 (10%) 3/50 (6%) 3/50 (6%) 0/50 (0%) 1/50 (2%) 0/50 (0%)4/50 (8%) 4/50 (8%) 1/50 (2%) 1/50 (2%) 1/50 (2%) 1/50 (2%)5/50 (10%) 0/50 (0%)
Overall Incidence Total 74/1249 (5.92%) Mean 5.92% SD 3.89% Total 13/1200 (1.08%) Mean 1.08% SD 1.44%
#Skin:Squamous Cell Papilloma, Papilloma, or Keratoacanthoma
4/50 (8%) 5/50 (10%) 0/50 (0%) 0/50 (0%) 0/50 (0%) 0/50 (0%)0/50 (0%) 3/50 (6%) 1/50 (2%) 1/50 (2%) 0/50 (0%)2/50 (4%) 0/50 (0%) 2/50 (4%) 0/50 (0%) 1/50 (2%) 0/50 (0%)0/50 (0%) 2/50 (4%) 2/50 (4%) 3/50 (6%) 0/50 (0%) 0/50 (0%)7/50 (14%) 0/49 (0%) 5/50 (10%) 0/50 (0%) 0/50 (0%) 0/50 (0%)5/50 (10%) 2/50 (4%) 3/50 (6%) 0/50 (0%) 0/50 (0%) 1/50 (2%)5/50 (10%) 3/50 (6%) 3/50 (6%) 0/50 (0%) 1/50 (2%) 0/50 (0%)3/50 (6%) 4/50 (8%) 1/50 (2%) 1/50 (2%) 1/50 (2%) 0/50 (0%)5/50 (10%) 0/50 (0%)
Overall Incidence Total 67/1249 (5.36%) Mean 5.36% SD 3.95% Total 9/1200 (0.75%) Mean 0.75% SD 1.42%
#Skin:Trichoepithelioma
0/50 (0%) 2/50 (4%) 1/50 (2%) 0/50 (0%) 0/50 (0%) 0/50 (0%)0/50 (0%) 0/50 (0%) 0/50 (0%) 0/50 (0%) 0/50 (0%)0/50 (0%) 0/50 (0%) 0/50 (0%) 0/50 (0%) 0/50 (0%) 0/50 (0%)0/50 (0%) 0/50 (0%) 0/50 (0%) 0/50 (0%) 1/50 (2%) 0/50 (0%)0/50 (0%) 0/49 (0%) 0/50 (0%) 0/50 (0%) 0/50 (0%) 0/50 (0%)0/50 (0%) 0/50 (0%) 0/50 (0%) 0/50 (0%) 0/50 (0%) 0/50 (0%)0/50 (0%) 0/50 (0%) 0/50 (0%) 0/50 (0%) 0/50 (0%) 0/50 (0%)0/50 (0%) 0/50 (0%) 0/50 (0%) 0/50 (0%) 0/50 (0%) 0/50 (0%)0/50 (0%) 0/50 (0%)
Overall Incidence Total 3/1249 (0.24%) Mean 0.24% SD 0.88% Total 1/1200 (0.08%) Mean 0.08% SD 0.41%
*: Denominator is number of animals with tissues examined microscopically#: Denominator is number of animals necropsied
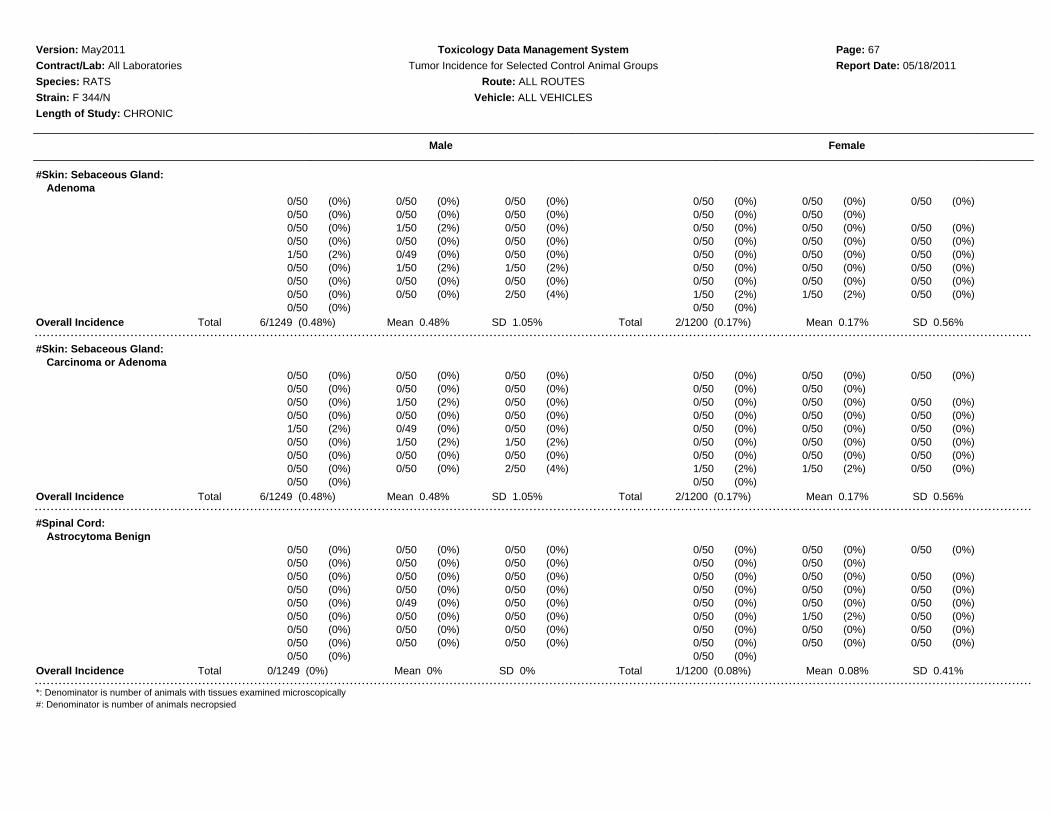
Version: May2011 Toxicology Data Management System Page: 67
Contract/Lab: All Laboratories Tumor Incidence for Selected Control Animal Groups Report Date: 05/18/2011
Species: RATS Route: ALL ROUTES
Strain: F 344/N Vehicle: ALL VEHICLES
Length of Study: CHRONIC
Male Female
#Skin: Sebaceous Gland:Adenoma
0/50 (0%) 0/50 (0%) 0/50 (0%) 0/50 (0%) 0/50 (0%) 0/50 (0%)0/50 (0%) 0/50 (0%) 0/50 (0%) 0/50 (0%) 0/50 (0%)0/50 (0%) 1/50 (2%) 0/50 (0%) 0/50 (0%) 0/50 (0%) 0/50 (0%)0/50 (0%) 0/50 (0%) 0/50 (0%) 0/50 (0%) 0/50 (0%) 0/50 (0%)1/50 (2%) 0/49 (0%) 0/50 (0%) 0/50 (0%) 0/50 (0%) 0/50 (0%)0/50 (0%) 1/50 (2%) 1/50 (2%) 0/50 (0%) 0/50 (0%) 0/50 (0%)0/50 (0%) 0/50 (0%) 0/50 (0%) 0/50 (0%) 0/50 (0%) 0/50 (0%)0/50 (0%) 0/50 (0%) 2/50 (4%) 1/50 (2%) 1/50 (2%) 0/50 (0%)0/50 (0%) 0/50 (0%)
Overall Incidence Total 6/1249 (0.48%) Mean 0.48% SD 1.05% Total 2/1200 (0.17%) Mean 0.17% SD 0.56%
#Skin: Sebaceous Gland:Carcinoma or Adenoma
0/50 (0%) 0/50 (0%) 0/50 (0%) 0/50 (0%) 0/50 (0%) 0/50 (0%)0/50 (0%) 0/50 (0%) 0/50 (0%) 0/50 (0%) 0/50 (0%)0/50 (0%) 1/50 (2%) 0/50 (0%) 0/50 (0%) 0/50 (0%) 0/50 (0%)0/50 (0%) 0/50 (0%) 0/50 (0%) 0/50 (0%) 0/50 (0%) 0/50 (0%)1/50 (2%) 0/49 (0%) 0/50 (0%) 0/50 (0%) 0/50 (0%) 0/50 (0%)0/50 (0%) 1/50 (2%) 1/50 (2%) 0/50 (0%) 0/50 (0%) 0/50 (0%)0/50 (0%) 0/50 (0%) 0/50 (0%) 0/50 (0%) 0/50 (0%) 0/50 (0%)0/50 (0%) 0/50 (0%) 2/50 (4%) 1/50 (2%) 1/50 (2%) 0/50 (0%)0/50 (0%) 0/50 (0%)
Overall Incidence Total 6/1249 (0.48%) Mean 0.48% SD 1.05% Total 2/1200 (0.17%) Mean 0.17% SD 0.56%
#Spinal Cord:Astrocytoma Benign
0/50 (0%) 0/50 (0%) 0/50 (0%) 0/50 (0%) 0/50 (0%) 0/50 (0%)0/50 (0%) 0/50 (0%) 0/50 (0%) 0/50 (0%) 0/50 (0%)0/50 (0%) 0/50 (0%) 0/50 (0%) 0/50 (0%) 0/50 (0%) 0/50 (0%)0/50 (0%) 0/50 (0%) 0/50 (0%) 0/50 (0%) 0/50 (0%) 0/50 (0%)0/50 (0%) 0/49 (0%) 0/50 (0%) 0/50 (0%) 0/50 (0%) 0/50 (0%)0/50 (0%) 0/50 (0%) 0/50 (0%) 0/50 (0%) 1/50 (2%) 0/50 (0%)0/50 (0%) 0/50 (0%) 0/50 (0%) 0/50 (0%) 0/50 (0%) 0/50 (0%)0/50 (0%) 0/50 (0%) 0/50 (0%) 0/50 (0%) 0/50 (0%) 0/50 (0%)0/50 (0%) 0/50 (0%)
Overall Incidence Total 0/1249 (0%) Mean 0% SD 0% Total 1/1200 (0.08%) Mean 0.08% SD 0.41%
*: Denominator is number of animals with tissues examined microscopically#: Denominator is number of animals necropsied

Version: May2011 Toxicology Data Management System Page: 68
Contract/Lab: All Laboratories Tumor Incidence for Selected Control Animal Groups Report Date: 05/18/2011
Species: RATS Route: ALL ROUTES
Strain: F 344/N Vehicle: ALL VEHICLES
Length of Study: CHRONIC
Male Female
#Spinal Cord:Astrocytoma Malignant
0/50 (0%) 0/50 (0%) 1/50 (2%) 0/50 (0%) 0/50 (0%) 0/50 (0%)0/50 (0%) 0/50 (0%) 0/50 (0%) 0/50 (0%) 0/50 (0%)0/50 (0%) 0/50 (0%) 0/50 (0%) 0/50 (0%) 0/50 (0%) 0/50 (0%)0/50 (0%) 0/50 (0%) 0/50 (0%) 0/50 (0%) 0/50 (0%) 0/50 (0%)0/50 (0%) 0/49 (0%) 0/50 (0%) 0/50 (0%) 0/50 (0%) 0/50 (0%)0/50 (0%) 0/50 (0%) 0/50 (0%) 0/50 (0%) 0/50 (0%) 0/50 (0%)0/50 (0%) 0/50 (0%) 0/50 (0%) 0/50 (0%) 0/50 (0%) 0/50 (0%)0/50 (0%) 0/50 (0%) 0/50 (0%) 0/50 (0%) 0/50 (0%) 0/50 (0%)0/50 (0%) 0/50 (0%)
Overall Incidence Total 1/1249 (0.08%) Mean 0.08% SD 0.4% Total 0/1200 (0%) Mean 0% SD 0%
#Spinal Cord:Glioma Malignant
0/50 (0%) 0/50 (0%) 0/50 (0%) 0/50 (0%) 0/50 (0%) 0/50 (0%)0/50 (0%) 0/50 (0%) 0/50 (0%) 0/50 (0%) 0/50 (0%)0/50 (0%) 0/50 (0%) 0/50 (0%) 0/50 (0%) 0/50 (0%) 0/50 (0%)0/50 (0%) 0/50 (0%) 0/50 (0%) 1/50 (2%) 0/50 (0%) 0/50 (0%)0/50 (0%) 1/49 (2%) 0/50 (0%) 0/50 (0%) 0/50 (0%) 0/50 (0%)0/50 (0%) 0/50 (0%) 0/50 (0%) 0/50 (0%) 0/50 (0%) 0/50 (0%)0/50 (0%) 0/50 (0%) 0/50 (0%) 0/50 (0%) 0/50 (0%) 0/50 (0%)0/50 (0%) 0/50 (0%) 0/50 (0%) 0/50 (0%) 0/50 (0%) 0/50 (0%)0/50 (0%) 0/50 (0%)
Overall Incidence Total 1/1249 (0.08%) Mean 0.08% SD 0.41% Total 1/1200 (0.08%) Mean 0.08% SD 0.41%
*Spleen:Fibrosarcoma
0/50 (0%) 0/50 (0%) 0/50 (0%) 0/50 (0%) 0/48 (0%) 0/50 (0%)0/50 (0%) 0/50 (0%) 0/49 (0%) 0/50 (0%) 0/50 (0%)1/50 (2%) 0/50 (0%) 0/50 (0%) 0/50 (0%) 0/50 (0%) 0/50 (0%)0/50 (0%) 0/49 (0%) 0/50 (0%) 0/50 (0%) 0/49 (0%) 0/50 (0%)0/50 (0%) 0/49 (0%) 0/50 (0%) 0/50 (0%) 0/50 (0%) 0/50 (0%)0/50 (0%) 0/50 (0%) 0/50 (0%) 0/49 (0%) 0/50 (0%) 0/50 (0%)0/50 (0%) 0/50 (0%) 0/50 (0%) 0/50 (0%) 0/50 (0%) 0/50 (0%)0/50 (0%) 0/50 (0%) 0/50 (0%) 0/50 (0%) 0/50 (0%) 0/50 (0%)0/50 (0%) 0/50 (0%)
Overall Incidence Total 1/1247 (0.08%) Mean 0.08% SD 0.4% Total 0/1196 (0%) Mean 0% SD 0%
*: Denominator is number of animals with tissues examined microscopically#: Denominator is number of animals necropsied
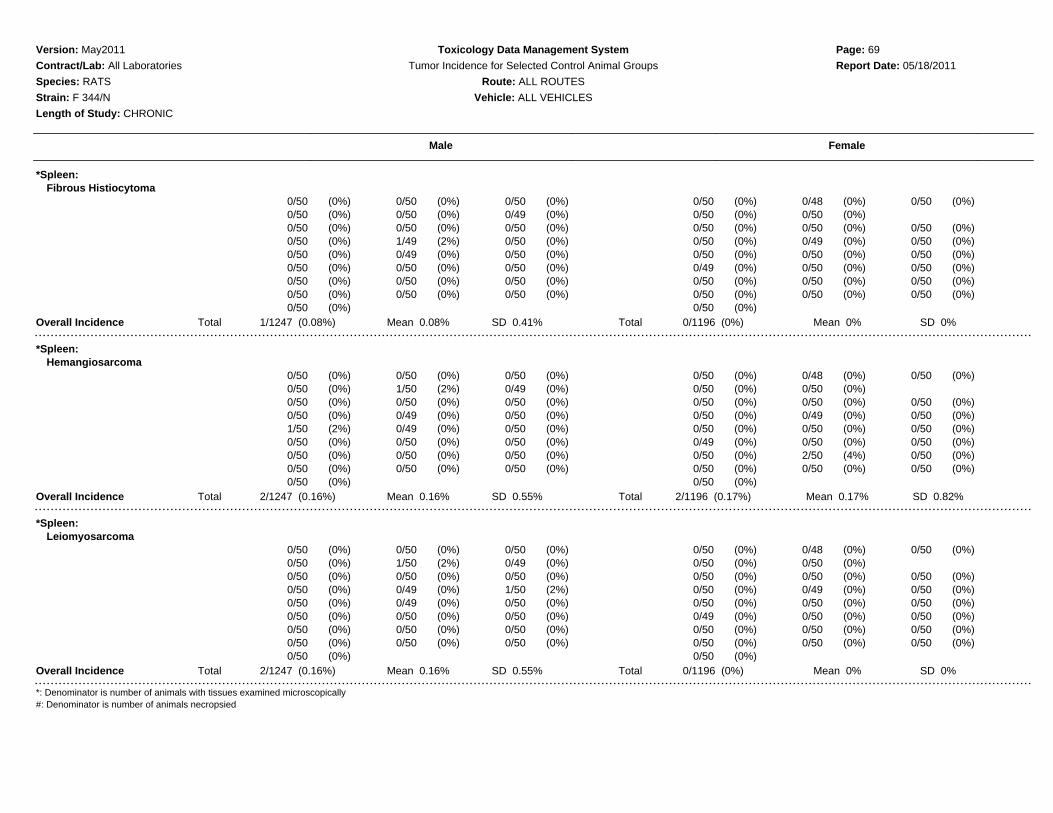
Version: May2011 Toxicology Data Management System Page: 69
Contract/Lab: All Laboratories Tumor Incidence for Selected Control Animal Groups Report Date: 05/18/2011
Species: RATS Route: ALL ROUTES
Strain: F 344/N Vehicle: ALL VEHICLES
Length of Study: CHRONIC
Male Female
*Spleen:Fibrous Histiocytoma
0/50 (0%) 0/50 (0%) 0/50 (0%) 0/50 (0%) 0/48 (0%) 0/50 (0%)0/50 (0%) 0/50 (0%) 0/49 (0%) 0/50 (0%) 0/50 (0%)0/50 (0%) 0/50 (0%) 0/50 (0%) 0/50 (0%) 0/50 (0%) 0/50 (0%)0/50 (0%) 1/49 (2%) 0/50 (0%) 0/50 (0%) 0/49 (0%) 0/50 (0%)0/50 (0%) 0/49 (0%) 0/50 (0%) 0/50 (0%) 0/50 (0%) 0/50 (0%)0/50 (0%) 0/50 (0%) 0/50 (0%) 0/49 (0%) 0/50 (0%) 0/50 (0%)0/50 (0%) 0/50 (0%) 0/50 (0%) 0/50 (0%) 0/50 (0%) 0/50 (0%)0/50 (0%) 0/50 (0%) 0/50 (0%) 0/50 (0%) 0/50 (0%) 0/50 (0%)0/50 (0%) 0/50 (0%)
Overall Incidence Total 1/1247 (0.08%) Mean 0.08% SD 0.41% Total 0/1196 (0%) Mean 0% SD 0%
*Spleen:Hemangiosarcoma
0/50 (0%) 0/50 (0%) 0/50 (0%) 0/50 (0%) 0/48 (0%) 0/50 (0%)0/50 (0%) 1/50 (2%) 0/49 (0%) 0/50 (0%) 0/50 (0%)0/50 (0%) 0/50 (0%) 0/50 (0%) 0/50 (0%) 0/50 (0%) 0/50 (0%)0/50 (0%) 0/49 (0%) 0/50 (0%) 0/50 (0%) 0/49 (0%) 0/50 (0%)1/50 (2%) 0/49 (0%) 0/50 (0%) 0/50 (0%) 0/50 (0%) 0/50 (0%)0/50 (0%) 0/50 (0%) 0/50 (0%) 0/49 (0%) 0/50 (0%) 0/50 (0%)0/50 (0%) 0/50 (0%) 0/50 (0%) 0/50 (0%) 2/50 (4%) 0/50 (0%)0/50 (0%) 0/50 (0%) 0/50 (0%) 0/50 (0%) 0/50 (0%) 0/50 (0%)0/50 (0%) 0/50 (0%)
Overall Incidence Total 2/1247 (0.16%) Mean 0.16% SD 0.55% Total 2/1196 (0.17%) Mean 0.17% SD 0.82%
*Spleen:Leiomyosarcoma
0/50 (0%) 0/50 (0%) 0/50 (0%) 0/50 (0%) 0/48 (0%) 0/50 (0%)0/50 (0%) 1/50 (2%) 0/49 (0%) 0/50 (0%) 0/50 (0%)0/50 (0%) 0/50 (0%) 0/50 (0%) 0/50 (0%) 0/50 (0%) 0/50 (0%)0/50 (0%) 0/49 (0%) 1/50 (2%) 0/50 (0%) 0/49 (0%) 0/50 (0%)0/50 (0%) 0/49 (0%) 0/50 (0%) 0/50 (0%) 0/50 (0%) 0/50 (0%)0/50 (0%) 0/50 (0%) 0/50 (0%) 0/49 (0%) 0/50 (0%) 0/50 (0%)0/50 (0%) 0/50 (0%) 0/50 (0%) 0/50 (0%) 0/50 (0%) 0/50 (0%)0/50 (0%) 0/50 (0%) 0/50 (0%) 0/50 (0%) 0/50 (0%) 0/50 (0%)0/50 (0%) 0/50 (0%)
Overall Incidence Total 2/1247 (0.16%) Mean 0.16% SD 0.55% Total 0/1196 (0%) Mean 0% SD 0%
*: Denominator is number of animals with tissues examined microscopically#: Denominator is number of animals necropsied
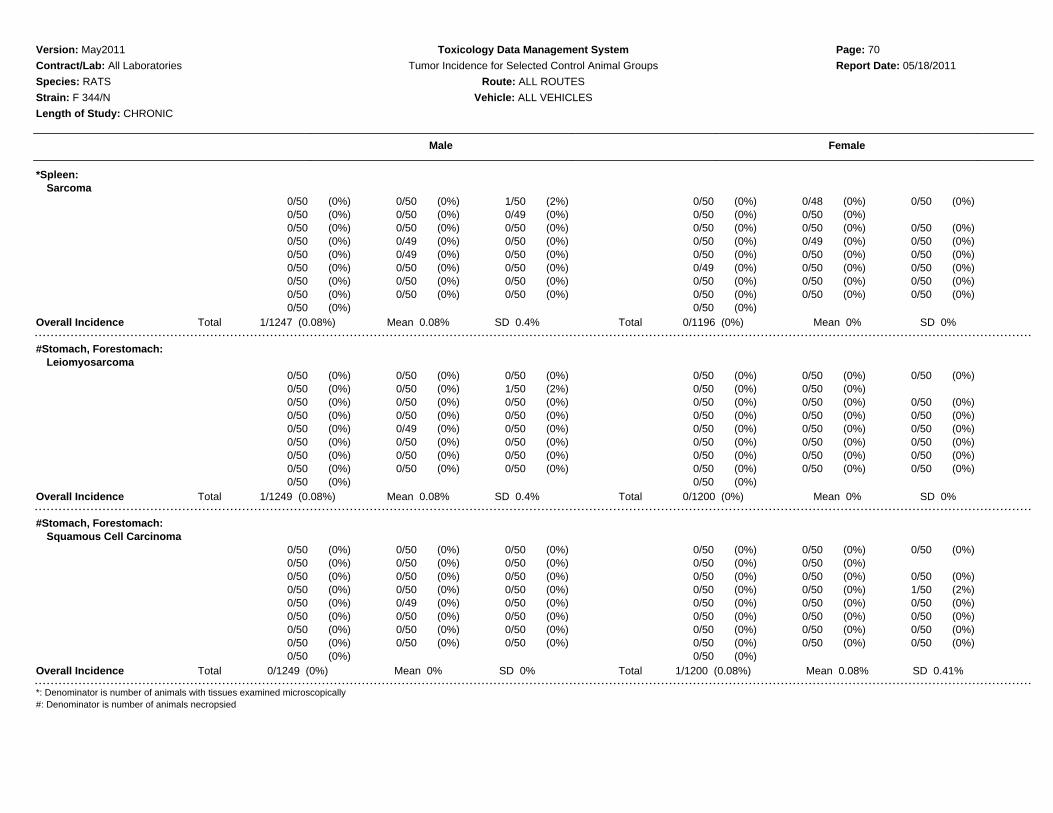
Version: May2011 Toxicology Data Management System Page: 70
Contract/Lab: All Laboratories Tumor Incidence for Selected Control Animal Groups Report Date: 05/18/2011
Species: RATS Route: ALL ROUTES
Strain: F 344/N Vehicle: ALL VEHICLES
Length of Study: CHRONIC
Male Female
*Spleen:Sarcoma
0/50 (0%) 0/50 (0%) 1/50 (2%) 0/50 (0%) 0/48 (0%) 0/50 (0%)0/50 (0%) 0/50 (0%) 0/49 (0%) 0/50 (0%) 0/50 (0%)0/50 (0%) 0/50 (0%) 0/50 (0%) 0/50 (0%) 0/50 (0%) 0/50 (0%)0/50 (0%) 0/49 (0%) 0/50 (0%) 0/50 (0%) 0/49 (0%) 0/50 (0%)0/50 (0%) 0/49 (0%) 0/50 (0%) 0/50 (0%) 0/50 (0%) 0/50 (0%)0/50 (0%) 0/50 (0%) 0/50 (0%) 0/49 (0%) 0/50 (0%) 0/50 (0%)0/50 (0%) 0/50 (0%) 0/50 (0%) 0/50 (0%) 0/50 (0%) 0/50 (0%)0/50 (0%) 0/50 (0%) 0/50 (0%) 0/50 (0%) 0/50 (0%) 0/50 (0%)0/50 (0%) 0/50 (0%)
Overall Incidence Total 1/1247 (0.08%) Mean 0.08% SD 0.4% Total 0/1196 (0%) Mean 0% SD 0%
#Stomach, Forestomach:Leiomyosarcoma
0/50 (0%) 0/50 (0%) 0/50 (0%) 0/50 (0%) 0/50 (0%) 0/50 (0%)0/50 (0%) 0/50 (0%) 1/50 (2%) 0/50 (0%) 0/50 (0%)0/50 (0%) 0/50 (0%) 0/50 (0%) 0/50 (0%) 0/50 (0%) 0/50 (0%)0/50 (0%) 0/50 (0%) 0/50 (0%) 0/50 (0%) 0/50 (0%) 0/50 (0%)0/50 (0%) 0/49 (0%) 0/50 (0%) 0/50 (0%) 0/50 (0%) 0/50 (0%)0/50 (0%) 0/50 (0%) 0/50 (0%) 0/50 (0%) 0/50 (0%) 0/50 (0%)0/50 (0%) 0/50 (0%) 0/50 (0%) 0/50 (0%) 0/50 (0%) 0/50 (0%)0/50 (0%) 0/50 (0%) 0/50 (0%) 0/50 (0%) 0/50 (0%) 0/50 (0%)0/50 (0%) 0/50 (0%)
Overall Incidence Total 1/1249 (0.08%) Mean 0.08% SD 0.4% Total 0/1200 (0%) Mean 0% SD 0%
#Stomach, Forestomach:Squamous Cell Carcinoma
0/50 (0%) 0/50 (0%) 0/50 (0%) 0/50 (0%) 0/50 (0%) 0/50 (0%)0/50 (0%) 0/50 (0%) 0/50 (0%) 0/50 (0%) 0/50 (0%)0/50 (0%) 0/50 (0%) 0/50 (0%) 0/50 (0%) 0/50 (0%) 0/50 (0%)0/50 (0%) 0/50 (0%) 0/50 (0%) 0/50 (0%) 0/50 (0%) 1/50 (2%)0/50 (0%) 0/49 (0%) 0/50 (0%) 0/50 (0%) 0/50 (0%) 0/50 (0%)0/50 (0%) 0/50 (0%) 0/50 (0%) 0/50 (0%) 0/50 (0%) 0/50 (0%)0/50 (0%) 0/50 (0%) 0/50 (0%) 0/50 (0%) 0/50 (0%) 0/50 (0%)0/50 (0%) 0/50 (0%) 0/50 (0%) 0/50 (0%) 0/50 (0%) 0/50 (0%)0/50 (0%) 0/50 (0%)
Overall Incidence Total 0/1249 (0%) Mean 0% SD 0% Total 1/1200 (0.08%) Mean 0.08% SD 0.41%
*: Denominator is number of animals with tissues examined microscopically#: Denominator is number of animals necropsied
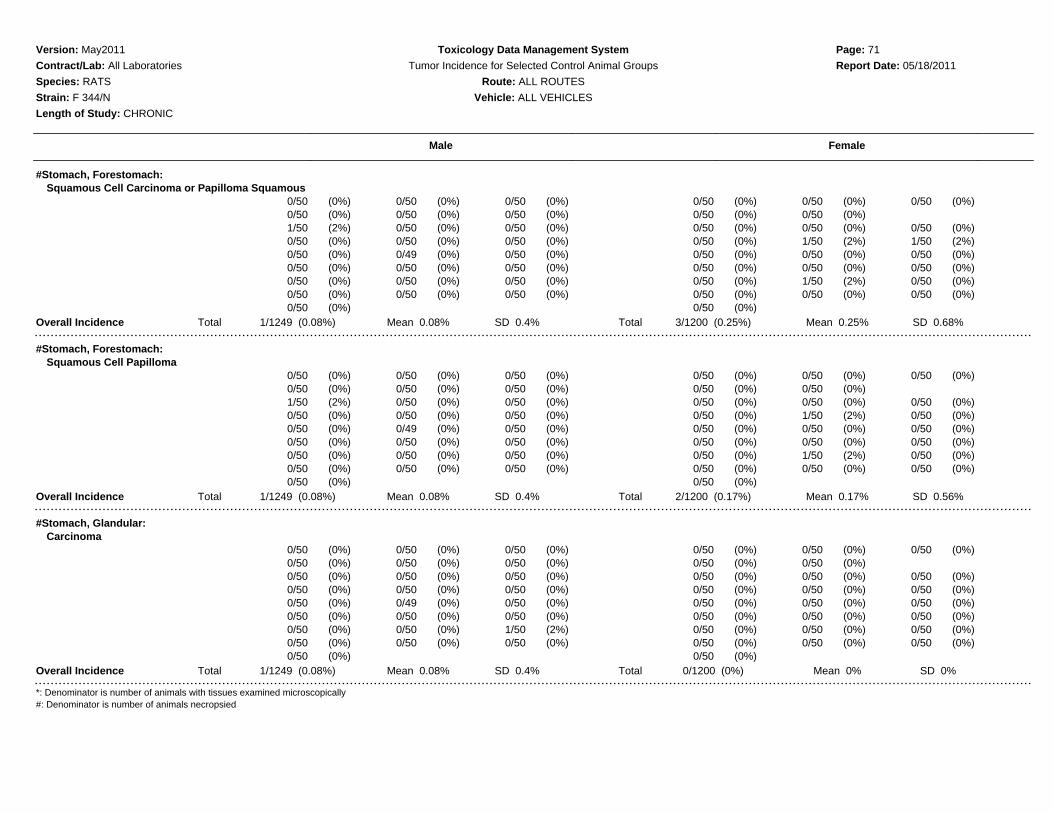
Version: May2011 Toxicology Data Management System Page: 71
Contract/Lab: All Laboratories Tumor Incidence for Selected Control Animal Groups Report Date: 05/18/2011
Species: RATS Route: ALL ROUTES
Strain: F 344/N Vehicle: ALL VEHICLES
Length of Study: CHRONIC
Male Female
#Stomach, Forestomach:Squamous Cell Carcinoma or Papilloma Squamous
0/50 (0%) 0/50 (0%) 0/50 (0%) 0/50 (0%) 0/50 (0%) 0/50 (0%)0/50 (0%) 0/50 (0%) 0/50 (0%) 0/50 (0%) 0/50 (0%)1/50 (2%) 0/50 (0%) 0/50 (0%) 0/50 (0%) 0/50 (0%) 0/50 (0%)0/50 (0%) 0/50 (0%) 0/50 (0%) 0/50 (0%) 1/50 (2%) 1/50 (2%)0/50 (0%) 0/49 (0%) 0/50 (0%) 0/50 (0%) 0/50 (0%) 0/50 (0%)0/50 (0%) 0/50 (0%) 0/50 (0%) 0/50 (0%) 0/50 (0%) 0/50 (0%)0/50 (0%) 0/50 (0%) 0/50 (0%) 0/50 (0%) 1/50 (2%) 0/50 (0%)0/50 (0%) 0/50 (0%) 0/50 (0%) 0/50 (0%) 0/50 (0%) 0/50 (0%)0/50 (0%) 0/50 (0%)
Overall Incidence Total 1/1249 (0.08%) Mean 0.08% SD 0.4% Total 3/1200 (0.25%) Mean 0.25% SD 0.68%
#Stomach, Forestomach:Squamous Cell Papilloma
0/50 (0%) 0/50 (0%) 0/50 (0%) 0/50 (0%) 0/50 (0%) 0/50 (0%)0/50 (0%) 0/50 (0%) 0/50 (0%) 0/50 (0%) 0/50 (0%)1/50 (2%) 0/50 (0%) 0/50 (0%) 0/50 (0%) 0/50 (0%) 0/50 (0%)0/50 (0%) 0/50 (0%) 0/50 (0%) 0/50 (0%) 1/50 (2%) 0/50 (0%)0/50 (0%) 0/49 (0%) 0/50 (0%) 0/50 (0%) 0/50 (0%) 0/50 (0%)0/50 (0%) 0/50 (0%) 0/50 (0%) 0/50 (0%) 0/50 (0%) 0/50 (0%)0/50 (0%) 0/50 (0%) 0/50 (0%) 0/50 (0%) 1/50 (2%) 0/50 (0%)0/50 (0%) 0/50 (0%) 0/50 (0%) 0/50 (0%) 0/50 (0%) 0/50 (0%)0/50 (0%) 0/50 (0%)
Overall Incidence Total 1/1249 (0.08%) Mean 0.08% SD 0.4% Total 2/1200 (0.17%) Mean 0.17% SD 0.56%
#Stomach, Glandular:Carcinoma
0/50 (0%) 0/50 (0%) 0/50 (0%) 0/50 (0%) 0/50 (0%) 0/50 (0%)0/50 (0%) 0/50 (0%) 0/50 (0%) 0/50 (0%) 0/50 (0%)0/50 (0%) 0/50 (0%) 0/50 (0%) 0/50 (0%) 0/50 (0%) 0/50 (0%)0/50 (0%) 0/50 (0%) 0/50 (0%) 0/50 (0%) 0/50 (0%) 0/50 (0%)0/50 (0%) 0/49 (0%) 0/50 (0%) 0/50 (0%) 0/50 (0%) 0/50 (0%)0/50 (0%) 0/50 (0%) 0/50 (0%) 0/50 (0%) 0/50 (0%) 0/50 (0%)0/50 (0%) 0/50 (0%) 1/50 (2%) 0/50 (0%) 0/50 (0%) 0/50 (0%)0/50 (0%) 0/50 (0%) 0/50 (0%) 0/50 (0%) 0/50 (0%) 0/50 (0%)0/50 (0%) 0/50 (0%)
Overall Incidence Total 1/1249 (0.08%) Mean 0.08% SD 0.4% Total 0/1200 (0%) Mean 0% SD 0%
*: Denominator is number of animals with tissues examined microscopically#: Denominator is number of animals necropsied

Version: May2011 Toxicology Data Management System Page: 72
Contract/Lab: All Laboratories Tumor Incidence for Selected Control Animal Groups Report Date: 05/18/2011
Species: RATS Route: ALL ROUTES
Strain: F 344/N Vehicle: ALL VEHICLES
Length of Study: CHRONIC
Male Female
#Stomach, Glandular:Carcinoma or Adenoma
0/50 (0%) 0/50 (0%) 0/50 (0%) 0/50 (0%) 0/50 (0%) 0/50 (0%)0/50 (0%) 0/50 (0%) 0/50 (0%) 0/50 (0%) 0/50 (0%)0/50 (0%) 0/50 (0%) 0/50 (0%) 0/50 (0%) 0/50 (0%) 0/50 (0%)0/50 (0%) 0/50 (0%) 0/50 (0%) 0/50 (0%) 0/50 (0%) 0/50 (0%)0/50 (0%) 0/49 (0%) 0/50 (0%) 0/50 (0%) 0/50 (0%) 0/50 (0%)0/50 (0%) 0/50 (0%) 0/50 (0%) 0/50 (0%) 0/50 (0%) 0/50 (0%)0/50 (0%) 0/50 (0%) 1/50 (2%) 0/50 (0%) 0/50 (0%) 0/50 (0%)0/50 (0%) 0/50 (0%) 0/50 (0%) 0/50 (0%) 0/50 (0%) 0/50 (0%)0/50 (0%) 0/50 (0%)
Overall Incidence Total 1/1249 (0.08%) Mean 0.08% SD 0.4% Total 0/1200 (0%) Mean 0% SD 0%
#Stomach, Glandular:Lipoma
0/50 (0%) 0/50 (0%) 0/50 (0%) 0/50 (0%) 0/50 (0%) 0/50 (0%)0/50 (0%) 0/50 (0%) 0/50 (0%) 0/50 (0%) 0/50 (0%)0/50 (0%) 0/50 (0%) 0/50 (0%) 0/50 (0%) 0/50 (0%) 0/50 (0%)0/50 (0%) 0/50 (0%) 0/50 (0%) 0/50 (0%) 0/50 (0%) 0/50 (0%)0/50 (0%) 0/49 (0%) 0/50 (0%) 0/50 (0%) 0/50 (0%) 0/50 (0%)0/50 (0%) 0/50 (0%) 0/50 (0%) 0/50 (0%) 0/50 (0%) 0/50 (0%)0/50 (0%) 0/50 (0%) 0/50 (0%) 0/50 (0%) 0/50 (0%) 0/50 (0%)1/50 (2%) 0/50 (0%) 0/50 (0%) 0/50 (0%) 0/50 (0%) 0/50 (0%)0/50 (0%) 0/50 (0%)
Overall Incidence Total 1/1249 (0.08%) Mean 0.08% SD 0.4% Total 0/1200 (0%) Mean 0% SD 0%
#Stomach, Glandular:Sarcoma
0/50 (0%) 0/50 (0%) 0/50 (0%) 0/50 (0%) 0/50 (0%) 0/50 (0%)0/50 (0%) 0/50 (0%) 0/50 (0%) 0/50 (0%) 0/50 (0%)0/50 (0%) 0/50 (0%) 0/50 (0%) 0/50 (0%) 0/50 (0%) 0/50 (0%)0/50 (0%) 0/50 (0%) 0/50 (0%) 0/50 (0%) 0/50 (0%) 0/50 (0%)0/50 (0%) 0/49 (0%) 0/50 (0%) 0/50 (0%) 1/50 (2%) 0/50 (0%)0/50 (0%) 0/50 (0%) 0/50 (0%) 0/50 (0%) 0/50 (0%) 0/50 (0%)0/50 (0%) 0/50 (0%) 0/50 (0%) 0/50 (0%) 0/50 (0%) 0/50 (0%)0/50 (0%) 0/50 (0%) 0/50 (0%) 0/50 (0%) 0/50 (0%) 0/50 (0%)0/50 (0%) 0/50 (0%)
Overall Incidence Total 0/1249 (0%) Mean 0% SD 0% Total 1/1200 (0.08%) Mean 0.08% SD 0.41%
*: Denominator is number of animals with tissues examined microscopically#: Denominator is number of animals necropsied

Version: May2011 Toxicology Data Management System Page: 73
Contract/Lab: All Laboratories Tumor Incidence for Selected Control Animal Groups Report Date: 05/18/2011
Species: RATS Route: ALL ROUTES
Strain: F 344/N Vehicle: ALL VEHICLES
Length of Study: CHRONIC
Male Female
*Testes:Adenoma
42/50 (84%) 35/50 (70%) 30/50 (60%)34/50 (68%) 46/50 (92%) 49/50 (98%)37/50 (74%) 36/50 (72%) 37/50 (74%)45/50 (90%) 42/50 (84%) 48/50 (96%)46/50 (92%) 37/49 (76%) 34/50 (68%)46/50 (92%) 47/50 (94%) 40/50 (80%)35/50 (70%) 46/50 (92%) 37/50 (74%)48/50 (96%) 41/50 (82%) 29/50 (58%)27/50 (54%)
Overall Incidence Total 994/1249 (79.58%) Mean 79.58% SD 12.88%
*Testes:Hemangioma
0/50 (0%) 0/50 (0%) 0/50 (0%)0/50 (0%) 0/50 (0%) 0/50 (0%)0/50 (0%) 0/50 (0%) 0/50 (0%)0/50 (0%) 0/50 (0%) 0/50 (0%)0/50 (0%) 0/49 (0%) 0/50 (0%)0/50 (0%) 0/50 (0%) 1/50 (2%)0/50 (0%) 0/50 (0%) 1/50 (2%)0/50 (0%) 0/50 (0%) 0/50 (0%)0/50 (0%)
Overall Incidence Total 2/1249 (0.16%) Mean 0.16% SD 0.55%
*Thymus:Thymoma Benign
0/50 (0%) 0/44 (0%) 0/49 (0%) 0/50 (0%) 0/48 (0%) 0/49 (0%)0/43 (0%) 0/48 (0%) 0/47 (0%) 1/46 (2%) 0/46 (0%)0/49 (0%) 0/44 (0%) 1/47 (2%) 0/45 (0%) 0/48 (0%) 1/50 (2%)0/50 (0%) 1/48 (2%) 0/48 (0%) 0/48 (0%) 0/49 (0%) 1/48 (2%)0/47 (0%) 0/48 (0%) 0/50 (0%) 0/47 (0%) 0/50 (0%) 1/50 (2%)0/41 (0%) 0/47 (0%) 0/50 (0%) 0/50 (0%) 0/49 (0%) 0/47 (0%)0/49 (0%) 0/50 (0%) 0/47 (0%) 0/49 (0%) 0/50 (0%) 1/50 (2%)0/48 (0%) 1/48 (2%) 0/47 (0%) 0/50 (0%) 0/50 (0%) 0/44 (0%)0/45 (0%) 0/47 (0%)
Overall Incidence Total 3/1184 (0.25%) Mean 0.25% SD 0.7% Total 5/1160 (0.43%) Mean 0.43% SD 0.85%
*: Denominator is number of animals with tissues examined microscopically#: Denominator is number of animals necropsied

Version: May2011 Toxicology Data Management System Page: 74
Contract/Lab: All Laboratories Tumor Incidence for Selected Control Animal Groups Report Date: 05/18/2011
Species: RATS Route: ALL ROUTES
Strain: F 344/N Vehicle: ALL VEHICLES
Length of Study: CHRONIC
Male Female
*Thymus:Thymoma Malignant
0/50 (0%) 0/44 (0%) 0/49 (0%) 0/50 (0%) 0/48 (0%) 0/49 (0%)0/43 (0%) 0/48 (0%) 0/47 (0%) 0/46 (0%) 0/46 (0%)0/49 (0%) 0/44 (0%) 0/47 (0%) 0/45 (0%) 0/48 (0%) 0/50 (0%)0/50 (0%) 0/48 (0%) 0/48 (0%) 1/48 (2%) 0/49 (0%) 0/48 (0%)0/47 (0%) 0/48 (0%) 0/50 (0%) 0/47 (0%) 0/50 (0%) 0/50 (0%)0/41 (0%) 0/47 (0%) 0/50 (0%) 0/50 (0%) 0/49 (0%) 0/47 (0%)0/49 (0%) 0/50 (0%) 0/47 (0%) 0/49 (0%) 0/50 (0%) 0/50 (0%)0/48 (0%) 1/48 (2%) 0/47 (0%) 0/50 (0%) 1/50 (2%) 0/44 (0%)0/45 (0%) 0/47 (0%)
Overall Incidence Total 1/1184 (0.08%) Mean 0.08% SD 0.42% Total 2/1160 (0.17%) Mean 0.17% SD 0.58%
*Thymus:Thymoma NOS
0/50 (0%) 0/44 (0%) 0/49 (0%) 0/50 (0%) 0/48 (0%) 0/49 (0%)0/43 (0%) 0/48 (0%) 0/47 (0%) 0/46 (0%) 0/46 (0%)0/49 (0%) 0/44 (0%) 0/47 (0%) 0/45 (0%) 1/48 (2%) 0/50 (0%)0/50 (0%) 0/48 (0%) 0/48 (0%) 0/48 (0%) 0/49 (0%) 0/48 (0%)0/47 (0%) 0/48 (0%) 0/50 (0%) 0/47 (0%) 0/50 (0%) 0/50 (0%)0/41 (0%) 0/47 (0%) 0/50 (0%) 0/50 (0%) 0/49 (0%) 0/47 (0%)0/49 (0%) 0/50 (0%) 0/47 (0%) 0/49 (0%) 0/50 (0%) 0/50 (0%)0/48 (0%) 0/48 (0%) 0/47 (0%) 0/50 (0%) 0/50 (0%) 0/44 (0%)0/45 (0%) 0/47 (0%)
Overall Incidence Total 0/1184 (0%) Mean 0% SD 0% Total 1/1160 (0.09%) Mean 0.09% SD 0.43%
*Thymus:Thymoma: Benign, Malignant, NOS
0/50 (0%) 0/44 (0%) 0/49 (0%) 0/50 (0%) 0/48 (0%) 0/49 (0%)0/43 (0%) 0/48 (0%) 0/47 (0%) 1/46 (2%) 0/46 (0%)0/49 (0%) 0/44 (0%) 1/47 (2%) 0/45 (0%) 1/48 (2%) 1/50 (2%)0/50 (0%) 1/48 (2%) 0/48 (0%) 1/48 (2%) 0/49 (0%) 1/48 (2%)0/47 (0%) 0/48 (0%) 0/50 (0%) 0/47 (0%) 0/50 (0%) 1/50 (2%)0/41 (0%) 0/47 (0%) 0/50 (0%) 0/50 (0%) 0/49 (0%) 0/47 (0%)0/49 (0%) 0/50 (0%) 0/47 (0%) 0/49 (0%) 0/50 (0%) 1/50 (2%)0/48 (0%) 2/48 (4%) 0/47 (0%) 0/50 (0%) 1/50 (2%) 0/44 (0%)0/45 (0%) 0/47 (0%)
Overall Incidence Total 4/1184 (0.34%) Mean 0.34% SD 0.99% Total 8/1160 (0.69%) Mean 0.68% SD 0.99%
*: Denominator is number of animals with tissues examined microscopically#: Denominator is number of animals necropsied

Version: May2011 Toxicology Data Management System Page: 75
Contract/Lab: All Laboratories Tumor Incidence for Selected Control Animal Groups Report Date: 05/18/2011
Species: RATS Route: ALL ROUTES
Strain: F 344/N Vehicle: ALL VEHICLES
Length of Study: CHRONIC
Male Female
*Thyroid Gland: C-Cell:Adenoma
3/50 (6%) 6/46 (13%) 10/50 (20%) 4/50 (8%) 4/42 (10%) 6/50 (12%)5/50 (10%) 5/50 (10%) 6/50 (12%) 3/50 (6%) 3/49 (6%)
10/50 (20%) 7/50 (14%) 10/50 (20%) 8/50 (16%) 4/50 (8%) 11/49 (22%)11/50 (22%) 7/50 (14%) 1/50 (2%) 6/50 (12%) 4/50 (8%) 11/50 (22%)
9/50 (18%) 8/49 (16%) 6/46 (13%) 7/50 (14%) 5/50 (10%) 7/50 (14%)5/48 (10%) 12/50 (24%) 11/50 (22%) 2/47 (4%) 5/50 (10%) 9/49 (18%)
12/50 (24%) 8/50 (16%) 9/50 (18%) 10/50 (20%) 8/50 (16%) 7/50 (14%)5/50 (10%) 12/50 (24%) 5/50 (10%) 8/50 (16%) 6/50 (12%) 3/50 (6%)8/50 (16%) 3/50 (6%)
Overall Incidence Total 191/1239 (15.42%) Mean 15.39% SD 5.86% Total 144/1186 (12.14%) Mean 12.11% SD 5.27%
*Thyroid Gland: C-Cell:Carcinoma
1/50 (2%) 0/46 (0%) 1/50 (2%) 0/50 (0%) 3/42 (7%) 0/50 (0%)4/50 (8%) 4/50 (8%) 1/50 (2%) 1/50 (2%) 1/49 (2%)2/50 (4%) 1/50 (2%) 1/50 (2%) 0/50 (0%) 0/50 (0%) 0/49 (0%)0/50 (0%) 1/50 (2%) 0/50 (0%) 0/50 (0%) 1/50 (2%) 1/50 (2%)6/50 (12%) 0/49 (0%) 0/46 (0%) 3/50 (6%) 0/50 (0%) 1/50 (2%)1/48 (2%) 0/50 (0%) 0/50 (0%) 0/47 (0%) 0/50 (0%) 0/49 (0%)1/50 (2%) 0/50 (0%) 0/50 (0%) 1/50 (2%) 0/50 (0%) 0/50 (0%)1/50 (2%) 0/50 (0%) 2/50 (4%) 2/50 (4%) 0/50 (0%) 0/50 (0%)1/50 (2%) 0/50 (0%)
Overall Incidence Total 28/1239 (2.26%) Mean 2.24% SD 3.02% Total 14/1186 (1.18%) Mean 1.22% SD 2%
*Thyroid Gland: C-Cell:Carcinoma or Adenoma
4/50 (8%) 6/46 (13%) 11/50 (22%) 4/50 (8%) 7/42 (17%) 6/50 (12%)9/50 (18%) 9/50 (18%) 7/50 (14%) 4/50 (8%) 4/49 (8%)
12/50 (24%) 8/50 (16%) 11/50 (22%) 8/50 (16%) 4/50 (8%) 11/49 (22%)11/50 (22%) 8/50 (16%) 1/50 (2%) 6/50 (12%) 5/50 (10%) 12/50 (24%)15/50 (30%) 8/49 (16%) 6/46 (13%) 9/50 (18%) 5/50 (10%) 8/50 (16%)
6/48 (13%) 12/50 (24%) 11/50 (22%) 2/47 (4%) 5/50 (10%) 9/49 (18%)13/50 (26%) 8/50 (16%) 9/50 (18%) 11/50 (22%) 8/50 (16%) 7/50 (14%)
6/50 (12%) 12/50 (24%) 6/50 (12%) 10/50 (20%) 6/50 (12%) 3/50 (6%)8/50 (16%) 3/50 (6%)
Overall Incidence Total 217/1239 (17.51%) Mean 17.48% SD 6.18% Total 157/1186 (13.24%) Mean 13.25% SD 5.66%
*: Denominator is number of animals with tissues examined microscopically#: Denominator is number of animals necropsied

Version: May2011 Toxicology Data Management System Page: 76
Contract/Lab: All Laboratories Tumor Incidence for Selected Control Animal Groups Report Date: 05/18/2011
Species: RATS Route: ALL ROUTES
Strain: F 344/N Vehicle: ALL VEHICLES
Length of Study: CHRONIC
Male Female
*Thyroid Gland: Follicular Cell:Adenoma
3/50 (6%) 0/46 (0%) 0/50 (0%) 0/50 (0%) 0/42 (0%) 1/50 (2%)0/50 (0%) 2/50 (4%) 0/50 (0%) 0/50 (0%) 0/49 (0%)0/50 (0%) 0/50 (0%) 2/50 (4%) 0/50 (0%) 0/50 (0%) 1/49 (2%)0/50 (0%) 0/50 (0%) 1/50 (2%) 0/50 (0%) 0/50 (0%) 1/50 (2%)1/50 (2%) 1/49 (2%) 0/46 (0%) 0/50 (0%) 1/50 (2%) 1/50 (2%)0/48 (0%) 1/50 (2%) 1/50 (2%) 0/47 (0%) 0/50 (0%) 1/49 (2%)0/50 (0%) 0/50 (0%) 0/50 (0%) 0/50 (0%) 0/50 (0%) 1/50 (2%)0/50 (0%) 1/50 (2%) 0/50 (0%) 0/50 (0%) 1/50 (2%) 0/50 (0%)0/50 (0%) 0/50 (0%)
Overall Incidence Total 13/1239 (1.05%) Mean 1.04% SD 1.65% Total 8/1186 (0.67%) Mean 0.67% SD 0.97%
*Thyroid Gland: Follicular Cell:Carcinoma
0/50 (0%) 0/46 (0%) 0/50 (0%) 0/50 (0%) 0/42 (0%) 1/50 (2%)0/50 (0%) 0/50 (0%) 0/50 (0%) 0/50 (0%) 0/49 (0%)1/50 (2%) 0/50 (0%) 0/50 (0%) 0/50 (0%) 0/50 (0%) 0/49 (0%)1/50 (2%) 0/50 (0%) 2/50 (4%) 0/50 (0%) 0/50 (0%) 2/50 (4%)1/50 (2%) 0/49 (0%) 2/46 (4%) 1/50 (2%) 0/50 (0%) 0/50 (0%)0/48 (0%) 2/50 (4%) 0/50 (0%) 1/47 (2%) 0/50 (0%) 0/49 (0%)1/50 (2%) 0/50 (0%) 0/50 (0%) 0/50 (0%) 0/50 (0%) 0/50 (0%)0/50 (0%) 0/50 (0%) 0/50 (0%) 0/50 (0%) 0/50 (0%) 0/50 (0%)0/50 (0%) 0/50 (0%)
Overall Incidence Total 10/1239 (0.81%) Mean 0.81% SD 1.45% Total 5/1186 (0.42%) Mean 0.42% SD 1.03%
*Thyroid Gland: Follicular Cell:Carcinoma or Adenoma
3/50 (6%) 0/46 (0%) 0/50 (0%) 0/50 (0%) 0/42 (0%) 2/50 (4%)0/50 (0%) 2/50 (4%) 0/50 (0%) 0/50 (0%) 0/49 (0%)1/50 (2%) 0/50 (0%) 2/50 (4%) 0/50 (0%) 0/50 (0%) 1/49 (2%)1/50 (2%) 0/50 (0%) 3/50 (6%) 0/50 (0%) 0/50 (0%) 2/50 (4%)2/50 (4%) 1/49 (2%) 2/46 (4%) 1/50 (2%) 1/50 (2%) 1/50 (2%)0/48 (0%) 3/50 (6%) 1/50 (2%) 1/47 (2%) 0/50 (0%) 1/49 (2%)1/50 (2%) 0/50 (0%) 0/50 (0%) 0/50 (0%) 0/50 (0%) 1/50 (2%)0/50 (0%) 1/50 (2%) 0/50 (0%) 0/50 (0%) 1/50 (2%) 0/50 (0%)0/50 (0%) 0/50 (0%)
Overall Incidence Total 23/1239 (1.86%) Mean 1.86% SD 2.17% Total 12/1186 (1.01%) Mean 1.01% SD 1.33%
*: Denominator is number of animals with tissues examined microscopically#: Denominator is number of animals necropsied

Version: May2011 Toxicology Data Management System Page: 77
Contract/Lab: All Laboratories Tumor Incidence for Selected Control Animal Groups Report Date: 05/18/2011
Species: RATS Route: ALL ROUTES
Strain: F 344/N Vehicle: ALL VEHICLES
Length of Study: CHRONIC
Male Female
#Tissue NOS:Paraganglioma
0/50 (0%) 0/50 (0%) 0/50 (0%) 0/50 (0%) 0/50 (0%) 0/50 (0%)0/50 (0%) 0/50 (0%) 0/50 (0%) 0/50 (0%) 0/50 (0%)0/50 (0%) 0/50 (0%) 0/50 (0%) 0/50 (0%) 0/50 (0%) 0/50 (0%)0/50 (0%) 0/50 (0%) 0/50 (0%) 0/50 (0%) 0/50 (0%) 0/50 (0%)0/50 (0%) 0/49 (0%) 0/50 (0%) 0/50 (0%) 0/50 (0%) 0/50 (0%)1/50 (2%) 0/50 (0%) 0/50 (0%) 0/50 (0%) 0/50 (0%) 0/50 (0%)0/50 (0%) 0/50 (0%) 0/50 (0%) 0/50 (0%) 0/50 (0%) 0/50 (0%)0/50 (0%) 0/50 (0%) 0/50 (0%) 0/50 (0%) 0/50 (0%) 0/50 (0%)0/50 (0%) 0/50 (0%)
Overall Incidence Total 1/1249 (0.08%) Mean 0.08% SD 0.4% Total 0/1200 (0%) Mean 0% SD 0%
#Tongue:Squamous Cell Carcinoma
0/50 (0%) 0/50 (0%) 0/50 (0%) 0/50 (0%) 0/50 (0%) 0/50 (0%)0/50 (0%) 0/50 (0%) 0/50 (0%) 0/50 (0%) 0/50 (0%)0/50 (0%) 0/50 (0%) 0/50 (0%) 0/50 (0%) 0/50 (0%) 0/50 (0%)0/50 (0%) 0/50 (0%) 0/50 (0%) 0/50 (0%) 0/50 (0%) 0/50 (0%)0/50 (0%) 0/49 (0%) 0/50 (0%) 0/50 (0%) 0/50 (0%) 0/50 (0%)0/50 (0%) 0/50 (0%) 0/50 (0%) 0/50 (0%) 0/50 (0%) 0/50 (0%)0/50 (0%) 0/50 (0%) 1/50 (2%) 0/50 (0%) 0/50 (0%) 0/50 (0%)0/50 (0%) 0/50 (0%) 0/50 (0%) 0/50 (0%) 0/50 (0%) 1/50 (2%)0/50 (0%) 0/50 (0%)
Overall Incidence Total 1/1249 (0.08%) Mean 0.08% SD 0.4% Total 1/1200 (0.08%) Mean 0.08% SD 0.41%
#Tongue:Squamous Cell Carcinoma or Papilloma Squamous
1/50 (2%) 0/50 (0%) 0/50 (0%) 0/50 (0%) 0/50 (0%) 0/50 (0%)0/50 (0%) 1/50 (2%) 0/50 (0%) 0/50 (0%) 0/50 (0%)0/50 (0%) 0/50 (0%) 0/50 (0%) 0/50 (0%) 0/50 (0%) 0/50 (0%)0/50 (0%) 1/50 (2%) 0/50 (0%) 0/50 (0%) 1/50 (2%) 0/50 (0%)0/50 (0%) 0/49 (0%) 0/50 (0%) 0/50 (0%) 0/50 (0%) 0/50 (0%)1/50 (2%) 0/50 (0%) 0/50 (0%) 0/50 (0%) 1/50 (2%) 1/50 (2%)0/50 (0%) 0/50 (0%) 1/50 (2%) 0/50 (0%) 0/50 (0%) 0/50 (0%)0/50 (0%) 0/50 (0%) 0/50 (0%) 1/50 (2%) 0/50 (0%) 1/50 (2%)1/50 (2%) 0/50 (0%)
Overall Incidence Total 6/1249 (0.48%) Mean 0.48% SD 0.87% Total 5/1200 (0.42%) Mean 0.42% SD 0.83%
*: Denominator is number of animals with tissues examined microscopically#: Denominator is number of animals necropsied
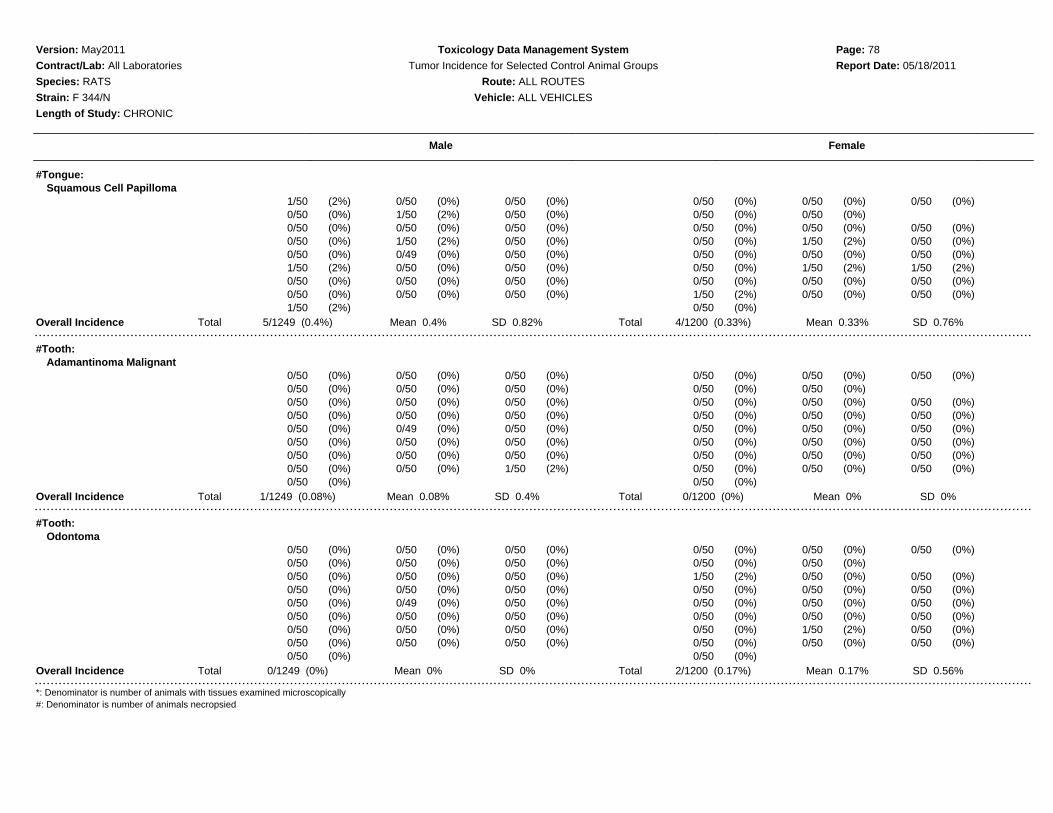
Version: May2011 Toxicology Data Management System Page: 78
Contract/Lab: All Laboratories Tumor Incidence for Selected Control Animal Groups Report Date: 05/18/2011
Species: RATS Route: ALL ROUTES
Strain: F 344/N Vehicle: ALL VEHICLES
Length of Study: CHRONIC
Male Female
#Tongue:Squamous Cell Papilloma
1/50 (2%) 0/50 (0%) 0/50 (0%) 0/50 (0%) 0/50 (0%) 0/50 (0%)0/50 (0%) 1/50 (2%) 0/50 (0%) 0/50 (0%) 0/50 (0%)0/50 (0%) 0/50 (0%) 0/50 (0%) 0/50 (0%) 0/50 (0%) 0/50 (0%)0/50 (0%) 1/50 (2%) 0/50 (0%) 0/50 (0%) 1/50 (2%) 0/50 (0%)0/50 (0%) 0/49 (0%) 0/50 (0%) 0/50 (0%) 0/50 (0%) 0/50 (0%)1/50 (2%) 0/50 (0%) 0/50 (0%) 0/50 (0%) 1/50 (2%) 1/50 (2%)0/50 (0%) 0/50 (0%) 0/50 (0%) 0/50 (0%) 0/50 (0%) 0/50 (0%)0/50 (0%) 0/50 (0%) 0/50 (0%) 1/50 (2%) 0/50 (0%) 0/50 (0%)1/50 (2%) 0/50 (0%)
Overall Incidence Total 5/1249 (0.4%) Mean 0.4% SD 0.82% Total 4/1200 (0.33%) Mean 0.33% SD 0.76%
#Tooth:Adamantinoma Malignant
0/50 (0%) 0/50 (0%) 0/50 (0%) 0/50 (0%) 0/50 (0%) 0/50 (0%)0/50 (0%) 0/50 (0%) 0/50 (0%) 0/50 (0%) 0/50 (0%)0/50 (0%) 0/50 (0%) 0/50 (0%) 0/50 (0%) 0/50 (0%) 0/50 (0%)0/50 (0%) 0/50 (0%) 0/50 (0%) 0/50 (0%) 0/50 (0%) 0/50 (0%)0/50 (0%) 0/49 (0%) 0/50 (0%) 0/50 (0%) 0/50 (0%) 0/50 (0%)0/50 (0%) 0/50 (0%) 0/50 (0%) 0/50 (0%) 0/50 (0%) 0/50 (0%)0/50 (0%) 0/50 (0%) 0/50 (0%) 0/50 (0%) 0/50 (0%) 0/50 (0%)0/50 (0%) 0/50 (0%) 1/50 (2%) 0/50 (0%) 0/50 (0%) 0/50 (0%)0/50 (0%) 0/50 (0%)
Overall Incidence Total 1/1249 (0.08%) Mean 0.08% SD 0.4% Total 0/1200 (0%) Mean 0% SD 0%
#Tooth:Odontoma
0/50 (0%) 0/50 (0%) 0/50 (0%) 0/50 (0%) 0/50 (0%) 0/50 (0%)0/50 (0%) 0/50 (0%) 0/50 (0%) 0/50 (0%) 0/50 (0%)0/50 (0%) 0/50 (0%) 0/50 (0%) 1/50 (2%) 0/50 (0%) 0/50 (0%)0/50 (0%) 0/50 (0%) 0/50 (0%) 0/50 (0%) 0/50 (0%) 0/50 (0%)0/50 (0%) 0/49 (0%) 0/50 (0%) 0/50 (0%) 0/50 (0%) 0/50 (0%)0/50 (0%) 0/50 (0%) 0/50 (0%) 0/50 (0%) 0/50 (0%) 0/50 (0%)0/50 (0%) 0/50 (0%) 0/50 (0%) 0/50 (0%) 1/50 (2%) 0/50 (0%)0/50 (0%) 0/50 (0%) 0/50 (0%) 0/50 (0%) 0/50 (0%) 0/50 (0%)0/50 (0%) 0/50 (0%)
Overall Incidence Total 0/1249 (0%) Mean 0% SD 0% Total 2/1200 (0.17%) Mean 0.17% SD 0.56%
*: Denominator is number of animals with tissues examined microscopically#: Denominator is number of animals necropsied
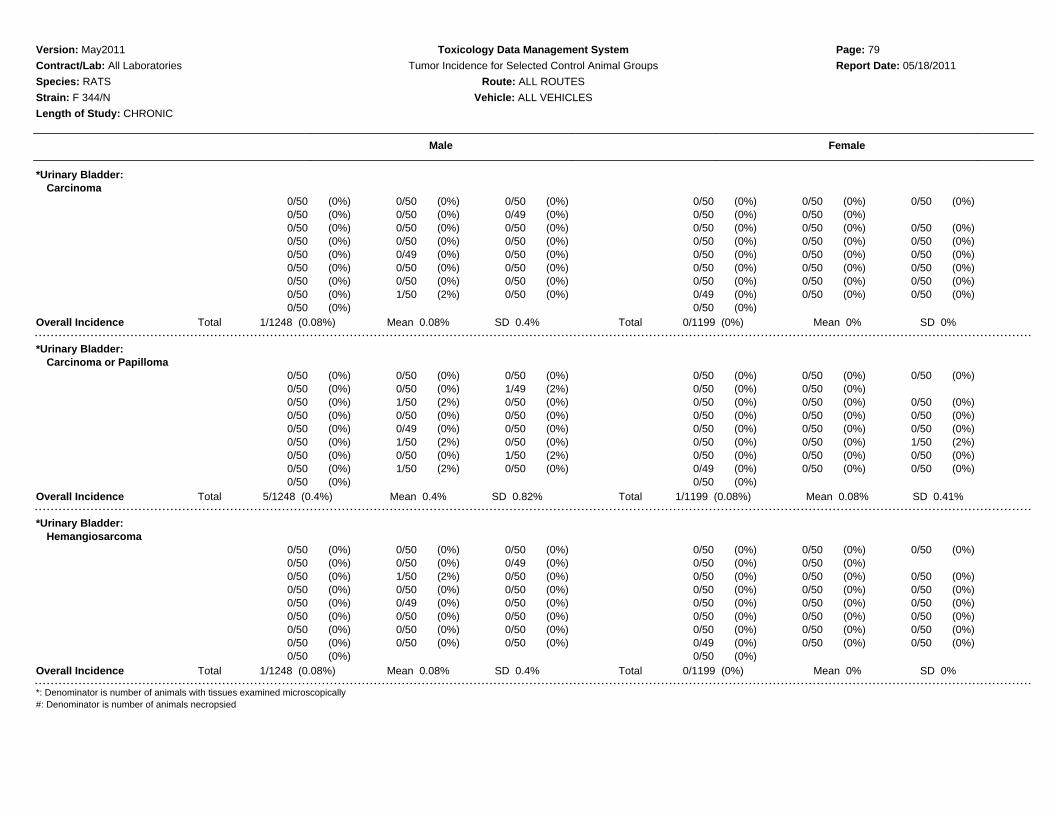
Version: May2011 Toxicology Data Management System Page: 79
Contract/Lab: All Laboratories Tumor Incidence for Selected Control Animal Groups Report Date: 05/18/2011
Species: RATS Route: ALL ROUTES
Strain: F 344/N Vehicle: ALL VEHICLES
Length of Study: CHRONIC
Male Female
*Urinary Bladder:Carcinoma
0/50 (0%) 0/50 (0%) 0/50 (0%) 0/50 (0%) 0/50 (0%) 0/50 (0%)0/50 (0%) 0/50 (0%) 0/49 (0%) 0/50 (0%) 0/50 (0%)0/50 (0%) 0/50 (0%) 0/50 (0%) 0/50 (0%) 0/50 (0%) 0/50 (0%)0/50 (0%) 0/50 (0%) 0/50 (0%) 0/50 (0%) 0/50 (0%) 0/50 (0%)0/50 (0%) 0/49 (0%) 0/50 (0%) 0/50 (0%) 0/50 (0%) 0/50 (0%)0/50 (0%) 0/50 (0%) 0/50 (0%) 0/50 (0%) 0/50 (0%) 0/50 (0%)0/50 (0%) 0/50 (0%) 0/50 (0%) 0/50 (0%) 0/50 (0%) 0/50 (0%)0/50 (0%) 1/50 (2%) 0/50 (0%) 0/49 (0%) 0/50 (0%) 0/50 (0%)0/50 (0%) 0/50 (0%)
Overall Incidence Total 1/1248 (0.08%) Mean 0.08% SD 0.4% Total 0/1199 (0%) Mean 0% SD 0%
*Urinary Bladder:Carcinoma or Papilloma
0/50 (0%) 0/50 (0%) 0/50 (0%) 0/50 (0%) 0/50 (0%) 0/50 (0%)0/50 (0%) 0/50 (0%) 1/49 (2%) 0/50 (0%) 0/50 (0%)0/50 (0%) 1/50 (2%) 0/50 (0%) 0/50 (0%) 0/50 (0%) 0/50 (0%)0/50 (0%) 0/50 (0%) 0/50 (0%) 0/50 (0%) 0/50 (0%) 0/50 (0%)0/50 (0%) 0/49 (0%) 0/50 (0%) 0/50 (0%) 0/50 (0%) 0/50 (0%)0/50 (0%) 1/50 (2%) 0/50 (0%) 0/50 (0%) 0/50 (0%) 1/50 (2%)0/50 (0%) 0/50 (0%) 1/50 (2%) 0/50 (0%) 0/50 (0%) 0/50 (0%)0/50 (0%) 1/50 (2%) 0/50 (0%) 0/49 (0%) 0/50 (0%) 0/50 (0%)0/50 (0%) 0/50 (0%)
Overall Incidence Total 5/1248 (0.4%) Mean 0.4% SD 0.82% Total 1/1199 (0.08%) Mean 0.08% SD 0.41%
*Urinary Bladder:Hemangiosarcoma
0/50 (0%) 0/50 (0%) 0/50 (0%) 0/50 (0%) 0/50 (0%) 0/50 (0%)0/50 (0%) 0/50 (0%) 0/49 (0%) 0/50 (0%) 0/50 (0%)0/50 (0%) 1/50 (2%) 0/50 (0%) 0/50 (0%) 0/50 (0%) 0/50 (0%)0/50 (0%) 0/50 (0%) 0/50 (0%) 0/50 (0%) 0/50 (0%) 0/50 (0%)0/50 (0%) 0/49 (0%) 0/50 (0%) 0/50 (0%) 0/50 (0%) 0/50 (0%)0/50 (0%) 0/50 (0%) 0/50 (0%) 0/50 (0%) 0/50 (0%) 0/50 (0%)0/50 (0%) 0/50 (0%) 0/50 (0%) 0/50 (0%) 0/50 (0%) 0/50 (0%)0/50 (0%) 0/50 (0%) 0/50 (0%) 0/49 (0%) 0/50 (0%) 0/50 (0%)0/50 (0%) 0/50 (0%)
Overall Incidence Total 1/1248 (0.08%) Mean 0.08% SD 0.4% Total 0/1199 (0%) Mean 0% SD 0%
*: Denominator is number of animals with tissues examined microscopically#: Denominator is number of animals necropsied
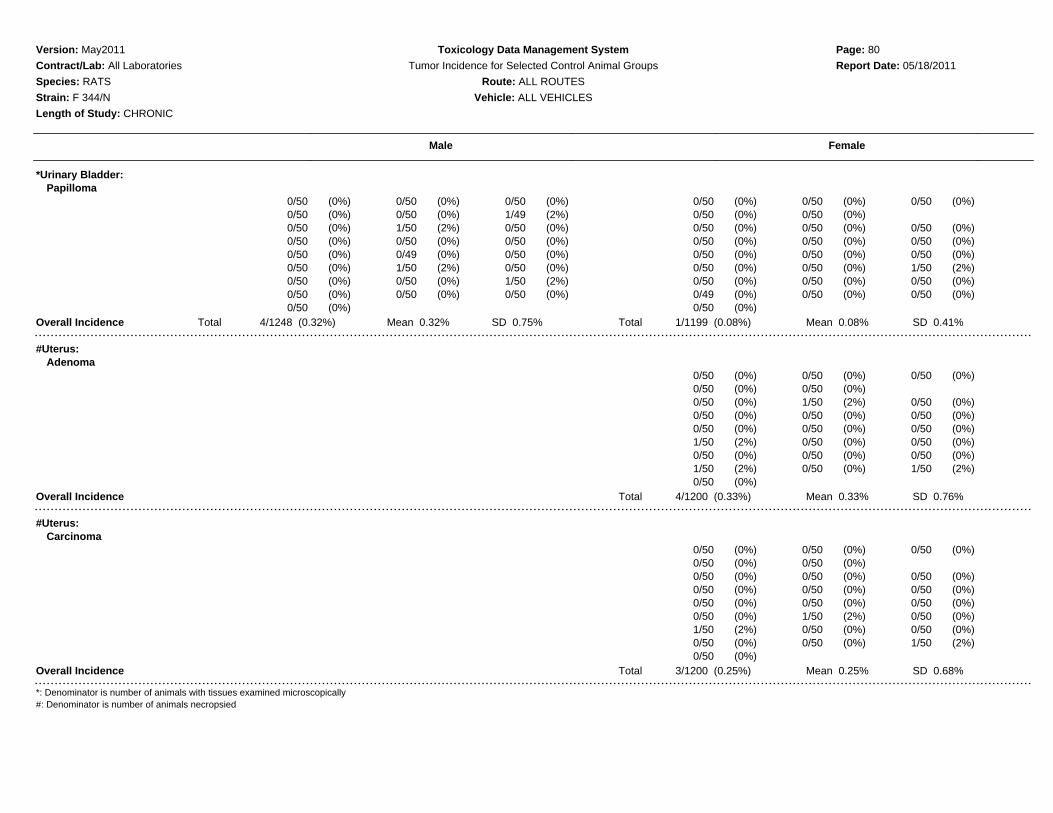
Version: May2011 Toxicology Data Management System Page: 80
Contract/Lab: All Laboratories Tumor Incidence for Selected Control Animal Groups Report Date: 05/18/2011
Species: RATS Route: ALL ROUTES
Strain: F 344/N Vehicle: ALL VEHICLES
Length of Study: CHRONIC
Male Female
*Urinary Bladder:Papilloma
0/50 (0%) 0/50 (0%) 0/50 (0%) 0/50 (0%) 0/50 (0%) 0/50 (0%)0/50 (0%) 0/50 (0%) 1/49 (2%) 0/50 (0%) 0/50 (0%)0/50 (0%) 1/50 (2%) 0/50 (0%) 0/50 (0%) 0/50 (0%) 0/50 (0%)0/50 (0%) 0/50 (0%) 0/50 (0%) 0/50 (0%) 0/50 (0%) 0/50 (0%)0/50 (0%) 0/49 (0%) 0/50 (0%) 0/50 (0%) 0/50 (0%) 0/50 (0%)0/50 (0%) 1/50 (2%) 0/50 (0%) 0/50 (0%) 0/50 (0%) 1/50 (2%)0/50 (0%) 0/50 (0%) 1/50 (2%) 0/50 (0%) 0/50 (0%) 0/50 (0%)0/50 (0%) 0/50 (0%) 0/50 (0%) 0/49 (0%) 0/50 (0%) 0/50 (0%)0/50 (0%) 0/50 (0%)
Overall Incidence Total 4/1248 (0.32%) Mean 0.32% SD 0.75% Total 1/1199 (0.08%) Mean 0.08% SD 0.41%
#Uterus:Adenoma
0/50 (0%) 0/50 (0%) 0/50 (0%)0/50 (0%) 0/50 (0%)0/50 (0%) 1/50 (2%) 0/50 (0%)0/50 (0%) 0/50 (0%) 0/50 (0%)0/50 (0%) 0/50 (0%) 0/50 (0%)1/50 (2%) 0/50 (0%) 0/50 (0%)0/50 (0%) 0/50 (0%) 0/50 (0%)1/50 (2%) 0/50 (0%) 1/50 (2%)0/50 (0%)
Overall Incidence Total 4/1200 (0.33%) Mean 0.33% SD 0.76%
#Uterus:Carcinoma
0/50 (0%) 0/50 (0%) 0/50 (0%)0/50 (0%) 0/50 (0%)0/50 (0%) 0/50 (0%) 0/50 (0%)0/50 (0%) 0/50 (0%) 0/50 (0%)0/50 (0%) 0/50 (0%) 0/50 (0%)0/50 (0%) 1/50 (2%) 0/50 (0%)1/50 (2%) 0/50 (0%) 0/50 (0%)0/50 (0%) 0/50 (0%) 1/50 (2%)0/50 (0%)
Overall Incidence Total 3/1200 (0.25%) Mean 0.25% SD 0.68%
*: Denominator is number of animals with tissues examined microscopically#: Denominator is number of animals necropsied
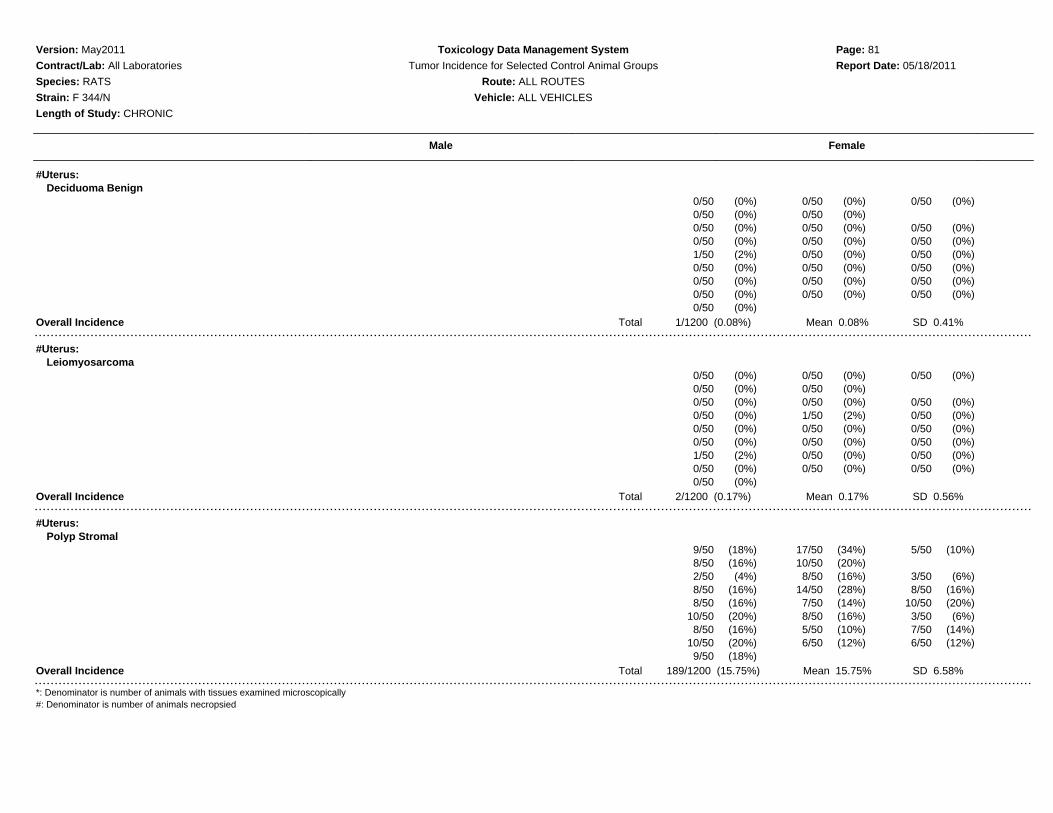
Version: May2011 Toxicology Data Management System Page: 81
Contract/Lab: All Laboratories Tumor Incidence for Selected Control Animal Groups Report Date: 05/18/2011
Species: RATS Route: ALL ROUTES
Strain: F 344/N Vehicle: ALL VEHICLES
Length of Study: CHRONIC
Male Female
#Uterus:Deciduoma Benign
0/50 (0%) 0/50 (0%) 0/50 (0%)0/50 (0%) 0/50 (0%)0/50 (0%) 0/50 (0%) 0/50 (0%)0/50 (0%) 0/50 (0%) 0/50 (0%)1/50 (2%) 0/50 (0%) 0/50 (0%)0/50 (0%) 0/50 (0%) 0/50 (0%)0/50 (0%) 0/50 (0%) 0/50 (0%)0/50 (0%) 0/50 (0%) 0/50 (0%)0/50 (0%)
Overall Incidence Total 1/1200 (0.08%) Mean 0.08% SD 0.41%
#Uterus:Leiomyosarcoma
0/50 (0%) 0/50 (0%) 0/50 (0%)0/50 (0%) 0/50 (0%)0/50 (0%) 0/50 (0%) 0/50 (0%)0/50 (0%) 1/50 (2%) 0/50 (0%)0/50 (0%) 0/50 (0%) 0/50 (0%)0/50 (0%) 0/50 (0%) 0/50 (0%)1/50 (2%) 0/50 (0%) 0/50 (0%)0/50 (0%) 0/50 (0%) 0/50 (0%)0/50 (0%)
Overall Incidence Total 2/1200 (0.17%) Mean 0.17% SD 0.56%
#Uterus:Polyp Stromal
9/50 (18%) 17/50 (34%) 5/50 (10%)8/50 (16%) 10/50 (20%)2/50 (4%) 8/50 (16%) 3/50 (6%)8/50 (16%) 14/50 (28%) 8/50 (16%)8/50 (16%) 7/50 (14%) 10/50 (20%)
10/50 (20%) 8/50 (16%) 3/50 (6%)8/50 (16%) 5/50 (10%) 7/50 (14%)
10/50 (20%) 6/50 (12%) 6/50 (12%)9/50 (18%)
Overall Incidence Total 189/1200 (15.75%) Mean 15.75% SD 6.58%
*: Denominator is number of animals with tissues examined microscopically#: Denominator is number of animals necropsied
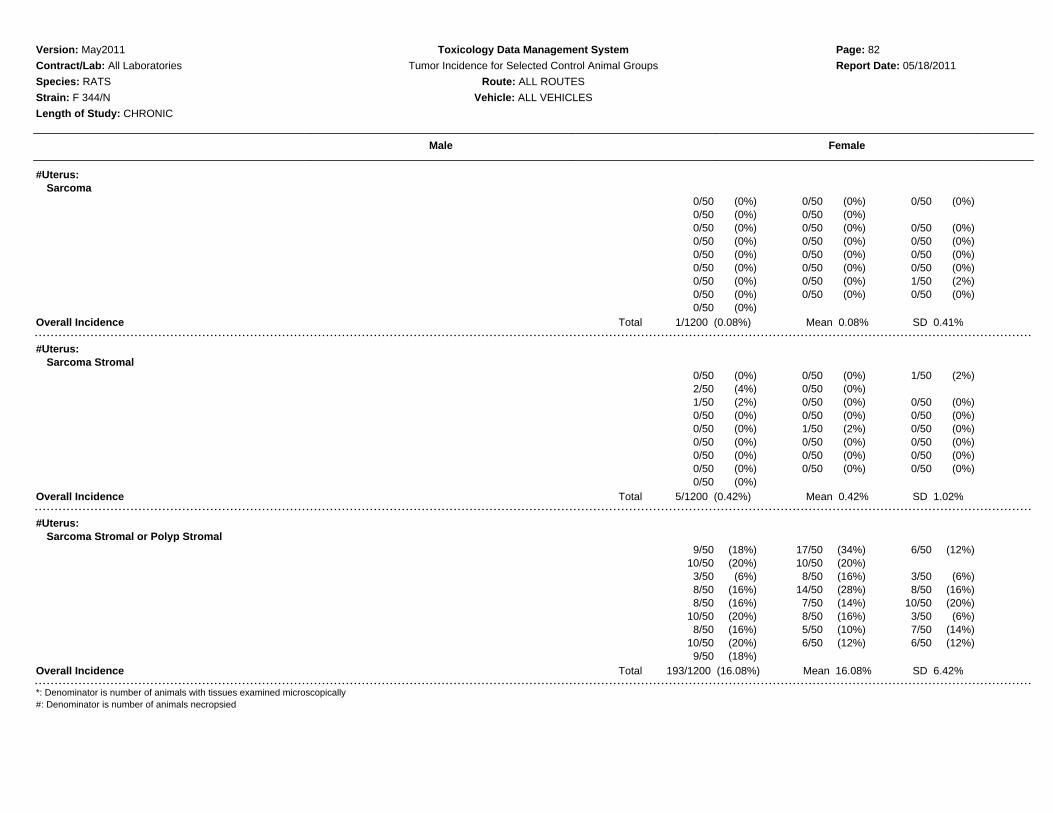
Version: May2011 Toxicology Data Management System Page: 82
Contract/Lab: All Laboratories Tumor Incidence for Selected Control Animal Groups Report Date: 05/18/2011
Species: RATS Route: ALL ROUTES
Strain: F 344/N Vehicle: ALL VEHICLES
Length of Study: CHRONIC
Male Female
#Uterus:Sarcoma
0/50 (0%) 0/50 (0%) 0/50 (0%)0/50 (0%) 0/50 (0%)0/50 (0%) 0/50 (0%) 0/50 (0%)0/50 (0%) 0/50 (0%) 0/50 (0%)0/50 (0%) 0/50 (0%) 0/50 (0%)0/50 (0%) 0/50 (0%) 0/50 (0%)0/50 (0%) 0/50 (0%) 1/50 (2%)0/50 (0%) 0/50 (0%) 0/50 (0%)0/50 (0%)
Overall Incidence Total 1/1200 (0.08%) Mean 0.08% SD 0.41%
#Uterus:Sarcoma Stromal
0/50 (0%) 0/50 (0%) 1/50 (2%)2/50 (4%) 0/50 (0%)1/50 (2%) 0/50 (0%) 0/50 (0%)0/50 (0%) 0/50 (0%) 0/50 (0%)0/50 (0%) 1/50 (2%) 0/50 (0%)0/50 (0%) 0/50 (0%) 0/50 (0%)0/50 (0%) 0/50 (0%) 0/50 (0%)0/50 (0%) 0/50 (0%) 0/50 (0%)0/50 (0%)
Overall Incidence Total 5/1200 (0.42%) Mean 0.42% SD 1.02%
#Uterus:Sarcoma Stromal or Polyp Stromal
9/50 (18%) 17/50 (34%) 6/50 (12%)10/50 (20%) 10/50 (20%)3/50 (6%) 8/50 (16%) 3/50 (6%)8/50 (16%) 14/50 (28%) 8/50 (16%)8/50 (16%) 7/50 (14%) 10/50 (20%)
10/50 (20%) 8/50 (16%) 3/50 (6%)8/50 (16%) 5/50 (10%) 7/50 (14%)
10/50 (20%) 6/50 (12%) 6/50 (12%)9/50 (18%)
Overall Incidence Total 193/1200 (16.08%) Mean 16.08% SD 6.42%
*: Denominator is number of animals with tissues examined microscopically#: Denominator is number of animals necropsied

Version: May2011 Toxicology Data Management System Page: 83
Contract/Lab: All Laboratories Tumor Incidence for Selected Control Animal Groups Report Date: 05/18/2011
Species: RATS Route: ALL ROUTES
Strain: F 344/N Vehicle: ALL VEHICLES
Length of Study: CHRONIC
Male Female
#Uterus:Schwannoma Malignant
0/50 (0%) 0/50 (0%) 0/50 (0%)0/50 (0%) 0/50 (0%)0/50 (0%) 0/50 (0%) 1/50 (2%)0/50 (0%) 0/50 (0%) 0/50 (0%)0/50 (0%) 0/50 (0%) 0/50 (0%)0/50 (0%) 0/50 (0%) 0/50 (0%)0/50 (0%) 0/50 (0%) 0/50 (0%)0/50 (0%) 1/50 (2%) 0/50 (0%)0/50 (0%)
Overall Incidence Total 2/1200 (0.17%) Mean 0.17% SD 0.56%
#Vagina:Polyp
0/50 (0%) 0/50 (0%) 0/50 (0%)0/50 (0%) 0/50 (0%)0/50 (0%) 0/50 (0%) 0/50 (0%)0/50 (0%) 0/50 (0%) 0/50 (0%)1/50 (2%) 0/50 (0%) 0/50 (0%)0/50 (0%) 0/50 (0%) 0/50 (0%)1/50 (2%) 0/50 (0%) 0/50 (0%)0/50 (0%) 0/50 (0%) 0/50 (0%)1/50 (2%)
Overall Incidence Total 3/1200 (0.25%) Mean 0.25% SD 0.68%
#Vagina:Sarcoma
0/50 (0%) 0/50 (0%) 0/50 (0%)1/50 (2%) 0/50 (0%)0/50 (0%) 0/50 (0%) 0/50 (0%)0/50 (0%) 0/50 (0%) 0/50 (0%)0/50 (0%) 0/50 (0%) 0/50 (0%)0/50 (0%) 0/50 (0%) 0/50 (0%)0/50 (0%) 0/50 (0%) 0/50 (0%)0/50 (0%) 0/50 (0%) 0/50 (0%)0/50 (0%)
Overall Incidence Total 1/1200 (0.08%) Mean 0.08% SD 0.41%
*: Denominator is number of animals with tissues examined microscopically#: Denominator is number of animals necropsied

Version: May2011 Toxicology Data Management System Page: 84
Contract/Lab: All Laboratories Tumor Incidence for Selected Control Animal Groups Report Date: 05/18/2011
Species: RATS Route: ALL ROUTES
Strain: F 344/N Vehicle: ALL VEHICLES
Length of Study: CHRONIC
Male Female
#Vagina:Schwannoma Malignant
0/50 (0%) 0/50 (0%) 0/50 (0%)0/50 (0%) 0/50 (0%)0/50 (0%) 0/50 (0%) 0/50 (0%)0/50 (0%) 0/50 (0%) 0/50 (0%)0/50 (0%) 0/50 (0%) 0/50 (0%)0/50 (0%) 0/50 (0%) 1/50 (2%)0/50 (0%) 0/50 (0%) 0/50 (0%)0/50 (0%) 0/50 (0%) 0/50 (0%)0/50 (0%)
Overall Incidence Total 1/1200 (0.08%) Mean 0.08% SD 0.41%
#Zymbal's Gland:Adenoma
0/50 (0%) 0/50 (0%) 1/50 (2%) 0/50 (0%) 0/50 (0%) 0/50 (0%)0/50 (0%) 0/50 (0%) 0/50 (0%) 0/50 (0%) 0/50 (0%)0/50 (0%) 2/50 (4%) 0/50 (0%) 0/50 (0%) 0/50 (0%) 0/50 (0%)0/50 (0%) 0/50 (0%) 0/50 (0%) 0/50 (0%) 0/50 (0%) 0/50 (0%)0/50 (0%) 0/49 (0%) 0/50 (0%) 0/50 (0%) 0/50 (0%) 0/50 (0%)0/50 (0%) 0/50 (0%) 0/50 (0%) 0/50 (0%) 0/50 (0%) 0/50 (0%)0/50 (0%) 0/50 (0%) 0/50 (0%) 0/50 (0%) 0/50 (0%) 0/50 (0%)0/50 (0%) 0/50 (0%) 0/50 (0%) 0/50 (0%) 0/50 (0%) 0/50 (0%)1/50 (2%) 0/50 (0%)
Overall Incidence Total 4/1249 (0.32%) Mean 0.32% SD 0.95% Total 0/1200 (0%) Mean 0% SD 0%
#Zymbal's Gland:Carcinoma
0/50 (0%) 0/50 (0%) 0/50 (0%) 0/50 (0%) 0/50 (0%) 0/50 (0%)0/50 (0%) 0/50 (0%) 1/50 (2%) 1/50 (2%) 1/50 (2%)0/50 (0%) 0/50 (0%) 1/50 (2%) 0/50 (0%) 0/50 (0%) 0/50 (0%)0/50 (0%) 0/50 (0%) 0/50 (0%) 0/50 (0%) 0/50 (0%) 0/50 (0%)2/50 (4%) 0/49 (0%) 1/50 (2%) 0/50 (0%) 0/50 (0%) 0/50 (0%)0/50 (0%) 0/50 (0%) 0/50 (0%) 0/50 (0%) 0/50 (0%) 0/50 (0%)1/50 (2%) 0/50 (0%) 1/50 (2%) 0/50 (0%) 1/50 (2%) 0/50 (0%)0/50 (0%) 1/50 (2%) 0/50 (0%) 1/50 (2%) 0/50 (0%) 1/50 (2%)0/50 (0%) 0/50 (0%)
Overall Incidence Total 8/1249 (0.64%) Mean 0.64% SD 1.11% Total 5/1200 (0.42%) Mean 0.42% SD 0.83%
*: Denominator is number of animals with tissues examined microscopically#: Denominator is number of animals necropsied
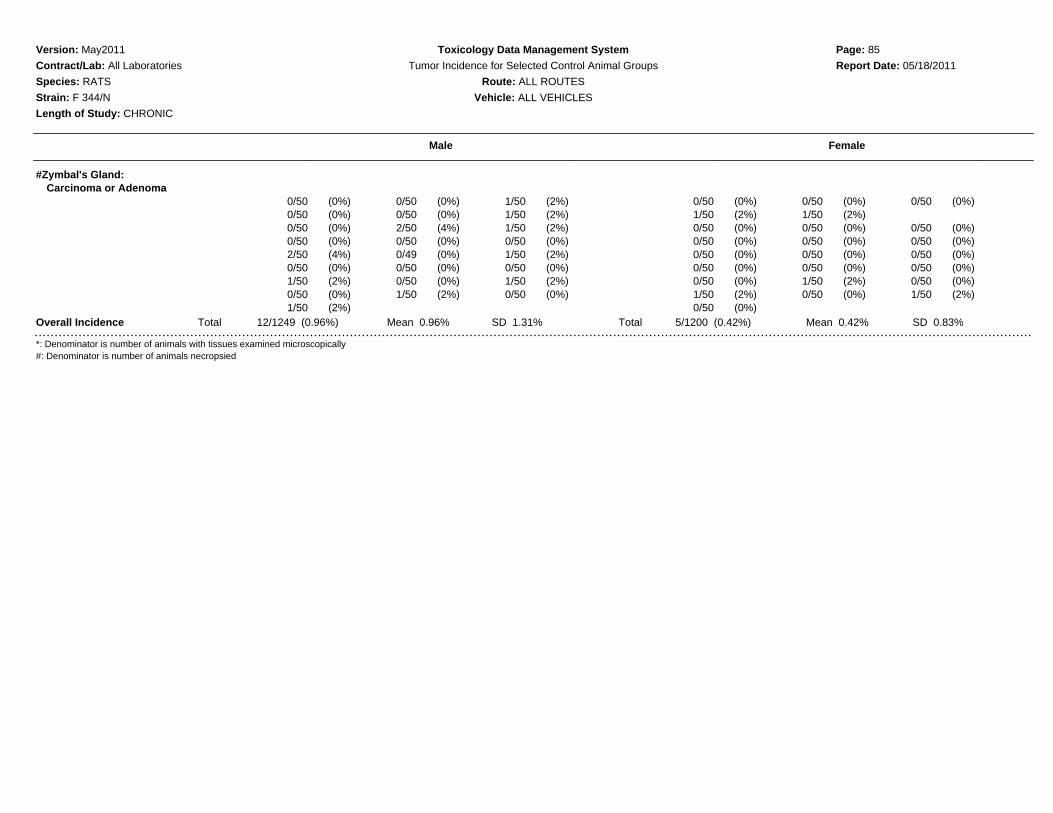
Version: May2011 Toxicology Data Management System Page: 85
Contract/Lab: All Laboratories Tumor Incidence for Selected Control Animal Groups Report Date: 05/18/2011
Species: RATS Route: ALL ROUTES
Strain: F 344/N Vehicle: ALL VEHICLES
Length of Study: CHRONIC
Male Female
#Zymbal's Gland:Carcinoma or Adenoma
0/50 (0%) 0/50 (0%) 1/50 (2%) 0/50 (0%) 0/50 (0%) 0/50 (0%)0/50 (0%) 0/50 (0%) 1/50 (2%) 1/50 (2%) 1/50 (2%)0/50 (0%) 2/50 (4%) 1/50 (2%) 0/50 (0%) 0/50 (0%) 0/50 (0%)0/50 (0%) 0/50 (0%) 0/50 (0%) 0/50 (0%) 0/50 (0%) 0/50 (0%)2/50 (4%) 0/49 (0%) 1/50 (2%) 0/50 (0%) 0/50 (0%) 0/50 (0%)0/50 (0%) 0/50 (0%) 0/50 (0%) 0/50 (0%) 0/50 (0%) 0/50 (0%)1/50 (2%) 0/50 (0%) 1/50 (2%) 0/50 (0%) 1/50 (2%) 0/50 (0%)0/50 (0%) 1/50 (2%) 0/50 (0%) 1/50 (2%) 0/50 (0%) 1/50 (2%)1/50 (2%) 0/50 (0%)
Overall Incidence Total 12/1249 (0.96%) Mean 0.96% SD 1.31% Total 5/1200 (0.42%) Mean 0.42% SD 0.83%
*: Denominator is number of animals with tissues examined microscopically#: Denominator is number of animals necropsied