nsiad-91-190 management practices: u.s. companies improve ... · the malcolm baldrige national...
TRANSCRIPT

lJrli~t4 Sf.at.w Gtbnthral .““_..” ..-. ..II .- Acw)urlt,itrg Office ..----. . . . -_. -_------.- --- -----..-- ---. ---- ---.- ----- _._.I__--_
GAO Report, to the E-Ionoral~le Ihnald Iiit;t,er, Howe of’ IiepYvtsent,atives
Ma v 1 !I!) I MANAGEMENT PRACTICES
U.S. Companies Improve Performance Through Quality Efforts

National Security and International Affairs Division
B-243493
May 2,199l
The Honorable Donald Ritter House of Representatives
Dear Mr. Ritter:
As you requested, we have examined the impact of formal total quality management practices on the performance of selected U.S. companies. Specifically, our report discusses the results of our analysis of several key indicators that companies use to measure their performance. We also identified several common features of companies’ total quality management systems that were shared by the companies and that contributed to improved performance.
Unless you publicly announce its contents earlier, we plan no further distribution of this report until 30 days from the date of this letter. At that time, we will send copies to the 29 members of Congress endorsing your request as well as to the Secretary of Commerce. Copies will also be made available to others on request.
Please contact me on (202) 276-4812 if you or your staff have any questions concerning this report. The major contributors to this report are listed in appendix II.
Sincerely yours,
Allan I. Mendelowitz, Director International Trade, Energy,
and Finance Issues

Executive Summary
Purpose Achieving high levels of quality has become an increasingly important element in competitive success. In recent years a number of U.S. compa- nies have found that they could not accomplish world-class quality by using traditional approaches to managing product and service quality. To enhance their competitive position, some American companies have reappraised their traditional view of quality and have adopted what is known as the “total quality management” model in running their businesses.
Congressman Donald Ritter, with the endorsement of 29 other members of Congress, asked GAO to determine the impact of formal total quality management practices on the performance of selected U.S. companies. This report discusses (1) what was achieved by adopting these prac- tices, (2) how improved quality was achieved, and (3) what lessons may be applicable to U.S. companies in general.
Background For many years the traditional way to achieve quality was through sys- tematic final inspection. This approach is referred to as “inspecting in quality.” Intense foreign competition in general, and Japanese competi- tion in particular, has led some U.S. companies to adopt total quality management practices that are prevention based. This approach is often referred to as “building in quality.”
The most widely accepted formal definition of what constitutes a total quality management company exists in the criteria for the Malcolm Bal- drige National Quality Award. This annual award, given by the US. Commerce Department since 1988, recognizes U.S. companies that excel in quality achievement and quality management.
Results in Brief GAO'S review of 20 companies that were among the highest-scoring appli- cants in 1988 and 1989 for the Malcolm Baldrige National Quality Award indicated the following:
l Companies that adopted quality management practices experienced an overall improvement in corporate performance. In nearly all cases, com- panies that used total quality management practices achieved better employee relations, higher productivity, greater customer satisfaction, increased market share, and improved profitability.
. Each of the companies studied developed its practices in a unique envi- ronment with its own opportunities and problems. However, there were
Page 2 GAO/NSIADQl-10 Management Practices

common features in their quality management systems that were major contributing factors to improved performance.
. Many different kinds of companies benefited from putting specific total quality management practices in place. However, none of these compa- nies reaped those benefits immediately. Allowing sufficient time for results to be achieved was as important as initiating a quality manage- ment program.
GAO's Analysis Performance indicators in each area GAO studied showed an overall average annual improvement from the time companies adopted total quality management to the publication of the latest available data.
Companies provided data in varying degrees based on their availability and company policy concerning the release of proprietary data. While these data were sufficient to evaluate performance trends, they were not sufficient to conduct a statistically rigorous analysis of the compa- nies’ performance under total quality management. Therefore, GAO'S conclusions are based on a combination of an evaluation of performance trends of the available data and the information derived from on-site visits.
What Was Achieved? GAO analyzed data in four key areas of corporate operations and found the following:
l Somewhat better employee relations were realized. Employees in the companies GAO reviewed experienced increased job satisfaction and improved attendance; employee turnover also decreased. Eighteen com- panies reported a total of 62 observations (performance measures) in this area. Thirty-nine out of the 62 improved, 9 declined, and 4 were unchanged.
. Improved quality and lower cost were attained. Companies increased the reliability and on-time delivery of their product or service and reduced errors, product lead time, and their cost of quality. Twenty companies reported a total of 66 observations. Fifty-nine out of the 66 improved, 2 became worse, and 4 were unchanged.
. Greater customer satisfaction was accomplished. Seventeen of the 20 companies provided data on customer satisfaction based on the com- panies’ survey results of their consumers’ overall perceptions about a product or service, the number of complaints received, and customer retention rates, Twenty-one out of the 30 reported observations improved, 3 became worse, and 6 were unchanged.
Page 3 GAO/NSIADQl-1QQ Management Practices

Executive thmnuuy
l Improved market share and profitability were attained. As measured by several ratios widely used in financial analysis, the impact of an organi- zation’s quality management practices was improved profitability. Fif- teen companies reported a total of 40 observations in this area. Thirty- four of the 40 increased and 6 declined.
How Was Quality Achieved?
Companies used no “cookbook’ approach in implementing a successful total quality management system, but GAO identified some common fea- tures that contributed to the companies’ improved performance. For example, corporate attention was focused on meeting customer require- ments; senior management led the way in building quality values into company operations; all employees were suitably trained, empowered, and involved in efforts to continuously improve quality and reduce costs; and systematic processes were integrated throughout the organi- zation to foster continuous improvement.
Quality Management Practices Are Widely Applicable .
Some lessons learned from GAO'S study are applicable to a wide variety of organizations.
The diversity of companies studied showed that quality management is useful for small companies (600 or fewer employees) as well as large and for service companies as well as manufacturers. The companies GAO reviewed began to focus on quality in the mid-1980s; their quality efforts are still evolving. Nevertheless, these companies improved their performance on average in about 2 l/2 years. Management allowed enough time for results to be achieved rather than emphasizing short- term gains.
Recommendations This report contains no recommendations.
Agency Comments therefore, GAO did not request formal comments from any federal agency. As requested, GAO did not discuss the results in this report with officials of the companies studied.
Page 4 GAO/NSIAD-91-190 Management Practices

Page 5 GAO/NSIAD-91-190 Management Practkea

Contents
m
Executive Summary 2
Chapter 1 Introduction What Is Total Quality Management?
Brief History of Total Quality Management Objectives, Scope, and Methodology
8 8
10 13
Chapter 2 Companies Improved Better Employee Relations
Operating Results Improved Operating Procedures Greater Customer Satisfaction
18 18 20 23
Chapter 3
Increased Financial Performance 26
29 Co&on Features Contributing to
Customer Focus Management Leadership Employee Involvement
lmwoved Pelformance
Open Corporate Culture Fact-Based Decision-Making Partnership With Suppliers
29 31 31 32 34 36
Chapter 4 36 Widespread Applicability of Total Quality Management
Appendixes Appendix I: Participants in GAO’s Review 38 Appendix II: Major Contributors to This Report 42
Tables Table 2.1: Employee-Related Indicators 18 Table 2.2: Operating Indicators 21 Table 2.3: Customer Satisfaction Indicators 24 Table 2.4: Financial Performance Indicators 26
Figures Figure 1.1: Total Quality Management Model Figure 2.1: Average Annual Percentage Improvement in
Employee-Related Indicators
Page 6 GAO/NSIAD-91-190 Management Practices

Chntentu
Figure 2.2: Average Annual Percentage Improvement in Operating Indicators
22
Figure 2.3: Average Annual Percentage Improvement in Customer Satisfaction Indicators
Figure 2.4: Average Annual Percentage Improvement in Financial Performance Indicators
25
27
Abbreviations
GAO General Accounting Office Total Quality Management
Page 7 GAO/NSIAD91-190 Manfagement Practice6

Chapter 1
Introduction
Providing excellent product and service quality has become a key to suc- cess in competitive international markets. The level of quality expected by many consumers continues to increase as leading competitors raise their standards of quality. In response to the demand for higher quality products and services, a number of U.S. firms are adopting new manage- ment practices. The term “total quality management” is often used to describe these practices.
What Is Total Management?
Quality Total quality management (TQM) is a relatively new approach to the art of management. It seeks to improve product quality and increase cus- tomer satisfaction by restructuring traditional management practices. The application of TQM is unique to each organization that adopts such an approach. However, based on a review of current management litera- ture and on our observation of the practices of a number of US, compa- nies that have adopted TQM, it appears that a consensus has formed around the attributes that are common to all TQM organizations. This consensus is also reflected in the criteria used in the Malcolm Baldrige National Quality Award.
The Malcolm Baldrige National Quality Award
On August 20, 1987, the President signed Public Law 100-107, the Mal- calm Baldrige National Quality Improvement Act. This law established the Malcolm Baldrige National Quality Award, named for a former Sec- retary of Commerce, the late Malcolm Baldrige. The award is designed to recognize companies that have successfully implemented total quality management systems.
The Baldrige Award is managed by the US. Department of Commerce’s National Institute of Standards and Technology and is administered by a consortium that includes the American Society for Quality Control and the American Productivity and Quality Center.
The award is presented annually to up to six companies (two each in three categories: manufacturing, service, and small business) that pass a rigorous examination process. Applicants are evaluated by teams com- prised of leading quality experts from companies, government, and academia. The exact criteria used to evaluate companies have been refined slightly each year, with the trend toward requiring more detailed information in fewer, but more important, areas.
Increasingly, companies view the criteria outlined in the Baldrige Award application as useful diagnostic tools for evaluating the effectiveness of
Page 9 GAO/NSIAD91-199 Management Pradices
” N

chapt43r 1 introduction
their management practices. One indicator of the interest in TQM prac- tices is that in 1990 over 180,000 applications were requested. Corpo- rate executives also see the process of applying for the award as a way of improving their corporate knowledge of quality management princi- ples and practices.
Features of Total Quality Companies participating in the Baldrige Award process submit applica-
Management tions for examination that document their total quality management systems. The application cites several features that are deemed essential to instituting successful TQM systems. A company must demonstrate the presence of each feature to score well in the examination process. Each of these features is discussed below.
Customer-Driven Quality An essential attribute of TQM is the general understanding that the cus- tomer is the final arbiter of quality. TQM is based on the premise that quality is driven by and defined by the customer. Product and service attributes that create a perception of quality on the part of the customer will increase customer satisfaction and, ultimately, increase customer demand.
Strong Quality Leadership Strong quality leadership is a key attribute of TQM. Many of the manage- ment practices and principles that are required in a TQM environment may be contrary to long-standing practice. Only a strong leadership team focused on quality improvement can overcome the inevitable inertia and resistance to change by creating clear quality goals and developing the systems and methods for achieving these goals.
Continuous Improvement Continuous improvement, a fundamental attribute of TQM, arises from a philosophy that all business operations and work activities can be done more efficiently. It requires the development of a management approach that encourages identifying and seizing on-going opportunities to improve.
Action Based on Facts, Data, and Analysis
Another important attribute is a willingness to measure quality con- stantly and to identify and correct conditions causing poor quality. T&M is predicated on decision-making that uses reliable information and anal- ysis. A number of statistical techniques have been adopted to support this process.
Page 9 GAO/NSIAD-91-199 Management Practices

chapter 1 lntroductton
Employee Participation TQM environments allow all employees to participate in helping achieve organizational quality goals. All employees are held accountable for quality and are given tools and training to fulfill this responsibility. TQM is based on the assumption that the employees closest to a particular organization’s daily operating procedures are in the best position to understand and improve the quality of those procedures.
Brief History of Total Quality has always been an important element of competitive success.
Quality Management U.S. companies have traditionally used a combination of final inspec- tions and post-production adjustments to ensure quality. Quality was generally not viewed as the responsibility of all employees, however. Specialization within US. companies separated the quality function from such areas as planning, design, production, and distribution.
Quality Management in Post-War Japan
In contrast to the specialized approach traditionally used in the United States, a number of Japanese companies, rebuilding from post-war dev- astation, adopted an innovative, integrated approach to achieving quality. Several leading applied statisticians and quality experts-most notably Drs. W. Edwards Deming and Joseph M. Juran-introduced quality management principles to Japanese industry. The Union of Jap- anese Scientists and Engineers, a private organization formed by engi- neers and scholars, provided a forum for the widespread dissemination of statistical quality control techniques. In 1951 the group established the Deming Prize, with the intention of raising the quality levels of Jap- anese industry. Many of the management techniques developed since then form the foundation of the TQM principles that are gaining popu- larity in the United States today.
Total Quality in the United
Management Using an integrated approach to quality, a number of Japanese firms States sharply improved their quality levels and began to penetrate U.S. mar-
kets. In the late 1970s and early 198Os, this enhanced competition stim- ulated attention in the United States to the role of TQM systems in activating quality improvement. US. companies began to seek out quality management experts to try to understand what was happening and to fashion an appropriate response. Many U.S. experts contributed to the understanding of quality management. Among these experts were Deming, Juran, Armand V. Feigenbaum, and Philip B. Crosby. We noted the increasing interest in TQM in our March 1988 analysis of the growing
Page 10 GAO/NSIAD-91490 Management Practicee

chapter 1 Introduction
Japanese presence in the U.S. auto industry.’ In that report we noted that US. auto manufacturers, “reacting to competitive pressures . . . began to change the way they were doing business . . . . Many of the features which made the Japanese model a success are now being tried and implemented by U.S. automakers.”
The increased interest in Japanese management methods was also accompanied by research in the United States that documented that firms can reduce their costs by improving quality. Quality management practitioners began citing the large, hidden costs that companies were incurring due to producing substandard products and services. These costs, known as the “cost of nonconformance,” included appraisal, inspection, rework, and warranty fees as well as the cost of replacing customers driven away by poor quality. Some experts estimated that manufacturing costs could be reduced by over 30 percent simply by eliminating scrap and rework that occurs from correcting defects in the manufacturing process.
Other Studies of TQM’s Impact on Corporate Performance
During the 1980s the increasing importance of quality has been high- lighted in some studies of total quality management efforts. Examples of these studies include the following:
l The Conference Board, Inc., New York, a business research group, sur- veyed senior executives at 800 large US. corporations about their quality management practices2 Of 149 firms that responded, 111 reported that they had a quality management program in place. Thirteen of the remaining 38 said they were planning to institute TQM.
Sixty-two respondents reported that they measured the impact of quality on profitability. Of these, 47 reported “noticeably increased” profits due to quality management, while only 1 firm reported decreased profits due to “the increased costs of providing higher quality products and services.”
The Conference Board also interviewed senior quality executives at 12 U.S. companies recognized for the excellence of their products and servicesand found a consensus on the following points:
‘Foreign Investment: Growing Japanese Presence in the U.S. Auto Industry (GAO/NSIAD-88-l 11, Par. 7,198S).
2Cument Practices in Measuring Quality, The Conference Board, Inc., Research Bulletin No. 234 (New York:
Page 11 GAO/NSIAJ&91-199 Management Pra&kes

Chapter 1 Intavduction
1, Total quality is the “strategy of choice” for assuring the economic position of U.S. firms in the global marketplace.
2. Quality improvement is a long-term process.
3. At many companies, concerns remain over the lack of top-level involvement in quality programs.3
. PIMS Associates, Inc., a subsidiary of the Strategic Planning Institute, Cambridge, Mass., maintains a proprietary data base of 1,200 companies and studies the impact of product quality on corporate performance.4 To date, PIMS researchers have found the following:
1. Product quality is an important determinant of business profitability.
2. Businesses offering premium quality products and services usually have large market shares and were early entrants into their markets.
3. Quality is positively and significantly related to a higher return on investment for almost all kinds of products and market situations.
4. A strategy of quality improvement usually leads to increased market share, but at a cost in terms of reduced short-run profitability.
6. High quality producers can usually charge premium prices.
l General Systems Company, Inc., Pittsfield, Mass., a prominent quality management consulting firm, maintains a proprietary data base for its clients that documents that firms with total quality management sys- tems in place consistently exceed industry norms for return on invest- ment. This higher return on investment was attributed to three factors.
1. TQM, by improving the quality of products and services, reduces the direct costs associated with poor quality: inspection, rework, warranties, etc.
2. Improvements in quality tend to lead to increases in productivity.
3The Road ~AJ Total Quality, The Conference Board, Inc., Research Bulletin No. 239 (New York: 1990).
4The PIMS Letter on Business Strategy, The Strategic Planning Institute, Number 4 (Cambridge, Mass.: 1986).
Page 12 GAO/NSIAD-91-190 Management Practices

chapter 1 Introduction
3. The combination of improved quality and increased productivity leads to increases in market share.
9 The American Society for Quality Control, Milwaukee, Wis., commis- sioned the Gallup Organization in 1989 to survey 601 senior corporate quality executives concerning their perceptions of quality.6 Among the respondents, 64 percent said they were pleased with the results of their quality improvement efforts, with half of these reporting “significant results, including increased profitability and/or increased market share.” Many of the remaining respondents either “weren’t aware of” or had not implemented quality improvement programs. Of all respon- dents, 61 percent believed that “the United States is gaining on foreign competition in terms of quality.”
l The Union of Japanese Scientists and Engineers published a study by Dr. Noriaki Kano and others on the Japanese companies that won the Deming Prize between 1961 and 1980.6 The study considered the earn- ings rate, productivity, growth rate, liquidity, and safety of the compa- nies and concluded that most companies had an upward trend in or maintained a favorable level of business performance. A few companies showed a temporary upturn in performance, then maintained a perform- ance level above the industry average.
l Ernst & Young, Cleveland, Ohio, an international accounting and con- sulting firm, is conducting a cross-cultural study of quality management practices in the United States, Japan, and Germany. In each country it will study four industries: computers and telecommunications equip- ment, automobiles, banking, and health care. The objective of this study is to “establish a new, multidimensional, integrated body of knowledge” regarding quality management.
Objectives, Scope, and Congressman Donald Ritter, with the endorsement of 29 colleagues,
Methodology requested that we determine the impact of total quality management practices on the performance of U.S. companies. Our report discusses (1) what was achieved by adopting these practices, (2) how improved quality was achieved, and (3) what lessons may be applicable to U.S. companies in general.
“Quality: Executive Priority or Afterthought? American Society for Quality Control (Milwaukee, Wis.: 1989).
sNoriaki Kano et al., Quality, Union of Japanese Scientists and Engineers (Tokyo: Apr. 1,1983).
Page 13 GAO/NSIADsl-190 Management Practices

Chapter 1 Jntmduction
To develop our methodology, we interviewed experts from industry, professional and trade associations, universities, and government agen- cies. We also conducted a comprehensive review of quality management literature and reviewed prior GAO work that addressed TQM issues.
As a result of this effort, we decided to rely on criteria from the Malcolm Baldrige Award in our study. We also decided to use as our sample those companies that received the highest score on the written portion of the Baldrige examination (and as a result qualified for Baldrige site exami- nations, the final process prior to winning the award). The specific com- panies (see app. I) were identified through contacts in private industry. The advantage of this approach was that the criteria were developed through the consensus of experts, and our sample companies were rec- ognized by industry experts as demonstrating superior TQM practices.
Nonetheless, other more comprehensive methodologies were considered, For example, a more rigorous statistical based methodology would incor- porate an evaluation of a variety of TQM companies, whether or not they were Baldrige applicants, as well as comparable companies that did not pursue T&M. In addition, it would consider general economic conditions as well as economic conditions within each particular industry. We did not pursue such alternative methodologies because they would necessi- tate collecting extensive proprietary data at the company or subsidiary level that is generally not publicly available.
To provide a general framework for examining the impact of total quality management practices in diverse organizations, we developed a model based on our understanding of the principles of total quality man- agement as well as our discussions with recognized experts (see fig. 1.1). With the model in mind, we based our conclusions on analysis of the data we collected as well as on our personal observations of company operations.
Page 14 GAO/NSIAD91-199 Management Practices
chapter 1 Intraduction
Plgure 1.1: Total Quality Management Model
Product and
SeNlCe Ouallty t
Leadership for
Continuous improvement
Errors or Defects &I
I I I L--- --s-m---
+
Index of Overall
+ Customer Customer ’ Satlsfactlon t Retention - t
Complalnts 1
Organization Senefim t
Market Share t
Competltlveness ,
t Profit5
t \~
4
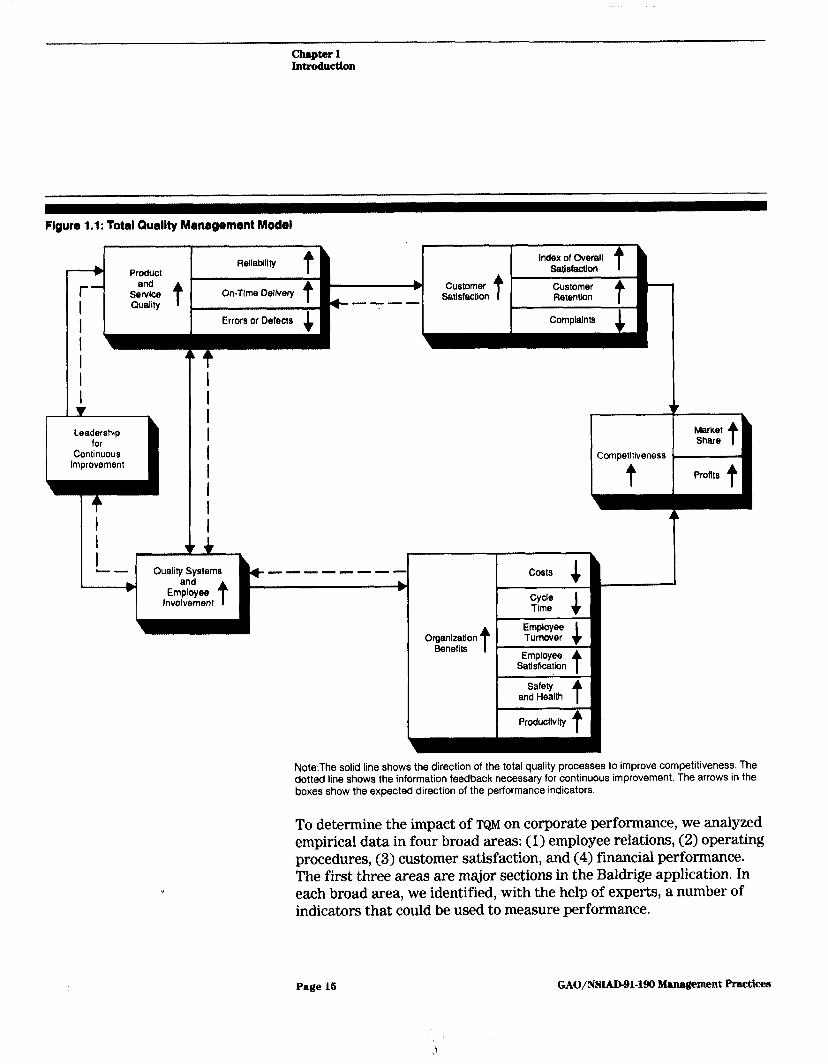
Note:The solid line shows the direction of the total quality processes to improve competitiveness. The dotted line shows the information feedback necessary for continuous improvement. The arrows in the boxes show the expected direction of the performance indicators.
To determine the impact of TQM on corporate performance, we analyzed empirical data in four broad areas: (1) employee relations, (2) operating procedures, (3) customer satisfaction, and (4) financial performance. The first three areas are major sections in the Baldrige application. In each broad area, we identified, with the help of experts, a number of indicators that could be used to measure performance.
Page 16 GAO/NSIAD91-190 Management Pmcticea

chapter 1 IntroductJon
Twenty-three individual companies, or divisions of companies, received Baldrige site examinations during 1988 and 1989. The possible sample size was 22 since 1 company received a site visit in both years. We con- tacted each company and requested its participation in our study. To alleviate concerns the companies may have had about releasing proprie- tary business information, we obtained a written statement of confiden- tiality from the requester. We agreed that all data would be treated confidentially within GAO and would not be published separately or otherwise disclosed outside GAO. We shared this confidentiality agree- ment with the companies.
Twenty of the 22 companies participated in our study to varying degrees, with some providing extensive, detailed operating information and others providing data in summary form. Several companies let us review information contained in their Baldrige Award application. We also evaluated the companies’ financial data when available. However, we were unable to obtain sufficient data to conduct a statistically rig- orous analysis of the companies’ performance under T&M. Not all compa- nies provided complete data, and the data were not available from other sources for all years since the companies had implemented their TQM systems. Several companies, both those privately owned and others, would not release certain proprietary information. Because of these data gaps we do not have a complete statistical picture for every indicator in every company. Therefore, our conclusions are based on a combination of an evaluation of performance trends of the available data and the information derived from on-site visits.
Nevertheless, for each participating company, we did collect a signifi- cant amount of available data in each of the four performance areas identified earlier. In judging whether these performance measures were favorable or unfavorable, we considered the direction of the trend over tune and its relationship, where available, to some predetermined stan- dard or industry average. For a variety of reasons, companies tended to measure their performance by changes in indicators from their com- pany’s past performance rather than by industry averages.
To compensate for the fact that the companies began applying TQM at different times, we calculated an annual average percent change (increase or decrease) for each company for each performance indicator. To do this we used data from the time a company reported the initiation of TQM to when the most recent data became available. We then calcu- lated for each indicator a single average based on the individual com- pany data. We reviewed available company documents, studies, and
Page 16 GAO/NSIAD-91-199 Management Practices

chapter 1 Introdnedon
records that supported the data, such as the results of employee and customer surveys and the companies’ Baldrige application. The com- pany data were provided voluntarily by the companies; we did not have unlimited access to all supporting documentation.
In addition to examining individual data elements to determine the impact of TQM on corporate performance, we also generalized the exper- iences of all the companies to determine common features of effective TQM efforts.
We conducted our work between June 1990 and February 1991 in accor- dance with generally accepted government auditing standards.
We did not request formal comments from any federal agency, since all data in our report were provided by the private sector. As requested, we did not discuss the results in our report with officials of the companies studied.
Page 17 GAO/NSIAD-91-199 Management Practices

Chapter 2
Companies Improved Operating Results
Quality experts we interviewed in private industry and in government felt that there were four key measurable areas of a company’s opera- tions that could demonstrate the impact of T&M practices on corporate performance. Those areas were (1) employee relations, (2) operating procedures, (3) customer satisfaction, and (4) financial performance. By analyzing data about these areas, we discerned that somewhat better employee relations were achieved; improved operating procedures were attained; greater customer satisfaction was accomplished; and increased market share and profitability were gained.
Better Employee Relations
One of the most important features in implementing a successful total quality management system was attaining a highly involved and moti- vated work force. Companies used several key indicators to measure the extent to which their focus on quality led to improvement in employee job satisfaction, attitudes, and behavior. Those areas included: (1) employee satisfaction, (2) attendance, (3) turnover, (4) safety and health, and (5) number of suggestions made to improve quality and/or lower costs.
Eighteen of the 20 participating companies provided data on at least 1 of the 5 employee-related indicators. For the 6 different indicators we obtained a total of 52 observations (i.e., measures of corporate perform- ance). Of these 62 observations, 39 increased (indicating an improve- ment), 9 declined, and 4 were unchanged. (See table 2.1.)
Table 2.1: Employee-Related Indicators
Performance indicator _ ._-._-.. __-.-- -- -. .- -- __I- imployee satisfaction
Attendance - . . ~-.-~-..--.--
Turnover
Safety/health
Sbggestions ie&ived __._ . --__--.-.__
_ __ ..- -. --..-~.-- ..-...--.-. Total
Number of Direction of indicator responding Positive companies (favorable)
Negative (unfavorable) No change
9 8 1 0 __- 11 8 0 3 11 7 3 1 -- 14 11 3 0 7 5 2 -- 0
180 39 9 4
Qtdicates the total number of companies providing data and not the total number of responses for all performance indicators. Source: GAO’s analysis of company provided data.
Page 18 GAO/NSIAD-91-190 Management Practices

chapter 2 C!ompanIea Improved Operating Reaulta
The specific results achieved by the companies for each indicator, expressed as an average annual rate of improvement, are illustrated in figure 2.1 and discussed below.
Figure 2.1: Average Annual Percentage Improvement in Employee-Related Indicator8
20 Avuaga l nml pmwntago improvomont
Indlcaton
8 Data from 9 companies b Data from 11 companies c Data from 11 companies d Data from 14 companies e Data from 7 companies
Source: GAO’s analysis of company provided data
We found the following:
. Employee satisfaction was measured by periodic company surveys of employee attitudes toward their work. Each company survey devised a satisfaction index. There was an increase in overall employee satisfac- tion in eight of nine companies providing data. One company had a decline (6 percent) in employee satisfaction due, according to company officials, to concern over merger activity in the industry. The average
Page 19 GAO/NSIAD-91499 Management Practices

chapter 2 Companies Improved OperaUng Besub
annual improvement was 1.4 percent for all companies after adopting TQM practices.
l Attendance was above industry averages in 9 of 11 reporting companies and increased further in 8 of the 11 companies by an average annual rate of 0.1 percent. Attendance was unchanged at three companies.
l Employee turnover, defined as voluntary separations as a percentage of total employment, was lower (better) than industry averages in 10 of 11 companies providing data. Turnover declined in 7 of the 11 compa- nies, increased slightly in 3 companies, and was unchanged in 1 com- pany. Employee turnover declined by an average annual rate of 6 percent. For a typical company in a given year, employee turnover declined from 10 percent to 9.4 percent.
l Safety and health rates, measured by lost work days due to occupational injury and illness per 100 full-time employees, were better than industry averages in 12 of 14 companies. Furthermore, it improved in 11 of the 14 companies but became worse in 3 companies. The average annual improvement was 1.8 percent.
. The total number of suggestions submitted to improve quality increased in five of seven reporting companies and declined in two companies. According to company officials, the decline was due to the growing use of teams, rather than individuals, that suggested and recommended key areas for improvement. The average annual increase in the number of suggestions was 16.6 percent.
Improved Operating Procedures
Organizations’ operating indicators measure the quality and cost of their products and services. Companies we studied used their measures to assess the impact of quality management on their operations. The mea- sures included (1) reliability, (2) timeliness of delivery, (3) order- processing time, (4) production errors, (5) product lead time, (6) inven- tory turnover, (7) quality costs, and (8) cost savings. Productivity, as well as profitability, was measured by the companies in our survey by sales per employee, and the results are included in a later discussion of the companies’ financial indicators.
All 20 companies provided data on their operations. We obtained a total of 65 observations. Fifty-nine of the 66 reflected improvement, 2 became worse, and 4 indicated no change. (See table 2.2.)
Page 20 GAO/NSIAIMl-190 Management Practicea

chapter 2 Compani~Improved0pwathgBesnlts
Table 2.2: Operating Indicators
Performance indicator Reliabilitv
Number of responding companies
12
Direction of indicator Posltive
(favorable) Negative
(unfavorable) No change 12 0 0
Timeliness of deliverv 9 8 1 0 Order-processing time 6 6 0 0 - Errors or defects 8 7 0 1 Product lead time 7 6 0 1
Inventory turnover 9 6 1 2 .__ Costs of quality 5 5 0 0 ~. -_ .--- Cost savinas 9 9 0 0
Total 2
*Indicates the total number of companies providing data and not the total number of responses for all performance indicators. Source: GAO’s analysis of company provided data.
The specific operating indicators for the companies in our study are illustrated in figure 2.2 and discussed below.
Page 21 GAo/N8IADgl-190 Management Practices

Chapter 2 Compadeo Improved OpWLW ~~ult8
Figure 2.2: Average Annual Percentage Improvement in Operating Indicator8
20 AWNQO wmwl pomenUg~ improvomonl
lndlcaton
a Data from 12 companies b Data from 9 companies c Data from 6 companies d Data from 6 companies ’ Data from 7 companies f Data from 9 companies Q Data from 5 companies
Source: GAO’s analysis of company provided data.
We found the following:
9 Reliability improved by an annual average of 11.3 percent for all 12 companies providing data. Reliability of products and services refers to their freedom from error or breakdown while in use by the customer. Reliability is measured by the number of claims filed or recalls on an annual basis or by other indicators unique to a particular industry.
l Eight of nine reporting companies improved their timeliness of delivery. The remaining company showed a small decline (0.1 percent) but had a high percentage (97 percent) of on-time delivery. Timeliness of delivery is defined as the percentage of on-time delivery. The annual average improvement for on-time delivery was 4.7 percent.
Page 22 GAO/NSlA.Dpl-191) Mamsgement practices

chapt0r 2 Companlea Improved Operating Retdtu
. All six reporting companies reduced their order-processing time. Order- processing time measures the amount of time required to respond to a customer’s request or order. The average annual reduction in processing time was 12 percent.
. Seven of eight reporting companies had fewer errors or defects, while the other company was unchanged at a high level of error-free products (nearly 100 percent). The annual average reduction in errors was 10.3 percent. Errors or defects identified during the “production” of the product or service were measured by companies in parts per thousand or million units or other measures unique to their industry.
l Six of seven reporting companies shortened their product lead time. Executives at the seventh company said they did not offer many new products and their lead time had not changed. Product lead time (also known as cycle time) is defined as the period of time in years from design of a new product or service until it is available to the customer. The average annual reduction in product lead time was 6.8 percent.
l Six of nine reporting companies experienced a more rapid inventory turnover. Inventory turnover is defined as the cost of goods sold divided by the average yearly inventory. Two companies maintained inventory turnover of 6 times a year. According to one company official, the decline in his firm’s inventory turnover was due to weak industry demand; however, the company’s turnover was better than the industry average. Companies’ inventory turnover rate increased by 7.2 percent on an average annual basis.
. Only five companies measured the costs of quality. Others did not, citing the problems of defining cost factors and the administrative burden of collecting such data. All five companies lowered such costs by 9 percent on an average annual basis. The costs of quality are essentially the cost of quality failures or defects (lost profits, rework, and scrap) or the cost of trying to avoid them (inspection, testing, and training).
l For all nine reporting companies that provided data on cost savings from quality improvement efforts, there was an increase in savings from suggestions to improve products and services to satisfy customers. The average annual cost savings attributed to employees’ suggestions ranged from $1.3 million to $116 million per year.
Greater Customer Satisfaction
Y
Many companies have changed their traditional view that quality involves merely meeting technical specifications. They now recognize that quality is defined by the customer and that companies must focus on meeting customer needs and expectations. Our measures of customer satisfaction were based on the results of company surveys of con- sumers’ perception of a product or service. Customer satisfaction was
Page 23 GAO/NSIAD-91-190 Management Practices

Chapter 2 Companies Improved Operatine It.fsdta
defined as overall satisfaction, fewer complaints, and high customer retention.
Seventeen of 20 companies provided data on indicators of customer sat- isfaction We obtained a total of 30 observations. We found that 21 of the 30 improved, 3 became worse, and 6 were unchanged. (See table 2.3.)
Table 2.3: Customer Satisfaction indicators
Performance indicator .^_. . ..__ ---.~--__.-- Overall customer satisfaction
Number of Direction of indicator responding Positive companies (favorable)
Negative (unfavorable) No change
14 12 0 2
Customer complaints 6 5 1 0 - . . . ..-. ~. Customer retention 10 4 2 4 ._ .._ .._ __-_-__----.__- Total 17’ 21 3 6
‘Indicates the total number of companies providing data and not the total number of responses for all performance indicators. Source: GAO’s analysis of company provided data.
The specific customer satisfaction results are illustrated in figure 2.3 and discussed below.
Page 24 GAO/NSIAD-91-199 Management praetioes

chaptm 2 companierr Improv~Opera~Refmlta
Figure 2.3: Average Annual Percentage Improvement in Curtomer Satirfaction Indicators
15 AwJgJ JnnuJl pJmfltJgJ hnpmvmmt
;Dala from 14 companies Data from 6 companies
‘Data from 10 companies
Source: GAO’s analysis of company provided data
We found the following:
. Overall customer satisfaction increased for 12 of 14 reporting companies and was unchanged at a high level (89-100 percent satisfaction) in the other 2 companies. Companies experienced an annual average increase in customer satisfaction of 2.5 percent.
. Customer complaints declined in 6 of 6 reporting companies. Complaints increased in the other company because it had started a new, more reli- able system to better identify and correct complaints received. The average annual decline in customer complaints was 11.6 percent.
l Customer retention improved in 4 of 10 reporting companies (an annual average of 1 percent). Four companies were unchanged but retained a
Page 25 GAO/NSIAB91-l(H) Management Practicea

chapter2 C.ompani~ImprovedOperathgBesnlta
high level (00-100 percent) of their customers, and two experienced a slight decline (0.2 to 1.2 percent) since implementing T&M.
Increased Financial Performance
sured by several ratios. One important measure used was market share. Companies that build market share on the basis of improved product quality and value believe it is the route to increased profitability. Other ratios the companies used included (1) sales per employee, (2) return on assets, and (3) return on sales.
Obtaining information about companies’ financial performance was dif- ficult. Some of the companies in our sample were subsidiaries of a parent organization or were privately owned companies that had a policy of not disclosing financial information. Fifteen of the 20 compa- nies provided some information on their financial performance. For the 16 responding companies we obtained a total of 40 observations. We found 34 of the 40 observations increased and 6 declined. (See table 2.4.)
Table 2.4: Financial Performance Indicators
Performance indicator ___- Market share .". .-- Sales per employee Return on assets ketiin &I saies -. - .---. ~.
Totai
Number of Direction of indicator responding Positive
(favorable) Negative
companies (unfavorable) No change 11 9 2 0 12 12 0 0 _______ 9 7 2 0 -- 8 6 2 0 --
15" 34 6 0
Tndicates the total number of companies providing data and not the total number of responses for all performance indicators. Source: GAO’s analysis of company provided and publicly available data.
The specific improvement in each financial performance indicator is illustrated in figure 2.4 and discussed below.
Page 28 GAO/NSIADSl-190 Management Practkef3
‘I, ,
;.\ I _’

chapter 2 companlee Improved Operating lh3ults
Figure 2.4: Average Annual Percentage improvement in Financial Performance Indicators 20 Avarage annual pwcmnlaga Impfovemant
15
IndIcatora
‘Data from 11 companies b Data from 12 companies c Data from 9 companies d Data from 8 companies
Source: GAO’s analysis of company provided and publicly available data.
We found the following:
. Market share increased for 9 of 11 reporting companies and declined for 2 companies. According to company officials in both of these companies, increased foreign competition contributed to the decline. Both compa- nies have since reversed the decline and are recovering lost market share. The annual average increase in market share was 13.7 percent.
. Sales per employee increased in all 12 reporting companies. The annual average increase was 8.6 percent. The sales dollars reported were the actual dollar value not adjusted for inflation. Therefore, constant dollar sales per employee are somewhat lower than the reported numbers.
Page 27 GAO/NSIAITsl-199 Management Practices

chapter 2 cem~eeImprovedoperatlngReenl~
l Seven of nine companies for which data were available increased their return on assets. Return on assets is the company’s earnings before interest and taxes divided by average gross assets. Two companies, facing intense competition, had a small (0.1 to 0.6 percent) decline. The average annual increase was 1.3 percent.
l Six of eight reporting companies increased their return on sales by an annual average of 0.4 percent; the other two companies, facing intense competition, had a decline of 1 to 2 percent. Return on sales is the com- pany’s earnings before interest and taxes divided by net sales.
Operating results as measured by the above financial ratios increased for 13 of the 16 companies that provided data. The profitability of a particular company can also be affected by a variety of factors external to a company. Such external influences include the general state of the economy; supply and demand conditions within a particular industry; and, for exporters, the relative value of the U.S. dollar in foreign mar- kets. In a few cases, companies in our sample were operating in intensely competitive conditions and, while not all measures of profit- ability increased, the profit decline was reversed. These companies fared better than their competitors because they recovered lost market share.
Page 28 GAO/NSLAD91-199 Management Practices

Common Features Contributing to Improved Performance
The companies we studied represented a wide range of industries and competitive environments. We discerned, however, that six interrelated features consistently appeared in the companies’ T&M efforts that con- tributed to improved performance. These features involved the fol- lowing practices:
l Corporate attention was focused on meeting customer quality requirements.
l Management led the way in disseminating TQM values throughout the organization.
l Employees were asked and empowered to continuously improve all key business processes.
l Management nurtured a flexible and responsive corporate culture, . Management systems supported fact-based decision-making. l Partnerships with suppliers improved product or service quality.
Customer Focus A critical feature in all of the quality improvement efforts we reviewed was the adoption of a strong customer focus. The result was that cus- tomers reaped the benefits of TQM efforts. Both the internal customer- the person with whom each employee interacted-and the external cus- tomer-the buyer of the product or service-benefited. Companies used a variety of means- focus groups, surveys, and meetings-to better understand their customers’ requirements and value expectations. Many of these companies adopted the notion of surveying their internal “cus- tomers” as a means of evaluating internal business processes.
In general, we found that companies explored a number of new and cre- ative ideas in the area of improving customer relations. Some of these ideas involved the following:
l Customer-defined quality. Several company executives stated that “quality is what the customer says it is” and that the customer’s percep- tion of quality should drive the quality improvement effort. According to Tom Peters, the well-known author and management consultant, this awareness was still not widespread throughout corporate America in 1987.1 The customer’s role in shaping quality does not appear to be a secret any more at the companies in our study. These companies used focus groups, customer opinion surveys, meetings with customers, and
‘Tom Peters, Thriving on Chaos: Handbook for a Management Revolution (New York: Knopf Pub- lishers, 1987).
Page 29 GAO/NSIAD-91-199 Management Practkee

chapter 3 hutnonPeaturescontrlbutingto Improved Performance
other means to better understand their customers’ requirements and expectations.
Several companies noted that prior to adopting total quality manage- ment, they had “lost touch’ with their customers. These companies see TQM, with its overarching customer focus, as the vehicle for reinforcing the primacy of the customer. To illustrate this point, a manufacturing company official displayed a customer satisfaction matrix with elements of customer satisfaction on one axis and key business processes (e.g., marketing, design, and production) on the other axis. The matrix itself documented the extent to which each business process was related to some elements of customer satisfaction, The company official believed that its employees, after being shown this matrix, were now more inclined to view their activities in terms of adding value to the customer relationship.
. New marketing concepts, According to company executives, traditional marketing approaches failed to bring to the surface the complex range of customer needs and expectations. Several companies discussed with us the “Kano model,” named for its creator, a Japanese quality manage- ment expert. This model differentiates between features the customer expects and features that the customer does not expect but is delighted to find. According to the Kano model, traditional marketing has focused on expected features and does not recognize opportunities to surprise and delight the customer.
l New approaches to customer feedback. A number of techniques were used to obtain customer feedback. For example, companies established “800” toll-free telephone numbers and conducted random surveys of their customers. One company called all new customers within 90 days after a sale to find out if any problems existed. Several companies required their sales and marketing executives to meet with random groups of key customers on a regular basis. We also found a number of companies that brought key customers and suppliers into internal product design and development meetings.
. Recognition of internal customers. Company officials recognized the importance of satisfying its “internal customers.” Employees were asked to view themselves both as customers of and suppliers to other employees. For example, one manufacturer called on all employees to answer several simple questions such as “Who are my internal cus- tomers?” and “Am I meeting their requirements?” A company official told us that through this process the firm had identified and eliminated thousands of useless activities.
Page 30 GAO/NSIAD-91499 Management Practices

Chapter 3 Common Feature6 Contributing to Improved Performauce
Management Leadership
A company’s senior management team plays a critical role in providing leadership to all quality improvement efforts. We often heard from cor- porate executives that quality improvement is a difficult, long-term pro- cess. Consequently, senior managers led the process, demonstrating their commitment to quality through their daily actions and working to build quality values throughout the organization,
Among the companies we studied, an effective leadership effort eventu- ally resulted in a quality program that was integrated into all key busi- ness processes.
Managing for Improvement
Quality At the companies we studied, quality improvement was integrated into strategic and operational planning. For example, the companies’ senior leadership team organized and directed the quality improvement pro- cess and developed a cycle for evaluating and improving the procedure. Chief executive officers often initiated companywide quality improve- ment efforts. In several cases, these efforts were prompted by severe competitive pressures. In other cases, corporate leaders anticipated that prevailing management approaches would not be adequate to meet future challenges.
We observed a number of innovations that highlighted management’s role in quality improvement. In one company, a major manufacturer had established a companywide policy of “unafraid plain talk” to open lines of communication. Several other companies stressed the accessibility of their senior managers and implemented programs to make it easier for employees to voice their complaints and ideas.
Employee Involvement Another key feature of successful TQM systems was employee involve- ment and empowerment. The companies we reviewed worked hard at involving their employees in quality improvement both individually and in teams. The companies created a widespread awareness of the impor- tance of quality and the responsibility of each employee in assuring quality, The companies also tended to implement human resource man- agement practices that demonstrated respect for the abilities and well- being of their employees.
-- ~~ ~~ A Shift in Philosophy Was Several executives told us that gaining employee commitment to contin-
Required uous improvement required a profound shift in the philosophy of senior management, In many organizations the traditional philosophy is that a
Page 31 GAO/NSIAJhBl-190 Mauagement Practices

chnptar3 Common Features Contributing to Improved Performance
work force should be “managed” to conform to existing business sys- tems. The TQM philosophy is that the work force, given the power to develop and implement new and better business systems, can be a tre- mendous source of competitive advantage. Successful companies believed that the employees most closely involved with the business sys- tems have the most precise knowledge of how these processes work or how they should work.
Training Supported Employee Involvement and Empowerment
Training was essential to involve employees in continuous quality improvement efforts. In general, companies had two phases of quality management training. Companies first provided awareness training in quality management principles. This training created a companywide understanding of the quality improvement effort. Companies then trained employees in particular skills prior to empowering them to make changes to improve the quality of products and services.
We noted a number of trends in the training programs at these compa- nies. Virtually all of the companies significantly increased the resources committed to training. Many of these companies also adopted programs to make the training more relevant. For example, one manufacturer told us that his company did not give training education credits to employees until the employees could demonstrate they had applied their new skills on the job.
Open Corporate Culture
Another common feature of the companies in our study was a company- wide effort to develop a flexible and responsive corporate culture. An organization’s culture is the set of values, beliefs, and behaviors that form its core identity. For some of these companies with a history of excessive hierarchy, rigidity, and a relative lack of trust between labor and management, changing the culture presented a difficult challenge. Company officials agreed, however, that developing an open and more responsive culture was a key to their firms’ future competitiveness or even survival. However, changing an organization’s culture takes time. One quality expert estimated it could take 6 years or more to complete such a change. Executives generally defined a flexible and responsive corporate culture in terms of four attributes: widespread information- sharing; fewer formal and informal barriers between departments and among workers; a spirit of innovation; and a high level of employee satisfaction.
Page 32 GAO/NSW91499 Management F’ractices
t
’

chapter3 Common Featurea Chtdbuting to Improved Performance
Information-Sharing According to several company executives, under TQM information previ- ously treated as proprietary by senior management was increasingly shared with all employees. This information ranged from performance data-divisional sales and profitability-to results of employee surveys. Quality executives believed that sharing information gave employees a better sense of how their efforts fit into the overall organi- zational performance and contributed to a sense of employee involve- ment. These executives emphasized that sharing previously restricted information was a visible symbol that the company was serious about trying to change its culture.
Fewer Formal and Informal Barriers
A number of U.S. quality management experts have talked about the need to remove barriers. For example, two of Dr. W. Edwards Deming’s “Fourteen Points of Management Obligation” address the need to elimi- nate formal barriers between departments and remove informal barriers to pride of workmanship. We observed several efforts to remove such formal and informal barriers. At some companies, for example, manage- ment perquisites, such as executive dining rooms and reserved parking spaces, were eliminated. In addition, employees from different disci- plines were organized in cross-functional, problem-solving teams. In some cases, compensation and appraisal systems were changed to reflect team as well as individual performance.
-~ ~~~~~
A Spirit of Innovation Innovation is widely viewed as a key to maintaining business competi- tiveness. However, creating an innovative work environment is a diffi- cult process. Experts believe that an innovative culture must be nurtured over time. Management edict cannot make people creative.
Several of the companies we reviewed are recognized as leaders in inno- vation We observed a number of practices these companies adopted to build a spirit of innovation among their work forces.
l Creative suggestions for quality improvement were recognized and rewarded.
. Financial and technical support to help employees follow up on partially developed ideas was provided.
. Employees were encouraged to spend time away from their regular duties thinking about new ideas and opportunities.
Page 33 GAO/NSIAD-91WJO Management Practices
“,. ,:/
,“;“‘,:’
Chapter 3 Common Featurea Contributing to Improved Performance
High Employee Morale Many of the companies we studied tracked employee morale and job sat- isfaction, both through formal surveys and informal contacts among employees and managers. These companies reported that adopting T&M generally improved employee morale. Executives cited the following possible reasons for this improvement:
l Employees enjoyed being associated with a company recognized for pro- viding quality products and services.
l Employee empowerment provided an opportunity for employees to shape their work environment.
. Managers focused on making systemic improvements rather than on blaming employees for problems.
A number of companies shared with us the results of internal surveys that documented higher morale and job satisfaction. We also noted other evidence of higher morale. One company, for example, reported that its employees volunteered to spend a weekend relocating their manufac- turing equipment to create a more efficient process, based on studies the employees had organized.
Fact-Based Decision- Fact-based decision-making also was a common feature of total quality
Making management. This quality improvement was carefully planned, using a systematic process to constantly measure and evaluate the quality achieved with existing business processes and making changes when necessary. TQM practitioners described this as a “Plan-Do-Check-Act” approach to quality improvement, We observed fact-based decision- making practiced in a number of key operational areas.
For example, the most common application was in reviewing manufac- turing processes to identify and eliminate defects. Manufacturing com- panies used “statistical process control” techniques to maintain control over key steps in their manufacturing processes. Statistical process con- trol is based on the principle that excessive variation limits the levels of quality achievable through existing processes. “Excessive variation” by definition results from an out-of-control process. Correcting excessive variation requires changing the process to bring it within control specifications.
We also observed a number of companies that used fact-based surveys to track customer satisfaction and employee job satisfaction. Executives said that such information provided a “reality check” on how their quality improvement efforts were perceived.
Page 34 GAO/NSLAD-91-199 Management Practices

chapter 8 Cmnmon Featurea Contrbuting to Improved Performance
Partnership With Suppliers
Another key feature in the companies we reviewed was a restructuring of the fundamental relationship between the companies and their sup- pliers. The traditional practice in many U.S. firms has been to establish minimum specifications for suppliers and to use price to select from among suppliers who meet these specifications. In contrast, many of our companies in the study had established closer, long-term partnerships with a smaller number of suppliers who met high quality standards. Several executives stated that supplier excellence was seen as an increasingly important factor in achieving competitive quality levels. Beyond asking that suppliers provide quality products, companies also tended to evaluate the ability of suppliers to be partners in the TQhf effort. One executive, for example, said he increasingly evaluated a sup- plier’s “attitude and willingness to grow with us” when he considered giving the supplier new business.
Close company supplier relationships were manifested in a number of ways. For example, some companies included supplier personnel in key product design meetings as well as helped suppliers improve their own quality systems. Other manufacturers used a supplier certification pro- cess to ensure that the supplier’s own production system was designed to maintain conformance with the manufacturer’s specifications+. Sev- eral companies even asked their suppliers to apply for the Baldrige Award within a set number of years in order to evaluate their own T&M efforts. The benefits from these new supplier relationships included, for example, sharply reduced costs of inspecting incoming shipments from suppliers who had strong process control capabilities.
Page 35 GAO/NSIAB91-190 Management Practices
”

Widespread Applicability of Total Quality Management
We believe that the diversity of companies we studied showed that total quality management is useful for small companies (not more than 600 employees) as well as large (600 or more employees) and for compa- nies that sell services as well as for companies that produce and sell manufactured products. The companies we reviewed began to focus on total quality in the mid-1980s; their efforts are still evolving. They bene- fited from putting total quality management practices in place. How- ever, it took on average about 2 l/2 years for the 20 companies in our study (the range was from 1 to 6 years) to realize those initial benefits. The average time for the only small company in our study was 2 years; for large companies 2 3/4 years; and for service companies 1 l/2 years. Allowing sufficient time for results to be achieved was as important as initiating a total quality management system.
The companies we studied focused on a total quality management approach to improve their competitive position in both the domestic and world marketplace. Our study showed that adopting TQhf as a method for conducting their business had a positive impact on key areas of corpo- rate performance. Our conclusions are based on the data we collected as well as on information derived from on-site visits.
Important Features of TQM
The results of our study indicate that some features of TQM are widely applicable to other organizations and could potentially result in improved performance. These points include the following:
. Customer satisfaction is critical in order to remain competitive in the marketplace. Ultimately, customer satisfaction, both internal and external, drives quality efforts. Organizations, therefore, need to deter- mine what customers want and must have processes in place to meet those customer needs.
l Top executives must provide active leadership to establish quality as a fundamental value to be incorporated into the company’s management philosophy.
l Quality concepts need to be clearly articulated and thoroughly inte- grated throughout all activities of the company.
9 Top executives need to establish a corporate culture that involves all employees in contributing to quality improvements.
l Companies need to focus on employee involvement, teamwork, and training at all levels. This focus should strengthen employee commit- ment to continuous quality improvement.
Page 36 GAO/NSIAD9I-190 Wumgement Practicea

chaptar Widespread Applicability of Total Qnality Management
. To succeed, total quality management systems must be based on a con- tinuous and systematic approach of gathering, evaluating, and acting on facts and data.
. Suppliers should be made full partners in the quality management pro- cess. A close working relationship between suppliers and producers could be mutually beneficial.
The results of the companies we studied indicate TQM systems are prom- ising ways to strengthen a company’s competitiveness in both domestic and world markets.
Page 97 GAO/NSIAD91-199 Management Practicea
Appendix I
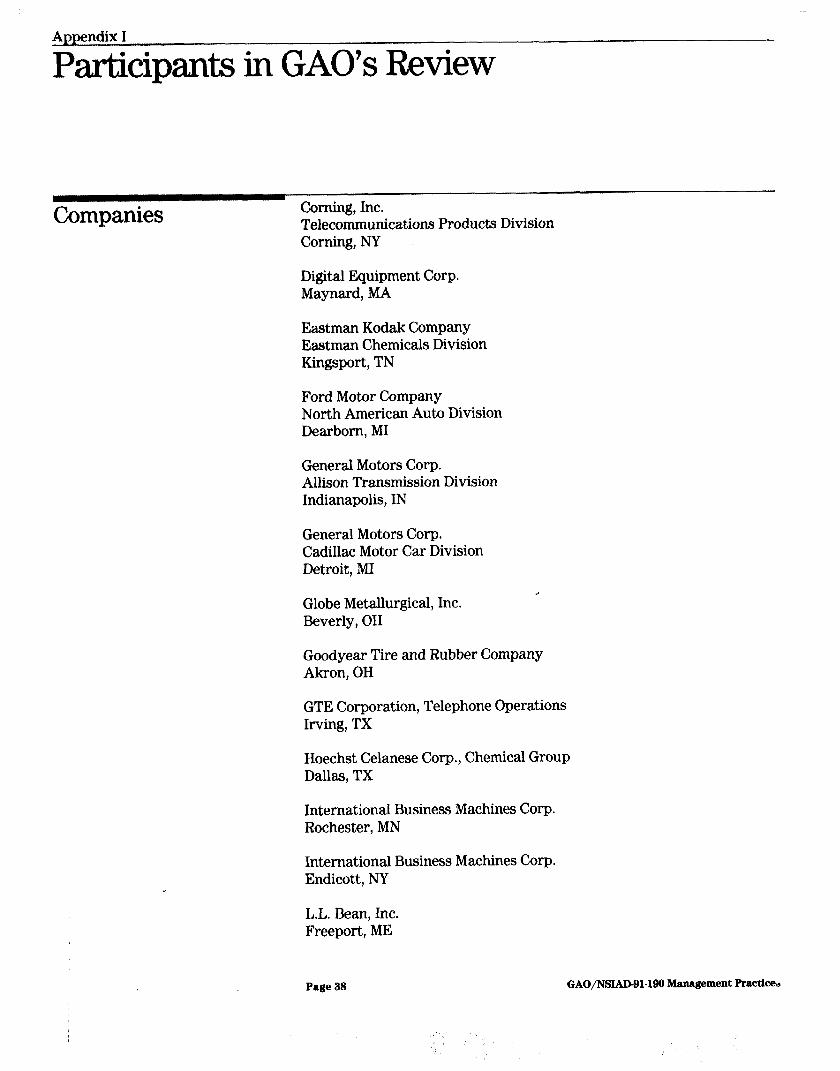
Participants in GAO’s Review
Companies - Telecommunications Products Division Corning, NY
Digital Equipment Corp. Maynard, MA
Eastman Kodak Company Eastman Chemicals Division Kingsport, TN
Ford Motor Company North American Auto Division Dearborn, MI
General Motors Corp. Allison Transmission Division Indianapolis, IN
General Motors Corp. Cadillac Motor Car Division Detroit, MI
Globe Metallurgical, Inc. Beverly, OH
,
Goodyear Tire and Rubber Company Akron, OH
GTE Corporation, Telephone Operations Irving, TX
Hoechst Celanese Corp., Chemical Group Dallas, TX
International Business Machines Corp. Rochester, MN
International Business Machines Corp. Endicott, NY
L.L. Bean, Inc. Freeport, ME
Page 38 GAO/NSIAD91-190 Management Pracdce~
,

Appendix I Participanta in GAO’S Beview
Milliken & Co. Spartanburg, SC
Motorola, Inc. Schaumburg, IL
Paul Revere Insurance Group Worcester, MA
Seagate Technology Small Disk Division Oklahoma City, OK
Timken Company, Bearing Division Canton, OH
IJSAA Insurance Company Property and Casualty Division San Antonio, TX
Westinghouse Electric Corp. Commercial Nuclear Fuel Division Pittsburgh, PA
Westinghouse Electric Corp. Westinghouse Furniture Systems Grand Rapids, MI
Xerox Corporation Business Products and Systems Fairport, NY
Other Groups Consulted
American Productivity and Quality Center Houston, TX
American Society for Quality Control Milwaukee, WI
American Quality Foundation New York, NY
Page 39 GAO/NSIAD-@l-lw) ManWemeM I’m&l-

Appendix I Participants in GAO’s Revtew
Association for Quality and Participation Cincinnati, OH
Chase Manhattan Bank New York, NY
Council on Competitiveness Washington, DC
Ernst & Young Cleveland, OH
Florida Power and Light Company Juno Beach, FL
General Systems Company Pittsfield, MA
Harvard University Cambridge, MA
Juran Institute, Inc. Wilton, CT
Landen Wells and Associates Palm Beach, FL
National Institute of Standards and Technology Washington, DC
Qualtec, Inc. Palm Beach, FL
Strategic Planning Institute PIMS Associates, Inc. Cambridge, MA
Technical Assistance Research Programs Washington, DC
The Conference Board New York, NY
Page 40 GAO/NSIAD-91-199 Management Practices

Appendix II
Major Contributors to This Report
National Security and John E. Watson, Assistant Director
International Affairs Thomas W. Hopp, Evaluator-in-Charge Craig A. Anderson, Evaluator
Division, Washington, DC.
General Government Brian L. Usilaner, Special Assistant for Productivity and Quality Issues
Division, Washington, DC.
(4FMO17) Page 42 GAO/NSIAD-91-190 Management Practices

Westinghouse Productivity and Quality Center Oakdale, PA
Page 41 GAO/NSLAD@l-190 Management Practicem

Ordcviug Inforruatiou
1J.S. Gt~neral Accounting Office PA). Hex 60 15 Gaitht~rshurg, MI) 20877
Ordt~rs may also be placed by calling (202) 275-6241.
-l______l . - - . - - -

--.--
-c