now inc. (dnow) second quarter 2016 review & key takeaways
TRANSCRIPT

We Distribute Products That Deliver Energy to the World®
NOW Inc., Third Quarter 2016 Review &Key Takeaways
Statements made in the course of this presentation that state the Company's or
management's intentions, hopes, beliefs, expectations or predictions of the future are
forward-looking statements. It is important to note that the Company's actual results
could differ materially from those projected in such forward-looking statements.
Additional information concerning factors that could cause actual results to differ
materially from those in the forward-looking statements is contained from time-to-time
in the Company's filings with the U.S. Securities and Exchange Commission. Any decision
regarding the Company or its securities should be made upon careful consideration of not
only the information here presented, but also other available information, including the
information filed by the Company with the SEC. Copies of these filings may be obtained
by contacting the Company or the SEC.
3rd Quarter 2016 Earnings2
Forward Looking Statements
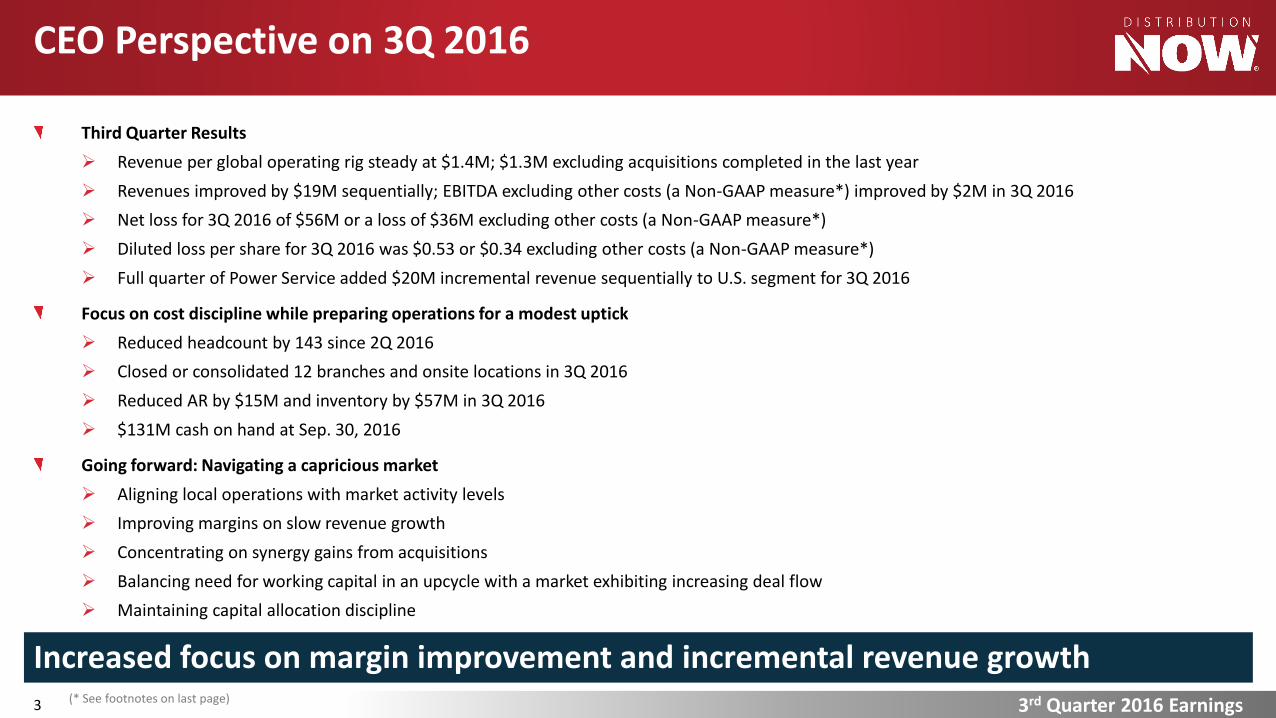
Third Quarter Results
Revenue per global operating rig steady at $1.4M; $1.3M excluding acquisitions completed in the last year
Revenues improved by $19M sequentially; EBITDA excluding other costs (a Non-GAAP measure*) improved by $2M in 3Q 2016
Net loss for 3Q 2016 of $56M or a loss of $36M excluding other costs (a Non-GAAP measure*)
Diluted loss per share for 3Q 2016 was $0.53 or $0.34 excluding other costs (a Non-GAAP measure*)
Full quarter of Power Service added $20M incremental revenue sequentially to U.S. segment for 3Q 2016
Focus on cost discipline while preparing operations for a modest uptick
Reduced headcount by 143 since 2Q 2016
Closed or consolidated 12 branches and onsite locations in 3Q 2016
Reduced AR by $15M and inventory by $57M in 3Q 2016
$131M cash on hand at Sep. 30, 2016
Going forward: Navigating a capricious market
Aligning local operations with market activity levels
Improving margins on slow revenue growth
Concentrating on synergy gains from acquisitions
Balancing need for working capital in an upcycle with a market exhibiting increasing deal flow
Maintaining capital allocation discipline
3rd Quarter 2016 Earnings3
CEO Perspective on 3Q 2016
Increased focus on margin improvement and incremental revenue growth(* See footnotes on last page)
3rd Quarter 2016 Earnings4
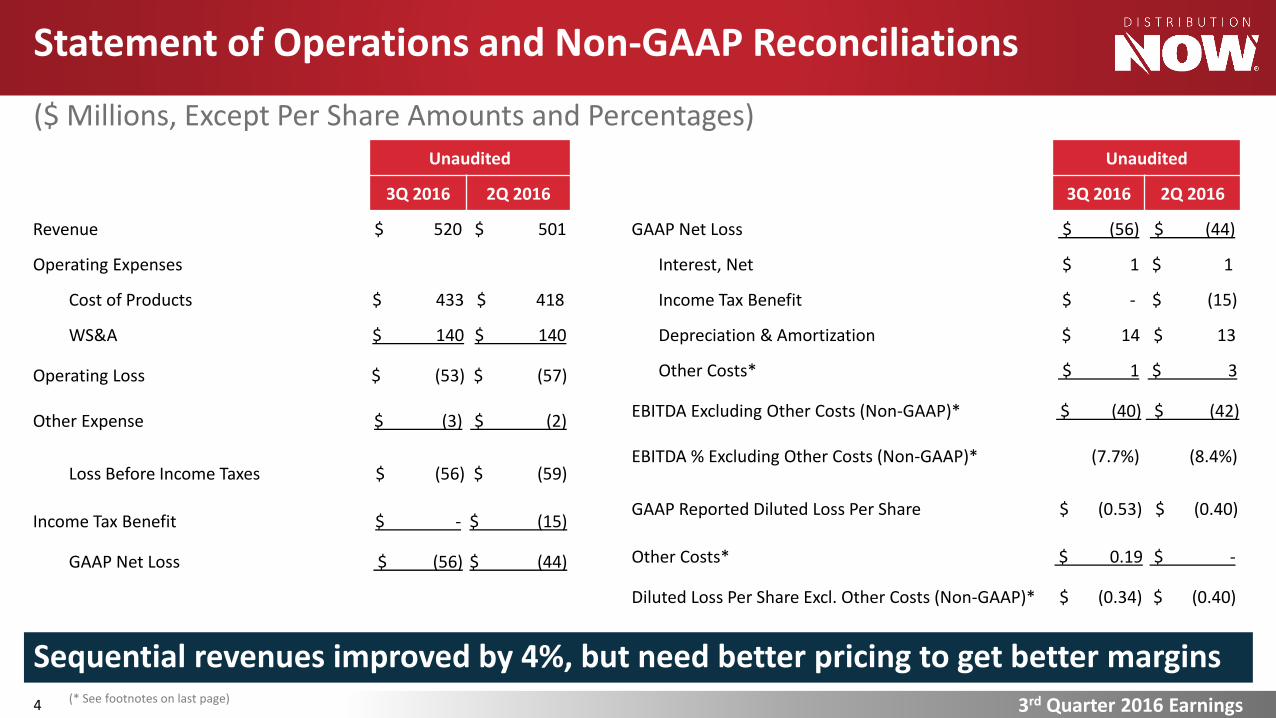
Statement of Operations and Non-GAAP Reconciliations
($ Millions, Except Per Share Amounts and Percentages)Unaudited
3Q 2016 2Q 2016
Revenue $ 520 $ 501
Operating Expenses
Cost of Products $ 433 $ 418
WS&A $ 140 $ 140
Operating Loss $ (53) $ (57)
Other Expense $ (3) $ (2)
Loss Before Income Taxes $ (56) $ (59)
Income Tax Benefit $ - $ (15)
GAAP Net Loss $ (56) $ (44)
Sequential revenues improved by 4%, but need better pricing to get better margins
Unaudited
3Q 2016 2Q 2016
GAAP Net Loss $ (56) $ (44)
Interest, Net $ 1 $ 1
Income Tax Benefit $ - $ (15)
Depreciation & Amortization $ 14 $ 13
Other Costs* $ 1 $ 3
EBITDA Excluding Other Costs (Non-GAAP)* $ (40) $ (42)
EBITDA % Excluding Other Costs (Non-GAAP)* (7.7%) (8.4%)
GAAP Reported Diluted Loss Per Share $ (0.53) $ (0.40)
Other Costs* $ 0.19 $ -
Diluted Loss Per Share Excl. Other Costs (Non-GAAP)* $ (0.34) $ (0.40)
(* See footnotes on last page)
3rd Quarter 2016 Earnings5
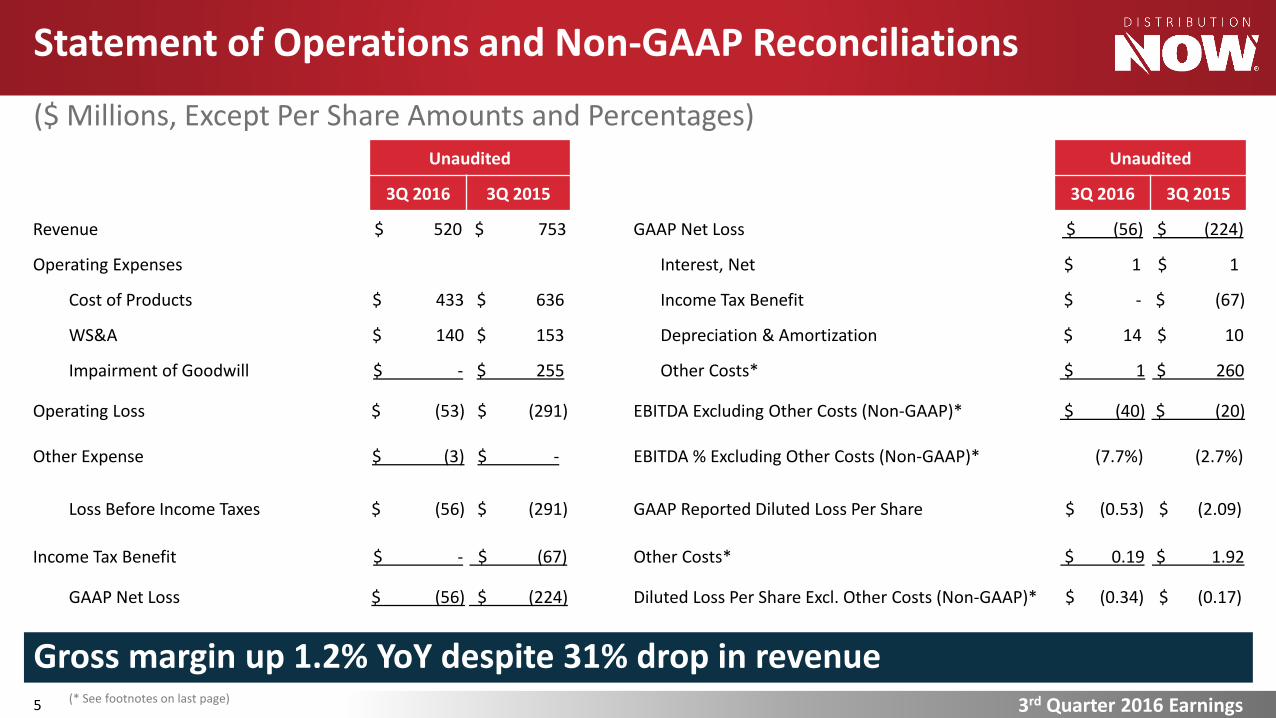
Statement of Operations and Non-GAAP Reconciliations
($ Millions, Except Per Share Amounts and Percentages)Unaudited
3Q 2016 3Q 2015
Revenue $ 520 $ 753
Operating Expenses
Cost of Products $ 433 $ 636
WS&A $ 140 $ 153
Impairment of Goodwill $ - $ 255
Operating Loss $ (53) $ (291)
Other Expense $ (3) $ -
Loss Before Income Taxes $ (56) $ (291)
Income Tax Benefit $ - $ (67)
GAAP Net Loss $ (56) $ (224)
Gross margin up 1.2% YoY despite 31% drop in revenue
Unaudited
3Q 2016 3Q 2015
GAAP Net Loss $ (56) $ (224)
Interest, Net $ 1 $ 1
Income Tax Benefit $ - $ (67)
Depreciation & Amortization $ 14 $ 10
Other Costs* $ 1 $ 260
EBITDA Excluding Other Costs (Non-GAAP)* $ (40) $ (20)
EBITDA % Excluding Other Costs (Non-GAAP)* (7.7%) (2.7%)
GAAP Reported Diluted Loss Per Share $ (0.53) $ (2.09)
Other Costs* $ 0.19 $ 1.92
Diluted Loss Per Share Excl. Other Costs (Non-GAAP)* $ (0.34) $ (0.17)
(* See footnotes on last page)

3rd Quarter 2016 Earnings6
Revenues Per Global Operating Rig
Rig Count Source: Baker Hughes, Inc.
($ Millions - QTR - Annualized)
Revenues per rig, steady as she goes
0%
5%
10%
15%
20%
25%
$-
$0.20
$0.40
$0.60
$0.80
$1.00
$1.20
$1.40
$1.60
1Q13 2Q 3Q 4Q 1Q14 2Q 3Q 4Q 1Q15 2Q 3Q 4Q 1Q16 2Q 3Q
Annualized Revenues Per Rig GM%
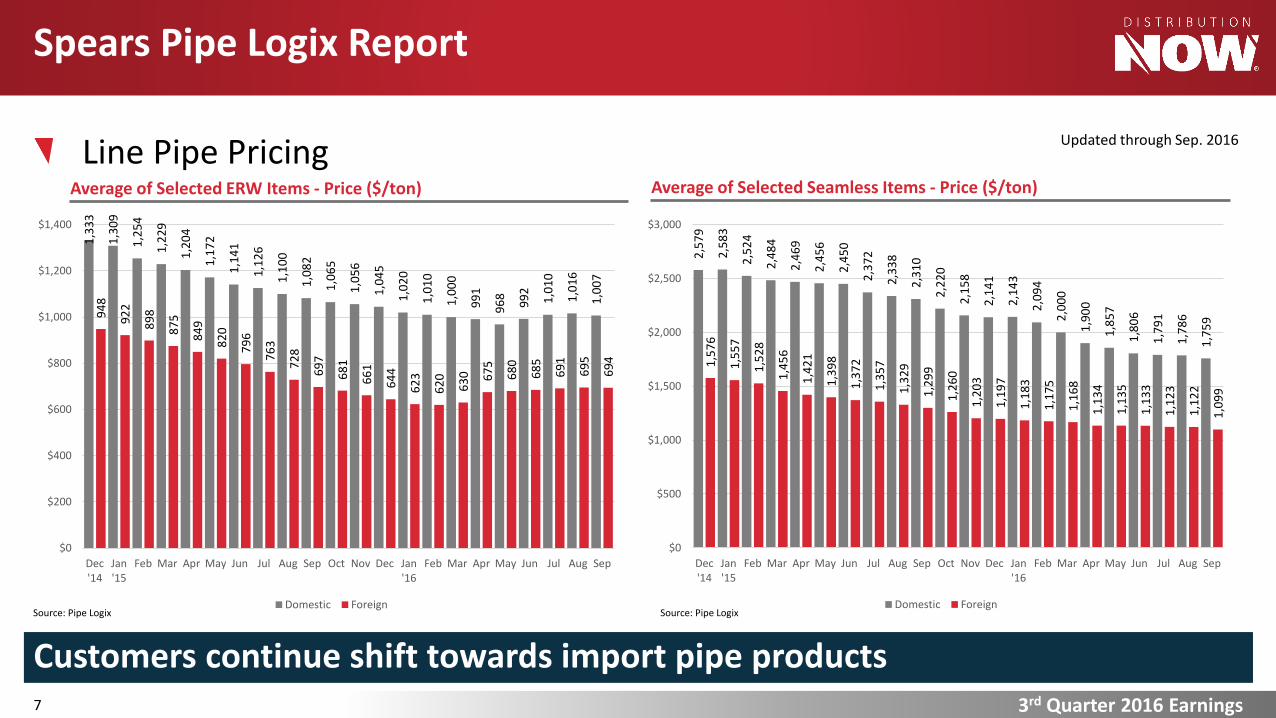
Line Pipe Pricing
3rd Quarter 2016 Earnings7
Spears Pipe Logix Report
Customers continue shift towards import pipe products
Average of Selected ERW Items - Price ($/ton) Average of Selected Seamless Items - Price ($/ton)
Source: Pipe Logix Source: Pipe Logix
Updated through Sep. 2016
1,3
33
1,3
09
1,2
54
1,2
29
1,2
04
1,1
72
1,1
41
1,1
26
1,1
00
1,0
82
1,0
65
1,0
56
1,0
45
1,0
20
1,0
10
1,0
00
99
1
96
8
99
2
1,0
10
1,0
16
1,0
07
94
8
92
2
89
8
87
5
84
9
82
0
79
6
76
3
72
8
69
7
68
1
66
1
64
4
62
3
62
0
63
0
67
5
68
0
68
5
69
1
69
5
69
4
$0
$200
$400
$600
$800
$1,000
$1,200
$1,400
Dec'14
Jan'15
Feb Mar Apr May Jun Jul Aug Sep Oct Nov Dec Jan'16
Feb Mar Apr May Jun Jul Aug Sep
Domestic Foreign
2,5
79
2,5
83
2,5
24
2,4
84
2,4
69
2,4
56
2,4
50
2,3
72
2,3
38
2,3
10
2,2
20
2,1
58
2,1
41
2,1
43
2,0
94
2,0
00
1,9
00
1,8
57
1,8
06
1,7
91
1,7
86
1,7
59
1,5
76
1,5
57
1,5
28
1,4
56
1,4
21
1,3
98
1,3
72
1,3
57
1,3
29
1,2
99
1,2
60
1,2
03
1,1
97
1,1
83
1,1
75
1,1
68
1,1
34
1,1
35
1,1
33
1,1
23
1,1
22
1,0
99
$0
$500
$1,000
$1,500
$2,000
$2,500
$3,000
Dec'14
Jan'15
Feb Mar Apr May Jun Jul Aug Sep Oct Nov Dec Jan'16
Feb Mar Apr May Jun Jul Aug Sep
Domestic Foreign
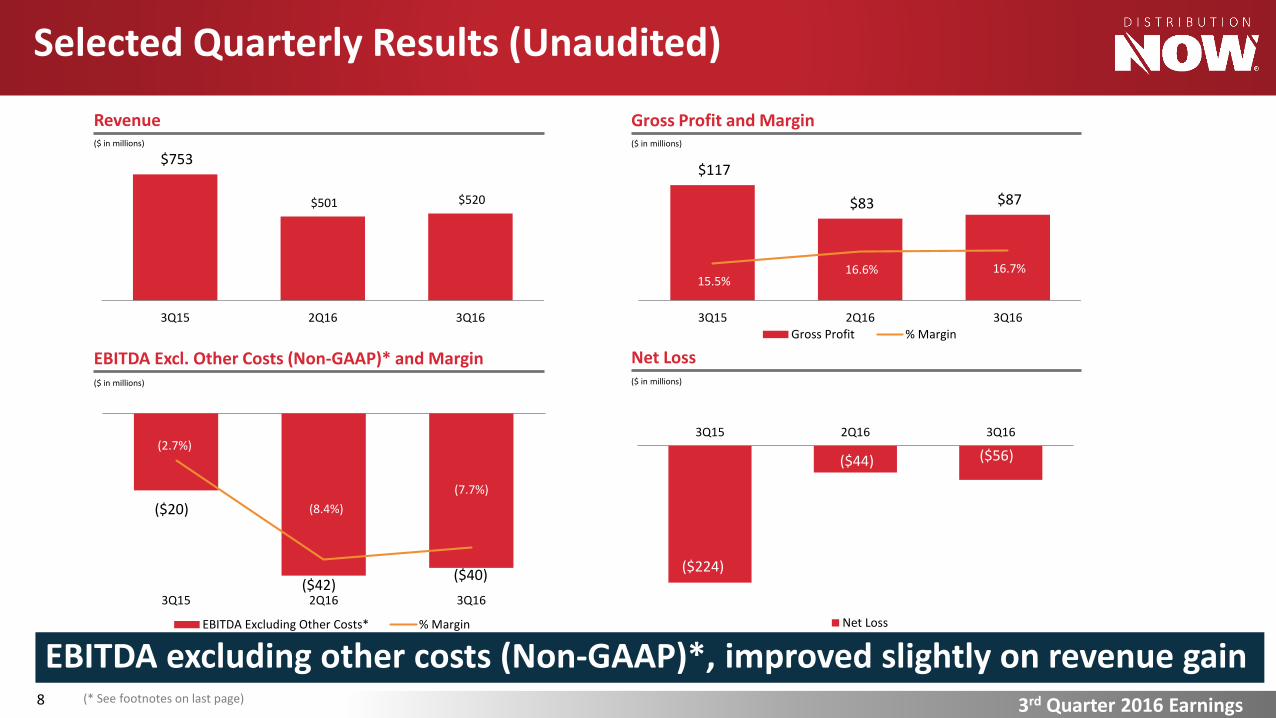
Selected Quarterly Results (Unaudited)
8
Revenue
$753
$501 $520
3Q15 2Q16 3Q16
($ in millions)
Gross Profit and Margin
$117
$83 $87
15.5% 16.6% 16.7%
3Q15 2Q16 3Q16
Gross Profit % Margin
($ in millions)
EBITDA Excl. Other Costs (Non-GAAP)* and Margin($ in millions)
Net Loss($ in millions)
($224)
($44) ($56)
3Q15 2Q16 3Q16
Net Loss
EBITDA excluding other costs (Non-GAAP)*, improved slightly on revenue gain3rd Quarter 2016 Earnings(* See footnotes on last page)
($20)
($42) ($40)
(2.7%)
(8.4%)
(7.7%)
3Q15 2Q16 3Q16
EBITDA Excluding Other Costs* % Margin
3rd Quarter 2016 Earnings
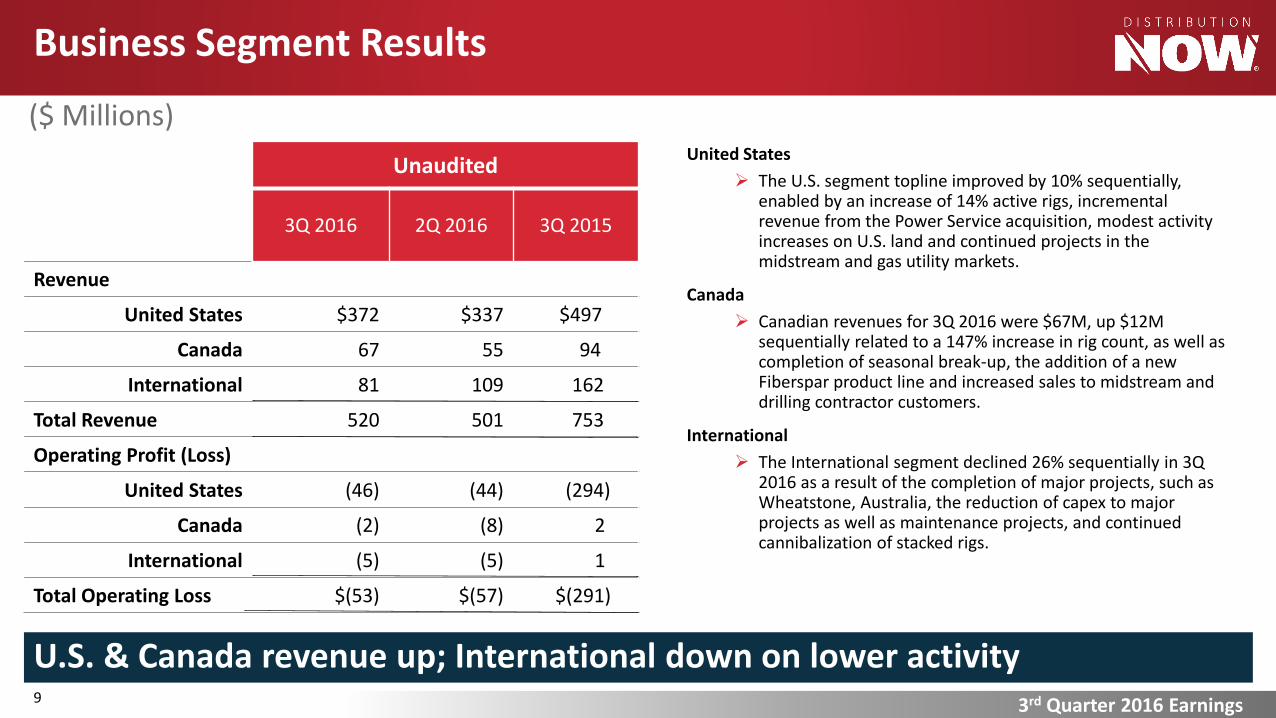
Business Segment Results
($ Millions)
Unaudited
3Q 2016 2Q 2016 3Q 2015
Revenue
United States $372 $337 $497
Canada 67 55 94
International 81 109 162
Total Revenue 520 501 753
Operating Profit (Loss)
United States (46) (44) (294)
Canada (2) (8) 2
International (5) (5) 1
Total Operating Loss $(53) $(57) $(291)
United States
The U.S. segment topline improved by 10% sequentially, enabled by an increase of 14% active rigs, incremental revenue from the Power Service acquisition, modest activity increases on U.S. land and continued projects in the midstream and gas utility markets.
Canada
Canadian revenues for 3Q 2016 were $67M, up $12M sequentially related to a 147% increase in rig count, as well as completion of seasonal break-up, the addition of a new Fiberspar product line and increased sales to midstream and drilling contractor customers.
International
The International segment declined 26% sequentially in 3Q 2016 as a result of the completion of major projects, such as Wheatstone, Australia, the reduction of capex to major projects as well as maintenance projects, and continued cannibalization of stacked rigs.
U.S. & Canada revenue up; International down on lower activity9
3rd Quarter 2016 Earnings10
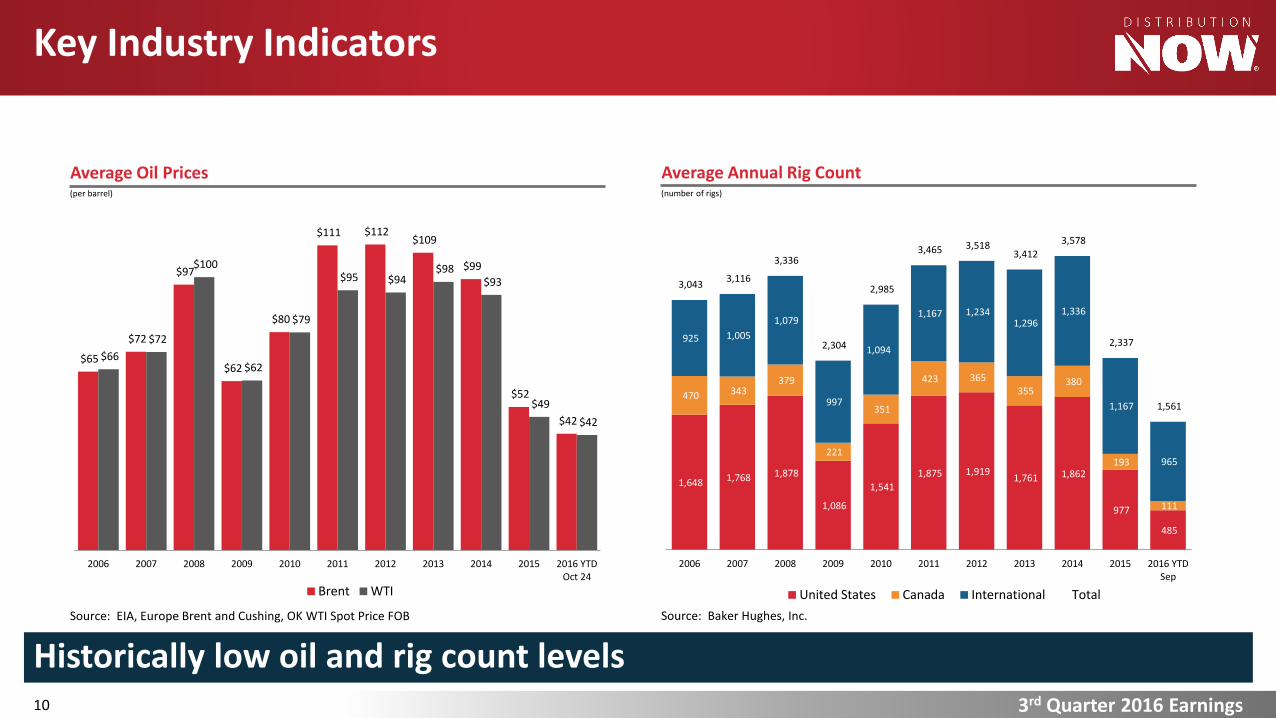
Key Industry Indicators
Average Annual Rig Count
Source: Baker Hughes, Inc.
(number of rigs)
1,648 1,768 1,878
1,086
1,541
1,875 1,919 1,761 1,862
977
485
470 343 379
221
351
423 365
355 380
193
111
925 1,005
1,079
997
1,094
1,167 1,234 1,296
1,336
1,167
965
3,043 3,116
3,336
2,304
2,985
3,465 3,518 3,412
3,578
2,337
1,561
2006 2007 2008 2009 2010 2011 2012 2013 2014 2015 2016 YTDSep
United States Canada International Total
Average Oil Prices
Source: EIA, Europe Brent and Cushing, OK WTI Spot Price FOB
(per barrel)
$65
$72
$97
$62
$80
$111 $112 $109
$99
$52
$42
$66
$72
$100
$62
$79
$95 $94 $98
$93
$49
$42
2006 2007 2008 2009 2010 2011 2012 2013 2014 2015 2016 YTDOct 24
Brent WTI
Historically low oil and rig count levels

3rd Quarter 2016 Earnings11
Key Industry Indicators
Recent Canada Rig Count Trends
Source: Baker Hughes, Inc., gray bars indicate 4th QTD rig count averages through Oct. 28
Recent U.S. Rig Count Trends
866
755
555
421480
543
0
100
200
300
400
500
600
700
800
900
1000
3Q15 4Q 1Q16 2Q 3Q 4QTD16
191174
164
49
121
157
0
50
100
150
200
250
3Q15 4Q 1Q16 2Q 3Q 4QTD16
Strengthening U.S. and Canada rig count trends
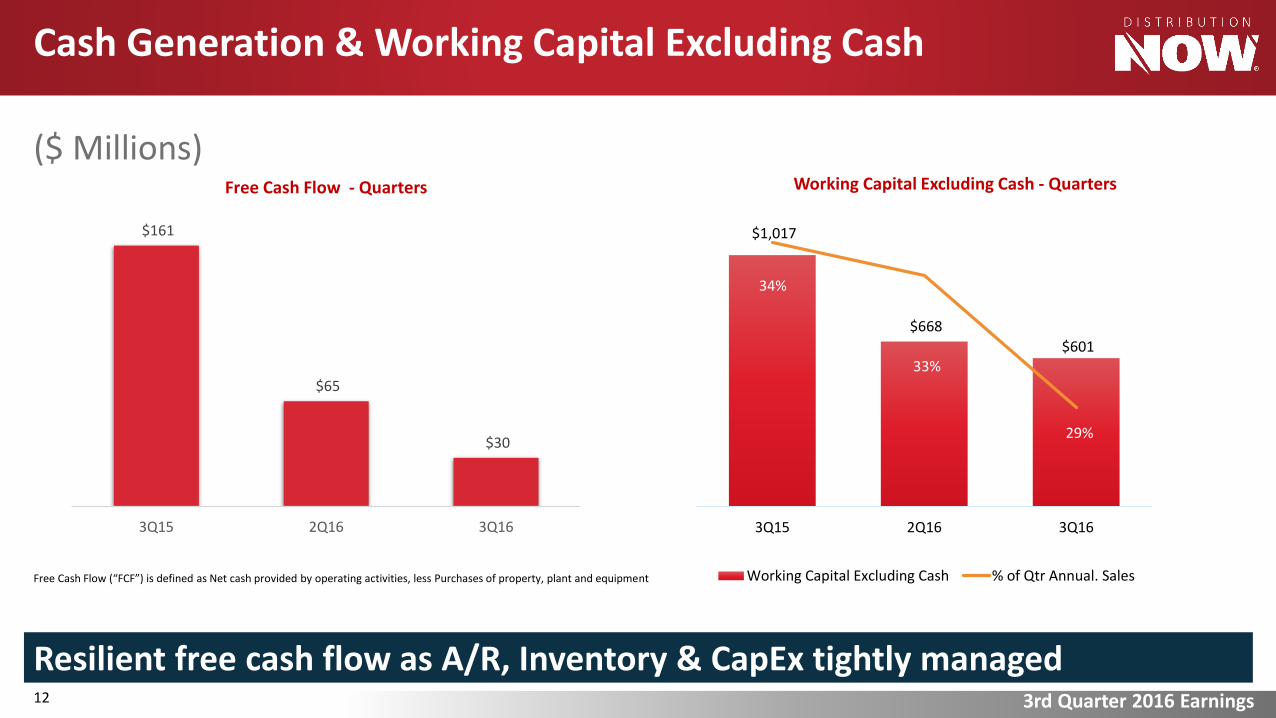
($ Millions)
Cash Generation & Working Capital Excluding Cash
Resilient free cash flow as A/R, Inventory & CapEx tightly managed
$1,017
$668
$601
34%
33%
29%
3Q15 2Q16 3Q16
Working Capital Excluding Cash % of Qtr Annual. SalesFree Cash Flow (“FCF”) is defined as Net cash provided by operating activities, less Purchases of property, plant and equipment
$161
$65
$30
3Q15 2Q16 3Q16
Free Cash Flow - Quarters Working Capital Excluding Cash - Quarters
3rd Quarter 2016 Earnings12
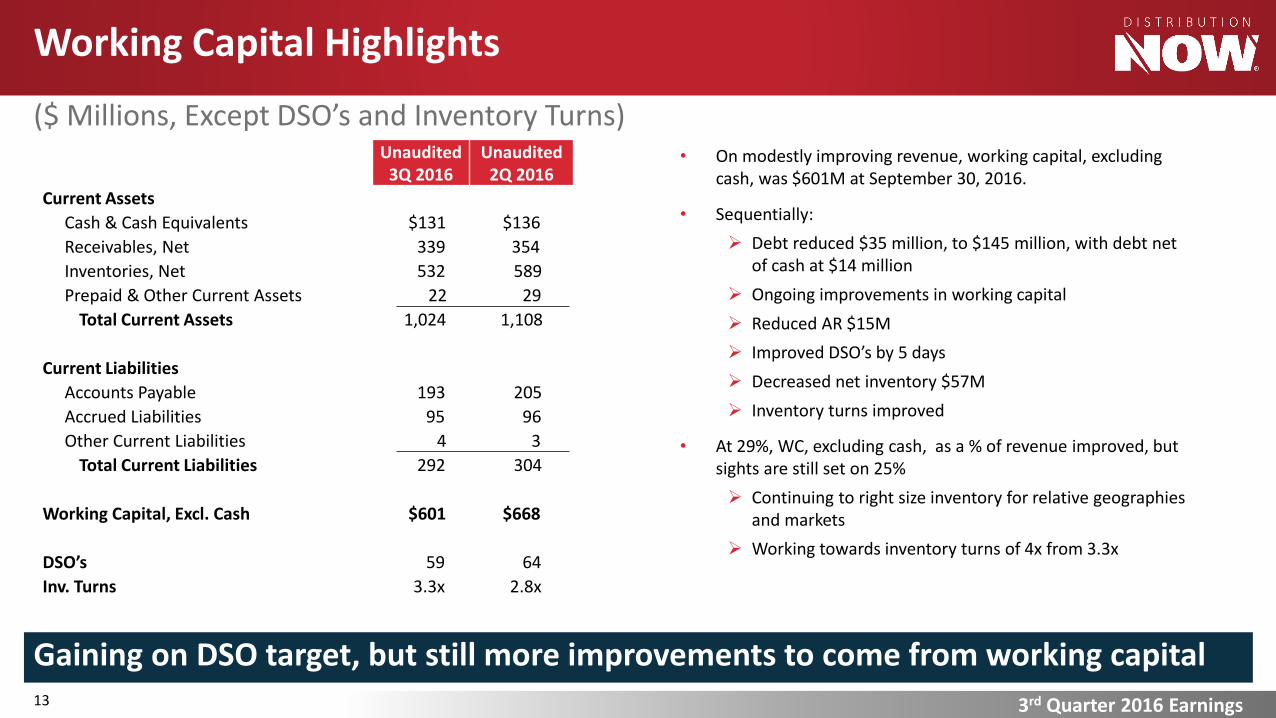
3rd Quarter 2016 Earnings13
Working Capital Highlights
($ Millions, Except DSO’s and Inventory Turns)
Gaining on DSO target, but still more improvements to come from working capital
Unaudited3Q 2016
Unaudited2Q 2016
Current Assets
Cash & Cash Equivalents $131 $136
Receivables, Net 339 354
Inventories, Net 532 589
Prepaid & Other Current Assets 22 29
Total Current Assets 1,024 1,108
Current Liabilities
Accounts Payable 193 205
Accrued Liabilities 95 96
Other Current Liabilities 4 3
Total Current Liabilities 292 304
Working Capital, Excl. Cash $601 $668
DSO’s 59 64
Inv. Turns 3.3x 2.8x
• On modestly improving revenue, working capital, excluding cash, was $601M at September 30, 2016.
• Sequentially:
Debt reduced $35 million, to $145 million, with debt net of cash at $14 million
Ongoing improvements in working capital
Reduced AR $15M
Improved DSO’s by 5 days
Decreased net inventory $57M
Inventory turns improved
• At 29%, WC, excluding cash, as a % of revenue improved, but sights are still set on 25%
Continuing to right size inventory for relative geographies and markets
Working towards inventory turns of 4x from 3.3x
2,0
14
1,9
76
1,9
35
1,7
82
1,5
53
1,3
20
1,1
05
99
5
91
8
89
5
93
1
98
0
1,0
09
1,0
44
1,1
07
1,1
72
1,2
67
1,3
50
1,4
19
1,4
79
1,5
13
1,5
31
1,5
73
1,6
38
1,6
55
1,6
68
1,6
83
1,7
11
1,9
30
1,9
25
1,9
25
1,8
82
1,6
83
1,3
48
1,1
10
97
6
88
9
86
1
86
6
88
3
84
8
79
1
76
0
71
4
65
4
53
2
47
8
43
7
40
8
41
7
44
9
48
1
50
9
54
3
400
600
800
1,000
1,200
1,400
1,600
1,800
2,000
Pea
k
Mo
1
Mo
2
Mo
3
Mo
4
Mo
5
Mo
6
Mo
7
Mo
8
Mo
9
Mo
10
Mo
11
Mo
12
Mo
13
Mo
14
Mo
15
Mo
16
Mo
17
Mo
18
Mo
19
Mo
20
Mo
21
Mo
22
Mo
23
Mo
24
Mo
25
Mo
26
Mo
27
2008/2009/2010 - Peak Sep 2008 2014/2015/2016 - Peak Sep 2014
$1
34
$1
33
$1
17
$1
04
$7
7
$5
7
$4
1
$4
2
$3
9 $
48
$5
0 $
59
$7
0
$6
4 $7
1
$6
9 $7
6
$7
8
$7
4
$7
8
$7
6
$8
1
$8
4
$7
4
$7
5
$7
6
$7
7
$7
5 $8
2
$1
06
$1
04
$9
7
$9
3
$8
4
$7
6
$5
9
$4
7
$5
1
$4
8 $5
4
$5
9
$6
0
$5
1
$4
3
$4
5
$4
6
$4
2
$3
7
$3
2
$3
0 $3
8
$4
1 $4
7
$4
9
$4
5
$4
5
$4
5
$5
0
$-
$20
$40
$60
$80
$100
$120
$140
$160
Pea
k
Mo
1
Mo
2
Mo
3
Mo
4
Mo
5
Mo
6
Mo
7
Mo
8
Mo
9
Mo
10
Mo
11
Mo
12
Mo
13
Mo
14
Mo
15
Mo
16
Mo
17
Mo
18
Mo
19
Mo
20
Mo
21
Mo
22
Mo
23
Mo
24
Mo
25
Mo
26
Mo
27
Mo
28
2008/09/10 - Peak June 2008 2014/15/16 - Peak June 2014
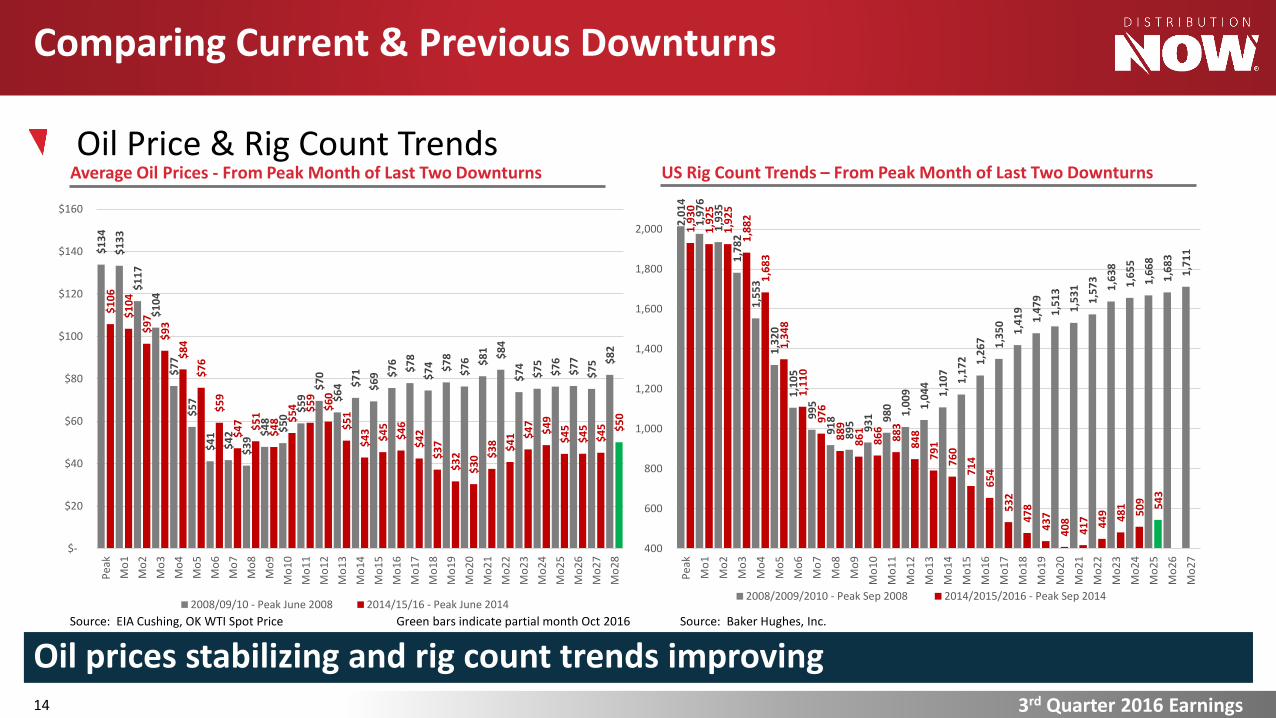
Oil Price & Rig Count Trends
3rd Quarter 2016 Earnings14
Comparing Current & Previous Downturns
US Rig Count Trends – From Peak Month of Last Two Downturns
Source: Baker Hughes, Inc.
Average Oil Prices - From Peak Month of Last Two Downturns
Source: EIA Cushing, OK WTI Spot Price
Oil prices stabilizing and rig count trends improvingGreen bars indicate partial month Oct 2016
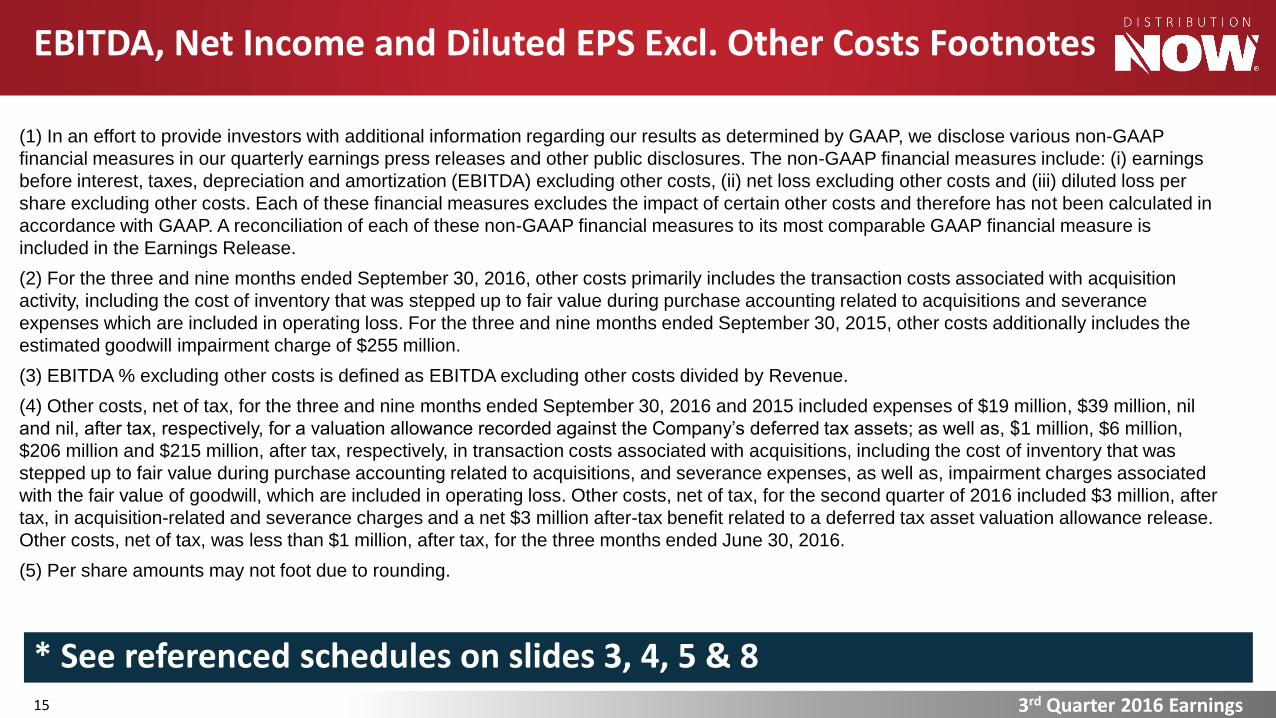
3rd Quarter 2016 Earnings15
EBITDA, Net Income and Diluted EPS Excl. Other Costs Footnotes
* See referenced schedules on slides 3, 4, 5 & 8
(1) In an effort to provide investors with additional information regarding our results as determined by GAAP, we disclose various non-GAAP
financial measures in our quarterly earnings press releases and other public disclosures. The non-GAAP financial measures include: (i) earnings
before interest, taxes, depreciation and amortization (EBITDA) excluding other costs, (ii) net loss excluding other costs and (iii) diluted loss per
share excluding other costs. Each of these financial measures excludes the impact of certain other costs and therefore has not been calculated in
accordance with GAAP. A reconciliation of each of these non-GAAP financial measures to its most comparable GAAP financial measure is
included in the Earnings Release.
(2) For the three and nine months ended September 30, 2016, other costs primarily includes the transaction costs associated with acquisition
activity, including the cost of inventory that was stepped up to fair value during purchase accounting related to acquisitions and severance
expenses which are included in operating loss. For the three and nine months ended September 30, 2015, other costs additionally includes the
estimated goodwill impairment charge of $255 million.
(3) EBITDA % excluding other costs is defined as EBITDA excluding other costs divided by Revenue.
(4) Other costs, net of tax, for the three and nine months ended September 30, 2016 and 2015 included expenses of $19 million, $39 million, nil
and nil, after tax, respectively, for a valuation allowance recorded against the Company’s deferred tax assets; as well as, $1 million, $6 million,
$206 million and $215 million, after tax, respectively, in transaction costs associated with acquisitions, including the cost of inventory that was
stepped up to fair value during purchase accounting related to acquisitions, and severance expenses, as well as, impairment charges associated
with the fair value of goodwill, which are included in operating loss. Other costs, net of tax, for the second quarter of 2016 included $3 million, after
tax, in acquisition-related and severance charges and a net $3 million after-tax benefit related to a deferred tax asset valuation allowance release.
Other costs, net of tax, was less than $1 million, after tax, for the three months ended June 30, 2016.
(5) Per share amounts may not foot due to rounding.