november econ outlook
TRANSCRIPT

Market Commentary
November 2013
ZACKS INVESTMENT MANAGEMENT
INDEPENDENT
Research | Thinking | Results Zacks

Market Commentary
1
ECONOMIC OUTLOOKThe Outlook in BriefImproved Financial Conditions; Fiscal MessThe Fed’s decision to forego the start to tapering at the September policy meeting brought a welcome improvement in financial conditions, which had been tightening since early May. This led us to revise up our forecast for 2014, but did not help enough to overcome a bit of weakening in near-term momentum.
• Incomingdataforthethirdquartersuggestedasomewhatweakerexpansionoffinalsales(1.8%vs.2.3%)andmore inventorybuilding than in lastmonth’s forecast, leavingourprojectionofGDPgrowthunchangedat1.8%.1
• Thus,despite signsof strengtheningmomentum in some indicatorsofmanufacturingproduction(ISM’s)thatweexpectwillcontributetoafirminginGDPgrowthinthefourthquarter,wenowexpectmoreofaslowingininventoryaccumulationwilloffsettheexpectedfirminginfinalsales.Onbalance,wehavemarkeddownprojectedfourth-quarterGDPgrowthto2.1%from2.6%lastmonth.
• A rather sharp andbeneficial reversal offinancial conditions—higher stockprices,firmerhomeprices,a lowerdollar,and lowerpublicandprivateborrowingcosts—aswellas loweroilprices,comparedtolastmonth’sforecast,areexpectedtopersistinto2014andliftgrowththenbyroughly½percentagepoint,to3.2%,versus2.7%inlastmonth’sforecast.
• Thefastergrowthnextyearinthisforecast“pullsahead”somegrowthfrom2015and2016,reflectedinaslightdownwardrevisioninourforecastforthoseyearsto3.2%and3.4%,respectively.Recedingfiscaldrag,thewaningeffectsofincreasesinyields,andcontinuedimprovementincredittermsallcontribute to firming growth.
Failure of Congress to agree on a funding bill for the government resulted in a shutdown and furloughing of non-essentialpersonal.Weestimatethatatwo-weekshutdowntrimsfourth-quarterGDPgrowthrelativetothisforecastby0.2percentagepoint,butboostsfirst-quartergrowthby0.1to0.2percentagepoint.
Theunemploymentrateisexpectedtoedgelower,balancingmodest,butfirmingemploymentgainsandasteadylaborforceparticipationratethrough2016.
• We expect employment gains through year-end 2013 to average roughly 160,000, rising to 225thousandnextyear.Theunemploymentrateisprojectedtodeclineto6.7%and6.2%bythefourthquartersof2014and2015,respectively.
Coreconsumerpriceinflation(PCE)appearstohavebottomedat0.6%inthesecondquarter,lowerthanweexpected.WeprojectcorePCEinflationatjust1.2%over2013,risingto1.6%in2014,1.8%in2015,and2.0%in2016.
WeassumethattheFedwillendQE3inthesecondhalfof2014,andthattherewillbenofundsratehikesuntilthethirdquarterof2015.
• BythetimeQE3isdone,weexpecttheFedtohavepurchasedabout$1½trillionofassetsunderthisprogram.
• OurfundsrateviewisbroadlyconsistentwiththeFOMC’srateguidance,whichcallsfornoratehikesatleastaslongastheunemploymentrateremainsabove6½%.2

ZACKS INVESTMENT MANAGEMENT
2
The Outlook in FullFinancial conditions improved sharply following the Fed’s decision at its September meeting to forego the start to taper-ing. This partially reversed the sharp worsening in financial conditions since early May. This led us to revise up our fore-castofGDPgrowthfor2014,butdidnothelpenoughtoovercomeabitofweakeninginnear-termmomentum.Thebeneficialreversaloffinancialconditions—higherstockprices,firmerhomeprices,alowerdollar,andlowerpublicandprivateborrowingcosts—aswellasloweroilprices,comparedtolastmonth’sforecast,areexpectedtopersistinto2014andliftgrowththenbyroughly½percentagepoint,to3.2%,versus2.7%inlastmonth’sforecast.Thefastergrowthnextyearinthisforecast“pullsahead”somegrowthfrom2015and2016,reflectedinaslightdownwardrevisioninourforecastforthoseyearsto3.2%and3.4%,respectively.Recedingfiscaldrag,thewaningeffectsofincreasesinyields,andcontinuedimprovementincredittermsallcontributetofirminggrowthoverthenextcoupleofyears.
On the other hand, failure of Congress to agree on a funding bill for the government resulted in a shutdown and fur-loughingof roughly800,000non-essentialpersonal.This,ofcourse,onlyexacerbates theweakeningnear-termmo-mentum.Wehadestimatedthatatwo-weekshutdownwouldtrimfourth-quarterGDPgrowthrelativetothisforecastby0.3percentagepoint(pp),butfirst-quartergrowthwouldbehigherby0.3pp.Arulingthatsome400,000defensedepartmentworkerswere“essential”allowedthemtoreturntoworkthisweek,sharplyreducingthedirectimpactoftheshutdown.Asaresult,withtheshutdownnowapproachingthetwo-weekmark,wereducedourtrackingestimateoffourth-quarterGDPgrowthbytwo-tenths,to1.9%. Spillovers to the rest of the economy so far appear to be muted, but could build the longer the shutdown continues. Customsinspectorsaredeemedessentialandareonthejob,allowinggoodstomovethroughports.However,othergov-ernmentagencies(e.g.,ConsumerProductSafetyCommission,TheFoodandDrugAdministration,TheEnvironmentalProtectionAgency,FAA)thatnormallyneedtoissueapprovalsorreleasesforgoodstoentercommercearesignificantlyimpactedbytheshutdown,andanecdotalevidencesuggeststhatnormaltradeisbeingdisrupted.Rippleeffectswouldbeexpectedtobuildaswell,thelongertheshutdowncontinues. The900-poundGorillaintheroom,however,isthepotentialtoexhausttheso-called“extraordinarymeasures”(essen-tiallyborrowingfromvariousgovernmentretirementfunds)thathaveallowedthegovernmenttopayitsbillssincethedebt ceiling was hit this summer. Current estimates place this in the range of October 22 to November 1. While it is mathematically possible to meet payments on interest and principle, it is not clear this is feasible given systems currently inplace.Nevertheless,thecutsinspendingrequiredtoallowincomingtaxreceiptstobeprioritizedfordebtservicewould be so draconian that a sharp, brief recession would ensue, and, of course, the cuts would be highly disruptive to the economy through a myriad of microeconomic channels. Asimportantly,theapproachtoapotentialdefaulthadalreadybeguntorattlefinancialmarkets.Oneneedlooknofurtherthanthe300-pointrallyintheDJIndustrialsIndexonOctober10asnewsspreadthatapotentialdealwasin
Contributions to Q4/Q4 GDP Growth
2010 2011 2012 2013 2014 2015 2016
0
1
2
3
-1
Percentage point
PCE
Nonres. inv. Res. inv.
Change in inventories
Net exports Gov't. C&GI
Forecast published on October 2, 2013
Household Balance Sheet Improving
1991 1994 1997 2000 2003 2006 2009 2012 20150
10
20
30
40
50
60
70
80
90Trillions of dollars
Source: Federal Reserv e, Macroeconomic Adv isers; Forecast published on October 2, 2013
H F
Othernet w orth
Equitiesnet w orth
Real estatenet w orth
Totalnet w orth

Market Commentary
3
theworkstopermitasix-weekdelayinthepointwheretheTreasurywouldeffectivelyrunoutofcash.Wewillissuetworeportsnextweekontheadverseeconomiceffectsofthiscrisis-drivenapproachtofiscalpolicy.
Turningtothelesssensationalbutstillimportantissueofjusthowwastheeconomydoingbeforethesefiscalfolliescametooccupyourattention,incomingdataforthethirdquartersuggestedasomewhatweakerexpansionoffinalsales(1.8%vs.2.3%)andmoreinventorybuildingthaninlastmonth’sforecast,leavingourprojectionofGDPgrowthunchangedat1.8%.Asaresult,wenowexpectmoreofaslowingininventoryaccumulationinthefourthquartertodampslightlytheexpectedfirminginmanufacturingproduction.ThisisdespitesignsofstrengtheningmomentuminsomeindicatorssuchastheISM’s.Wehavealsoscaledbacksomewhattheexpectedfirminginfinalsales.Onbalance,wehavemarkeddownprojectedfourth-quarterGDPgrowthto2.1%from2.6%lastmonth.Asnotedabovethetwo-weekshutdown(assumingitdoesnotgomuchlonger)willlikelytrimthatto1.9%. Theargumentsforexpectinggrowthtofirmoverthenextcoupleofyearsremainprettymuchunchanged.WecontinuetoexpectthatwaningfiscaldragwillcontributetoagradualstrengtheningofGDPgrowthoverthenextfewquarters,as we move further beyond the hit to the level of government outlays and the rise in the levels of personal and payroll taxes.The tighteningoffinancial conditionsgenerally sinceMaydoesdelay the expectedfirming ingrowth, andasnotedabove,someofthattighteninghasbeenreversed.Thelesseningofdragfromrecentriseinthedollar(whichtendstobefrontloaded)willalsocontributetostrongergrowthafter2014.Tobesure,increasesininterestratessinceMayhaveweakenedtheoutlookforinterest-sensitivespendingforequipment,nonresidentialstructures,andhomesandareexpectedtoexertdragonGDPgrowthforsometime.However,thoseincreaseshavemerelypulledforwardintimetheincreaseswehavelongsinceexpected,soinaverybroadsense,theyhavemerelydelayedthefirminginGDPgrowthweexpectedwithoutfundamentallyalteringourexpectationthatgrowthwillindeedimproveovertime.
Growth of Personal Consumption Expenditures
1989 1991 1993 1995 1997 1999 2001 2003 2005 2007 2009 2011 2013 2015
0
4
8
12
16
-4
-8
-12
-16
4-quarter percent change
Durables
Nondurables
Services
Source: Bureau of Economic Analysis, Macroeconomic Adv isers, LLC; Forecast published on October 2, 2013
H F
Households Reducing Financial Obligations
1979 1982 1985 1988 1991 1994 1997 2000 2003 2006 2009 201214
15
16
17
18
19
20Percent
2.0
2.5
3.0
3.5
4.0
4.5
5.0Percent
* The ratio of debt-service pmts. to disposable personal income, where debt-service includes estimated req'd. pmts. on outstanding mortgage and consumer debt, plus auto lease pmts., rental pmts. on tenant-occupied property, homeowners' insurance and property tax pmts. ** Nonaccrual loans and loans past due 30 days or more and still accruing interest. Source: Federal Reserve Board; Last data plotted for Q1-2013 (financial obligation ratio) and Q2-2013 (consumer loan delinquency rate).
Household financial obligation ratio*
(left)
Consum er loandelinquency rate**
(right)
Home Prices Begin a Solid Recovery
1985 1988 1991 1994 1997 2000 2003 2006 2009 2012 2015
0
5
10
15
20
-5
-10
-15
-20
4-quarter percent change
0
5
10
15
20
-5
-10
-15
-20
Nom inal
Real
Source: FRB, Macroeconomic Adv isers, LLC; Forecast published on October 2, 2013.
H F
Housing Starts and Residential Investment
1987 1991 1995 1999 2003 2007 2011 2015400
600
800
1000
1200
1400
1600
1800
2000
2200SAAR, thous. units
0
10
20
30
40
50
-10
-20
-30
-40
4-quarter percent change
Private housing starts(left)
Residential investm ent(right)
Source: U.S. Bureau of the Census; U.S. Department of Commerce; Macroeconomic Adv isers, LLC; Forecast published on October 2, 2013.
H F
ZACKS INVESTMENT MANAGEMENT
4
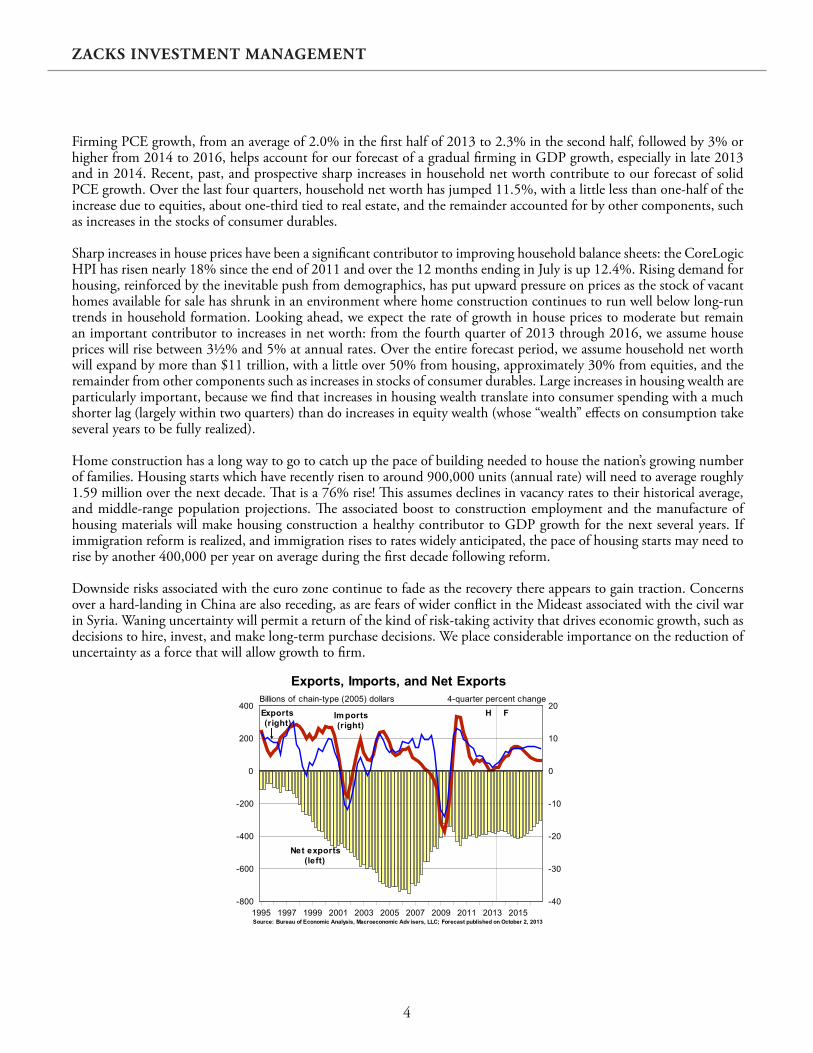
FirmingPCEgrowth,fromanaverageof2.0%inthefirsthalfof2013to2.3%inthesecondhalf,followedby3%orhigherfrom2014to2016,helpsaccountforourforecastofagradualfirminginGDPgrowth,especiallyinlate2013and in 2014. Recent, past, and prospective sharp increases in household net worth contribute to our forecast of solid PCEgrowth.Overthelastfourquarters,householdnetworthhasjumped11.5%,withalittlelessthanone-halfoftheincreaseduetoequities,aboutone-thirdtiedtorealestate,andtheremainderaccountedforbyothercomponents,suchas increases in the stocks of consumer durables. Sharp increases in house prices have been a significant contributor to improving household balance sheets: the CoreLogic HPIhasrisennearly18%sincetheendof2011andoverthe12monthsendinginJulyisup12.4%.Risingdemandforhousing, reinforced by the inevitable push from demographics, has put upward pressure on prices as the stock of vacant homes available for sale has shrunk in an environment where home construction continues to run well below long-run trendsinhouseholdformation.Lookingahead,weexpecttherateofgrowthinhousepricestomoderatebutremainanimportantcontributortoincreasesinnetworth:fromthefourthquarterof2013through2016,weassumehousepriceswillrisebetween3½%and5%atannualrates.Overtheentireforecastperiod,weassumehouseholdnetworthwillexpandbymorethan$11trillion,withalittleover50%fromhousing,approximately30%fromequities,andtheremainder from other components such as increases in stocks of consumer durables. Large increases in housing wealth are particularly important, because we find that increases in housing wealth translate into consumer spending with a much shorterlag(largelywithintwoquarters)thandoincreasesinequitywealth(whose“wealth”effectsonconsumptiontakeseveralyearstobefullyrealized). Homeconstructionhasalongwaytogotocatchupthepaceofbuildingneededtohousethenation’sgrowingnumberoffamilies.Housingstartswhichhaverecentlyrisentoaround900,000units(annualrate)willneedtoaverageroughly1.59millionoverthenextdecade.Thatisa76%rise!Thisassumesdeclinesinvacancyratestotheirhistoricalaverage,andmiddle-rangepopulationprojections.TheassociatedboosttoconstructionemploymentandthemanufactureofhousingmaterialswillmakehousingconstructionahealthycontributortoGDPgrowthforthenextseveralyears.Ifimmigrationreformisrealized,andimmigrationrisestorateswidelyanticipated,thepaceofhousingstartsmayneedtorise by another 400,000 per year on average during the first decade following reform. Downsiderisksassociatedwiththeeurozonecontinuetofadeastherecoverythereappearstogaintraction.Concernsoverahard-landinginChinaarealsoreceding,asarefearsofwiderconflictintheMideastassociatedwiththecivilwarin Syria. Waning uncertainty will permit a return of the kind of risk-taking activity that drives economic growth, such as decisions to hire, invest, and make long-term purchase decisions. We place considerable importance on the reduction of uncertainty as a force that will allow growth to firm.
Exports, Imports, and Net Exports
1995 1997 1999 2001 2003 2005 2007 2009 2011 2013 2015
0
200
400
-200
-400
-600
-800
Billions of chain-type (2005) dollars
0
10
20
-10
-20
-30
-40
4-quarter percent change
Net exports(left)
Im ports(right)
Exports(right)
Source: Bureau of Economic Analysis, Macroeconomic Adv isers, LLC; Forecast published on October 2, 2013
H F

Market Commentary
5
IMPROVED FINANCIAL CONDITIONS THIS ROUND LIFT GROWTH IN 2014-2015
Halfemptyorhalffull?While2%growth(ouraveragesincetheendoftherecession)isweak,onecan’thelpbutthinktheU.S.hasfaredreasonablywellconsideringthefiscaldrag(includingthebigtaxincreasesatthestartoftheyearasthepayrolltaxholidayexpiredandthehigh-incometaxrateswereincreased),wavesofuncertaintyoutofEuropeandelsewhere, the hangover of the massive hit to household wealth occasioned by the financial crisis and a host of other “forcesofrestraint.”Addtothatapartialgovernmentshutdownandthepossibilityofanencounterwiththefederaldebtceiling!Despitethesechallenges,GDPadvancedata2.5%annualrateinthesecondquarter,upfrom0.6%an-nualizedgrowthoverthepriortwoquarters,andisforecasttoincreaseata2.0%annualrateoverthesecondhalfofthisyear.Thenear-termresilienceisduelargelytosolidgainsinhomeandequityvalueslastyearandsofarthisyear.Thesedevelopments have bolstered consumer spending, even as real disposable income took a large hit this year from higher taxes.Following1.9%growthoverthefourquartersofthisyear,welookfor3.2%growthnextyearand3.3%growthaveragedover2015and2016.
ContributingtofirmingGDPgrowthisaquickeningpaceofconsumerspendinggrowth.Severalfactorsaccountfortheexpectedimprovementinconsumerspending.First,householdnetworth(nominal)isrisingstrongly.Afterrising9.2%lastyear,itisprojectedtorise10.9%thisyearand5½%nextyear,drivenmainlybygainsinhousepricesandeq-uityvalues.(Seenearbychart.)Ourmodelofconsumerspendingsuggestsalong-runmarginalpropensitytoconsumeofroughly$0.05perdollarofwealth.Thus,continuedstronggainsinrealwealthlendconsiderablesupporttoPCEgrowth. Second, consumer spending is and will continue to benefit from the release of pent-up demand in the auto sec-tor. Since taking a hit during the recession, the stock of consumer motor vehicles and parts remains below our estimate of the desired stock. This will contribute to rising light vehicle sales through the end of the short-term forecast.
Third, household debt relative to income is shrinking. Credit market debt as a share of disposable income has declined fromapre-recessionpeakof129%to104%asofthesecondquarterofthisyear.Thiswasaccomplishedthroughthesolid but temporary rise in the saving rate during the recession and in the immediate aftermath. The personal saving rate brieflyexceeded7%thenfellbacktoroughly5½%averagedover2012and4½%bythesecondquarterofthisyear.Tosomeextent,debtforgivenessalsocontributedtothedeclineinhouseholddebt,andofcourse,disposableincomehascontinuedtotrendhigher,reducingtherelativeburdenofanygivenamountofdebt.The“debtratio”hasreturnedtolevels seen in 2002, suggesting that household balance sheet deleveraging has come a long way. No one can say where this process will end, but we suspect it has nearly run its course. Where the debt ratio troughs in this cycle will depend inlargemeasureonhowquicklylendersofallsortseasecreditterms. Relatedly,theburdenofhouseholddebtisfalling.Asashareofdisposablepersonalincome,householdpaymentstoservicevarioustypesofdebtandforvariousothercommitments(e.g., leases, insurance,taxes)havedroppedsharplysincetheendoftherecession.Whilesomeofthedeclineinthisfinancialobligationsratioreflectsdeclinesindebtfromdebtforgiveness,somealsoreflectsthepaydownofdebt,record-lowinterestrates,andrisingemploymentandincome.
Growth of Nonresidential Fixed Investment
1991 1993 1995 1997 1999 2001 2003 2005 2007 2009 2011 2013 2015
0
10
20
30
40
-10
-20
-30
-40
4-quarter percent change
Com puters and intellectual property products
Non-com puter equipm ent
Structures
Source: Bureau of Economic Analysis, Macroeconomic Adv isers, LLC; Forecast published on October 2, 2013
H F
Commercial Real Estate: Not Tight, But Tightening
1988 1992 1996 2000 2004 2008 2012 20165.0
7.5
10.0
12.5
15.0
17.5
20.0Percent
2.0
2.4
2.8
3.2
3.6
4.0
4.4
National industrial availability rate
Source: CB Richard Ellis, last data plotted for Q2-2013; Macroeconomic Adv isers, LLC, Forecast published on October 2, 2013
H FNational office vacancy rate: m etropolitan areas
Nom inal nonresidential investm ent in structures as a % of nom inal GDP

ZACKS INVESTMENT MANAGEMENT
6
Fourth,delinquencyratesonconsumerloanshavedeclinedtoeffectivelyrecord-lowlevels.Thissuggeststheprospectofcontinuedeasingofcreditterms,increasedbankwillingnesstomakeconsumerloansandfurtherexpansionofconsumerdebt that will provide additional support to consumer spending. Finally,laborincomeisexpectedtobenefitfromaneventualfirmingofgrowthofpayrollemployment.Followinggainsthataveraged195thousandpermonthoverthefirsthalfofthisyear,payrollemploymentisexpectedtodeceleratetogainsaveraging144thousandduringthethirdquarterand159thousandduringthefourthquarter.ThisdecelerationcanbethoughtofasadelayedresponsetotheslowingofGDPgrowthlatelastyearandearlythisyear.AsGDPgrowthfirms,though,payrollgainsareexpectedtomoveup,averaging226thousandpermonthnextyearand235thousandpermonthin2015.TheassociatedimprovementingrowthoflaborincomewillprovideaboosttoPCE. The housing sector continues to power along, fueled by strong investor interest, a continued release of pent-up demand by current and potential home owners, modest loosening of mortgage credit terms, and renewed builder optimism. We lookforhousingstartsof920thousandthisyear,1,227thousandnextyear,1,549thousandin2015,and1,654thou-sandin2016—thetrendinstartsisfirming.Overthelastseveralyears,housingstartshadbeenhelddownbyelevatedvacancies, tight lending conditions, and declining home prices. These sources of drag are giving way to more favorable conditions, allowing housing starts to move up. Our analysis of the long-term prospects for housing, based upon a careful analysis of demographic trends and a return to normal vacancy, demolition, and conversion rates, suggests that the level ofhousingstartsduringthe2011–2020periodshouldaverageabout1.55millionunitsperyear.Giventhatwebuilthomesthroughthefirsthalfofthisyearatjustovera900thousandpace,housingstartsclearlyhavealongwaytorise,andtherewilllikelybesomeover-shootingofthe1.55millionpaceatsomepointoverthenextdecade. Keytoasustainedandstrongrecoveryistheupturninhomeprices.TheCoreLogichousepriceindexrose8.8%lastyear(DecembertoDecember).SimilarindexesfromFHFAandS&P/Case-Shillerrose5.7%and6.9%,respectively.Homepriceshaveacceleratedthisyear.TheCoreLogicindexincreasedthroughAugustata13.6%annualrate,whiletheFHFAandS&P/Case-ShillerindexesincreasedthroughJulyatannualratesof10.7%and15.1%,respectively.Weassumehousepriceswillcontinuetomovehigher,albeitatamarkedlyslowerrate.WelookfortheCoreLogicindextorise10.9%thisyear,4.7%over2014,3.6%in2015,and3.5%in2016. Falling/risinghomepricescreateavicious/virtuouscycle.Potentialbuyers,typicallyaskedtoputdown20%ormore,riskedseeingtheirequitywipedoutinayearortwowhenhomepricesweredecliningata10%to20%rate.Withhomepricesnowrisingfromexceptionallyaffordablelevels,buyersareenticedintothemarket,bothbecausepricesarelowandbecausetheyarerising!Risinghousingequitysupportsanincreaseindemandforhousingandleadstomorestrengthinhome sales, which supports additional increases in home prices and further stokes an improvement in demand. Sounds likeafamiliarstory.Theexpectationofrisingpricesreducestheusercostofowningahomeandbooststhedemandforhousing while also improving the environment in which decisions for mortgage finance are undertaken. This dynamic is a welcome development in a sector with plenty of room for recovery.
S&P 500 and 10-Year Treasury
Dec 31 2012 Feb 25 2013 Apr 22 2013 Jun 17 2013 Aug 12 20131400
1500
1600
1700
1800Index, 1941-43=10
1.0
1.5
2.0
2.5
3.0Percent
Source: WSJ, FRB, Hav er Analytics; Last data plotted for Oct. 2, 2013
S&P 500(left)
10-year Treasury note(right)
Sept. 18FOMC Meeting

Market Commentary
7
Thebroad,nominaldollarhasunexpectedlysoftenedoverthelastseveralweeks,suggestingmoresupportfromthetradesector in this month’s forecast than in last month’s forecast. From early September to early October, the broad, nominal, trade-weightedvalueofthedollardeclinedabout2¼%.Thiswasadecreasewehadnotanticipated.Thedollarinthismonth’sforecast,therefore,beginsroughly2%belowlastmonth’sforecast.Thisgappersistsandevenwidenssomewhatthroughouttheshort-termforecastandhelpstoexplainwhyweexpectmoreofacontributiontoGDPgrowthfromnetexportsin2014(three-tenthsmore),2015(one-tenthmore),and2016(two-tenthsmore)thaninlastmonth’sforecast.
Leavingasidethecomparisontolastmonth’sforecast,bothexportsandimportsareexpectedtoacceleratein2014.Afterrising2.4%lastyear,realexportsofgoodsandservicesareforecasttorise3.7%thisyearand7.0%in2014.Thisoccursasourtrade-weightedmeasureofforeignGDPgrowthrisesfrom2.2%lastyearto2.5%thisyearand3.0%nextyear.Realimportsofgoodsandservicesalsoacceleratefromgrowthof0.1%lastyearto3.0%thisyearand7.6%nextyear.Acceleratingimportsreflectfirmingdomesticdemand.WhilenetexportsareexpectedtoberoughlyneutralforGDPgrowththisyear(aftercontributingthree-tenthstogrowthlastyear),importsrisemorethanexports(inabsoluteterms)andrealnetexportsdeclineenoughnextyeartoshavethree-tenthsfromGDPgrowth.Afterthat,thebalanceturns,asrealexportsriseatanaverageannualrateof7.2%over2015and2016andrealimportsriseatanaverageannualrateof4.1%.Realnetexportsriseenoughtoaddtwo-tenthstoGDPgrowthin2015andfive-tenthsin2016.
Thepaceofinventory-buildingisexpectedtomoderatethisyearandnextbeforeturningupin2015and2016.Themoderationthisyearandnextreflectsacoupleoffactors.First,adecelerationoffinalsalesfrom2.5%lastyearto1.7%thisyearcontributestothemoderationinnonfarminventoryinvestmentthisyearandnext.Second,asfarmoutputrecoversfromlastyear’sdrought,farminventoriesbuildrapidlythisyear,proppinguptotalinventoryinvestment.Butin 2014, the pace of farm inventory investment drops markedly, contributing to the slowing in total inventory-building.
Broad, Nominal, Trade-Weighted Dollar
Dec 31 2012 Feb 25 2013 Apr 22 2013 Jun 17 2013 Aug 12 2013 Oct 7 201398
99
100
101
102
103
104Index (Jan 1997 = 100)
Source: Federal Reserv e Board of Gov ernors; Last data plotted for October 4, 2013
Sept. 18FOMC Meeting
1st Policy Rate Hike in 2015, but Long Rates Begin to Rise
1993 1995 1997 1999 2001 2003 2005 2007 2009 2011 2013 20150
2
4
6
8
10Percent
Conventional m ortgage rate
Fed funds rate
10-year T-note yield
Source: Federal Reserv e Board, Macroeconomic Adv isers, LLC; Forecast published on October 2, 2013
H F

ZACKS INVESTMENT MANAGEMENT
8
Beginningin2015,whenthedynamicinfarminventorieshaslargelyrunitscourse,totalinventoryinvestmentrisestoreflectfirminggrowthoffinalsales. Spendingonbusinessequipmentandintellectualpropertyproductscombined(EQ&IPP)isexpectedtomoderatethisyear,butthenfirmoverthebalanceoftheshort-termforecast.Following3.9%growthoverthefourquartersoflastyear,EQ&IPPisforecasttoslowtogrowof2.5%thisyear.Themoderationingrowthreflectsrisingborrowingcostsandfis-caluncertainty.In2014,growthofEQ&IPPfirmsto3.6%,asthepositiveeffectsoffirminggrowthofoutputoutweighthenegativeeffectsoftheexpirationofbonusexpensingprovisionsattheendofthisyear.For2015and2016,growthofEQ&IPPisforecasttoriseto4.6%and5.1%,respectively.Thisimprovementreflectscontinuedfirminggrowthofoutput,narrowingriskspreads,andtheabsenceofdragfromthespecialfactors(notedhere)holdingdowngrowththisyearandnext. Commercialrealestatemarketsareimprovingslowly,andstructuresinvestmentisresponding.ButbecauseofthesmallshareinGDP,structuresinvestmentisnotexpectedtocontributemuchtoGDPgrowthoverthenextfewyears.Com-mercialvacancyrates,bothofficeandindustrial,havebeentrendingdownsincemid-2010.Afterlanguishingnearcycli-cal lows from 2010 through early 2011, real spending on business structures has rebounded sharply. This is due at least in parttothetighteningofcommercialrealestatemarkets.Butitalsoreflectsthefrackingrevolutionthathasgivenrisetoboomingspendingonminingandexploration.Asthisprocesscontinues,andascommercialrealestatemarketscontinuetotighten,weexpectrealspendingonbusinessstructurestoriseatamoderaterate.Fromthesecondquarterofthisyeartotheendof2016,businessspendingonstructuresisforecasttoriseata2.3%averageannualrate,0.8percentagepointbelowtherateofgrowthofGDP.Givenarisingrelativepriceofbusinessstructures(relativetotheGDPpriceindex),thisjustoffsetstheslowerrealgrowthandkeepsnominalspendingonbusinessstructures,asashareofnominalGDP,roughlyunchangedat2¾%overtheshort-termforecast.
FISCAL POLICY: SHUTDOWN SIDESHOW, DEBT THREATThisforecastwascompletedbefore,andsodoesnotreflect,theshutdownofthefederalgovernmentthatbeganOcto-ber1andthatisnowinitssecondweek.Elsewherewehaveestimatedthatthedirecteffect(thelostvalueofservicesproducedby federalworkers,measuredby their compensation)of a two-week shutdown is to shave0.3percentagepointfromfourth-quarterGDPgrowth,andaddthesameamountbackinthefirstquarterofnext.However,arecentlegalrulingallowedtheDepartmentofDefensetoclassifyas“essential”almostallthe400,000civiliandefenseworkersfurloughed October 1, thereby reducing the direct impact of a two-week shutdown to about 0.2 percentage point of fourth-quartergrowth.Becausetheshutdownstartedearlyinthequarter,webelieveanyspilloverstotheprivatesectorwillbelargelyreversedwithinthequarter.Hence,unlessitlastslonger,theshutdownismoreanoverallinconveniencethan an economic catastrophe. Theforecastalsoassumesthedebtceilingisraisedwithoutincident.However,thefailureofCongressandtheAdminis-trationtoresolvetheirpoliticalimpassehasraisedthechancesthatthedebtceilingwillbecomebindingwithinthenextcoupleofweeks,constitutingapotentiallysignificantdownsiderisktotheforecast.OfcoursetheresultofexhaustingtheextraordinarymeasuresthatallowtheTreasurytocontinuetopaythegovernment’sbillsissocatastrophicwecanonlyassumetheprobabilityisreallyquitesmall.Theywon’treallyletthathappen,willthey? Thedragongrowthfromthatriskwouldnotnecessarilybeeliminatedbyalast-minutedealtoraisethedebtceiling.Anysuchdealmightbeshort-term,providingjustabriefrespitefromnear-termpolicyuncertainty.Furthermore,inAugustof 2011 much of the damage to financial markets occurred when rating agencies downgraded Treasury debt in the week afterthePresidentenactedtheBudgetControlAct—thelegislationthat,byliftingthedebtceiling,avertedtheimmedi-atecrisis.Wedonotexpectadebtdefault,butwedobelievethathittingthedebtceilingevenbrieflycouldcausethenextrecession.Inaforthcomingpieceslatedforpublicationnextweek,wedescribetwosuchscenarios. Apartfromtheshutdownandthethreatofdefault,thediminutionoffiscalrestraintwillprovidetheeconomyamuch-neededboostin2014.Thisyear(2013)hasbeenayearofconsiderablefiscaldrag.Therewerethreetaxincreases:(a)theexpirationofthePayrollTaxHoliday;(b)theimplementationofanew,highertopmarginalpersonaltaxrate;(c)andnewincomeandsocialinsurancetaxesassociatedwiththeAffordableCareAct.Togetherthesetaxhikesamounttoroughly$200billionatanannualrate.Inaddition,weestimatethatbythefourthquarterofthisyearthesequestrationwillhavereducedtheleveloffederalspendingbyabout$85billionrelativetothespendingcapssetundertheBudget

Market Commentary
9
ControlActof2011.Allthiswillsubtractbetween1¼and1½percentagepointsfromGDPgrowththisyear. IntheMAforecasttherearethreesourcesofnewfiscaldragin2014:(a)anadditionalbutmodest$12billioninspend-ingcutsalongtheramp-uptowardsthefull“runrate”ofthesequester;(b)theexpirationofextendedandemergencyunemploymentbenefits,theeffectofwhichissmallgiventhedwindlingnumbersreceivingthesebenefits;(c)andthewind-downofprovisionsofpreviousstimulus,themostimportantofwhichisthefinalexpirationof“bonusexpensing”.WeestimatethattheimpactwillbetoreduceGDPgrowthin2014bybetween¼and½percentagepoint.Hence,thediminutionoffiscaldragbetween2013and2014shouldboostGDPgrowthin2014byapproximately1percentagepoint. LARGER EMPLOYMENT GAINS IN THE FORECAST FOR 2014 AND 2015Relativetolastmonth’sforecast,werevisedupourforecastofemploymentgainsin2014and2015,butinmostrespects,forecasts of labor market conditions are broadly similar to last month. We continue to anticipate that nonfarm payroll employmentwillrisebyanaverageofabout160thousandpermonthfromSeptembertoDecember.Furthermore,weexpectthatasrealgrowthstrengthens,employmentgainswillimprovetoaverageabout225thousandin2014andap-proximately235thousandinboth2015and2016.Relativetolastmonth’spredictions,theaveragefor2014isabout35thousandhigher,theforecastfor2015isabout20thousandhigher,andtheforecastfor2016isabout10thousandlower. Wecontinuetoexpectthattheunemploymentratewilldriftdowngradually,from7.3%asofthelastpublishedfigure(inAugust)to6.7%asofthefourthquarterof2014,6.2%inthefourthquarterof2015,and5.7%inthefourthquarterof2016.Withlargeremploymentgainsintheforecast,theunemploymentratefallsslightlyfasterthanbefore.Intheforecast,itfallsto6.5%(animportantlevelformonetarypolicy)inthesecondquarterof2015,onequarterearlierthanin last month’s forecast.
Underlying our forecast for gradually increasing employment gains is a firming in productivity growth that is more grad-ualthantheincreaseinoutputgrowth,alongwithaveryslightincreaseintheaverageworkweek.Productivitygrowthinthenonfarmbusinesssectorisprojectedtorisefromabout1.0%inthesecondhalfof2013,to1.6%in2014,1.8%in2015,and1.9%in2016.Onaverage,productivitygrowthintheforecastisslightlylowerthanlastmonth.Weassumethattheaverageworkweekwilldriftupslightly,from32.4hoursinthethirdquarter,tojustroundupto32.6hoursinthefourthquarterof2016;thepathoftheworkweekissimilartobefore. Thelaborforceparticipationrateissubjecttocompetingforcesintheforecast.Structuralfactors,includingpopulation-aging, increasing educational involvement, and an increasing share of working-age adults receiving disability benefits, areexpectedtocontinuetoexertdownwardpressureontheparticipationrate.Intheforecast,theseforcesareroughlyoffsetbythereversaloftemporaryfactors—highunemploymentandrecordhighdurationofunemployment—thathave previously pushed down the participation rate. On balance, we assume that the participation rate will edge up from 63.2%inAugusttoaverage63.3%inthefourthquarter,remainateither63.2%or63.3%throughmid-2015,thenincreaseslightly,reaching63.5%inthesecondhalfof2016. HAS CORE INFLATION BOTTOMED OUT?ThesteadydeclineincorePCEinflationthatbeganlastyearappearstohaveended.Thetwelve-monthcorePCEinfla-tionrate,whichwasashighas2.0%earlylastyear,remainedatjust1.2%forfourofthelastfivemonths.Thisisbroadlyconsistentwiththetwelve-monthchangeinthemarket-basedcorePCEpriceindex—excludingimputedcomponentssuchas“financialservicesfurnishedwithoutpayment”—whichalsohasremainednearlyflatoverthepastfivemonths.Although12-monthchangeshavebeensteadyoflate,theannualizedthree-monthcorePCEinflationrateroseto1.7%inAugust,thehighestinayear.Thethree-monthmarket-basedcoreinflationratestandsat1.6%.
Signsthatcoreinflationmayhavebottomedoutareconsistentwithourmodel-basedforecastthatthetrendincoreinflationwillrisegradually.Elevatedslack(highunemployment)andastrengtheningdollar,whichcontributestosoftimportprices,bothcombinetorestraininflation,whilestableinflationexpectations(at2.0%)graduallypullinflationuptowardthatpace.Withdiminishingslackinourforecastandinflationexpectationsassumedtoremainanchoredat2%,weexpectthecorePCEpriceindextoriseata1.5%rateinthesecondhalfof2013,followedbysteadilylargerincreasesin2014,2015,and2016of1.6%,1.8%,and2.0%,respectively.

ZACKS INVESTMENT MANAGEMENT
1010
Afternochangeover2012(0.0%),nonpetroleumimportpricesareexpectedtoberestrainedin2013(declining1.0%)and2014(increasing0.5%)toreflectastrengtheningofthebroad,nominal,trade-weightedindexofthedollar.Thebroad,nominaldollarisprojectedtorise1.8%thisyearand2.4%in2014,followedbymuchsmallerchangesin2015(-0.1%)and2016(0.3%).Asgainsinthebroad,nominaldollarshrinksafter2014,nonpetroleumimportpricesareprojectedtostrengthen,withincreasesin2015and2016of2.0%and2.6%,respectively.
DELAY OF FED TAPER CONTRIBUTES TO IMPROVEMENT IN FINANCIAL CONDITIONS FinancialmarketscheeredtheFOMC’sannouncementonSeptember18thatitwoulddelaythestarttotaperingassetpurchases,withralliesinbothbondandequitymarkets.Onthatday,theS&P500rose1.2%to1,726andthe10-yearTreasuryyieldfell17basispointsto2.69%.Overthenextcoupleofweeks,broadstockindicesgavebacksomeoftheirprevious games, while on balance term Treasury yields eased a bit further. On the whole since the time of our previous forecast,theS&P500gained2.4%tocloseat1,695onOctober1,the10-yearyieldfell32basispointsto2.66%,theBaacorporatebondyieldfell6basispoints,theconventionalmortgageratefell¼percentagepoint,andthebroad,nominaltrade-weightedindexofthedollardeclined1.7%.3ImprovementsinfinancialconditionswerenotlimitedsolelytotheUS:avarietyofbenchmarkforeignequityindicesalsopostedgainsbetweenSeptember5andOctober1,fromapproximately1½%tomorethan4%. TheFed’sannouncementwasamajorfactorintherecentimprovementinfinancialconditions,butitwasnottheonlyfactor. Most of the recent decline in the broad, nominal dollar occurred prior to the FOMC’s announcement, as it fell from103.3onSeptember5to101.7asofSeptember16,beforeeasingabitfurtherto101.4asofSeptember27(themostrecentavailableatthetimeofthisforecast).Signsthatforeigneconomiesareimproving,includinganimprovedoutlookfornear-termGDPgrowthintheeurozone,contributedtotherecentsofteninginthebroad,nominaldollarfollowingitsearlierrun-up.Inaddition,bothdomesticandoverseasequityindiceshadbeenclimbingevenbeforetheFed’sannouncement.Infact,theS&P500roseabout3.0%betweenSeptember5andSeptember17,thedaybeforetheFed’s announcement. The recent improvement in financial conditions contributed importantly to downward revisions to forecast assumptions forTreasuryyields,privatelong-terminterestrates,andthebroad,nominaldollar;andinanupwardlyrevisedassump-tionforequitywealth.Relativetoourpreviousforecast,the10-yearTreasuryyieldisonaverage37basispointslower,theBaacorporatebondyieldis25basispointslower,andtheconventionalmortgagerateis44basispointslower.(Com-parisonsareforforecaststhrough2016.)Someofthesereductions,particularlyafterthefirstfewquartersoftheforecast,stem from our analysis pointing to slower underlying trend growth, which implies lower long-run targets for real interest rates.Inthismonth’sforecast,weloweredourlong-runtargetfortherealfundsrateto2%from2¼%,andweloweredour long-run forecasts for long-term yields by similar amounts. We also lowered the path of the broad, nominal dollar in theforecasttoreflectitsrecentsoftening:onaverage,itisabout2.3%lowerthaninlastmonth’sforecast.
Core PCE Inflation: Alternative Horizons
2007 2008 2009 2010 2011 2012 2013
0
1
2
3
4
-1
Annualized % chg.
0
1
2
3
4
-1
Source: Bureau of Economic Analysis; Last data plotted for August 2013.
12-m onth 3-m onth
6-m onth

Market Commentary
11
BasedonbroadstockindicessuchastheWilshire5000,weestimatethathouseholdequitywealthroseabout6¾%overthethirdquarter(about$1.6trillion),extendingtherecoveryinequitywealththatbeganin2009.Weestimatethatasoftheendofthethirdquarter,householdequitywealthwasabout12%higherthanatthepreviouspeak,inthethirdquarterof2007.Weestimatethatthethird-quartergaininequitywealthwasabout$1trillionlargerthananticipatedinourSeptember6baseforecast,implyingconsiderablylargerwealtheffectsthatboostconsumptiongoingforward.Largerwealtheffectswerereinforcedbyrecentdeclinesinenergyprices,andbylargegainsinhouseprices.Weestimatethatoverallhouseholdnetworthrose$2.5trillionduringthethirdquarter,withabout$0.8trillionofthataccountedforbyhousingwealth.Lookingahead,weexpectoverallhouseholdnetworthtorisesome$9trillionfromtheendofthethirdquartertotheendof2016,withmorethanone-halffromhousing,aboutone-fourthfromequities,andtheremainderfromconsumerdurablesandothernetworth.Thecumulativechangeinnetworthovertheforecasthorizonisaboutthesameasinlastmonth’sforecast,butbecausethejump-offattheendofthethirdquarterishigher,theentirepath of net worth is higher than before. MONETARY POLICY: HIGHLY ACCOMMODATIVE
WeassumethattheFedwillextenditsongoingasset-purchaseprogram(QE3)untilthesecondhalfof2014,whentheunemploymentratewillbecloseto7%.BythetimeQE3isdone,weexpecttheFedtohavepurchasedabout$1½tril-lion of assets under this program. Weanticipatenofundsratehikesuntilthethirdquarterof2015.OurfundsrateviewisbroadlyconsistentwiththeFOMC’srateguidance,whichcallsfornoratehikesatleastaslongastheunemploymentrateremainsabove6½%.Inourforecast,theunemploymentratereaches6½%—thethresholdembeddedintherateguidance—closetothemiddleof2015,whenweexpectcorePCEinflationtoberunningaround1.8%.
1Unlessotherwisenoted,allquarterlygrowthratesareexpressedascompoundannualrates,allexpenditurecomponentsofGDParechained2005dollars,andallannualgrowthratesarestatedasfourth-quarteroverfourth-quarter.
2 TheFederalOpenMarketCommittee(FOMC)istheFed’smainpolicy-makingbodycomprisedofthesevengovernorsoftheFederalReserveandpresidentsof8ofthe12FederalDistrictbanksonarotatingbasis.
3 ChangesaremeasuredbasedonfinancialdatafromSeptember5andOctober1,representingclosingvaluesthatwereavailableatthetimeofourpreviousforecastand the one covered by this report.

Market Commentary
12121212
About Zacks Investment Management ZacksInvestmentManagement,awealthmanagementboutique,isaleadingexpertonearningsandusingearningsestimatesintheinvestmentprocess.Weareawhollyownedsubsidiaryofourparentcompany,ZacksInvestmentResearch,oneofthelargestprovidersofindependentresearchintheU.S.Wearecommittedtoprovidingcomprehensivepersonalizedwealthmanagementsolutionstoallofourclientsthroughtheuseofequityandfixedincomeportfolios.ClientportfoliosaremanagedusingauniquecombinationofZacksindependentresearchandZacksquantitativemodelsthathaveprovenyearafteryeartodeliversuperiorresults.Throughourpersonalizedinvestmentprocessweprovideallclientswiththelevelofcustomizationandpersonalizationthattheydesire.
Learn More About Our ProgramContactustodaytolearnmoreaboutZacksInvestmentManagement.800-245-2934 Disclaimer:Thisarticleisprovidedforinformationalpurposesonlyanddoesnotconstitutelegalortaxadvice.ZacksInvestmentManage-ment,Inc.isnotengagedinrenderinglegal,tax,accountingorotherprofessionalservices.Publicationanddistributionofthisarticleisnotintendedtocreate,andtheinformationcontainedhereindoesnotconstitute,anattorney-clientrelationship.Donot act or rely upon the information and advice given in this publication without seeking the services of competent and pro-fessionallegal,tax,oraccountingcounsel.TheoriginalcontentofthisdocumentwasmodifiedtomoreaccuratelyreflecttheexpectationsofZacksInvestmentManagement.
History2013.2 2013.3 2013.4 2014.1 2014.2 2014.3 2014.4 2012 2013 2014 2015 2016
Real GDP & Components % change annual rateGDP 2.5 1.8 2.1 2.8 3.2 3.3 3.3 2.0 1.9 3.2 3.2 3.4Personal Consumption Expenditures 1.8 1.5 3.0 2.8 3.4 3.5 3.4 2.0 2.1 3.3 2.9 2.9Business Fixed Investment 4.7 2.5 3.4 2.4 2.9 4.0 4.2 5.0 1.4 3.4 3.9 4.6Real Activity quarterly averages, unless notedPrivate Housing Starts (thous units) 869 901 954 1074 1172 1275 1388 783 920 1227 1549 1654Light Vehicle Sales (mil units) 15.5 15.7 15.8 15.8 16.1 16.4 16.6 14.4 15.5 16.2 16.7 16.7Industrial Production (% ch, a.r.) 0.7 1.9 2.1 -0.7 3.6 4.6 4.8 2.8 2.2 3.1 4.7 4.7Manuf. Capacity Util. (%) 76.0 76.0 76.0 76.1 76.5 76.9 77.4 75.8 76.1 76.7 78.5 79.8Unemployment Rate (%) 7.5 7.3 7.3 7.2 7.0 6.9 6.7 8.1 7.5 6.9 6.4 5.9Prices, Productivity, & Costs % change annual rate, unless notedCPI (all urban) 0.0 2.7 1.4 1.5 1.4 1.5 1.6 1.9 1.4 1.5 1.8 2.0Core CPI (all urban) 1.4 1.8 1.7 1.6 1.7 1.8 1.9 1.9 1.7 1.8 2.0 2.2PPI (finished goods) -1.2 3.9 0.5 -0.3 0.0 0.3 0.5 1.7 0.9 0.1 0.8 1.3Compensation Per Hour 2.3 1.3 1.6 2.4 3.0 2.9 3.2 5.3 0.0 2.9 3.2 3.4Output Per Hour 1.8 0.8 1.1 1.4 1.7 1.6 1.7 0.9 0.5 1.6 1.8 1.9Price of WTI Crude Oil ($/barrel) 94.2 106.1 103.2 100.1 97.1 94.8 92.9 94.2 99.5 96.2 89.0 85.0Selected Interest Rates quarterly average (%)Federal Funds Rate 0.12 0.15 0.15 0.15 0.15 0.16 0.18 0.14 0.14 0.16 0.34 1.7310-Year Treasury Bond Yield 2.00 2.69 2.65 2.70 2.72 2.80 2.91 1.80 2.32 2.78 3.31 4.05Baa Corporate Bond Yield 4.84 5.40 5.35 5.38 5.35 5.43 5.52 4.93 5.10 5.42 5.81 6.29Incomes & Related Measures % change annual rate, unless notedCorporate Profits 13.9 -4.1 -4.2 2.7 4.2 4.4 4.9 2.7 -0.2 4.1 5.3 7.4HH Net Worth, Equities (qrtrly rate) 1.6 6.7 1.8 3.3 1.9 1.5 1.1 13.9 20.4 8.0 0.0 -0.8Federal Surplus (FY, Uni, bils $) 363 -357 -861 -1011 -443 -651 -715 -1089 -599 -741 -620 -551
Source: Macroeconomic Advisers, LLCSM
annual avg.
q4/q4
q4/q4
annual avg.
q4/q4