november 2016 manhattan beach real estate market trends update
TRANSCRIPT

Table of
Contents
Key Statistics for November
Sales 2016 Residential Sales Stats Year-to-Year Total Sales by Map Area Median 2016 Median Sales Stats Year-to-Year Median Sales by Map Area Listings 2016 Active Listings by Map Area 2016 Total Active Listings vs. Total Sales Year-to-Year Active Listings by Map Area Inventory 2016 Months of Inventory by Map Area Year-to-Year Months of Inventory
Summary
About Hady Chahine Contact Information

Key Statistics for November
Back to Table of Contents
= trending positive = trending positive
= trending negative = trending negative
Month-to-Month Comparison Oct 2016 Nov 2016 Delta (qty) Delta (%) Increase Decrease
Total Sales 41 33 -8 -19.5%
Median Sales Price 2,250,000 1,900,000 (350,000) -15.6%
Median Days to Sell 21 34 13 61.9%
Listings 121 109 -12 -9.9%
Sales/Listing Ratio 33.9% 30.3% -0.036 -10.6%
Months of Inventory 3.0 3.0 0.0 0.0%
Monthly Comparison Year-to-Year Nov 2015 Nov 2016 Delta Delta Increase Decrease
Total Sales 23 33 10 43.5%
Median Sales Price 2,325,000 1,900,000 (425,000) -18.3%
Median Days to Sell 39 34 -5 -12.8%
Listings 89 109 20 22.5%
Months of Inventory 4.0 3.0 -1 -25.0%

Back to Table of Contents
Total Sales Month-to-Month by Map Area Sep Oct Nov
Manhattan Bch Sand 8 9 6
Manhattan Bch Tree 12 14 3
Manhattan Bch Hill 1 4 5
Manhattan Village - - 5
Manhattan Bch Heights/Lib Vlg 7 8 1
Manhattan Bch Mira Costa 10 6 13
Total Sales 38 41 33
-
5
10
15
20
25
30
35
40
45
Sep Oct Nov
2016 Total Sales Month-to-Month by Map Area
Manhattan Bch Sand
Manhattan Bch Tree
Manhattan Bch Hill
Manhattan Village
Manhattan Bch Heights/Lib Vlg
Manhattan Bch Mira Costa
Total Sales

Back to Table of Contents
Total Sales Year-to-Year by Map Area 2014 2015 2016
Manhattan Bch Sand 13 5 6
Manhattan Bch Tree 4 8 3
Manhattan Bch Hill 3 - 5
Manhattan Village 4 1 5
Manhattan Bch Heights/Lib Vlg 3 2 1
Manhattan Bch Mira Costa 8 7 13
Total Sales 35 23 33
-
5
10
15
20
25
30
35
2014 2015 2016
Total Sales Year-to-Year by Map Area: November
Manhattan Bch Sand
Manhattan Bch Tree
Manhattan Bch Hill
Manhattan Village
Manhattan Bch Heights/Lib Vlg
Manhattan Bch Mira Costa
Total Sales
Back to Table of Contents
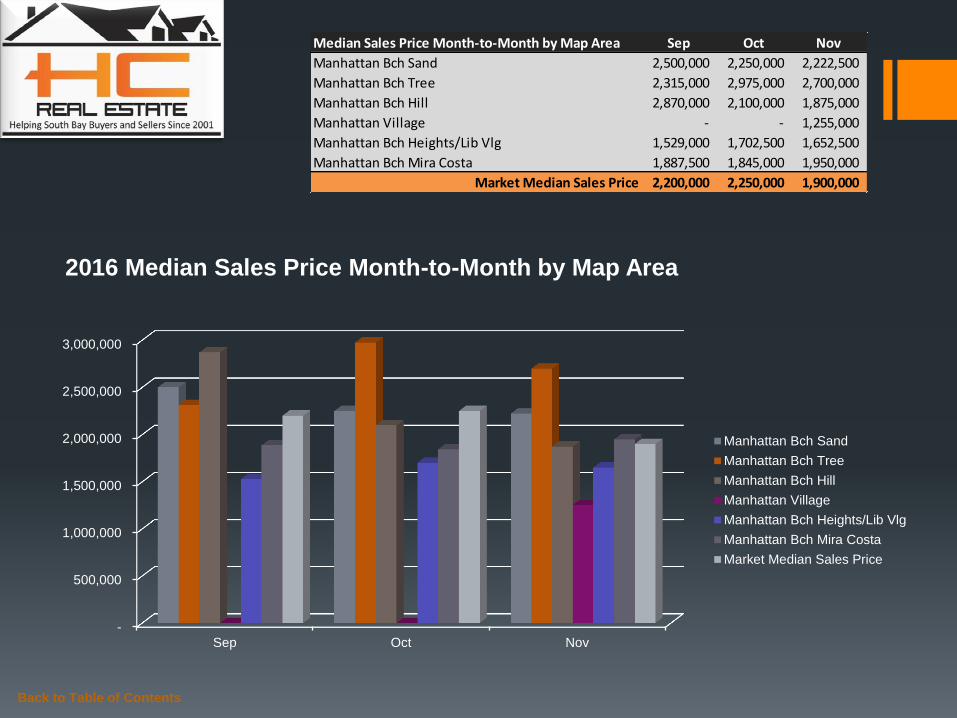
Median Sales Price Month-to-Month by Map Area Sep Oct Nov
Manhattan Bch Sand 2,500,000 2,250,000 2,222,500
Manhattan Bch Tree 2,315,000 2,975,000 2,700,000
Manhattan Bch Hill 2,870,000 2,100,000 1,875,000
Manhattan Village - - 1,255,000
Manhattan Bch Heights/Lib Vlg 1,529,000 1,702,500 1,652,500
Manhattan Bch Mira Costa 1,887,500 1,845,000 1,950,000
Market Median Sales Price 2,200,000 2,250,000 1,900,000
-
500,000
1,000,000
1,500,000
2,000,000
2,500,000
3,000,000
Sep Oct Nov
2016 Median Sales Price Month-to-Month by Map Area
Manhattan Bch Sand
Manhattan Bch Tree
Manhattan Bch Hill
Manhattan Village
Manhattan Bch Heights/Lib Vlg
Manhattan Bch Mira Costa
Market Median Sales Price

Back to Table of Contents
Median Sales Price Year-to-Year by Map Area 2014 2015 2016
Manhattan Bch Sand 2,850,000 3,450,000 2,222,500
Manhattan Bch Tree 1,597,500 2,031,250 2,700,000
Manhattan Bch Hill 4,088,980 - 1,875,000
Manhattan Village 1,127,500 1,150,000 1,255,000
Manhattan Bch Heights/Lib Vlg 1,250,000 1,163,500 1,652,500
Manhattan Bch Mira Costa 1,900,000 2,550,000 1,950,000
Market Median Sales Price 2,200,000 2,325,000 1,900,000
-
500,000
1,000,000
1,500,000
2,000,000
2,500,000
3,000,000
3,500,000
4,000,000
4,500,000
2014 2015 2016
Median Sales Price Year-to-Year by Map Area: November
Manhattan Bch Sand
Manhattan Bch Tree
Manhattan Bch Hill
Manhattan Village
Manhattan Bch Heights/Lib Vlg
Manhattan Bch Mira Costa
Market Median Sales Price
Back to Table of Contents
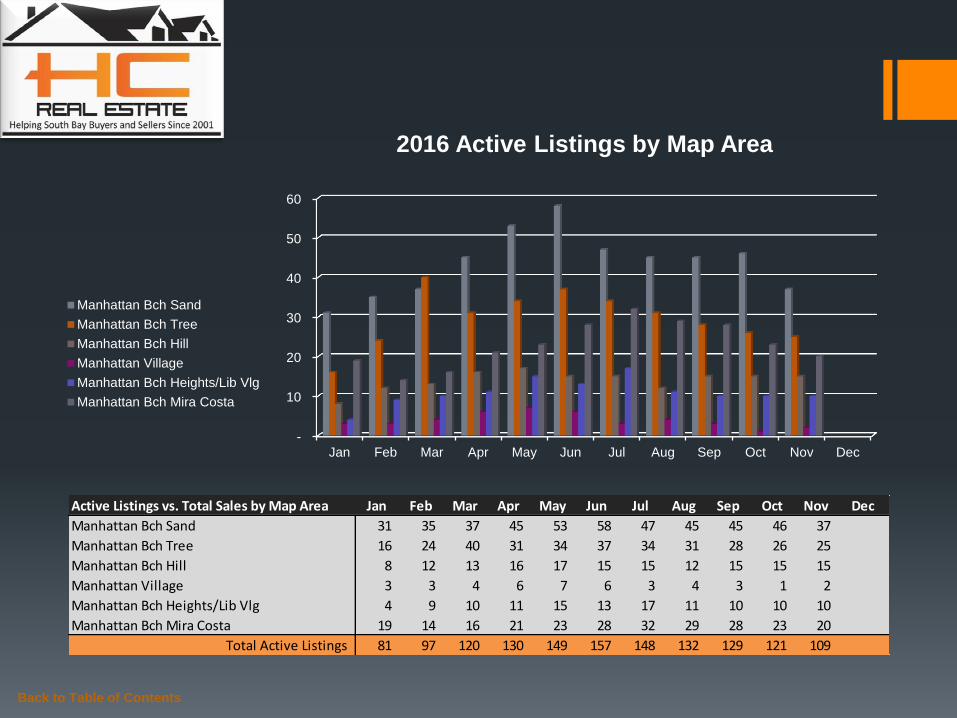
Active Listings vs. Total Sales by Map Area Jan Feb Mar Apr May Jun Jul Aug Sep Oct Nov Dec
Manhattan Bch Sand 31 35 37 45 53 58 47 45 45 46 37
Manhattan Bch Tree 16 24 40 31 34 37 34 31 28 26 25
Manhattan Bch Hill 8 12 13 16 17 15 15 12 15 15 15
Manhattan Village 3 3 4 6 7 6 3 4 3 1 2
Manhattan Bch Heights/Lib Vlg 4 9 10 11 15 13 17 11 10 10 10
Manhattan Bch Mira Costa 19 14 16 21 23 28 32 29 28 23 20
Total Active Listings 81 97 120 130 149 157 148 132 129 121 109
-
10
20
30
40
50
60
Jan Feb Mar Apr May Jun Jul Aug Sep Oct Nov Dec
2016 Active Listings by Map Area
Manhattan Bch Sand
Manhattan Bch Tree
Manhattan Bch Hill
Manhattan Village
Manhattan Bch Heights/Lib Vlg
Manhattan Bch Mira Costa
Back to Table of Contents
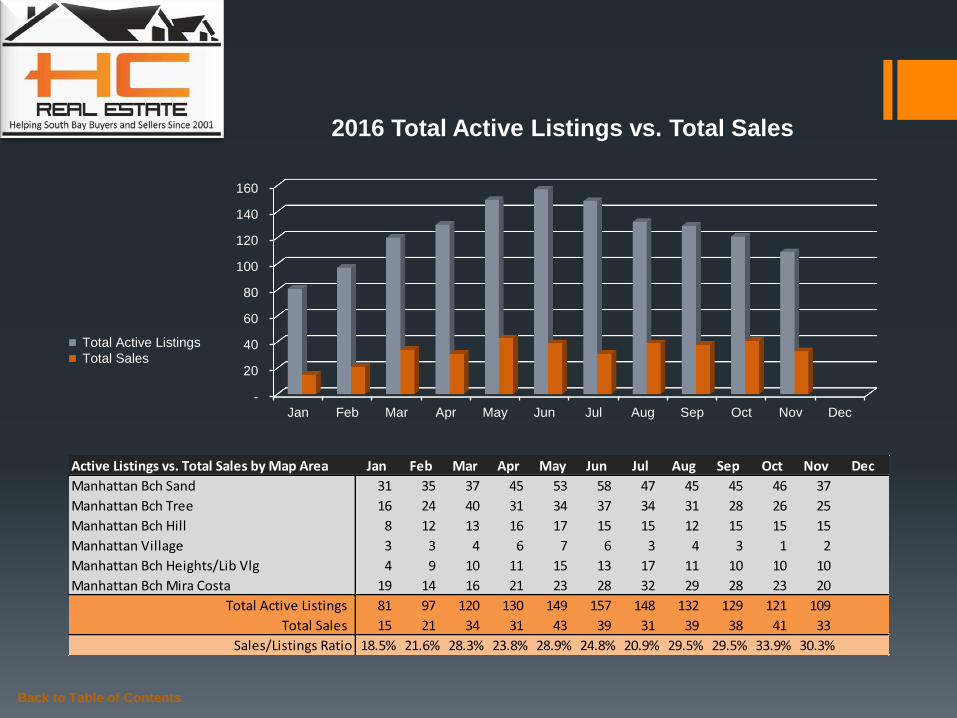
Active Listings vs. Total Sales by Map Area Jan Feb Mar Apr May Jun Jul Aug Sep Oct Nov Dec
Manhattan Bch Sand 31 35 37 45 53 58 47 45 45 46 37
Manhattan Bch Tree 16 24 40 31 34 37 34 31 28 26 25
Manhattan Bch Hill 8 12 13 16 17 15 15 12 15 15 15
Manhattan Village 3 3 4 6 7 6 3 4 3 1 2
Manhattan Bch Heights/Lib Vlg 4 9 10 11 15 13 17 11 10 10 10
Manhattan Bch Mira Costa 19 14 16 21 23 28 32 29 28 23 20
Total Active Listings 81 97 120 130 149 157 148 132 129 121 109
Total Sales 15 21 34 31 43 39 31 39 38 41 33
Sales/Listings Ratio 18.5% 21.6% 28.3% 23.8% 28.9% 24.8% 20.9% 29.5% 29.5% 33.9% 30.3%
-
20
40
60
80
100
120
140
160
Jan Feb Mar Apr May Jun Jul Aug Sep Oct Nov Dec
2016 Total Active Listings vs. Total Sales
Total Active Listings
Total Sales

Back to Table of Contents
Active Listings Year-to-Year by Map Area 2014 2015 2016
Manhattan Bch Sand 19 35 37
Manhattan Bch Tree 9 18 25
Manhattan Bch Hill 5 8 15
Manhattan Village 9 2 2
Manhattan Bch Heights/Lib Vlg 5 4 10
Manhattan Bch Mira Costa 11 22 20
Total Active Listings 58 89 109
-
20
40
60
80
100
120
2014 2015 2016
Active Listings Year-to-Year by Map Area: November
Manhattan Bch Sand
Manhattan Bch Tree
Manhattan Bch Hill
Manhattan Village
Manhattan Bch Heights/Lib Vlg
Manhattan Bch Mira Costa
Total Active Listings

Back to Table of Contents
Months of Inventory by Map Area Jan Feb Mar Apr May Jun Jul Aug Sep Oct Nov Dec
Manhattan Bch Sand 31.0 5.0 4.0 11.0 4.0 8.0 5.0 3.0 6.0 5.0 6.0
Manhattan Bch Tree 2.0 8.0 5.0 2.0 2.0 3.0 4.0 3.0 2.0 2.0 8.0
Manhattan Bch Hill - 6.0 2.0 16.0 4.0 8.0 15.0 3.0 15.0 4.0 3.0
Manhattan Village 3.0 3.0 2.0 2.0 4.0 6.0 2.0 - - - -
Manhattan Bch Heights/Lib Vlg 2.0 3.0 10.0 4.0 4.0 2.0 6.0 4.0 1.0 1.0 10.0
Manhattan Bch Mira Costa 5.0 3.0 2.0 5.0 5.0 4.0 4.0 3.0 3.0 4.0 2.0
-
5.0
10.0
15.0
20.0
25.0
30.0
35.0
Jan Feb Mar Apr May Jun Jul Aug Sep Oct Nov Dec
2016 Months of Inventory by Map Area
Manhattan Bch Sand
Manhattan Bch Tree
Manhattan Bch Hill
Manhattan Village
Manhattan Bch Heights/Lib Vlg
Manhattan Bch Mira Costa

Back to Table of Contents
Months of Inventory Year-to-Year Jan Feb Mar Apr May Jun Jul Aug Sep Oct Nov Dec
2014 4.0 3.0 3.0 2.0 2.0 2.0 3.0 2.0 3.0 2.0 2.0 1.0
2015 3.0 3.0 2.0 2.0 2.0 3.0 3.0 3.0 3.0 3.0 4.0 3.0
2016 5.0 5.0 4.0 4.0 3.0 4.0 5.0 3.0 3.0 3.0 3.0
-
0.5
1.0
1.5
2.0
2.5
3.0
3.5
4.0
4.5
5.0
Jan Feb Mar Apr May Jun Jul Aug Sep Oct Nov Dec
Months of Inventory Year-to-Year
2014
2015
2016
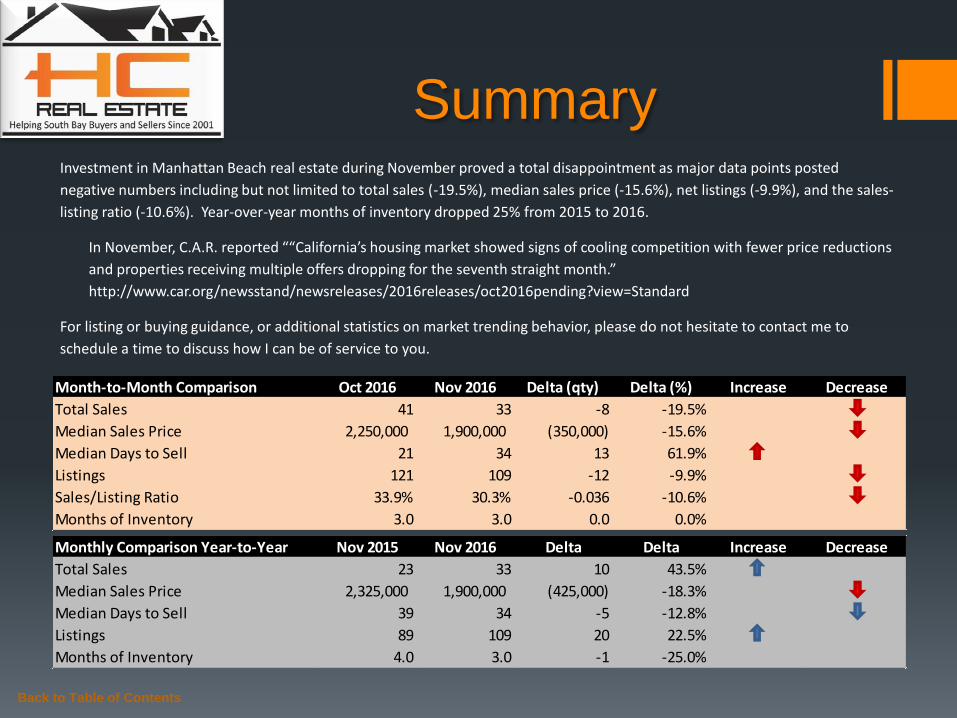
Summary Investment in Manhattan Beach real estate during November proved a total disappointment as major data points posted
negative numbers including but not limited to total sales (-19.5%), median sales price (-15.6%), net listings (-9.9%), and the sales-
listing ratio (-10.6%). Year-over-year months of inventory dropped 25% from 2015 to 2016.
In November, C.A.R. reported ““California’s housing market showed signs of cooling competition with fewer price reductions
and properties receiving multiple offers dropping for the seventh straight month.”
http://www.car.org/newsstand/newsreleases/2016releases/oct2016pending?view=Standard
For listing or buying guidance, or additional statistics on market trending behavior, please do not hesitate to contact me to
schedule a time to discuss how I can be of service to you.
Back to Table of Contents
Monthly Comparison Year-to-Year Nov 2015 Nov 2016 Delta Delta Increase Decrease
Total Sales 23 33 10 43.5%
Median Sales Price 2,325,000 1,900,000 (425,000) -18.3%
Median Days to Sell 39 34 -5 -12.8%
Listings 89 109 20 22.5%
Months of Inventory 4.0 3.0 -1 -25.0%
Month-to-Month Comparison Oct 2016 Nov 2016 Delta (qty) Delta (%) Increase Decrease
Total Sales 41 33 -8 -19.5%
Median Sales Price 2,250,000 1,900,000 (350,000) -15.6%
Median Days to Sell 21 34 13 61.9%
Listings 121 109 -12 -9.9%
Sales/Listing Ratio 33.9% 30.3% -0.036 -10.6%
Months of Inventory 3.0 3.0 0.0 0.0%

Serving South Bay Home Buyers and Sellers Since 2001
RE/MAX Top 4 Team in California – 2012
RE/MAX 100% Club - 2011
Shorewood Realtors Top 5% in Overall Sales 2001-2006, 2008-2010
Back to Table of Contents
About
Hady Chahine…
The information being provided by CARETS (CLAW, CRISNet MLS, DAMLS, CRMLS, i-Tech MLS, and/or VCRDS) is for the visitor’s personal, non-commercial use and may not be used for
any purpose other than to identify prospective properties visitor may be interested in purchasing. Any information relating to a property referenced on this web site comes from the Internet
Data Exchange (IDX) program of CARETS. This web site may reference real estate listing(s) held by a brokerage firm other than the broker and/or agent who owns this web site. The accuracy
of all information, regardless of source, including but not limited to square footages and lot sizes, is deemed reliable but not guaranteed and should be personally verified through personal
inspection by and/or with the appropriate professionals.
Back to Table of Contents
Listings MLS BLOG Website
Hady Chahine
• 310-404-5361