november 2015 - idbi mutual factsheet final web version... · 17 consecutive months of inflows in...
TRANSCRIPT

Dear Friends,
India has been identified as the ‘fastest growing economy’ of the world, and for good reason. The International Monetary Fund (IMF) has held a view that the Indian economy will be placed at the top among the major world economies with a growth rate of 7.7 per cent. This means that for the foreseeable future, international opinion is firmly in favour of India. This
augurs well for funds flowing to our capital market.
Equity investments by mutual funds in the month of October 2015 were low; however, mutual funds remained net buyers and invested Rs. 2,935.40 crore in the Indian equity markets. Data released by Bloomberg indicates that the Indian market is valued at 15.8 times projected 12-month earnings compared with 11.5 for an index of other developing nations. Domestic funds have witnessed 17 consecutive months of inflows in 2015 from investors, which has never happened before. All of these figures are indicative of the relative strength of the
Indian markets.
We hold the view that investors must stay invested in the Indian economy over the longer horizon; and to do so, one of the best routes is mutual funds.
Mutual Fund investors need to be aware of the changes in the ‘know your customer’ (KYC) process. All mutual fund investors, including existing investors and joint holders, must be KYC compliant while investing with any SEBI registered Mutual Fund, irrespective of the amount of investment. Investors can visit the website www.cvlkra.com to check their KYC status. Financial transactions viz. purchase/switch of units etc. will be processed only if the investor’s KYC is registered/verified. We strongly recommend all our Investors to check the status of their KYC compliance at the earliest so they can continue to invest with us smoothly.
Sincerely,
S N Baheti (DIN: 00136476) M.D. and Chief Executive Officer
April 2015November 2015
Equity Market OverviewThe month of October was a relatively better month for the Indian equity markets. The Nifty and the Sensex rose by 1.5% and 1.9% respectively to end the month at 8065 and 26656. Some encouraging macroeconomic data on the domestic front as well as declining worries on global growth, contributed to the rise. The rate cut in China that happened towards the end of the month also helped improved global sentiments. On the political front, the Bihar elections commenced during the month, and are expected to be keenly watched by the markets.
Within sectors, consumer durables saw the highest rise at 9.8% followed by metals at 6.9%, while communication technology was the biggest laggard at -2.2% followed by realty at -1.8%. FIIs were net buyers in equity to the tune of $1 bn during the month.
The IIP for the month of August positively surprised the market with a 6.4% print, with improvement seen across all segments like manufacturing, electricity, capital goods, consumer durables and mining. The WPI inflation number for September too continued to remain in negative territory at -4.54% versus -4.95% in the previous month. The September month CPI however saw a slight uptick at 4.4% versus 3.7% on account of higher prices of vegetables and pulses. However, with the Rabi crop expected to hit the market in the coming month, we expect vegetable prices to soften.
The INR remained largely flat during the month and saw a slight appreciation of 0.5% to end at 65.27 versus the US$. The narrowing of trade deficit in September to $10.5bn versus $12.5bn in the previous month, supported the INR. The decline was mainly supported by a reduction in gold imports. Brent Oil saw a modest uptick of ~1% on the back of slightly better global sentiments while gold rose by a sharp 2.4% during the month.
Source: Bloomberg
7948.9
8177.4 8107.9
8251.7
8171.2
8065.8
7750 7800 7850 7900 7950 8000 8050 8100 8150 8200 8250 8300
30-Sep 7 -Oct 1 4-Oct 2 1-Oct 28-Oct

2
Fixed Income Overview
Source: Bloomberg Source: Bloomberg
The content of the articles in Equity Market Overview & Fixed Income Overview represent the opinions of our Fund Management/Research team. Nothing contained herein is intended as investment advice or recommendations for specific investment decisions, and you should not rely on it as such. Information and analysis above are derived from various sources and using methods believed to be reliable, but we do not assume responsibility and liability for any consequence of the investment decision taken by you based on this analysis. Investment decision taken by readers to this article will be at their sole discretion. The purpose of this article is intended to be used as an educational discussion of the issues involved. This is not to be construed as a solicitation to buy or sell securities.
The yield on various securities and their movement is given below:
Level on 31st Aug 2015.
Level on 30th Sept 2015
Level on 30th Oct 2015
10 year Gsec 7.78% 7.54% 7.64%
5 year Corp bond 8.35% 8.05% 8.10%
2 month Cd yield 7.35% 7.10% 7.10%
2 month Cp yield 7.60% 7.25% 7.25%
1 year Cd yield 7.84% 7.35% 7.55%
1 month Cd yield 7.30% 7.05% 7.00%
Rupee = USD 66.49 65.51 65.41
If the RBI had ushered in an early festival season with its 50 bps repo rate cut in the Sept monetary policy, October seemed to be the month which suffered from the overhang. Yields moved up across all maturities during the month. The causes for the rise in yields could be attributed to:
l The US FOMC had stated, in their meeting in October, had stated in unequivocal terms that they will be looking at data before the rate hike in the next meeting in December. The market has taken
this to mean that the FOMC would be definitely hiking the rate in December. This had an effect on the yields which moved up.
l Fresh Govt borrowing during the month to the tune of Rs. 60000 crs pushed up yields as investors were already full up on Gsecs and had not sufficient space for further appetite.
l Rising inflation. As during the month the inflation index saw a rise in both CPI and WPI. CPI rose to a level of 4.41% from the previous month’s level of 3.74% and WPI rose from (-)4.95% to a level of (-)4.41%.
Yields moved up across the curve with the 10 year yield moving up from the post rate cut low of 7.52% to close the month at 7.64%. The 5 year bond yield moved up marginally as investors bought AAA bonds as the yield differential was in favour of bonds. Money market liquidity was sufficient during the month as investors like mutual funds lapped up CDs and CPs due to inflows into their funds.
Going forward, with the festival season coming in and the year end for many financial players, we do see subdued interest y players in the yields. Also with the monetary policy set for the 1st of December where we expect a status quo, we expect yields to be range bound.
10 Year Gsec movement for the past 3 months
03
Line, IN10YT=RR, 05-11-2015, 7.659
10 17
Daily IN10YT=RR 31-07-2015 - 30-10-2015 (GMT)Yield7.9
7.85
7.8
7.75
7.7
7.65
7.6
7.55
7.5
September 2015 October 2015August 201524 31 07 14 21 28 05 12 19 26
7.659
Rupee movement for the past 3 months
03 10 15August 2015
Daily INR
None
66.5
66
65.5
65
64.5
64
September 2015 October 201524 31 07 14 21 28 05 12 19 26
65.6900
PriceLine, INR=, 05-11-2015, 65.6900, +0.0798, +0.0908, (+0.14%)30-07-2015 - 30-10-2015 (GMT)
Source for Graphs: Internal Research
-1.8% 6.9%
0.5% 0.0%
4.5% 0.0%
4.1% 4.3%
-1.1% 0.0%
-2.2% 9.8%
-4.0% -2.0% 0.0% 2.0% 4.0% 6 .0% 8.0% 1 0.0% 1 2.0%
BSE Realty
BSE Metal
BSE Bank
BSE IT
BSE Auto
BSE Healthcare
BSE Power
BSE Oil & Gas
BSE Cap Goods
BSE FMCG
BSE Consumer Durables
Major Indices Change (%)
1.5%
1.9%
8.6%
9.7%
10.8%
8.47%
9.38%
0.0% 2 .0% 4.0% 6 .0% 8.0% 10.0% 12.0%
NIFTY
Sensex
Hang Seng
Nikkei
Shanghai
Dow Jones
Nasdaq
Global Indices

3
Issuer Name % to Net Assets*
DEBENTURES 0.05Blue Dart Express Ltd. 0.05EQUITY & EQUITY RELATED 97.77Wabco India Ltd. 5.56Eicher Motors Ltd. 5.36Kotak Mahindra Bank Ltd. 5.04TVS Motor Co. Ltd. 4.82Page Industries Ltd. 4.78Blue Dart Express Ltd. 4.51Cummins India Ltd. 4.42Cholamandalam Investment & Finance Co. Ltd. 4.33
Sundaram Finance Ltd. 4.20MRF Ltd. 4.07Dr. Reddys Laboratories Ltd. 4.06Pidilite Industries Ltd. 3.96
Issuer Name % to Net Assets*
Bosch Ltd. 3.82Gruh Finance Ltd. 3.73Asian Paints Ltd. 3.66United Breweries Ltd. 3.57Castrol India Ltd. 3.42CRISIL Ltd. 3.40Colgate Palmolive (India) Ltd. 3.33Glaxosmithkline Consumer Healthcare Ltd. 3.29ABB India Ltd. 3.19Nestle India Ltd. 3.03Thermax Ltd. 2.83VST Industries Ltd. 2.80Bata India Ltd. 2.58CBLO 1.98Cash & Cash Receivables 0.20TOTAL 100.00
IDBI Equity Advantage Fund (IEAF)(An open-ended Equity Linked Savings scheme (ELSS) offering Income Tax benefits under Section 80C of the IT Act, 1961)
Portfolio as on 30/10/2015
* Rounded off to the nearest two digits after the decimal point.
Industry Classification
19.69%
15.66%
13.45%
10.17%
6.02%
5.04%
4.78%
4.56%
4.42%
4.06%
3.96%
3.42%
2.58%
0.00% 5.00% 10.00% 15.00% 20.00% 25.00%
Consumer Non Durables
Finance
Auto Ancillaries
Auto
Industrial Capital Goods
Banks
Textile Products
Transportation
Industrial Products
Pharmaceuticals
Chemicals
Petroleum Products
Consumer Durables
Product LabelThis product is suitable for investors who are seeking*: Riskometer
l Long term capital growthl An Equity Linked Savings Scheme (ELSS) investing in equity and equity related instruments with the
objective to provide investors with opportunities for capital appreciation and income along with the benefit of income-tax deduction (under section 80C of the Income-tax Act, 1961) on their investments, subject to a statutory lock-in of three years.
Investors understand that their principal will be at Moderately High risk*Investors should consult their financial advisors if in doubt about whether the product is suitable for them.
Scheme Features
Investment objective:The Scheme will seek to invest predominantly in a diversified portfolio of equity and equity related instruments with the objective to provide investors with opportunities for capital appreciation and income along with the benefit of income-tax deduction (under section 80C of the Income-tax Act, 1961) on their investments. Investments in this scheme would be subject to a statutory lock-in of 3 years from the date of allotment to be eligible for income-tax benefits under Section 80C. There can be no assurance that the investment objective under the scheme will be realized.
Fund Manager: Total Experience: Over 34 Years
Mr. V. Balasubramanian (Managing this Scheme since inception)
Inception Date: 10th September, 2013
Benchmark:S&P BSE 200 Index
NAV as on 30th October 2015 (in `):
Regular DirectGrowth 20.5800 20.8900Dividend 17.9200 18.2300
Monthly Average AUM:` 375.08 Crs.
AUM as on 31st October 2015:` 377.81 Crs.
Expense Ratio: (Weighted Average for the month)Regular : 2.8819% Direct : 2.0620%
Quantitative Measures:Portfolio Turnover Ratio ^^ : 0.52^^ Lower of Purchase or Sale for one year/average AUM for one year.
Load Structure:Entry Load : Not ApplicableExit Load (for Lumpsum & SIP) : Nil. Investment under the scheme is subject to a
lock-in period of 3 Years.

4
Issuer Name % to Net Assets*
EQUITY & EQUITY RELATED 92.56Maruti Suzuki India Ltd. 3.94Bosch Ltd. 3.56HDFC Bank Ltd. 3.50Housing Development Finance Corpn. Ltd. 3.25Cummins India Ltd. 3.17Dr. Reddys Laboratories Ltd. 3.16IndusInd Bank Ltd. 3.13Glaxosmithkline Pharmaceuticals Ltd. 3.05Sundaram Finance Ltd. 3.02Siemens Ltd. 2.94Kotak Mahindra Bank Ltd. 2.92United Spirits Ltd. 2.90Mahindra & Mahindra Ltd. 2.84UltraTech Cement Ltd. 2.66Infosys Ltd. 2.51Reliance Industries Ltd. 2.45Apollo Hospitals Enterprises Ltd. 2.42Hero MotoCorp Ltd. 2.38Bajaj Auto Ltd. 2.35Yes Bank 2.24Bharat Forge Ltd. 2.22Mahindra & Mahindra Finance Ltd. 2.10
Issuer Name % to Net Assets*
Larsen & Toubro Ltd. 2.08Hindustan Unilever Ltd. 2.07Grasim Industries Ltd. 2.05Eicher Motors Ltd. 2.02TATA Chemicals Ltd. 1.96HCL Technologies Ltd. 1.93Bajaj Holdings & Investment Ltd. 1.84Glaxosmithkline Consumer Healthcare Ltd. 1.79LIC Housing Finance Ltd. 1.77Divis Laboratories Ltd. 1.70State Bank of India Ltd. 1.53Dabur India Ltd. 1.49Container Corporation of India Ltd. 1.47Oracle Financial Services Software Ltd. 1.43Colgate Palmolive (India) Ltd. 1.41Bajaj Finserv Ltd. 1.38Aditya Birla Nuvo Ltd. 1.14ACC Ltd. 0.76GOV'T SECURITIES 3.8108.13 GS 3.81CBLO 3.88Cash & Cash Receivables -0.25TOTAL 100.00
IDBI India Top 100 Equity Fund (IIT100EF)(An open-ended growth scheme)
Portfolio as on 30/10/2015
* Rounded off to the nearest two digits after the decimal point.
Industry Classification
13.53%
13.35%
13.32%
9.67%
7.92%
5.88%
5.48%
5.39%
3.56%
2.94%
2.45%
2.42%
2.08%
1.96%
1.47%
1.14%
0.00% 2.00% 4.00% 6.00% 8.00% 10.00% 12.00% 14.00% 16.00%
Auto
Finance
Banks
Consumer Non Durables
Pharmaceuticals
So�ware
Cement
Industrial Products
Auto Ancillaries
Industrial Capital Goods
Petroleum Products
Healthcare Services
Construction Project
Chemicals
Transporation
Services
Disclaimer of IISL: The IDBI India Top 100 Equity Fund offered by IDBI Mutual Fund or its affiliates is not sponsored, endorsed, sold or promoted by India Index Services & Products Limited (IISL) and its affiliates. IISL and its affiliates do not make any representation or warranty, express or implied (including warranties of merchantability or fitness for particular purpose or use) and disclaims all liability to the owners of IDBI India Top 100 Equity Fund or any member of the public regarding the advisability of investing in securities generally or in the IDBI India Top 100 Equity Fund linked to Nifty 100 Index or particularly in the ability of the Nifty 100 Index to track general stock market performance in India. Please read the full Disclaimers in relation to the Nifty100 Index in the Scheme Information Document.
Product LabelThis product is suitable for investors who are seeking*: Riskometer
l Long term capital growthl Investments in equity stocks and equity related instruments of companies that are constituents of
Nifty100 Index.
Investors understand that their principal will be at Moderately High risk*Investors should consult their financial advisors if in doubt about whether the product is suitable for them.
Scheme Features
Investment objective:To provide investors with opportunities for long-term growth in capital through active management of a diversified basket of equity stocks, debt and money market instruments. The investment universe of the scheme will be restricted to equity stocks and equity related instruments of companies that are constituents of the Nifty 50 Index and the Nifty Next 50 Index comprising a total of 100 stocks. These two indices are collectively referred to as the Nifty100 Index. The equity portfolio will be well-diversified and actively managed to realize the scheme objective.
Fund Manager: Total Experience: Over 34 Years
Mr. V. Balasubramanian (Managing this Scheme since inception)
Inception Date: 15th May, 2012
Benchmark:Nifty 100 Index
NAV as on 30th October 2015 (in `):
Regular DirectGrowth 18.9600 19.2600Dividend 16.7100 17.0000
Monthly Average AUM:` 265.33 Crs.
AUM as on 31st October 2015:` 270.99 Crs.
Expense Ratio: (Weighted Average for the month)Regular : 3.0171% Direct : 2.3201%
Quantitative Measures:Standard Deviation^ : 4.6059% Beta^ : 0.9553 Sharpe Ratio^ : 3.8735 Portfolio Turnover Ratio^^ : 0.48^ Source: Accord Fintech. Risk free rate: Overnight MIBOR (6.79% as on 30/10/2015). Ratios calculated on monthly 3 year data point.^^ Lower of Purchase or Sale for one year/average AUM for one year.
Load Structure:Entry Load : Not ApplicableExit Load : for Lumpsum - 1% for exit (Redemption Switch-out/Transfer/SWP) within 12 months
from the date of allotment. for SIP - 1% for exit (Redemption/Switch-out/Transfer/SWP) within 12
months from the date of allotment of each installment.

5
Issuer Name % to Net Assets*
DEBENTURES 0.01Blue Dart Express Ltd. 0.01EQUITY & EQUITY RELATED 96.29Kotak Mahindra Bank Ltd. 3.61Hindustan Unilever Ltd. 3.48Eicher Motors Ltd. 3.46HDFC Bank Ltd. 3.36Abbott India Ltd. 3.34ITC Ltd. 3.26Mahindra & Mahindra Ltd. 3.19Glaxosmithkline Consumer Healthcare Ltd. 2.88Shree Cements Ltd. 2.76Wabco India Ltd. 2.75CRISIL Ltd. 2.59Gillette India Ltd. 2.53Bayer Cropscience Ltd. 2.36Lakshmi Machine Works Ltd. 2.31Britannia Industries Ltd. 1.91BASF India Ltd. 1.91Tech Mahindra Ltd. 1.78Pidilite Industries Ltd. 1.77Bajaj Auto Ltd. 1.76Jubilant Foodworks Ltd. 1.75Godrej Consumer Products Ltd. 1.74Cummins India Ltd. 1.74Cholamandalam Investment & Finance Co. Ltd.
1.73
Blue Dart Express Ltd. 1.71Glaxosmithkline Pharmaceuticals Ltd. 1.69Bata India Ltd. 1.66Bosch Ltd. 1.65PVR Ltd. 1.65The Great Eastern Shipping Co. Ltd. 1.65TVS Motor Co. Ltd. 1.59
Issuer Name % to Net Assets*
Hero MotoCorp Ltd. 1.553M India Ltd. 1.49Thermax Ltd. 1.40Clariant Chemicals (India) Ltd. 1.38Bharat Forge Ltd. 1.30Larsen & Toubro Ltd. 1.27Pfizer Ltd. 1.14Elantas Beck India Ltd. 1.00Procter & Gamble Hygiene and Health Care Ltd.
0.91
Grindwell Norton Ltd. 0.90Colgate Palmolive (India) Ltd. 0.89Alstom TD India Ltd. 0.87Berger Paints (I) Ltd. 0.86Akzo Nobel India Ltd. 0.85Gateway Distriparks Ltd. 0.85Sundaram Finance Ltd. 0.84MRF Ltd. 0.83Greaves Cotton Ltd. 0.83ABB India Ltd. 0.82FAG Bearings India Ltd. 0.77Goodyear India Ltd. 0.75Nestle India Ltd. 0.74Gujarat Pipavav Port Ltd. 0.71VST Industries Ltd. 0.67Exide Industries Ltd. 0.64TATA Global Beverages Ltd. 0.60SKF India Ltd. 0.60Hawkins Cookers Ltd. 0.58TATA Consultancy Services Ltd. 0.37Kirloskar Oil Engines Ltd. 0.32CBLO 3.33Cash & Cash Receivables 0.36TOTAL 100.00
IDBI Diversified Equity Fund (IDEF)(An open-ended growth scheme)
Portfolio as on 30/10/2015
* Rounded off to the nearest two digits after the decimal point.
Industry Classification
23.07%
11.54%
7.47%
6.97%
6.63%
6.17%
5.39%
5.16%
5.06%
4.93%
2.76%
2.36%
2.23%
2.15%
1.65%
1.49%
1.27%
0.00% 5.00% 10.00% 15.00% 20.00% 25.00%
Consumer Non Durables
Auto
Industrial Products
Banks
Auto Ancillaries
Pharmaceuticals
Industrial Capital Goods
Finance
Chemicals
Transportation
Cement
Pesticides
Consumer Durables
So�ware
Media & Entertainment
Trading
Construction Project
Product LabelThis product is suitable for investors who are seeking*: Riskometer
l Long term capital growthl Investments predominantly in equity & equity related instruments.
Investors understand that their principal will be at Moderately High risk*Investors should consult their financial advisors if in doubt about whether the product is suitable for them.
Scheme Features
Investment objective:To provide investors with opportunities for long-term growth in capital through investment in a diversified basket of equity stocks, debt and money market instruments. The equity portfolio will be well-diversified and actively managed to realize the Scheme objective. However, there can be no assurance that the investment objective of the scheme will be realized.
Fund Manager: Total Experience: Over 34 Years
Mr. V. Balasubramanian (Managing this Scheme since inception)
Inception Date: 28th March, 2014
Benchmark:S&P BSE 500 Index
NAV as on 30th October 2015 (in `):
Regular DirectGrowth 16.7300 16.8800Dividend 15.7300 15.8700
Monthly Average AUM:` 328.62 Crs.
AUM as on 31st October 2015:` 333.83 Crs.
Expense Ratio: (Weighted Average for the month)Regular : 2.9990% Direct : 2.3000%
Quantitative Measures:Portfolio Turnover Ratio^^ : 0.47^^ Lower of Purchase or Sale for one year/average AUM for one year.
Load Structure:Entry Load : Not ApplicableExit Load : For Lumpsum - 1% for exit (Redemption/Switch-out/Transfer/SWP) within
12 months from the date of allotment. For SIP - 1% for exit (Redemption/Switch-out/Transfer/SWP) within
12 months from the date of allotment of each installment.

6
Issuer Name Rating % to Net Assets*
FIXED COUPON BOND 0.09NTPC Ltd. CRISIL AAA 0.09EQUITY & EQUITY RELATED 99.22Infosys Ltd. N.A. 7.81HDFC Bank Ltd. N.A. 7.47Housing Development Finance Corpn. Ltd.
N.A. 6.82
ITC Ltd. N.A. 6.46ICICI Bank Ltd. N.A. 5.54Reliance Industries Ltd. N.A. 5.38TATA Consultancy Services Ltd. N.A. 4.42Larsen & Toubro Ltd. N.A. 3.98Sun Pharmaceuticals Industries Ltd. N.A. 3.34Axis Bank Ltd. N.A. 2.80State Bank of India Ltd. N.A. 2.55Kotak Mahindra Bank Ltd. N.A. 2.42TATA Motors Ltd. N.A. 2.34Maruti Suzuki India Ltd. N.A. 2.28Hindustan Unilever Ltd. N.A. 1.98Mahindra & Mahindra Ltd. N.A. 1.90Dr. Reddys Laboratories Ltd. N.A. 1.88IndusInd Bank Ltd. N.A. 1.67Bharti Airtel Ltd. N.A. 1.66HCL Technologies Ltd. N.A. 1.64Lupin Ltd. N.A. 1.62Oil & Natural Gas Corpn Ltd. N.A. 1.52Coal India Ltd. N.A. 1.41Asian Paints Ltd. N.A. 1.31Wipro Ltd. N.A. 1.29
Issuer Name Rating % to Net Assets*
Cipla Ltd. N.A. 1.24Bajaj Auto Ltd. N.A. 1.19Tech Mahindra Ltd. N.A. 1.15Hero MotoCorp Ltd. N.A. 1.07UltraTech Cement Ltd. N.A. 1.03Power Grid Corpn. of India Ltd. N.A. 0.99Yes Bank N.A. 0.98NTPC Ltd. N.A. 0.91Adani Ports and Special Economic Zone Ltd.
N.A. 0.91
Grasim Industries Ltd. N.A. 0.82Zee Entertainment Enterprises Ltd. N.A. 0.78Bharat Petroleum Ltd. N.A. 0.78Bosch Ltd. N.A. 0.77Bharat Heavy Electricals Ltd. N.A. 0.63Idea Cellular Ltd. N.A. 0.57TATA Steel Ltd. N.A. 0.57Ambuja Cements Ltd. N.A. 0.55Bank of Baroda Ltd. N.A. 0.52GAIL (India) Ltd. N.A. 0.49ACC Ltd. N.A. 0.44Hindalco Industries Ltd. N.A. 0.38Tata Power Co. Ltd. N.A. 0.35Sesa Sterlite Ltd. N.A. 0.30Cairn India Ltd. N.A. 0.24Punjab National Bank Ltd. N.A. 0.09CBLO 0.79Cash & Cash Receivables -0.10TOTAL 100.00
IDBI Nifty Index Fund (INIF)(An open-ended passively managed equity scheme tracking the Nifty 50 Index [Total Returns Index])
Portfolio as on 30/10/2015
* Rounded off to the nearest two digits after the decimal point.
Industry Classification
24.03%
16.32%
9.75%
8.77%
8.08%
6.82%
6.16%
3.98%
2.84%
2.34%
2.23%
1.76%
1.41%
0.91%
0.78%
0.77%
0.67%
0.63%
0.57%
0.49%
0.00% 5.00% 10.00% 15.00% 20.00% 25.00% 30.00%
Banks
So�ware
Consumer Non Durables
AUTO
Pharmaceuticals
Finance
Petroleum Products
Construction Project
Cement
Power
Telecom - Services
Oil
Minerals/Mining
Transportation
Media & Entertainment
Auto Ancillaries
Non - Ferrous Metals
Industrial Capital Goods
Ferrous Metals
Gas
Disclaimer of IISL : The IDBI Nifty Index Fund offered by IDBI Mutual Fund or its affiliates is not sponsored, endorsed, sold or promoted by India Index Services & Products Limited (IISL) and its affiliates. IISL and its affiliates do not make any representation or warranty, express or implied (including warranties of merchantability or fitness for particular purpose or use) and disclaims all liability to the owners of IDBI Nifty Index Fund or any member of the public regarding the advisability of investing in securities generally or in the IDBI Nifty Index Fund linked to Nifty 50 Index or particularly in the ability of the Nifty 50 Index to track general stock market performance in India. Please read the full Disclaimers in relation to the Nifty 50 Index in the Scheme Information Document.
Product LabelThis product is suitable for investors who are seeking*: Riskometer
l Long Term growth in a passively managed scheme tracking Nifty 50 Index (TRI)l Investments only in and all stocks comprising Nifty 50 Index in the same weight of these stocks as in
Index with objective to replicate performance of Nifty 50 Index (TRI)
Investors understand that their principal will be at Moderately High risk*Investors should consult their financial advisors if in doubt about whether the product is suitable for them.
Scheme Features
Investment objective:The investment objective of the scheme is to invest only in and all the stocks comprising the Nifty 50 Index in the same weights of these stocks as in the Index with the objective to replicate the performance of the Total Returns Index of Nifty 50 Index. The scheme may also invest in derivatives instruments such as Futures and Options linked to stocks comprising the Index or linked to the Nifty 50 Index. The scheme will adopt a passive investment strategy and will seek to achieve the investment objective by minimizing the tracking error between the Nifty 50 Index (Total Returns Index) and the Scheme.
Fund Manager: Total Experience: Over 7 Years
Mr. Anshul Mishra (Managing this Scheme since 9th April 2015)
Inception Date: 25th June, 2010
Benchmark:Nifty 50 Index-TRI (Total Returns Index)
NAV as on 30th October 2015 (in `):
Regular DirectGrowth 15.1830 15.3712Dividend 14.4801 14.6635
Monthly Average AUM:` 93.47 Crs.
AUM as on 31st October 2015:` 99.76 Crs.
Expense Ratio: (Weighted Average for the month)Regular : 1.7538% Direct : 0.5037%
Quantitative Measures:Standard Deviation^ : 4.6072% Beta^ : 0.2960 Sharpe Ratio^ : 2.1813 Portfolio Turnover Ratio^^ : 1.21 Tracking Error^ : 2.6261%^ Source: Accord Fintech. Risk free rate: Overnight MIBOR (6.79% as on 30/10/2015). Ratios calculated on monthly 3 year data point.^^ Lower of Purchase or Sale for one year/average AUM for one year.
Load Structure:Entry Load : Not ApplicableExit Load (for Lumpsum & SIP) : Nil
7
Issuer Name % To Net Assets*
EQUITY & EQUITY RELATED 99.54Eicher Motors Ltd. 4.11Aurobindo Pharma Ltd. 3.97India Bulls Housing Finance Ltd. 3.93Bharti Infratel Ltd. 3.76Indian Oil Corpn. Ltd. 3.54Britannia Industries Ltd. 3.37Cummins India Ltd. 2.96United Spirits Ltd. 2.90Godrej Consumer Products Ltd. 2.79Divis Laboratories Ltd. 2.74Dabur India Ltd. 2.67Ashok Leyland Ltd. 2.63Glenmark Pharmaceuticals Ltd. 2.56LIC Housing Finance Ltd. 2.54Titan Co. Ltd. 2.45Shriram Transport Finance Co. Ltd. 2.44UPL Ltd. 2.38Hindustan Petroleum Corpn. Ltd. 2.28Colgate Palmolive (India) Ltd. 2.24Siemens Ltd. 2.14Bajaj Finserv Ltd. 2.10Motherson Sumi Systems Ltd. 2.03Bharat Forge Ltd. 1.96Sundaram Finance Ltd. 1.82Marico Ltd. 1.78Container Corpn. of India Ltd. 1.74
Issuer Name % To Net Assets*
MRF Ltd. 1.74Bajaj Holdings & Investment Ltd. 1.74JSW Steel Ltd. 1.72Apollo Hospitals Enterprises Ltd. 1.72Rural Electrification Corpn. Ltd. 1.71The Federal Bank Ltd. 1.64Power Finance Corpn. Ltd. 1.52Oracle Financial Services Software Ltd. 1.42NMDC Ltd. 1.41Reliance Communications Ltd. 1.29TATA Chemicals Ltd. 1.23Glaxosmithkline Pharmaceuticals Ltd. 1.21Exide Industries Ltd. 1.20Glaxosmithkline Consumer Healthcare Ltd. 1.19United Breweries Ltd. 1.19Mahindra & Mahindra Finance Ltd. 1.06Petronet LNG Ltd. 0.99Oil India Ltd. 0.99Steel Authority of India Ltd. 0.94TATA Global Beverages Ltd. 0.92Reliance Infrastructure Ltd. 0.90Reliance Capital Ltd. 0.81Canara Bank Ltd. 0.68Bank of India Ltd. 0.49CBLO 0.85Cash & Cash Receivables -0.38TOTAL 100.00
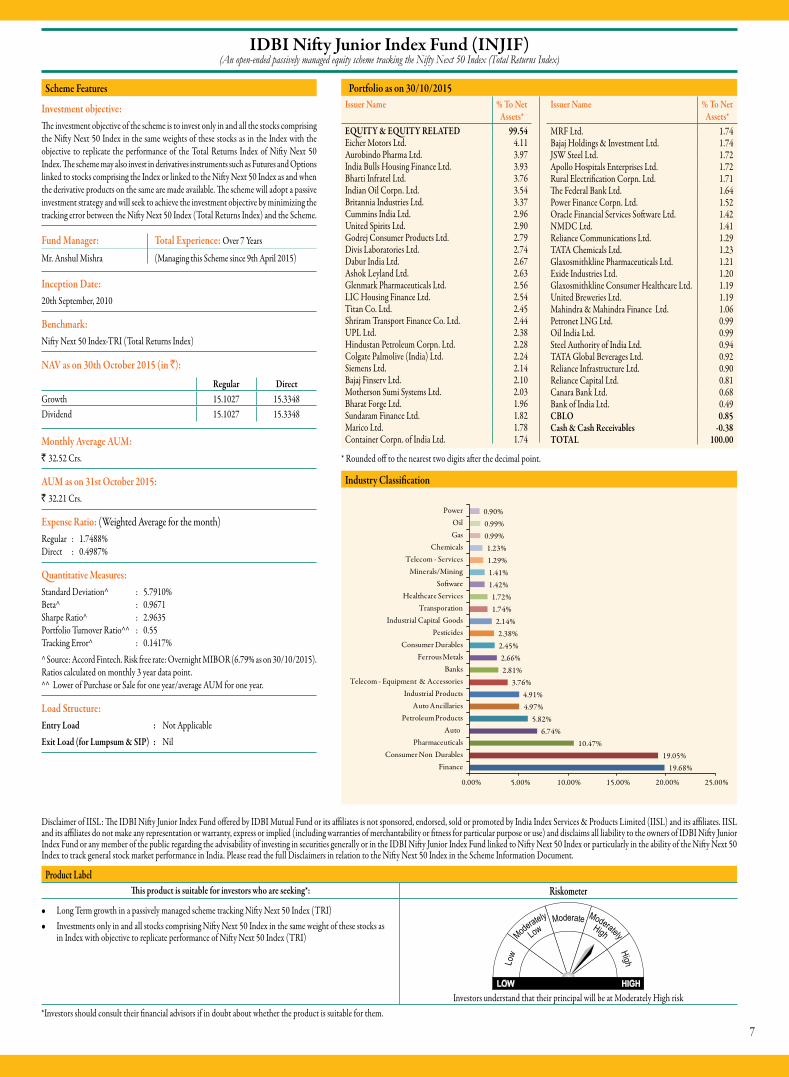
IDBI Nifty Junior Index Fund (INJIF)(An open-ended passively managed equity scheme tracking the Nifty Next 50 Index (Total Returns Index)
* Rounded off to the nearest two digits after the decimal point.
Industry Classification
19.68%19.05%
10.47%6.74%
5.82%4.97%4.91%
3.76%2.81%2.66%
2.45%2.38%
2.14%1.74%1.72%
1.42%1.41%1.29%1.23%
0.99%0.99%0.90%
0.00% 5.00% 10.00% 15.00% 20.00% 25.00%
FinanceConsumer Non Durables
PharmaceuticalsAuto
Petroleum ProductsAuto Ancillaries
Industrial ProductsTelecom - Equipment & Accessories
BanksFerrous Metals
Consumer DurablesPesticides
Industrial Capital GoodsTransporation
Healthcare ServicesSo�ware
Minerals/MiningTelecom - Services
ChemicalsGasOil
Power
Disclaimer of IISL: The IDBI Nifty Junior Index Fund offered by IDBI Mutual Fund or its affiliates is not sponsored, endorsed, sold or promoted by India Index Services & Products Limited (IISL) and its affiliates. IISL and its affiliates do not make any representation or warranty, express or implied (including warranties of merchantability or fitness for particular purpose or use) and disclaims all liability to the owners of IDBI Nifty Junior Index Fund or any member of the public regarding the advisability of investing in securities generally or in the IDBI Nifty Junior Index Fund linked to Nifty Next 50 Index or particularly in the ability of the Nifty Next 50 Index to track general stock market performance in India. Please read the full Disclaimers in relation to the Nifty Next 50 Index in the Scheme Information Document.
Product LabelThis product is suitable for investors who are seeking*: Riskometer
l Long Term growth in a passively managed scheme tracking Nifty Next 50 Index (TRI)l Investments only in and all stocks comprising Nifty Next 50 Index in the same weight of these stocks as
in Index with objective to replicate performance of Nifty Next 50 Index (TRI)
Investors understand that their principal will be at Moderately High risk*Investors should consult their financial advisors if in doubt about whether the product is suitable for them.
Portfolio as on 30/10/2015Scheme Features
Investment objective:The investment objective of the scheme is to invest only in and all the stocks comprising the Nifty Next 50 Index in the same weights of these stocks as in the Index with the objective to replicate the performance of the Total Returns Index of Nifty Next 50 Index. The scheme may also invest in derivatives instruments such as Futures and Options linked to stocks comprising the Index or linked to the Nifty Next 50 Index as and when the derivative products on the same are made available. The scheme will adopt a passive investment strategy and will seek to achieve the investment objective by minimizing the tracking error between the Nifty Next 50 Index (Total Returns Index) and the Scheme.
Fund Manager: Total Experience: Over 7 Years
Mr. Anshul Mishra (Managing this Scheme since 9th April 2015)
Inception Date: 20th September, 2010
Benchmark:Nifty Next 50 Index-TRI (Total Returns Index)
NAV as on 30th October 2015 (in `):
Regular DirectGrowth 15.1027 15.3348Dividend 15.1027 15.3348
Monthly Average AUM:` 32.52 Crs.
AUM as on 31st October 2015:` 32.21 Crs.
Expense Ratio: (Weighted Average for the month)Regular : 1.7488% Direct : 0.4987%
Quantitative Measures:Standard Deviation^ : 5.7910% Beta^ : 0.9671 Sharpe Ratio^ : 2.9635 Portfolio Turnover Ratio^^ : 0.55 Tracking Error^ : 0.1417%^ Source: Accord Fintech. Risk free rate: Overnight MIBOR (6.79% as on 30/10/2015). Ratios calculated on monthly 3 year data point.^^ Lower of Purchase or Sale for one year/average AUM for one year.
Load Structure:Entry Load : Not ApplicableExit Load (for Lumpsum & SIP) : Nil
8
Issuer Name Rating % To Net Assets*
CERTIFICATES OF DEPOSITS 33.56Vijaya Bank CARE A1+ 7.98Oriental Bank of Commerce CRISIL A1+ 6.98Corporation Bank CRISIL A1+ 5.20Axis Bank Ltd. CRISIL A1+ 5.01Kotak Mahindra Bank Ltd. CRISIL A1+ 4.87Punjab & Sind Bank Ltd. CRISIL A1+ 2.01ICICI Bank Ltd. ICRA A1+ 1.00Indian Overseas Bank Ltd. ICRA A1+ 0.50COMMERCIAL PAPERS 52.27Edelweiss Financial Services Ltd. CRISIL A1+ 4.89Aditya Birla Finance Ltd ICRA A1+ 2.99India Bulls Housing Finance Ltd. CRISIL A1+ 2.98L & T Finance Ltd. CARE A1+ 2.98Hero Fincorp Ltd. CRISIL A1+ 2.48Alkem Laboratories Ltd. CRISIL A1+ 2.01Shapoorji Pallonji & Co. Pvt. Ltd. ICRA A1+ 2.01L&T Hydrocarbon Engineering Ltd. CRISIL A1+ 2.00Gruh Finance Ltd. ICRA A1+ 1.99ECL Finance Ltd. CRISIL A1+ 1.99Infrastructure Leasing & Financial Services Ltd.
ICRA A1+ 1.99
Family Credit Ltd. CARE A1+ 1.99EID Parry India Ltd. CRISIL A1+ 1.91LIC Housing Finance Ltd. CRISIL A1+ 1.91The Ramco Cements Ltd. ICRA A1+ 1.50Manappuram Finance Ltd. CRISIL A1+ 1.49Bilt Graphic Paper Products Ltd. IND A1+ 1.39
Issuer Name Rating % To Net Assets*
Capital First Ltd. CARE A1+ 1.00PTC India Financial Services Ltd. CRISIL A1+ 1.00Reliance Capital Ltd. CRISIL A1+ 1.00Adani Transmission Ltd. IND A1+ 1.00L&T Fincorp Ltd. CARE A1+ 1.00PNB Housing Finance Ltd. CARE A1+ 1.00Adani Ports and Special Economic Zone Ltd.
ICRA A1+ 1.00
Housing Development Finance Corpn. Ltd.
ICRA A1+ 1.00
Shriram Transport Finance Co. Ltd. CRISIL A1+ 1.00Afcons Infrastructure Ltd. ICRA A1+ 0.99L&T Housing Finance Ltd. CARE A1+ 0.99Karvy Stock Broking Ltd.** ICRA
A1+(SO)0.99
Raymond Ltd. CRISIL A1+ 0.70JM Financial Asset Reconstruction Co. Pvt. Ltd.
ICRA A1+ 0.60
Rajapalayam Mills Ltd.# CARE A1+(SO)
0.50
FIXED DEPOSITS 4.02IndusInd Bank Ltd. N.A. 3.02Punjab & Sind Bank Ltd. N.A. 1.01T-BILLS 9.7991DTB SOV 9.79CBLO 0.30Cash & Cash Receivables 0.05TOTAL 100.00
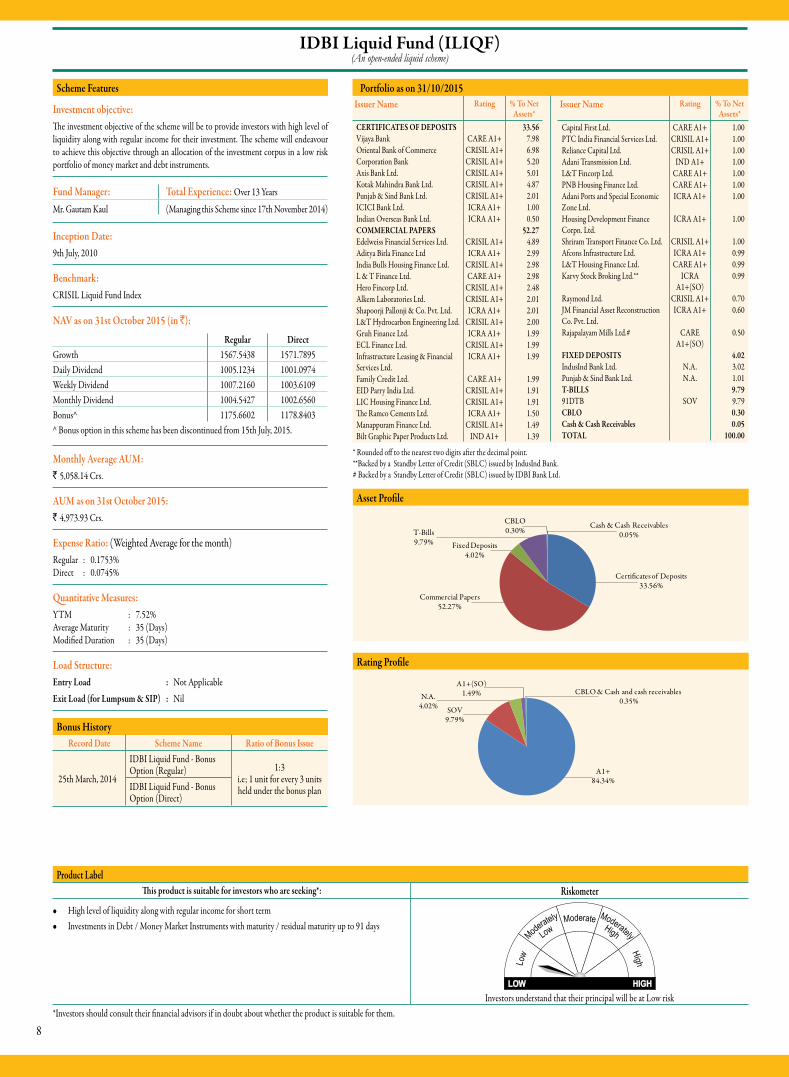
IDBI Liquid Fund (ILIQF)(An open-ended liquid scheme)
Portfolio as on 31/10/2015
* Rounded off to the nearest two digits after the decimal point.**Backed by a Standby Letter of Credit (SBLC) issued by IndusInd Bank.# Backed by a Standby Letter of Credit (SBLC) issued by IDBI Bank Ltd.
Asset Profile
Certi�cates of Deposits33.56%
Commercial Papers52.27%
Fixed Deposits4.02%
T-Bills9.79%
CBLO0.30%
Cash & Cash Receivables0.05%
Rating Profile
A1+84.34%
SOV9.79%
N.A.4.02%
A1+(SO)1.49% CBLO & Cash and cash receivables
0.35%
Product LabelThis product is suitable for investors who are seeking*: Riskometer
l High level of liquidity along with regular income for short terml Investments in Debt / Money Market Instruments with maturity / residual maturity up to 91 days
Investors understand that their principal will be at Low risk*Investors should consult their financial advisors if in doubt about whether the product is suitable for them.
Scheme Features
Investment objective:The investment objective of the scheme will be to provide investors with high level of liquidity along with regular income for their investment. The scheme will endeavour to achieve this objective through an allocation of the investment corpus in a low risk portfolio of money market and debt instruments.
Fund Manager: Total Experience: Over 13 Years
Mr. Gautam Kaul (Managing this Scheme since 17th November 2014)
Inception Date: 9th July, 2010
Benchmark:CRISIL Liquid Fund Index
NAV as on 31st October 2015 (in `):
Regular DirectGrowth 1567.5438 1571.7895Daily Dividend 1005.1234 1001.0974Weekly Dividend 1007.2160 1003.6109Monthly Dividend 1004.5427 1002.6560Bonus^ 1175.6602 1178.8403^ Bonus option in this scheme has been discontinued from 15th July, 2015.
Monthly Average AUM: ` 5,058.14 Crs.
AUM as on 31st October 2015:` 4,973.93 Crs.
Expense Ratio: (Weighted Average for the month)Regular : 0.1753% Direct : 0.0745%
Quantitative Measures:YTM : 7.52% Average Maturity : 35 (Days) Modified Duration : 35 (Days)
Load Structure:Entry Load : Not ApplicableExit Load (for Lumpsum & SIP) : Nil
Bonus HistoryRecord Date Scheme Name Ratio of Bonus Issue
25th March, 2014
IDBI Liquid Fund - Bonus Option (Regular) 1:3
i.e; 1 unit for every 3 units held under the bonus planIDBI Liquid Fund - Bonus
Option (Direct)
9
Issuer Name Rating % To Net Assets*
CERTIFICATE OF DEPOSITS 30.95Corporation Bank CRISIL A1+ 10.84The South Indian Bank Ltd. ICRA A1+ 3.64Punjab & Sind Bank Ltd. ICRA A1+ 3.62Punjab National Bank Ltd. CARE A1+ 3.57Bank of Maharashtra CRISIL A1+ 3.56Bank of India Ltd. CRISIL A1+ 3.56IndusInd Bank Ltd. CRISIL A1+ 0.73Axis Bank Ltd. CRISIL A1+ 0.73Canara Bank Ltd. CRISIL A1+ 0.71COMMERCIAL PAPERS 25.28Housing Development Finance Corpn. Ltd.
ICRA A1+ 9.50
Shapoorji Pallonji and Co. Pvt. Ltd. ICRA A1+ 6.41India Bulls Housing Finance Ltd. CRISIL A1+ 3.62S D Corporation Pvt. Ltd.** CARE
A1+(SO)3.56
Aditya Birla Finance Ltd. ICRA A1+ 0.73Rashtriya Ispat Nigam Ltd. CRISIL A1+ 0.73Adani Ports and Special Economic Zone Ltd.
ICRA A1+ 0.73
Issuer Name Rating % To Net Assets*
FIXED COUPON BOND 16.92TATA Capital Financial Services Ltd. ICRA AA+ 2.94India Bulls Housing Finance Ltd. CARE AAA 2.93LIC Housing Finance Ltd. CRISIL AAA 2.21Capital First Ltd. CARE AA+ 2.20Fullerton India Credit Co. Ltd. ICRA AA+ 1.48India Bulls Housing Finance Ltd. CARE AA+ 1.47L&T Fincorp Ltd. ICRA AA+ 1.46Power Grid Corpn. of India Ltd. CRISIL AAA 0.76Housing Development Finance Corpn. Ltd.
CRISIL AAA 0.75
Piramal Enterprises Ltd. ICRA AA 0.73T-BILLS 7.96364 DTB SOV 7.2491DTB SOV 0.73ZERO COUPON BOND 0.73Reliance Capital Ltd. CARE AAA 0.73CBLO 15.32Cash & Cash Receivables 2.83TOTAL 100.00
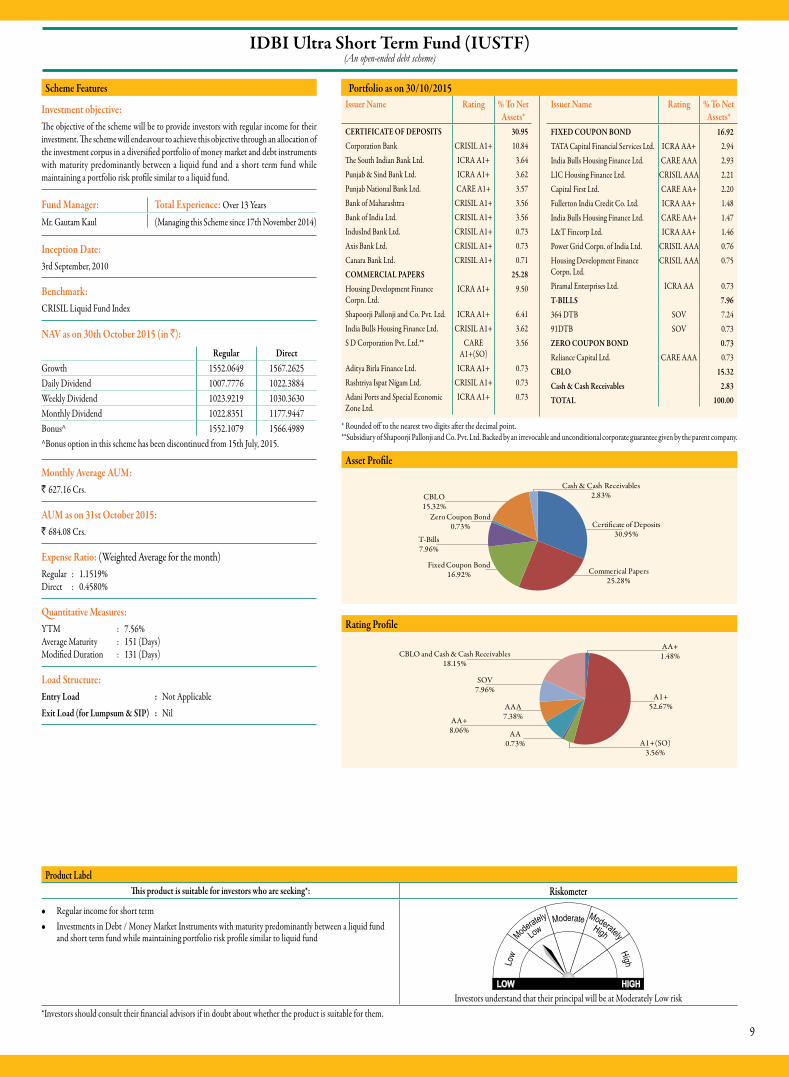
IDBI Ultra Short Term Fund (IUSTF)(An open-ended debt scheme)
Portfolio as on 30/10/2015
* Rounded off to the nearest two digits after the decimal point.**Subsidiary of Shapoorji Pallonji and Co. Pvt. Ltd. Backed by an irrevocable and unconditional corporate guarantee given by the parent company.
Asset Profile
Certi�cate of Deposits30.95%
Commerical Papers25.28%
Fixed Coupon Bond16.92%
T-Bills7.96%
Zero Coupon Bond0.73%
CBLO15.32%
Cash & Cash Receivables2.83%
Rating Profile
AA+1.48%
A1+52.67%
A1+(SO)3.56%
AA0.73%
AA+8.06%
AAA7.38%
SOV7.96%
CBLO and Cash & Cash Receivables18.15%
Product LabelThis product is suitable for investors who are seeking*: Riskometer
l Regular income for short terml Investments in Debt / Money Market Instruments with maturity predominantly between a liquid fund
and short term fund while maintaining portfolio risk profile similar to liquid fund
Investors understand that their principal will be at Moderately Low risk*Investors should consult their financial advisors if in doubt about whether the product is suitable for them.
Scheme Features
Investment objective:The objective of the scheme will be to provide investors with regular income for their investment. The scheme will endeavour to achieve this objective through an allocation of the investment corpus in a diversified portfolio of money market and debt instruments with maturity predominantly between a liquid fund and a short term fund while maintaining a portfolio risk profile similar to a liquid fund.
Fund Manager: Total Experience: Over 13 Years
Mr. Gautam Kaul (Managing this Scheme since 17th November 2014)
Inception Date: 3rd September, 2010
Benchmark:CRISIL Liquid Fund Index
NAV as on 30th October 2015 (in `):
Regular DirectGrowth 1552.0649 1567.2625Daily Dividend 1007.7776 1022.3884Weekly Dividend 1023.9219 1030.3630Monthly Dividend 1022.8351 1177.9447Bonus^ 1552.1079 1566.4989^Bonus option in this scheme has been discontinued from 15th July, 2015.
Monthly Average AUM:` 627.16 Crs.
AUM as on 31st October 2015:` 684.08 Crs.
Expense Ratio: (Weighted Average for the month)Regular : 1.1519% Direct : 0.4580%
Quantitative Measures:YTM : 7.56% Average Maturity : 151 (Days) Modified Duration : 131 (Days)
Load Structure:Entry Load : Not ApplicableExit Load (for Lumpsum & SIP) : Nil

10
IDBI Short Term Bond Fund (ISTBF)(An open-ended debt scheme)
Portfolio as on 30/10/2015
* Rounded off to the nearest two digits after the decimal point.
Asset Profile
Fixed Coupon Bonds57.16%
GOV'T Securities10.95%
Zero Coupon Bond3.64%
CBLO25.77%
Cash & Cash Receivables2.48%
Rating Profile
AA+15.14%
AAA45.66%
SOV10.95%
CBLO and Cash & Cash Receivables28.25%
Product LabelThis product is suitable for investors who are seeking*: Riskometer
l Regular income for short terml Investments in Debt / Money Market Instruments with duration / maturity / residual maturity not
exceeding 3 years
Investors understand that their principal will be at Moderately Low risk*Investors should consult their financial advisors if in doubt about whether the product is suitable for them.
Scheme Features
Investment objective:The objective of the scheme will be to provide investors with regular income for their investment. The scheme will endeavour to achieve this objective through an allocation of the investment corpus in a diversified portfolio of debt and money market instruments.
Fund Manager: Total Experience: Over 21 Years
Mr. Ganti N. Murthy (Managing this Scheme since 17th November 2014)
Inception Date: 23rd March, 2011
Benchmark:CRISIL Short Term Bond Fund Index
NAV as on 30th October 2015 (in `):
Regular DirectGrowth 14.7700 15.0626Weekly Dividend 10.6866 10.9517Monthly Dividend 10.8412 12.3104
Monthly Average AUM: ` 121.93 Crs.
AUM as on 31st October 2015:` 137.73 Crs.
Expense Ratio: (Weighted Average for the month)Regular : 1.1943% Direct : 0.4447%
Quantitative Measures:YTM : 7.87% Average Maturity : 1.30 (Years) Modified Duration : 1.10 (Years)
Load Structure:Entry Load : Not ApplicableExit Load (for Lumpsum & SIP) : Nil
Issuer Name Rating % To Net Assets*
FIXED COUPON BONDS 57.16National Bank of Agriculture & Rural Development CRISIL AAA 8.79Rural Electrification Corpn. Ltd. CRISIL AAA 7.54Power Finance Corpn. Ltd. CRISIL AAA 7.42Shriram Transport Finance Co. Ltd. CARE AA+ 7.37Power Grid Corpn. of India Ltd. CRISIL AAA 4.40Dewan Housing Finance Corpn. Ltd. CARE AA+ 4.12Reliance Gas Transportation Infrastructure Ltd. CRISIL AAA 3.82LIC Housing Finance Ltd. CRISIL AAA 3.66Steel Authority of India Ltd. CARE AAA 3.64Capital First Ltd. CARE AA+ 3.64Steel Authority of India Ltd. IND AAA 2.76GOV'T SECURITIES 10.9508.07 GS SOV 7.3207.49 GS SOV 3.63ZERO COUPON BOND 3.64Reliance Capital Ltd. CARE AAA 3.64CBLO 25.77Cash & Cash Receivables 2.48TOTAL 100.00
11
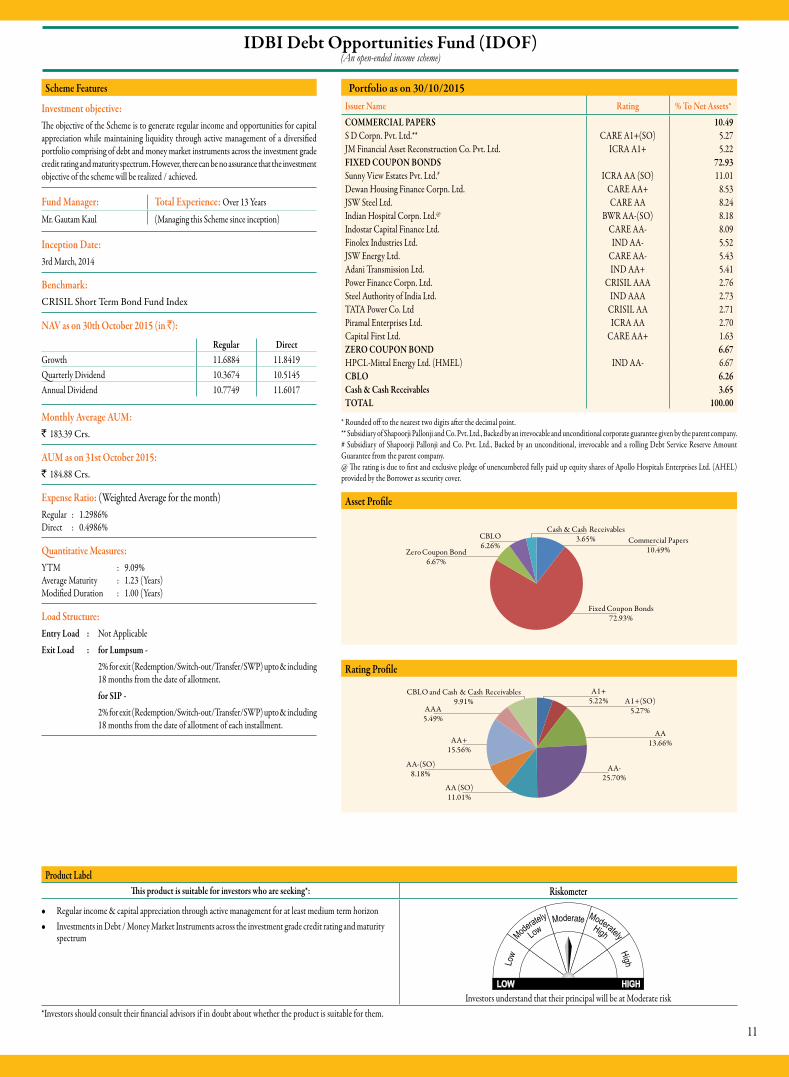
IDBI Debt Opportunities Fund (IDOF)(An open-ended income scheme)
Portfolio as on 30/10/2015
* Rounded off to the nearest two digits after the decimal point.** Subsidiary of Shapoorji Pallonji and Co. Pvt. Ltd., Backed by an irrevocable and unconditional corporate guarantee given by the parent company.# Subsidiary of Shapoorji Pallonji and Co. Pvt. Ltd., Backed by an unconditional, irrevocable and a rolling Debt Service Reserve Amount Guarantee from the parent company.@ The rating is due to first and exclusive pledge of unencumbered fully paid up equity shares of Apollo Hospitals Enterprises Ltd. (AHEL) provided by the Borrower as security cover.
Asset Profile
Commercial Papers10.49%
Fixed Coupon Bonds72.93%
Zero Coupon Bond6.67%
CBLO6.26%
Cash & Cash Receivables3.65%
Rating Profile
A1+5.22% A1+(SO)
5.27%
AA13.66%
AA-25.70%
AA (SO)11.01%
AA-(SO)8.18%
AA+15.56%
AAA5.49%
CBLO and Cash & Cash Receivables9.91%
Product LabelThis product is suitable for investors who are seeking*: Riskometer
l Regular income & capital appreciation through active management for at least medium term horizonl Investments in Debt / Money Market Instruments across the investment grade credit rating and maturity
spectrum
Investors understand that their principal will be at Moderate risk*Investors should consult their financial advisors if in doubt about whether the product is suitable for them.
Scheme Features
Investment objective:The objective of the Scheme is to generate regular income and opportunities for capital appreciation while maintaining liquidity through active management of a diversified portfolio comprising of debt and money market instruments across the investment grade credit rating and maturity spectrum. However, there can be no assurance that the investment objective of the scheme will be realized / achieved.
Fund Manager: Total Experience: Over 13 Years
Mr. Gautam Kaul (Managing this Scheme since inception)
Inception Date: 3rd March, 2014
Benchmark:CRISIL Short Term Bond Fund Index
NAV as on 30th October 2015 (in `):
Regular DirectGrowth 11.6884 11.8419Quarterly Dividend 10.3674 10.5145Annual Dividend 10.7749 11.6017
Monthly Average AUM: ` 183.39 Crs.
AUM as on 31st October 2015:` 184.88 Crs.
Expense Ratio: (Weighted Average for the month)Regular : 1.2986% Direct : 0.4986%
Quantitative Measures:YTM : 9.09% Average Maturity : 1.23 (Years) Modified Duration : 1.00 (Years)
Load Structure:Entry Load : Not ApplicableExit Load : for Lumpsum - 2% for exit (Redemption/Switch-out/Transfer/SWP) upto & including
18 months from the date of allotment. for SIP - 2% for exit (Redemption/Switch-out/Transfer/SWP) upto & including
18 months from the date of allotment of each installment.
Issuer Name Rating % To Net Assets*COMMERCIAL PAPERS 10.49S D Corpn. Pvt. Ltd.** CARE A1+(SO) 5.27JM Financial Asset Reconstruction Co. Pvt. Ltd. ICRA A1+ 5.22FIXED COUPON BONDS 72.93Sunny View Estates Pvt. Ltd.# ICRA AA (SO) 11.01Dewan Housing Finance Corpn. Ltd. CARE AA+ 8.53JSW Steel Ltd. CARE AA 8.24Indian Hospital Corpn. Ltd.@ BWR AA-(SO) 8.18Indostar Capital Finance Ltd. CARE AA- 8.09Finolex Industries Ltd. IND AA- 5.52JSW Energy Ltd. CARE AA- 5.43Adani Transmission Ltd. IND AA+ 5.41Power Finance Corpn. Ltd. CRISIL AAA 2.76Steel Authority of India Ltd. IND AAA 2.73TATA Power Co. Ltd CRISIL AA 2.71Piramal Enterprises Ltd. ICRA AA 2.70Capital First Ltd. CARE AA+ 1.63ZERO COUPON BOND 6.67HPCL-Mittal Energy Ltd. (HMEL) IND AA- 6.67CBLO 6.26Cash & Cash Receivables 3.65TOTAL 100.00

12
Snapshot of IDBI Mutual Fund Schemes
INIF INJIF IIT100EF IEAF IDEF IMIP ILQF IUSTF IDOF ISTBF IDBF IGF IGFOF IDBIGOLD RGESS-Srs I-Plan A
Benchmark Nifty 50 Index-TRI (Total Returns Index)
Nifty Next 50 Index-TRI (Total Returns Index) Nifty 100 Index S&P BSE 200 Index S&P BSE 500 Index CRISIL MIP Blended
IndexCRISIL Liquid Fund Index
CRISIL Liquid Fund Index
CRISIL Short Term Bond Fund Index
CRISIL Short Term Bond Fund Index
CRISIL Composite Bond Fund Index CRISIL Gilt Index Domestic price of
GoldDomestic price of Gold S&P BSE 100 Index
Fund Manager Mr. Anshul Mishra Mr. V. Balasubramanian
Mr. Ganti N. Murthy (Debt portion) Mr. V. Balasubramanian (Equity portion)
Mr. Gautam Kaul Mr. Ganti N. Murthy Mr. Anshul Mishra Mr. V. Balasubramanian
Minimum / Maximum Application Amount
Minimum Application Amount (Lumpsum/SIP/STP) Maximum Application Amount (Lumpsum/SIP/SWP)New Purchase – Rs. 5000/- and in multiples of Re. 1/- thereafterFor IEAF – Rs. 500/- and in multiples of Rs. 500/- thereafter For IDBI Gold : Authorized participants & Large investors - In creation unit lot of 1000 units and multiples of 1000 units thereof or in equivalent amount in cash.
New & Additional Purchase: No limitFor IEAF (w.e.f. 22nd December, 2014) : 1. Maximum subscription amount per day per Investor: Rs. 1,50,000/-. 2. Maximum subscription amount per Investor per transaction: Rs.1,50,000/- for new SIP/STP
- -
Minimum Additional Investment
Rs. 1000/- and in multiples of Re.1/- thereafterFor IEAF – Rs. 500/- and in multiples of Rs.500/- thereafter - -
SIP • Rs. 1000 per month for a minimum period of 6 months.
NA NA• Rs. 500 per month for a minimum period of 12 months.• Rs. 1500 per quarter for a minimum period of 4 quarters.• Only for IUSTF: Rs. 500 per day for a minimum of 30 installments continuously for all business days.Investments above minimum amount mentioned shall be made in multiples of Rs.1/- for all SIP, except for IEAF it shall be made in multiples of Rs. 500/-.
SWP & STP Minimum balance in the Scheme should be Rs.25,000/- at the time of enrollment. SWP/STP from IEAF to any other Schemes of IDBI Mutual Fund is available only after completion of lock-in period of 3 years.STP:Sub-options for STP Eligible dates for effect Minimum amount per transfer*Daily (only offered under ILIQF, IUSTF and ISTBF) All Business days Rs. 200/-Weekly 1st Business day of the week Rs. 1,000/-Monthly 1st, 5th, 10th, 15th, 20th and 25th of the month Rs. 1,000/-Quarterly 1st, 5th, 10th, 15th, 20th and 25th of the each quarter Rs. 2,500/-
Daily STP amount per transfer Minimum term / duration applicableRs. 200/- to less than Rs. 500/- 30 Business daysRs. 500/- to less than Rs. 1,000/- 12 Business daysRs. 1,000/- and above 6 Business daysWeekly & Monthly STP: 12 Installments; Quarterly STP: 4 Installments
(*Multiples of Re.1/- thereafter except under IEAF where STP will be made at a minimum of Rs.500/- and in multiples of Rs.500/- thereafter.)SWP: Minimum amount for each withdrawal is Rs.1000/- and in multiples of Re.1/- thereafter for a minimum period of 6 months. Withdrawal on 25th of each month or, if 25th is a holiday, then the next effective business day.
NA NA
Full Form of SIP, SWP & STP is “Systematic Investment Plan”, “Systematic Withdrawal Plan” & “Systematic Transfer Plan”
Plans, options and sub-optionsNo Scheme Plan* Option Sub-option / Frequency of
DividendMode of dividend payment
1 ILIQF Regular & Direct Dividend Daily/ Weekly/ Monthly Reinvestment / Payout/ SweepGrowth NA NA
2 IUSTF Regular & Direct Dividend Daily/ Weekly/ Monthly Reinvestment / Payout/ SweepGrowth NA NA
3 ISTBF Regular & Direct Dividend Weekly/ Monthly Reinvestment / Payout/ SweepGrowth NA NA
4 IDBF Regular & Direct Dividend Quarterly/Annually Reinvestment / Payout/ SweepGrowth NA NA
5 IMIP Regular & Direct Dividend Monthly/ Quarterly Reinvestment / Payout/ SweepGrowth / Growth with Regular Cash Flow Plan (RCFP) NA NA
6 IGF Regular & Direct Dividend Quarterly/Annually Reinvestment / Payout/ SweepGrowth NA NA
7 IDOF Regular & Direct Dividend Quarterly/Annually Reinvestment / Payout/ SweepGrowth NA NA
8 INIF Regular & Direct Dividend NA Reinvestment / Payout/ SweepGrowth NA NA
9 INJIF Regular & Direct Dividend NA Reinvestment / Payout/ SweepGrowth NA NA
Statutory Details: IDBI Mutual Fund has been set up as a trust sponsored by IDBI Bank Ltd. with IDBI MF Trustee Company Ltd. as the Trustee (Trustee under the Indian Trusts Act, 1882) and with IDBI Asset Management Ltd. as the Investment Manager. Mutual fund investments are subject to market risks, read all scheme related documents carefully.
13
No Scheme Plan* Option Sub-option / Frequency of Dividend
Mode of dividend payment
10 IIT100EF Regular & Direct Dividend NA Reinvestment / Payout/ SweepGrowth NA NA
11 IEAF Regular & Direct Dividend NA Payout/ SweepGrowth NA NA
12 IDEF Regular & Direct Dividend NA Reinvestment / Payout/ SweepGrowth NA NA
13 IGFOF Regular & Direct Growth NA NA*All plans other than Direct plan will be treated as Regular Plan. For all schemes, Sweep facility is allowed only if dividend amount is Rs.1000/- & above.
The Mutual Fund is not assuring any dividend nor is it assuring that it will make any dividend distributions. All dividend distributions are subject to the availability of distributable surplus and would depend on the performance of the scheme(s) and will be at the discretion of the AMC.
Load Structure (for lumpsum & SIP)
Entry Load (For normal transactions / Switch-in and SIP) – Not applicableExit Load (Redemption/ Switch-out/ Transfer/ SWP):For INIF, INJIF, ILIQF, IUSTF & ISTBF : NilFor IDBF, IMIP, IIT100EF, IDEF & IGFOF- 1% for exit within 12 months from the date of allotment.For IEAF: Nil. (Statutory lock-in of 3 years).For IDBI Gilt Fund: 0.50% for exit within 30 days from the date of allotment.For IDOF: 2% for exit up to & including 18 months from the date of allotment.The exit load will be applicable for both normal transactions and SIP transactions. In case of SIP, the date of allotment for each installment for subscription will be reckoned for charging exit load on redemption.
14
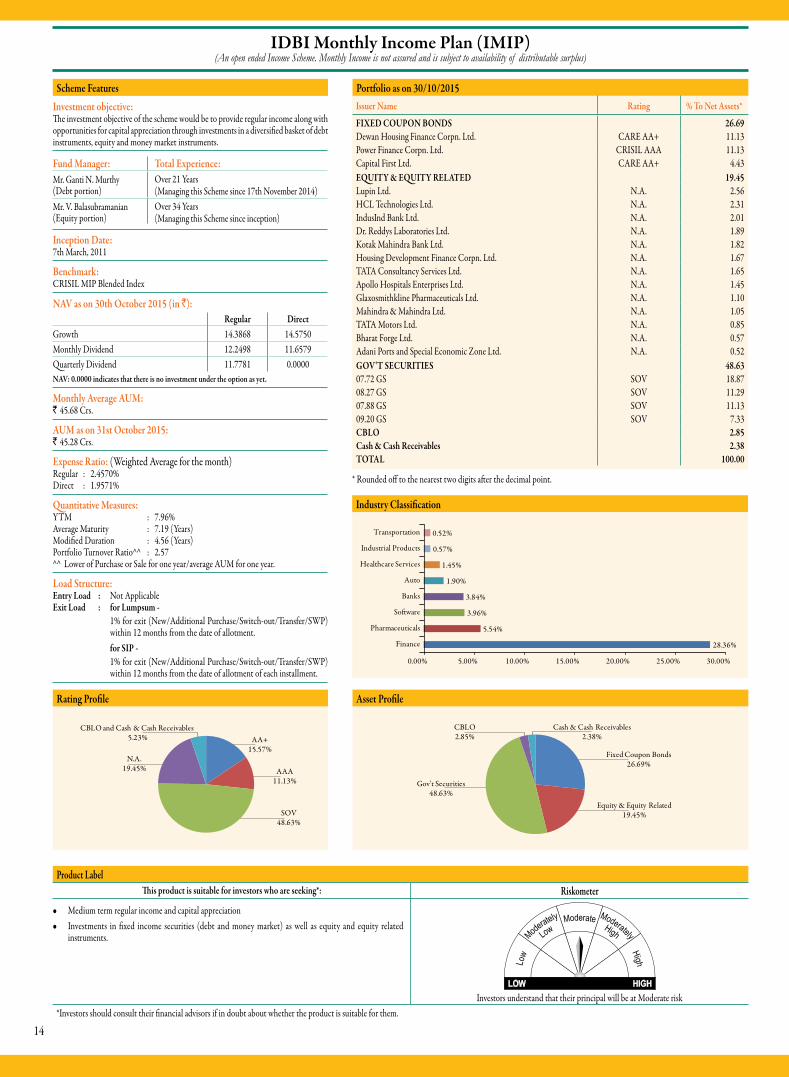
IDBI Monthly Income Plan (IMIP)(An open ended Income Scheme. Monthly Income is not assured and is subject to availability of distributable surplus)
Scheme FeaturesInvestment objective:The investment objective of the scheme would be to provide regular income along with opportunities for capital appreciation through investments in a diversified basket of debt instruments, equity and money market instruments.
Fund Manager: Total Experience:Mr. Ganti N. Murthy (Debt portion)
Over 21 Years (Managing this Scheme since 17th November 2014)
Mr. V. Balasubramanian (Equity portion)
Over 34 Years (Managing this Scheme since inception)
Inception Date: 7th March, 2011
Benchmark:CRISIL MIP Blended Index
NAV as on 30th October 2015 (in `):Regular Direct
Growth 14.3868 14.5750Monthly Dividend 12.2498 11.6579Quarterly Dividend 11.7781 0.0000NAV: 0.0000 indicates that there is no investment under the option as yet.
Monthly Average AUM: ` 45.68 Crs.
AUM as on 31st October 2015:` 45.28 Crs.
Expense Ratio: (Weighted Average for the month)Regular : 2.4570%Direct : 1.9571%
Quantitative Measures:YTM : 7.96%Average Maturity : 7.19 (Years)Modified Duration : 4.56 (Years)Portfolio Turnover Ratio^^ : 2.57^^ Lower of Purchase or Sale for one year/average AUM for one year.
Load Structure:Entry Load : Not ApplicableExit Load : for Lumpsum - 1% for exit (New/Additional Purchase/Switch-out/Transfer/SWP)
within 12 months from the date of allotment. for SIP - 1% for exit (New/Additional Purchase/Switch-out/Transfer/SWP)
within 12 months from the date of allotment of each installment.
Portfolio as on 30/10/2015
* Rounded off to the nearest two digits after the decimal point.
Industry Classification
28.36%
5.54%
3.96%
3.84%
1.90%
1.45%
0.57%
0.52%
0.00% 5.00% 10.00% 15.00% 20.00% 25.00% 30.00%
Finance
Pharmaceuticals
So�ware
Banks
Auto
Healthcare Services
Industrial Products
Transportation
Product LabelThis product is suitable for investors who are seeking*: Riskometer
l Medium term regular income and capital appreciationl Investments in fixed income securities (debt and money market) as well as equity and equity related
instruments.
Investors understand that their principal will be at Moderate risk*Investors should consult their financial advisors if in doubt about whether the product is suitable for them.
Rating Profile
AA+15.57%
AAA11.13%
SOV48.63%
N.A.19.45%
CBLO and Cash & Cash Receivables 5.23%
Asset Profile
Fixed Coupon Bonds26.69%
Equity & Equity Related19.45%
Gov't Securities48.63%
CBLO2.85%
Cash & Cash Receivables2.38%
Issuer Name Rating % To Net Assets*
FIXED COUPON BONDS 26.69Dewan Housing Finance Corpn. Ltd. CARE AA+ 11.13Power Finance Corpn. Ltd. CRISIL AAA 11.13Capital First Ltd. CARE AA+ 4.43EQUITY & EQUITY RELATED 19.45Lupin Ltd. N.A. 2.56HCL Technologies Ltd. N.A. 2.31IndusInd Bank Ltd. N.A. 2.01Dr. Reddys Laboratories Ltd. N.A. 1.89Kotak Mahindra Bank Ltd. N.A. 1.82Housing Development Finance Corpn. Ltd. N.A. 1.67TATA Consultancy Services Ltd. N.A. 1.65Apollo Hospitals Enterprises Ltd. N.A. 1.45Glaxosmithkline Pharmaceuticals Ltd. N.A. 1.10Mahindra & Mahindra Ltd. N.A. 1.05TATA Motors Ltd. N.A. 0.85Bharat Forge Ltd. N.A. 0.57Adani Ports and Special Economic Zone Ltd. N.A. 0.52GOV'T SECURITIES 48.6307.72 GS SOV 18.8708.27 GS SOV 11.2907.88 GS SOV 11.1309.20 GS SOV 7.33CBLO 2.85Cash & Cash Receivables 2.38TOTAL 100.00
15
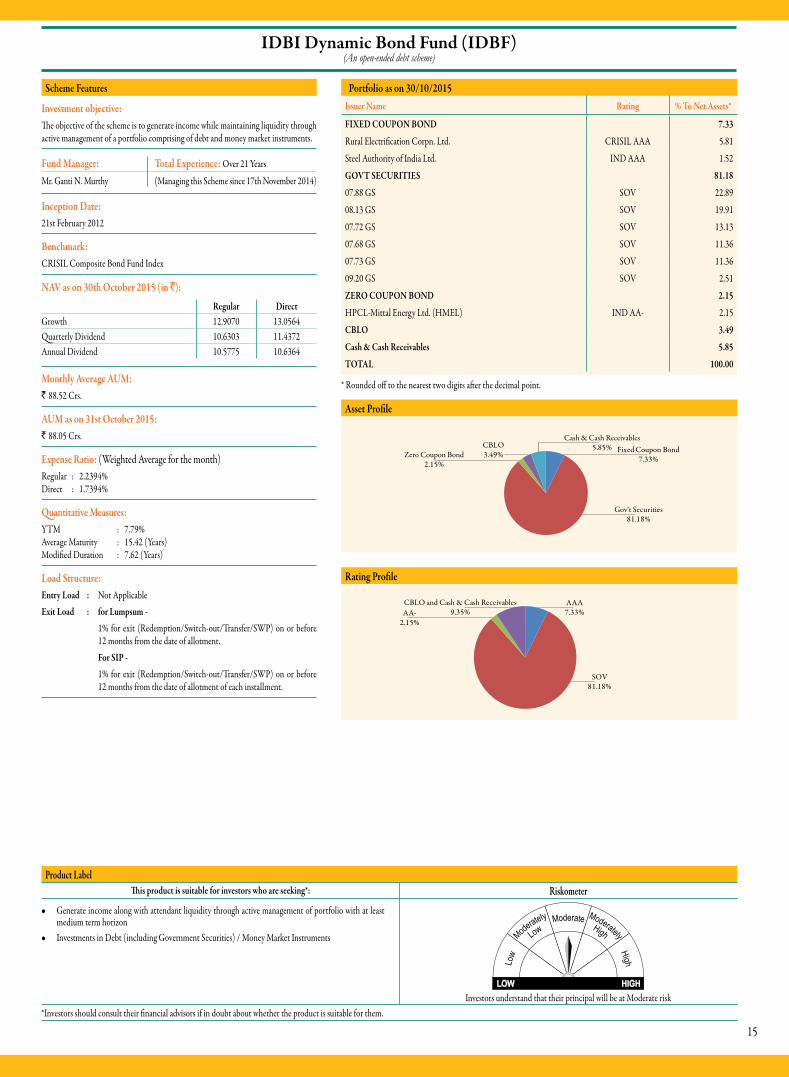
IDBI Dynamic Bond Fund (IDBF)(An open-ended debt scheme)
Portfolio as on 30/10/2015
* Rounded off to the nearest two digits after the decimal point.
Asset Profile
Fixed Coupon Bond7.33%
Gov't Securities81.18%
Zero Coupon Bond2.15%
CBLO3.49%
Cash & Cash Receivables5.85%
Rating Profile
AAA7.33%
SOV81.18%
AA-2.15%
CBLO and Cash & Cash Receivables9.35%
Product LabelThis product is suitable for investors who are seeking*: Riskometer
l Generate income along with attendant liquidity through active management of portfolio with at least medium term horizon
l Investments in Debt (including Government Securities) / Money Market Instruments
Investors understand that their principal will be at Moderate risk*Investors should consult their financial advisors if in doubt about whether the product is suitable for them.
Scheme Features
Investment objective:The objective of the scheme is to generate income while maintaining liquidity through active management of a portfolio comprising of debt and money market instruments.
Fund Manager: Total Experience: Over 21 Years
Mr. Ganti N. Murthy (Managing this Scheme since 17th November 2014)
Inception Date: 21st February 2012
Benchmark:CRISIL Composite Bond Fund Index
NAV as on 30th October 2015 (in `):
Regular DirectGrowth 12.9070 13.0564Quarterly Dividend 10.6303 11.4372Annual Dividend 10.5775 10.6364
Monthly Average AUM: ` 88.52 Crs.
AUM as on 31st October 2015: ` 88.05 Crs.
Expense Ratio: (Weighted Average for the month)Regular : 2.2394% Direct : 1.7394%
Quantitative Measures:YTM : 7.79% Average Maturity : 15.42 (Years) Modified Duration : 7.62 (Years)
Load Structure:Entry Load : Not ApplicableExit Load : for Lumpsum - 1% for exit (Redemption/Switch-out/Transfer/SWP) on or before
12 months from the date of allotment. For SIP - 1% for exit (Redemption/Switch-out/Transfer/SWP) on or before
12 months from the date of allotment of each installment.
Issuer Name Rating % To Net Assets*
FIXED COUPON BOND 7.33
Rural Electrification Corpn. Ltd. CRISIL AAA 5.81
Steel Authority of India Ltd. IND AAA 1.52
GOVT SECURITIES 81.18
07.88 GS SOV 22.89
08.13 GS SOV 19.91
07.72 GS SOV 13.13
07.68 GS SOV 11.36
07.73 GS SOV 11.36
09.20 GS SOV 2.51
ZERO COUPON BOND 2.15
HPCL-Mittal Energy Ltd. (HMEL) IND AA- 2.15
CBLO 3.49
Cash & Cash Receivables 5.85
TOTAL 100.00

16
IDBI Gilt Fund (IGF)(An open-ended dedicated gilt scheme)
Portfolio as on 30/10/2015
* Rounded off to the nearest two digits after the decimal point.
Asset Profile
GOVT SECURITIES94.51%
CBLO3.84%
Cash & Cash Receivables1.64%
Product LabelThis product is suitable for investors who are seeking*: Riskometer
l Long term regular income along with capital appreciation with at least medium term horizonl Investments in dated Central & State Government Securities / T-Bills / Money Market Instrument
Investors understand that their principal will be at Moderate risk*Investors should consult their financial advisors if in doubt about whether the product is suitable for them.
Issuer Name Rating % to Net Assets
GOVT SECURITIES 94.51
09.23 GS SOV 28.26
08.13 GS SOV 66.25
CBLO 3.84
Cash & Cash Receivables 1.64
TOTAL 100.00
Scheme Features
Investment objective:The investment objective of the scheme would be to provide regular income along with opportunities for capital appreciation through investments in a diversified basket of central government dated securities, state government securities and treasury bills. However, there can be no assurance that the investment objective of the scheme will be realized / achieved.
Fund Manager: Total Experience: Over 21 Years
Mr. Ganti N. Murthy (Managing this Scheme since 17th November 2014)
Inception Date: 21st December, 2012
Benchmark:CRISIL Gilt Index
NAV as on 30th October 2015 (in `):
Regular DirectGrowth 12.7664 12.8699Quarterly Dividend 10.3353 10.8648Annual Dividend 10.8043 10.8669
Monthly Average AUM: ` 20.27 Crs.
AUM as on 31st October 2015: ` 20.24 Crs.
Expense Ratio: (Weighted Average for the month)Regular : 1.7862% Direct : 1.0862%
Quantitative Measures:YTM : 7.85% Average Maturity : 28.28 (Years) Modified Duration : 10.54 (Years)
Load Structure:Entry Load : Not ApplicableExit Load : for Lumpsum - 0.50% for exit (Redemption/Switch-out/Transfer/SWP) within
30 days from the date of allotment. For SIP - 0.50% for exit (Redemption/Switch-out/Transfer/SWP) within
30 days from the date of allotment of each installment.
17
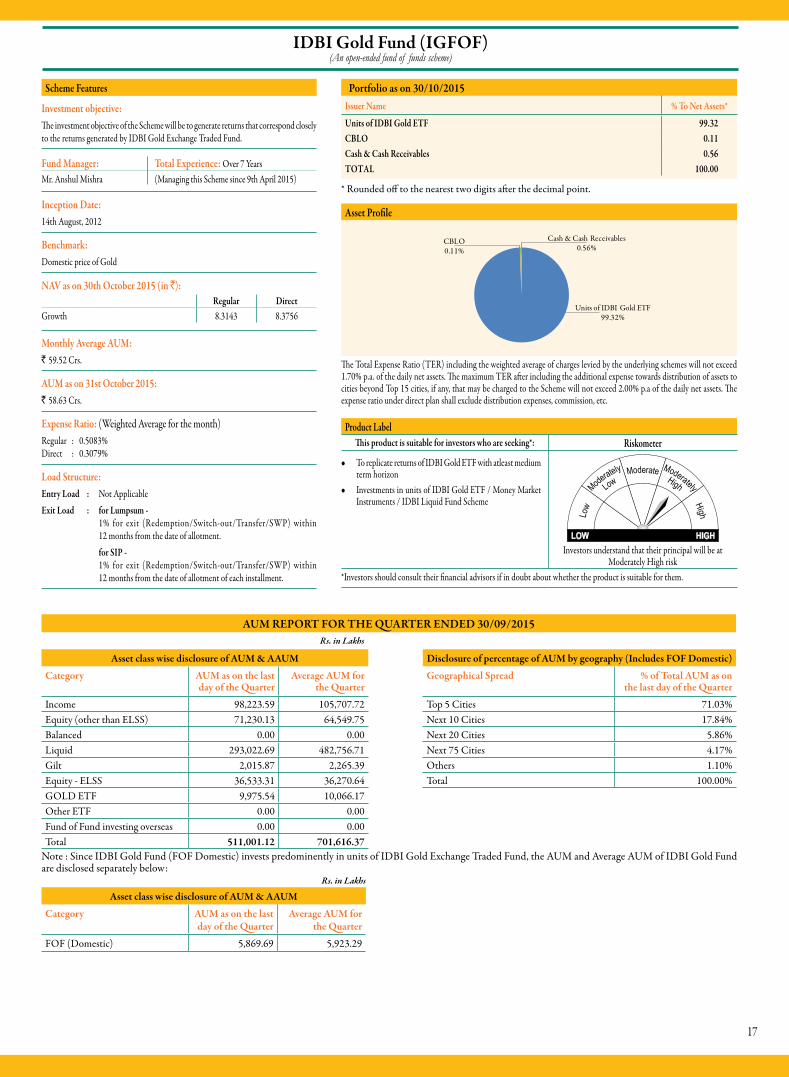
IDBI Gold Fund (IGFOF)(An open-ended fund of funds scheme)
Portfolio as on 30/10/2015Issuer Name % To Net Assets*
Units of IDBI Gold ETF 99.32CBLO 0.11Cash & Cash Receivables 0.56TOTAL 100.00
* Rounded off to the nearest two digits after the decimal point.
Asset Profile
Units of IDBI Gold ETF99.32%
CBLO0.11%
Cash & Cash Receivables0.56%
The Total Expense Ratio (TER) including the weighted average of charges levied by the underlying schemes will not exceed 1.70% p.a. of the daily net assets. The maximum TER after including the additional expense towards distribution of assets to cities beyond Top 15 cities, if any, that may be charged to the Scheme will not exceed 2.00% p.a of the daily net assets. The expense ratio under direct plan shall exclude distribution expenses, commission, etc.
Product LabelThis product is suitable for investors who are seeking*: Riskometer
l To replicate returns of IDBI Gold ETF with atleast medium term horizon
l Investments in units of IDBI Gold ETF / Money Market Instruments / IDBI Liquid Fund Scheme
Investors understand that their principal will be at Moderately High risk
*Investors should consult their financial advisors if in doubt about whether the product is suitable for them.
Scheme Features
Investment objective:The investment objective of the Scheme will be to generate returns that correspond closely to the returns generated by IDBI Gold Exchange Traded Fund.
Fund Manager: Total Experience: Over 7 YearsMr. Anshul Mishra (Managing this Scheme since 9th April 2015)
Inception Date: 14th August, 2012
Benchmark:Domestic price of Gold
NAV as on 30th October 2015 (in `):Regular Direct
Growth 8.3143 8.3756
Monthly Average AUM: ` 59.52 Crs.
AUM as on 31st October 2015: ` 58.63 Crs.
Expense Ratio: (Weighted Average for the month)Regular : 0.5083% Direct : 0.3079%
Load Structure:Entry Load : Not ApplicableExit Load : for Lumpsum - 1% for exit (Redemption/Switch-out/Transfer/SWP) within
12 months from the date of allotment. for SIP - 1% for exit (Redemption/Switch-out/Transfer/SWP) within
12 months from the date of allotment of each installment.
AUM REPORT FOR THE QUARTER ENDED 30/09/2015Rs. in Lakhs
Asset class wise disclosure of AUM & AAUM Disclosure of percentage of AUM by geography (Includes FOF Domestic)
Category AUM as on the last day of the Quarter
Average AUM for the Quarter
Geographical Spread % of Total AUM as on the last day of the Quarter
Income 98,223.59 105,707.72 Top 5 Cities 71.03%Equity (other than ELSS) 71,230.13 64,549.75 Next 10 Cities 17.84%Balanced 0.00 0.00 Next 20 Cities 5.86%Liquid 293,022.69 482,756.71 Next 75 Cities 4.17%Gilt 2,015.87 2,265.39 Others 1.10%Equity - ELSS 36,533.31 36,270.64 Total 100.00%GOLD ETF 9,975.54 10,066.17Other ETF 0.00 0.00Fund of Fund investing overseas 0.00 0.00Total 511,001.12 701,616.37
Note : Since IDBI Gold Fund (FOF Domestic) invests predominently in units of IDBI Gold Exchange Traded Fund, the AUM and Average AUM of IDBI Gold Fund are disclosed separately below:
Rs. in Lakhs
Asset class wise disclosure of AUM & AAUM
Category AUM as on the last day of the Quarter
Average AUM for the Quarter
FOF (Domestic) 5,869.69 5,923.29
18
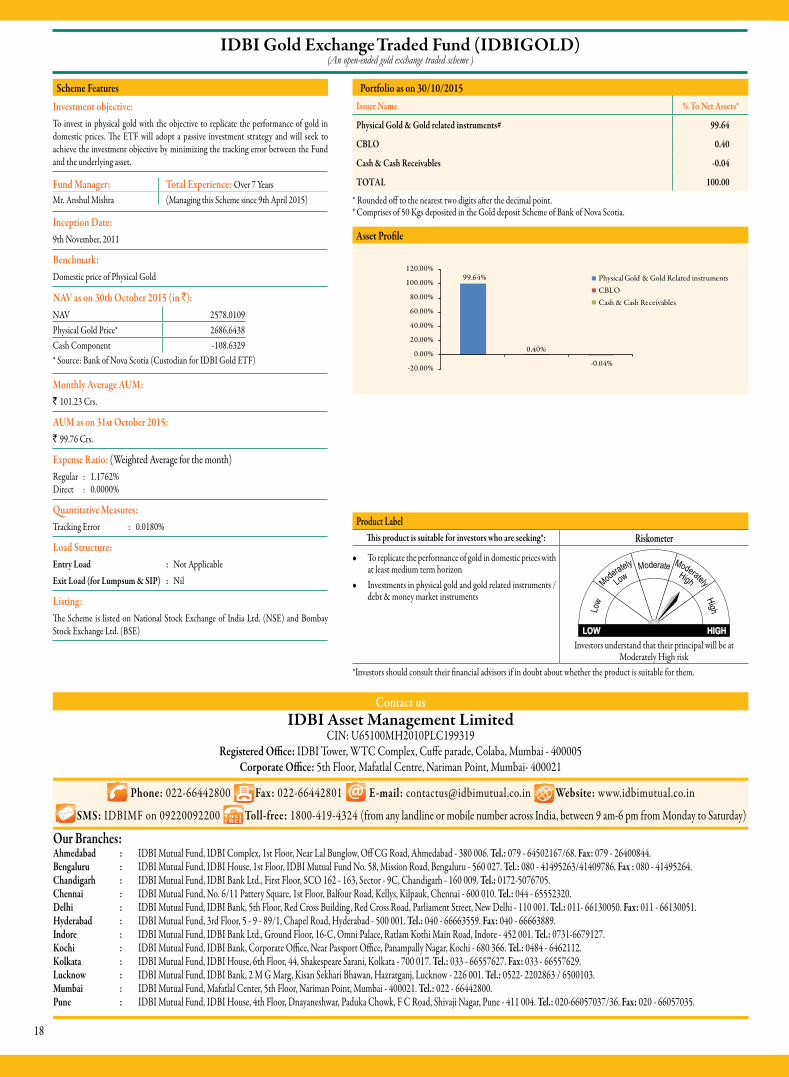
IDBI Gold Exchange Traded Fund (IDBIGOLD)(An open-ended gold exchange traded scheme )
Portfolio as on 30/10/2015Issuer Name % To Net Assets*
Physical Gold & Gold related instruments# 99.64
CBLO 0.40
Cash & Cash Receivables -0.04
TOTAL 100.00
* Rounded off to the nearest two digits after the decimal point.# Comprises of 50 Kgs deposited in the Gold deposit Scheme of Bank of Nova Scotia.
Asset Profile
0.40%
-0.04%-20.00%
0.00%
20.00%
40.00%
60.00%
80.00%
100.00%
120.00%99.64% Physical Gold & Gold Related instruments
CBLOCash & Cash Receivables
Our Branches:Ahmedabad : IDBI Mutual Fund, IDBI Complex, 1st Floor, Near Lal Bunglow, Off CG Road, Ahmedabad - 380 006. Tel.: 079 - 64502167/68. Fax: 079 - 26400844.Bengaluru : IDBI Mutual Fund, IDBI House, 1st Floor, IDBI Mutual Fund No. 58, Mission Road, Bengaluru - 560 027. Tel.: 080 - 41495263/41409786. Fax : 080 - 41495264.Chandigarh : IDBI Mutual Fund, IDBI Bank Ltd., First Floor, SCO 162 - 163, Sector - 9C, Chandigarh - 160 009. Tel.: 0172-5076705.Chennai : IDBI Mutual Fund, No. 6/11 Pattery Square, 1st Floor, Balfour Road, Kellys, Kilpauk, Chennai - 600 010. Tel.: 044 - 65552320.Delhi : IDBI Mutual Fund, IDBI Bank, 5th Floor, Red Cross Building, Red Cross Road, Parliament Street, New Delhi - 110 001. Tel.: 011- 66130050. Fax: 011 - 66130051.Hyderabad : IDBI Mutual Fund, 3rd Floor, 5 - 9 - 89/1, Chapel Road, Hyderabad - 500 001. Tel.: 040 - 66663559. Fax: 040 - 66663889.Indore : IDBI Mutual Fund, IDBI Bank Ltd., Ground Floor, 16-C, Omni Palace, Ratlam Kothi Main Road, Indore - 452 001. Tel.: 0731-6679127.Kochi : IDBI Mutual Fund, IDBI Bank, Corporate Office, Near Passport Office, Panampally Nagar, Kochi - 680 366. Tel.: 0484 - 6462112.Kolkata : IDBI Mutual Fund, IDBI House, 6th Floor, 44, Shakespeare Sarani, Kolkata - 700 017. Tel.: 033 - 66557627. Fax: 033 - 66557629.Lucknow : IDBI Mutual Fund, IDBI Bank, 2 M G Marg, Kisan Sekhari Bhawan, Hazratganj, Lucknow - 226 001. Tel.: 0522- 2202863 / 6500103.Mumbai : IDBI Mutual Fund, Mafatlal Center, 5th Floor, Nariman Point, Mumbai - 400021. Tel.: 022 - 66442800.Pune : IDBI Mutual Fund, IDBI House, 4th Floor, Dnayaneshwar, Paduka Chowk, F C Road, Shivaji Nagar, Pune - 411 004. Tel.: 020-66057037/36. Fax: 020 - 66057035.
Phone: 022-66442800 Fax: 022-66442801 E-mail: [email protected] Website: www.idbimutual.co.in
SMS: IDBIMF on 09220092200 Toll-free: 1800-419-4324 (from any landline or mobile number across India, between 9 am-6 pm from Monday to Saturday)
Contact usIDBI Asset Management Limited
CIN: U65100MH2010PLC199319Registered Office: IDBI Tower, WTC Complex, Cuffe parade, Colaba, Mumbai - 400005
Corporate Office: 5th Floor, Mafatlal Centre, Nariman Point, Mumbai- 400021
Product LabelThis product is suitable for investors who are seeking*: Riskometer
l To replicate the performance of gold in domestic prices with at least medium term horizon
l Investments in physical gold and gold related instruments / debt & money market instruments
Investors understand that their principal will be at Moderately High risk
*Investors should consult their financial advisors if in doubt about whether the product is suitable for them.
Scheme FeaturesInvestment objective:To invest in physical gold with the objective to replicate the performance of gold in domestic prices. The ETF will adopt a passive investment strategy and will seek to achieve the investment objective by minimizing the tracking error between the Fund and the underlying asset.
Fund Manager: Total Experience: Over 7 YearsMr. Anshul Mishra (Managing this Scheme since 9th April 2015)
Inception Date: 9th November, 2011
Benchmark:Domestic price of Physical Gold
NAV as on 30th October 2015 (in `):NAV 2578.0109Physical Gold Price* 2686.6438Cash Component -108.6329* Source: Bank of Nova Scotia (Custodian for IDBI Gold ETF)
Monthly Average AUM:` 101.23 Crs.
AUM as on 31st October 2015:` 99.76 Crs.
Expense Ratio: (Weighted Average for the month)Regular : 1.1762% Direct : 0.0000%
Quantitative Measures:Tracking Error : 0.0180%
Load Structure:Entry Load : Not ApplicableExit Load (for Lumpsum & SIP) : Nil
Listing:The Scheme is listed on National Stock Exchange of India Ltd. (NSE) and Bombay Stock Exchange Ltd. (BSE)
19
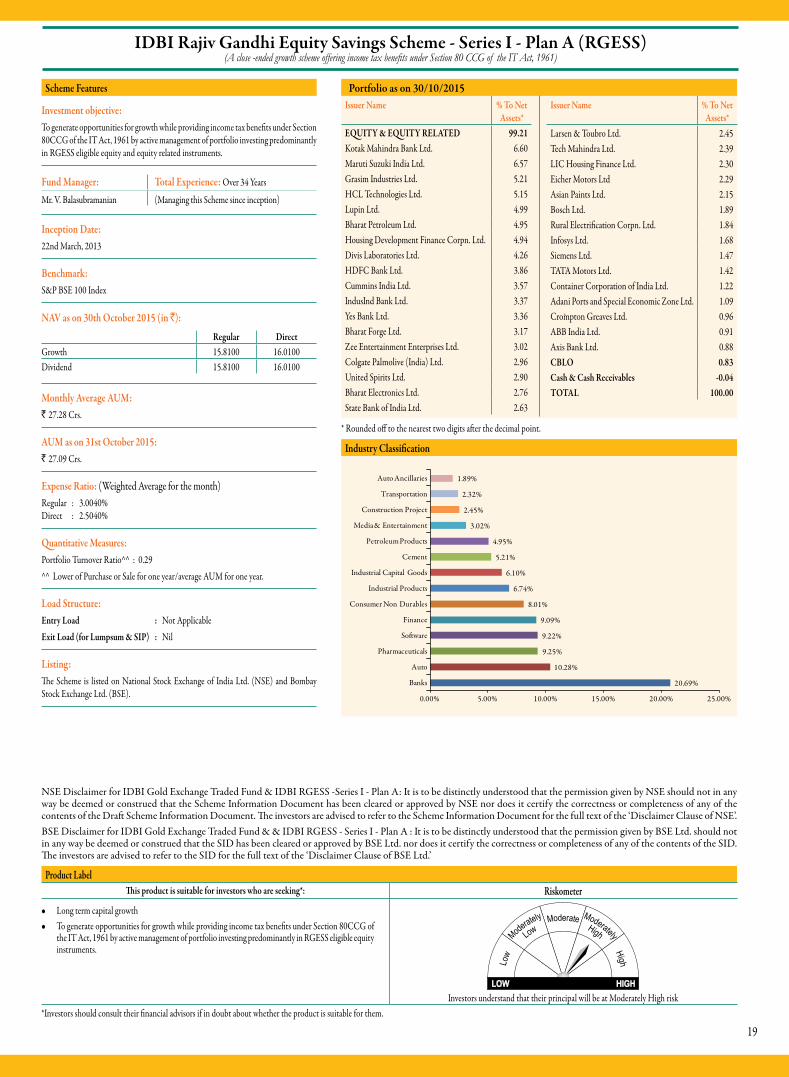
Issuer Name % To Net Assets*
EQUITY & EQUITY RELATED 99.21Kotak Mahindra Bank Ltd. 6.60Maruti Suzuki India Ltd. 6.57Grasim Industries Ltd. 5.21HCL Technologies Ltd. 5.15Lupin Ltd. 4.99Bharat Petroleum Ltd. 4.95Housing Development Finance Corpn. Ltd. 4.94Divis Laboratories Ltd. 4.26HDFC Bank Ltd. 3.86Cummins India Ltd. 3.57IndusInd Bank Ltd. 3.37Yes Bank Ltd. 3.36Bharat Forge Ltd. 3.17Zee Entertainment Enterprises Ltd. 3.02Colgate Palmolive (India) Ltd. 2.96United Spirits Ltd. 2.90Bharat Electronics Ltd. 2.76State Bank of India Ltd. 2.63
Issuer Name % To Net Assets*
Larsen & Toubro Ltd. 2.45Tech Mahindra Ltd. 2.39LIC Housing Finance Ltd. 2.30Eicher Motors Ltd 2.29Asian Paints Ltd. 2.15Bosch Ltd. 1.89Rural Electrification Corpn. Ltd. 1.84Infosys Ltd. 1.68Siemens Ltd. 1.47TATA Motors Ltd. 1.42Container Corporation of India Ltd. 1.22Adani Ports and Special Economic Zone Ltd. 1.09Crompton Greaves Ltd. 0.96ABB India Ltd. 0.91Axis Bank Ltd. 0.88CBLO 0.83Cash & Cash Receivables -0.04TOTAL 100.00
IDBI Rajiv Gandhi Equity Savings Scheme - Series I - Plan A (RGESS)(A close -ended growth scheme offering income tax benefits under Section 80 CCG of the IT Act, 1961)
Portfolio as on 30/10/2015
* Rounded off to the nearest two digits after the decimal point.
Industry Classification
20.69%
10.28%
9.25%
9.22%
9.09%
8.01%
6.74%
6.10%
5.21%
4.95%
3.02%
2.45%
2.32%
1.89%
0.00% 5.00% 10.00% 15.00% 20.00% 25.00%
Banks
Auto
Pharmaceuticals
So�ware
Finance
Consumer Non Durables
Industrial Products
Industrial Capital Goods
Cement
Petroleum Products
Media & Entertainment
Construction Project
Transportation
Auto Ancillaries
NSE Disclaimer for IDBI Gold Exchange Traded Fund & IDBI RGESS -Series I - Plan A: It is to be distinctly understood that the permission given by NSE should not in any way be deemed or construed that the Scheme Information Document has been cleared or approved by NSE nor does it certify the correctness or completeness of any of the contents of the Draft Scheme Information Document. The investors are advised to refer to the Scheme Information Document for the full text of the ‘Disclaimer Clause of NSE’.BSE Disclaimer for IDBI Gold Exchange Traded Fund & & IDBI RGESS - Series I - Plan A : It is to be distinctly understood that the permission given by BSE Ltd. should not in any way be deemed or construed that the SID has been cleared or approved by BSE Ltd. nor does it certify the correctness or completeness of any of the contents of the SID. The investors are advised to refer to the SID for the full text of the ‘Disclaimer Clause of BSE Ltd.’
Product LabelThis product is suitable for investors who are seeking*: Riskometer
l Long term capital growthl To generate opportunities for growth while providing income tax benefits under Section 80CCG of
the IT Act, 1961 by active management of portfolio investing predominantly in RGESS eligible equity instruments.
Investors understand that their principal will be at Moderately High risk*Investors should consult their financial advisors if in doubt about whether the product is suitable for them.
Scheme Features
Investment objective:To generate opportunities for growth while providing income tax benefits under Section 80CCG of the IT Act, 1961 by active management of portfolio investing predominantly in RGESS eligible equity and equity related instruments.
Fund Manager: Total Experience: Over 34 Years
Mr. V. Balasubramanian (Managing this Scheme since inception)
Inception Date: 22nd March, 2013
Benchmark:S&P BSE 100 Index
NAV as on 30th October 2015 (in `):
Regular DirectGrowth 15.8100 16.0100Dividend 15.8100 16.0100
Monthly Average AUM: ` 27.28 Crs.
AUM as on 31st October 2015: ` 27.09 Crs.
Expense Ratio: (Weighted Average for the month)Regular : 3.0040% Direct : 2.5040%
Quantitative Measures:Portfolio Turnover Ratio^^ : 0.29^^ Lower of Purchase or Sale for one year/average AUM for one year.
Load Structure:Entry Load : Not ApplicableExit Load (for Lumpsum & SIP) : Nil
Listing: The Scheme is listed on National Stock Exchange of India Ltd. (NSE) and Bombay Stock Exchange Ltd. (BSE).

20
DIVIDEND HISTORY
IDBI Equity Advantage Fund (IEAF) (Face Value: ` 10/- Per Unit)
Record Date Individual / HUF (in `)
Others (in `)
Cum Dividend NAV* (in `)
Ex Dividend NAV (in `)
IDBI Equity Advantage Fund - Dividend (Regular)15th September, 2015 1.4000 1.4000 19.0300 17.520017th September, 2014 1.0000 1.0000 16.5700 15.8300IDBI Equity Advantage Fund - Dividend (Direct)15th September, 2015 1.4000 1.4000 19.3200 17.810017th September, 2014 1.0000 1.0000 16.6800 15.9400
IDBI India Top 100 Equity Fund (IIT100EF) (Face Value: ` 10/- Per Unit)
Record Date Individual / HUF (in `)
Others (in `)
Cum Dividend NAV* (in `)
Ex Dividend NAV (in `)
IDBI India Top 100 Equity Fund - Dividend (Regular)25th May, 2015 1.0000 1.0000 18.1800 17.150022nd May, 2014 1.0000 1.0000 14.6100 13.8400IDBI India Top 100 Equity Fund - Dividend (Direct)25th May, 2015 1.0000 1.0000 18.4400 17.410022nd May, 2014 1.0000 1.0000 14.7400 14.7400
IDBI Diversified Equity Fund (IDEF) (Face Value: ` 10/- Per Unit)
Record Date Individual / HUF (in `)
Others (in `)
Cum Dividend NAV* (in `)
Ex Dividend NAV (in `)
IDBI Diversified Equity Fund - Dividend (Regular)25th May, 2015 1.0000 1.0000 16.7900 15.7400IDBI Diversified Equity Fund - Dividend (Direct)25th May, 2015 1.0000 1.0000 16.8900 15.8400
IDBI Nifty Index Fund (INIF) ( Face Value: ` 10/- Per Unit)
Record Date Individual / HUF (in `)
Others (in `)
Cum Dividend NAV* (in `)
Ex Dividend NAV (in `)
IDBI Nifty Index Fund - Dividend (Regular)14th October, 2010 0.4000 0.4000 11.5740 10.962831st August, 2010 0.1200 0.0000 10.2883 10.2886
IDBI Liquid Fund (ILIQF) (Face Value: ` 1000/- Per Unit)
Record Date Individual / HUF (in `)
Others (in `)
Cum Dividend NAV* (in `)
Ex Dividend NAV (in `)
IDBI Liquid Fund - Monthly Dividend (Regular)26th October, 2015 4.2697 3.9599 1009.2372 1003.528628th September, 2015 5.0953 4.7326 1010.3679 1003.528625th August, 2015 4.4451 4.1183 1009.4728 1003.5285IDBI Liquid Fund - Monthly Dividend (Direct)25th October, 2015 4.3154 0.0000 1007.3997 1001.630228th September, 2015 5.1536 0.0000 1008.5452 1001.627525th August, 2015 4.5066 0.0000 1007.6546 1001.6275
IDBI Ultra Short Term Fund (IUSTF) (Face Value: ` 1000/- Per Unit)
Record Date Individual / HUF (in `)
Others (in `)
Cum Dividend NAV* (in `)
Ex Dividend NAV (in `)
IDBI Ultra Short Term Fund - Monthly Dividend (Regular)26th October, 2015 3.1405 2.9096 1026.5228 1022.382528th September, 2015 4.0320 3.7356 1024.7380 1021.087625th August, 2015 4.0364 3.7397 1023.9325 1018.5353IDBI Ultra Short Term Fund - Monthly Dividend (Direct)26th May, 2014 5.8651 5.6171 1095.2741 1088.003625th April, 2014 3.7781 3.6183 1091.7597 1087.686027th May, 2013 6.1592 5.2478 1015.8688 1009.0185
IDBI Short Term Bond Fund (ISTBF) (Face Value: ` 10/- Per Unit)
Record Date Individual / HUF (in `)
Others (in `)
Cum Dividend NAV* (in `)
Ex Dividend NAV (in `)
IDBI Short Term Bond Fund - Monthly Dividend (Regular)26th October, 2015 0.0253 0.0234 10.8723 10.838828th September, 2015 0.0226 0.0210 10.8103 10.802327th July, 2015 0.0485 0.0450 10.7522 10.6898IDBI Short Term Bond Fund - Monthly Dividend (Direct)25th June, 2014 0.0443 0.0424 10.9455 10.894526th May, 2014 0.0748 0.0716 10.9656 10.873625th April, 2014 0.0460 0.0440 10.8967 10.8443
IDBI Debt Opportunities Fund (IDOF) (Face Value: ` 10/- Per Unit)
Record Date Individual / HUF (in `)
Others (in `)
Cum Dividend NAV* (in `)
Ex Dividend NAV (in `)
IDBI Debt Opportunities Fund - Quarterly Dividend (Regular)19th October, 2015 0.1189 0.1101 10.5176 10.35526th July, 2015 0.1780 0.1649 10.4910 10.248427th March, 2015 0.3184 0.2953 10.6771 10.2458IDBI Debt Opportunities Fund - Quarterly Dividend (Direct)19th October, 2015 0.1311 0.0000 10.6789 10.49996th July, 2015 0.1348 0.0000 10.5644 10.381927th March, 2015 0.3108 0.0000 10.7155 10.2955IDBI Debt Opportunities Fund - Annual Dividend (Regular)27th March, 2015 0.6304 0.0000 11.0963 10.2355
IDBI Monthly Income Plan (IMIP) (Face Value: ` 10/- Per Unit)
Record Date Individual / HUF (in `)
Others (in `)
Cum Dividend NAV* (in `)
Ex Dividend NAV (in `)
IDBI Monthly Income Plan - Monthly Dividend (Regular)26th December, 2013 0.0545 0.0522 10.2703 10.216625th November, 2013 0.0468 0.0448 10.2157 10.149325th July, 2013 0.0545 0.0522 10.2261 10.1763IDBI Monthly Income Plan - Monthly Dividend (Direct)26th October, 2015 0.0294 0.0000 11.7557 11.689028th September, 2015 0.0471 0.0000 11.6589 11.674427th July, 2015 0.0273 0.0000 11.5658 11.5278IDBI Monthly Income Plan - Quarterly Dividend (Regular)6th July, 2015 0.1150 0.1065 11.7568 11.583727th March, 2015 0.2385 0.2212 12.0213 11.735929th September, 2014 0.1948 0.1866 11.4806 11.2250IDBI Monthly Income Plan - Quarterly Dividend (Direct)29th September, 2014 0.1948 0.1866 11.5885 11.333017th April, 2014 0.0935 0.0896 10.8922 10.77533rd April, 2013 0.1839 0.1567 10.4314 10.2030
IDBI Dynamic Bond Fund (IDBF) (Face Value: ` 10/- Per Unit)
Record Date Individual / HUF (in `)
Others (in `)
Cum Dividend NAV* (in `)
Ex Dividend NAV (in `)
IDBI Dynamic Bond Fund - Quarterly Dividend (Regular)19th October, 2015 0.0585 0.0542 10.7392 10.66056th July, 2015 0.0771 0.0715 10.5050 10.388027th March, 2015 0.4248 0.3940 11.0803 10.5148IDBI Dynamic Bond Fund - Quarterly Dividend (Direct)29th September, 2014 0.3507 0.3358 10.7090 10.244517th April, 2014 0.3896 0.3732 10.7673 10.2862IDBI Dynamic Bond Fund - Annual Dividend (Regular)27th March, 2015 0.7992 0.7412 11.3590 10.278217th April, 2014 0.1403 0.1343 10.3119 10.149628th March, 2013 0.7358 0.6269 10.9788 10.1417IDBI Dynamic Bond Fund - Annual Dividend (Direct)27th March, 2015 0.8203 0.7607 11.4143 10.305117th April, 2014 0.1636 0.1567 10.3474 10.1555
IDBI Gilt Fund (IGF) (Face Value: ` 10/- Per Unit)
Record Date Individual / HUF (in `)
Others (in `)
Cum Dividend NAV* (in `)
Ex Dividend NAV (in `)
IDBI Gilt Fund - Quarterly Dividend (Regular)19th October, 2015 0.1533 0.1421 10.5736 10.38556th July, 2015 0.0869 0.0805 10.3237 10.193627th March, 2015 0.5607 0.5199 11.0875 10.3432IDBI Gilt Fund - Quarterly Dividend (Direct)19th October, 2015 0.1639 0.1518 11.1166 10.91536th July, 2015 0.0961 0.0890 10.8506 10.707327th March, 2015 1.0183 0.9444 12.2354 10.8638IDBI Gilt Fund - Annual Dividend (Regular)27th March, 2015 0.9936 0.9215 11.8111 10.472217th April, 2014 0.3585 0.3433 10.6705 10.2259IDBI Gilt Fund - Annual Dividend (Direct)27th March, 2015 0.9768 0.0000 11.8291 10.513717th April, 2014 0.3896 0.3732 10.7019 10.2176
NAV: 0.0000 indicates that there is no investment under the option as yet.Past performance may or may not be sustained in the future. After the payment of dividend, the per unit NAV falls to the extent of the dividend payout and distribution taxes, if any. For complete dividend history including daily dividend history, please refer to our website. * NAV of the record date.

21
SCHEME PERFORMANCE (As on 30th September, 2015)
IDBI Equity Advantage Fund (IEAF) Inception date: 10th September 2013
PeriodReturns (in %)
IDBI Equity Advantage Fund (G)
S&P BSE 200 Index#
S&P BSE SENSEX##
30th Sept, 2014 to 30th Sept, 2015 19.6712 3.0807 -1.7862
30th Sept, 2013 to 30th Sept, 2014 69.1162 42.5039 37.4140
Since Inception upto 30th Sept, 2015 41.4098 19.5749 13.9562
Return on investment of Rs.10000/- 20380.00 14438.90 13079.32
IDBI India Top 100 Equity Fund (IIT100EF) Inception date: 15th May 2012
PeriodReturns (in %)
IDBI India Top 100 Equity Fund (G)
Nifty 100 Index#
Nifty 50 Index##
30th Sept, 2014 to 30th Sept, 2015 12.2052 2.0529 -0.1996
30th Sept, 2013 to 30th Sept, 2014 44.0952 40.6295 38.8733
28th Sept, 2012 to 30th Sept, 2013 3.1551 0.6788 0.5611
Since Inception upto 30th Sept, 2015 20.9821 16.2859 15.1013
Return on investment of Rs.10000/- 19030.00 16647.75 16081.78
IDBI Diversified Equity Fund (IDEF) Inception date: 28th March, 2014
PeriodReturns (in %)
IDBI Diversified Equity Fund (G)
S&P BSE 500# S&P BSE SENSEX##
30th Sept, 2014 to 30th Sept, 2015 17.2148 3.1947 -1.7862
Since Inception upto 30th Sept, 2015 40.7326 17.2571 11.0085
Return on investment of Rs.10000/- 16750.00 12716.62 11707.64
IDBI Nifty Index Fund (INIF) Inception date: 25th June, 2010
PeriodReturns (in %)
IDBI Nifty Index Fund (G)
Nifty 50 Index-TRI#
Nifty 50 Index##
30th Sept, 2014 to 30th Sept, 2015 -0.5970 0.8711 -0.1996
30th Sept, 2013 to 30th Sept, 2014 38.4872 40.5137 38.8733
28th Sept, 2012 to 30th Sept, 2013 1.0050 1.8200 0.5611
Since Inception upto 30th Sept, 2015 7.9798 9.4081 8.1172
Return on investment of Rs.10000/- 14985.30 16059.51 15086.02
IDBI Nifty Junior Index Fund (INJIF) Inception date: 20th September 2010
PeriodReturns (in %)
IDBI Nifty Junior Index Fund (G)
Nifty Next 50 Index-TRI#
Nifty 50 Index##
30th Sept, 2014 to 30th Sept, 2015 13.9027 16.3723 -0.1996
30th Sept, 2013 to 30th Sept, 2014 50.0381 53.8069 38.8733
28th Sept, 2012 to 30th Sept, 2013 1.6307 2.7008 0.5611
Since Inception upto 30th Sept, 2015 8.4502 10.2687 5.8197
Return on investment of Rs.10000/- 15038.80 16350.89 13291.47
IDBI Liquid Fund (ILIQF) Inception date: 9th July, 2010
PeriodReturns (in %)
IDBI Liquid Fund (G)
CRISIL Liquid Fund Index#
CRISIL 1 Yr T-Bill Index##
30th Sept, 2014 to 30th Sept, 2015 8.5482 8.5573 8.8559
30th Sept, 2013 to 30th Sept, 2014 9.2799 9.4862 8.3548
28th Sept, 2012 to 30th Sept, 2013 8.8045 8.5436 5.6534
31st Aug, 2015 to 30th Sept, 2015 7.6848 8.2010 11.1977
16th Sept, 2015 to 30th Sept, 2015 7.9015 9.7755 14.6569
23rd Sept, 2015 to 30th Sept, 2015 8.1844 11.0362 22.3185
Since Inception upto 30th Sept, 2015 8.8424 8.4777 7.0436
Return on investment of Rs.10000/- 15576.12 15305.04 14275.99
IDBI Ultra Short Term Fund (IUSTF) Inception date: 3rd September, 2010
PeriodReturns (in %)
IDBI Ultra Short Term Fund (G)
CRISIL Liquid Fund Index#
CRISIL 1 Yr T-Bill Index##
30th Sept, 2014 to 30th Sept, 2015 8.3744 8.5573 8.8559
30th Sept, 2013 to 30th Sept, 2014 9.0054 9.4862 8.3548
28th Sept, 2012 to 30th Sept, 2013 8.9188 8.5436 5.6534
Since Inception upto 30th Sept, 2015 8.9302 8.5656 7.2033
Return on investment of Rs.10000/- 15438.03 15177.46 14235.05
IDBI Short Term Bond Fund (ISTBF) Inception date: 23rd March 2011
PeriodReturns (in %)
IDBI Short Term Bond Fund (G)
CRISIL Short Term Bond Fund Index#
CRISIL 1 Yr T-Bill Index##
30th Sept, 2014 to 30th Sept, 2015 8.8979 9.8976 8.8559
30th Sept, 2013 to 30th Sept, 2014 9.6750 10.1168 8.3548
28th Sept, 2012 to 30th Sept, 2013 6.7106 7.7302 5.6534
Since Inception upto 30th Sept, 2015 8.8506 9.1231 7.4786
Return on investment of Rs.10000/- 14679.00 14846.10 13860.04
IDBI Debt Opportunities Fund (IDOF) Inception date: 3rd March, 2014
Period
Returns (in %)
IDBI Debt Opportunities
Fund (G)
CRISIL Short Term Bond Fund Index#
CRISIL 1 Yr T-Bill Index##
30th Sept, 2014 to 30th Sept, 2015 9.5955 9.8976 8.8559
Since Inception upto 30th Sept, 2015 9.9630 10.1556 8.7600
Return on investment of Rs.10000/- 11616.90 11649.03 11416.98
IDBI Monthly Income Plan (IMIP) Inception date: 7th March, 2011
PeriodReturns (in %)
IDBI MIP (G) CRISIL MIP Blended Index#
CRISIL 10 Yr Gilt Index##
30th Sept, 2014 to 30th Sept, 2015 9.6887 10.7173 13.7565
30th Sept, 2013 to 30th Sept, 2014 13.5405 15.4536 6.8474
28th Sept, 2012 to 30th Sept, 2013 2.6260 3.1805 2.4018
Since Inception upto 30th Sept, 2015 8.3576 9.0393 6.8229
Return on investment of Rs.10000/- 14431.20 14850.81 13520.48
IDBI Dynamic Bond Fund (IDBF) Inception date: 21st February, 2012
PeriodReturns (in %)
IDBI Dynamic Bond (G)
CRISIL Composite Bond fundIndex#
CRISIL 10 Yr Gilt Index##
30th Sept, 2014 to 30th Sept, 2015 11.2204 12.5594 13.7565
30th Sept, 2013 to 30th Sept, 2014 5.2063 11.6116 6.8474
28th Sept, 2012 to 30th Sept, 2013 4.1284 3.4525 2.4018
Since Inception upto 30th Sept, 2015 7.3395 9.1093 7.3859
Return on investment of Rs.10000/- 12911.80 13696.62 12931.97
IDBI Gilt Fund (IGF) Inception date: 21st December, 2012
PeriodReturns (in %)
IDBI Gilt Fund (G)
CRISIL Gilt Index#
CRISIL 10 Yr Gilt Index##
30th Sept, 2014 to 30th Sept, 2015 13.1165 14.3480 13.7565
30th Sept, 2013 to 30th Sept, 2014 9.9345 11.2095 6.8474
Since Inception upto 30th Sept, 2015 9.2032 9.1888 7.4930
Return on investment of Rs.10000/- 11274.70 12763.13 11324.02

22
SCHEME PERFORMANCE (As on 30th September, 2015) (contd...)
IDBI Gold Fund (IGFOF) Inception date: 14th August, 2012
PeriodReturns (in %)
IDBI Gold Fund (G) Domestic price of Gold#
30th Sept, 2014 to 30th Sept, 2015 -2.6118 -0.822330th Sept, 2013 to 30th Sept, 2014 -12.1392 -11.187828th Sept, 2012 to 30th Sept, 2013 -6.9765 -5.0947Since Inception upto 30th Sept, 2015 -6.0924 -4.2333Return on investment of Rs.10000/- 8214.60 8734.22
IDBI Gold Exchange Traded Fund (IDBIGOLD) Inception date: 9th November, 2011
PeriodReturns (in %)
IDBI Gold ETF (G) Domestic price of physical Gold#
30th Sept, 2014 to 30th Sept, 2015 -1.7266 -0.822330th Sept, 2013 to 30th Sept, 2014 -12.0827 -11.187828th Sept, 2012 to 30th Sept, 2013 -6.1975 -5.0947Since Inception upto 30th Sept, 2015 -3.3125 -2.3024Return on investment of Rs.10000/- 8770.91 9133.06
IDBI Rajiv Gandhi Equity Savings Scheme - Series I - Plan A (RGESS) Inception date: 22nd March, 2013
PeriodReturns (in %)
IDBI RGESS- Srs A-I (G)
S&P BSE100 Index#
S&P BSE SENSEX##
30th Sept, 2014 to 30th Sept, 2015 12.9907 0.7697 -1.7862
30th Sept, 2013 to 30th Sept, 2014 41.5152 40.0515 37.4140
Since Inception upto 30th Sept, 2015 19.9417 15.2657 14.1186
Return on investment of Rs.10000/- 15830.00 14317.13 13959.96
# Scheme Benchmark ## Additional Benchmark as per SEBI Circular dated August 22, 2011.Disclaimer: Past performance may or may not be sustained in the future. Returns pertain to growth option under Regular Plan. The returns are Compounded Annual Growth Returns (CAGR) for periods since inception and absolute for 1 year and simple annualised for less than 1 year. The returns in Rs. are point to point returns since inception on a standard investment of Rs.10,000 and are inclusive of the amount invested.Source: Accord Fintech
IDBI Equity Advantage Fund (IEAF)Instalment amount: ` 10,000/-Frequency: Monthly
Investment date: 1st of every monthInception date: 10th September, 2013
Since Inception 1 yearTotal amount invested (` in '000) 240 120Market value (` in '000) 327.05 123.96Scheme Return (% XIRR) 33.02 6.21S&P BSE 200 Index# return (% XIRR) 10.00 -7.29S&P BSE Sensex## return (%XIRR) 5.15 -11.11
IDBI India Top 100 Equity Fund (IIT100 EF)Instalment amount: ` 10,000/-Frequency: Monthly
Investment date: 1st of every monthInception date: 15th May, 2012
Since Inception 3 years 1 yearTotal amount invested (` in '000) 400 360 120Market value (` in '000) 557.01 483.16 120.21Scheme Return (% XIRR) 20.33 20.11 0.33Nifty 100 Index# return (% XIRR) 12.95 12.15 -7.98Nifty 50 Index## return (%XIRR) 11.30 10.42 -9.94
IDBI Diversified Equity Fund (IDEF)Instalment amount: ` 10,000/-Frequency: Monthly
Investment date: 1st of every monthInception date: 28th March, 2014
Since Inception 1 yearTotal amount invested (` in '000) 180 120Market value (` in '000) 212.39 124.33Scheme Return (% XIRR) 22.78 6.79S&P BSE 500 Index# return (% XIRR) 2.61 -6.85S&P BSE Sensex## return (% XIRR) -2.20 -11.11
IDBI Nifty Index Fund (INIF)Instalment amount: ` 10,000/-Frequency: Monthly
Investment date: 1st of every monthInception date: 25th June, 2010
Since Inception 5 years 3 years 1 yearTotal amount invested (` in '000) 630 600 360 120Market value (` in '000) 817.39 773.55 420.08 113.62Scheme Return (% XIRR) 9.85 10.11 10.30 -9.75Nifty 50 Index-TRI# return (% XIRR) 11.28 11.53 11.82 -8.72Nifty 50 Index## return (%XIRR) 9.93 10.18 10.42 -9.94
IDBI Nifty Junior Index Fund (INJIF)Instalment amount: ` 10,000/-Frequency: Monthly
Investment date: 1st of every monthInception date: 20th September, 2010
Since Inception 5 years 3 years 1 yearTotal amount invested (` in '000) 600 600 360 120Market value as (` in '000) 926.30 926.30 490.81 121.88Scheme Return (% XIRR) 17.42 17.42 21.24 2.93Nifty Next 50 Index-TRI# return (% XIRR) 18.97 19.26 22.38 5.61Nifty 50 Index## return (%XIRR) 10.18 10.18 10.42 -9.94
# Scheme Benchmark ## Additional Benchmark as per SEBI Circular dated August 22, 2011.Disclaimer: Past Performance may or may not be sustained in the future. Returns pertain to growth option under Regular Plan and the same have been computed using XIRR by excel spreadsheet function. XIRR helps in calculating return on investments based on cash flows that are uniform and regular monthly subscriptions.Source: Accord Fintech
SYSTEMATIC INVESTMENT PLAN (SIP) PERFORMANCE (As on 30th September, 2015)

23
GLOSSARY OF RATIOS
Total Expense Ratio:The Expenses of a mutual fund include management fees and all the fees associated with the fund's daily operations. Expense Ratio refers to the annual percentage of fund's assets that is paid out in expenses.
Sharpe Ratio:The Sharpe Ratio, named after its founder, the Nobel Laureate William Sharpe, is a measure of risk-adjusted returns. It is calculated using standard deviation and excess return to determine reward per unit of risk.
Beta Ratio:Beta is a measure of an investment's volatility vis-a-vis the market. Beta of less than 1 means that the security will be less volatile than the market. A beta of greater than 1 implies that the security's price will be more volatile than the market.
Modified Duration:Modified duration is the price sensitivity and the percentage change in price for a unit change in yield.
Average Maturity:The average time of maturity of all the debt securities held in a portfolio. It states the weighted average maturity of the assets in the portfolio.
Portfolio Yield:The income return on an investment. This refers to the interest or dividends received from a security and are usually expressed annually as a percentage based on the investment's cost, its current market value or its face value.
Standard Deviation:Standard deviation is a statistical measure of the range of an investment's performance. When a mutual fund has a high standard deviation, its means its range of performance is wide, implying greater volatility.
Risk Free Return:The theoretical rate of return attributed to an investment with zero risk. The risk-free rate represents the interest on an investor's money that he or she would expect from an absolutely risk-free investment over a specified period of time.
Tracking Error:The divergence between the price behavior of a position or portfolio and the price behavior of a benchmark.
Turnover Ratio:This is a measure of the fund's trading activity, which is computed by taking the lesser of purchases or sales (excluding all securities with maturities of less than one year) and dividing by average monthly net assets.
GLOSSARY OF COMMON TERMS
Fund Manager:An employee of the asset management company such as a mutual fund or life insurer, who manages investments of the scheme. He is usually part of a larger team of fund managers and research analysts.
Application Amount for Fresh Subscription:This is the minimum investment amount for a new investor in a mutual fund scheme.
Minimum Additional Amount:This is the minimum investment amount for an existing investor in a mutual fund scheme.
Yield to Maturity:The Yield to Maturity or the YTM is the rate of return anticipated on a bond if held until maturity. YTM is expressed as an annual rate. The YTM factors in the bond's current market price, par value, coupon interest rate and time to maturity.
SIP:SIP of systematic investment plan works on the principle of making periodic investments of a fixed sum. It works similar to a recurring bank deposits. For instance, an investor may opt for an SIP that invest Rs. 500 every 15th of the month in an equity fund for a period of three years.
NAV:The NAV or the net asset value is the total asset value per unit of the mutual fund after deducting all related and permissible expenses. The NAV is calculated at the end of every business day. It is the value at which the investor enters or exits the mutual fund.
Benchmark:A group of securities, usually a market index, whose performance is used as a standard or benchmark to measure investment performance of mutual funds, among other investments. Some typical benchmarks include the Nifty, Sensex, BSE200, BSE500, 10-Year G-Sec.
Entry Load:A mutual fund may have a sales charge or load at the time of entry and/or exit to compensate the distributor/agent. Entry load is charged at the time an investor purchases the units of a mutual fund. The entry load is added to the prevailing NAV at the time of investment. For instance, if the NAV is Rs. 100 and the entry load is 1%, the investor will enter the fund at Rs. 101.Note: SEBI, vide circular dated June 30, 2009 has abolished entry load and mandated that the upfront commission to distributors will be paid by the investor directly to the distributor, based on his assessment of various factors including the service rendered by the distributor.
Exit Load:Exit load is charged at the time an investor redeems the units of a mutual fund. The exit load is deducted from the prevailing NAV at the time of redemption. For instance, if the NAV is Rs. 100 and the exit load is 1%, the redemption price would be Rs. 99 per unit.
Modified Duration:Modified duration is the price sensitivity and the percentage change in price for a unit change in yield.
Standard Deviation:Standard deviation is a statistical measure of the range of an investment's performance. When a mutual fund has a high standard deviation, its means its range of performance is wide, implying greater volatility.
Sharpe Ratio:The Sharpe Ratio, named after its founder, the Nobel Laureate William Sharpe, is a measure of risk-adjusted returns. It is calculated using standard deviation and excess return to determine reward per unit of risk.
Beta Ratio:Beta is a measure of an investment's volatility vis-a-vis the market. Beta of less than 1 means that the security will be less volatile than the market. A beta of greater than 1 implies that the security's price will be more volatile than the market.
AUM:AUM or assets under management refers to the recent / updated cumulative market value of investments managed by a mutual fund or any investment firm.
Holdings:The holdings or the portfolio is a mutual fund's latest or updated reported statement of investments / securities. These are usually displayed in terms of percentage to net assets or the rupee value or both. The objective is to give investors an idea of where their money is being invested by the fund manager.
Nature of Scheme:The investment objective and underlying investments determine the nature of the mutual fund scheme. For instance, a mutual fund that aims at generating capital appreciation by investing in stock markets is an equity fund or growth fund. Likewise, a mutual fund that aims at capital preservation by investing in debt markets is a debt fund or income fund. Each of these categories may have sub-categories.
Rating Profile:Mutual funds invest in securities after evaluating their creditworthiness as disclosed by the ratings. A depiction of the mutual fund in various investments based on their ratings becomes the rating profile of the fund. Typically, this is a feature of debt funds.

24