novel processing system for ration meat items—phase i
TRANSCRIPT

TECHNICAL REPORT NATICK/TR-20/005 AD _____________
NOVEL PROCESSING SYSTEM FOR RATION MEAT ITEMS—PHASE I
by Tom Yang
and Olivier Rispal*
*Association pour le Développement de l’Institut de la Viande (ADIV) Clermont-Ferrand, France
February 2020
Final Report
May 2010-April 2016
Approved for public release; distribution is unlimited.
U.S. Army Combat Capabilities Development Command Soldier Center Natick, Massachusetts 01760-5018


REPORT DOCUMENTATION PAGE Form Approved OMB No. 0704-0188
Public reporting burden for this collection of information is estimated to average 1 hour per response, including the time for reviewing instructions, searching existing data sources, gathering and maintaining the data needed, and completing and reviewing this collection of information. Send comments regarding this burden estimate or any other aspect of this collection of information, including suggestions for reducing this burden to Department of Defense, Washington Headquarters Services, Directorate for Information Operations and Reports (0704-0188), 1215 Jefferson Davis Highway, Suite 1204, Arlington, VA 22202-4302. Respondents should be aware that notwithstanding any other provision of law, no person shall be subject to any penalty for failing to comply with a collection of information if it does not display a currently valid OMB control number.
PLEASE DO NOT RETURN YOUR FORM TO THE ABOVE ADDRESS. 1. REPORT DATE (DD-MM-YYYY)
21-02-2020 2. REPORT TYPE
Final 3. DATES COVERED (From - To)
May 2010-April 2016 4. TITLE AND SUBTITLE
NOVEL PROCESSING SYSTEM FOR RATION MEAT ITEMS – PHASE 1
5a. CONTRACT NUMBER
W911QY-10-C-0101 5b. GRANT NUMBER
5c. PROGRAM ELEMENT NUMBER
6. AUTHOR(S)
Tom Yang and Olivier Rispal*
5d. PROJECT NUMBER
5e. TASK NUMBER
5f. WORK UNIT NUMBER
7. PERFORMING ORGANIZATION NAME(S) AND ADDRESS(ES)
8. PERFORMING ORGANIZATION REPORT NUMBER
NATICK/TR-20/005
9. SPONSORING / MONITORING AGENCY NAME(S) AND ADDRESS(ES) 10. SPONSOR/MONITOR’S ACRONYM(S)
Comparative Technology Office - Army RDECOM HQ, Programs and Engineering, GTI 3071 Aberdeen Blvd Rm 214 Aberdeen Proving Ground, MD 21005
11. SPONSOR/MONITOR’S REPORT NUMBER(S)
12. DISTRIBUTION / AVAILABILITY STATEMENT
Approved for public release; distribution is unlimited. 13. SUPPLEMENTARY NOTES
Prepared in cooperation with Contractor report (Phase 1 report: Laboratory feasibility study of beef, pork, chicken, fish, and vegetarian recipes). Authors: Tom Yang , Principal Investigator, Food Engineering and Analysis Team, US Army CCDC SC (508) 233-4916, [email protected]; Olivier Rispal, Contractor, ADIV, ZAC Parc Industriel des Gravanches 04 73 98 53 80, [email protected] *Association pour le Développement de l’Institut La Viande (ADIV), Clermont-Ferrand, France 14. ABSTRACT This technical report documents a Science and Technology initiative for a novel meat processing technology to produce shelf stable, high quality, and nutritious meat snacks for ration. The US Army Natick Soldier Research, Development, and Engineering Center (NSRDEC), now known as the US Army Combat Capabilities Development Command Soldier Center, conducted series of experiments, titled “Novel Processing System for Ration Meat Items”, to explore a French-developed technology for potential US industrial adaptation. The funding for the study came from the Foreign Comparative Testing (FTC) program sponsored by the Office of Secretary of Defense from FY 10-FY12, and from several Combat Feeding Ration Improvement related projects from FY12-FY16. The work was done in three phases—feasibility, trial run, and purchase of the system for the US meat industry. This report shows the result of Phase I. 15. SUBJECT TERMS
16. SECURITY CLASSIFICATION OF: 17. LIMITATION OF ABSTRACT
UU
18. NUMBER OF PAGES
48
19a. NAME OF RESPONSIBLE PERSON
Tom Yang a. REPORT
U
b. ABSTRACT
U
c. THIS PAGE
U 19b. TELEPHONE NUMBER (include area code) 508-233-4916
Standard Form 298 (Rev. 8-98) Prescribed by ANSI Std. Z39.18
FISH FRUITS STORAGE DEHYDRATION BEEF DRYING SHELF LIFE PHYSIOCHEMICAL PORK OSMOSIS NUTRITION FOOD PROCESSING JERKY QUALITY NUTRIENTS MILITARY RATIONS MEAT POULTRY VEGETABLES NOVEL TECHNOLOGY YIELD RATIONS SHELF STABLE FEASIBILITY STUDIES
U.S. Army Combat Capabilities Development Command Soldier Center ATTN: RDNS- SEC-STF 10 General Greene Avenue, Natick, MA 01760-5018

This page intentionally left blank

iii
TABLE OF CONTENTS LIST OF FIGURES ........................................................................................................................ v
LIST OF TABLES ......................................................................................................................... vi PREFACE ..................................................................................................................................... vii 1.0 INTRODUCTION ............................................................................................................... 1
1.1 Principle of Osmosis ....................................................................................................... 2
1.3 Phase 1: Feasibility Tests ................................................................................................ 9
2.0 MATERIAL, METHODS, AND RESULTS ..................................................................... 11
2.1 Description of the different steps of the laboratory scale Osmofood® dehydration process ....................................................................................................................................... 12
2.2 Feasibility Test 1: Beef-based recipes ........................................................................... 13
2.2.1 Process Flow Diagram ............................................................................................ 14
2.2.2 Dehydration Results ............................................................................................... 15
2.2.3 Physicochemical Analysis ...................................................................................... 16
2.2.4 Sensory Analysis .................................................................................................... 18
2.2.5 Feasibility on the industrial pilot line ..................................................................... 19
2.3 Feasibility Test 2: Pork-based recipes ........................................................................... 19
2.3.1 Process Flow Diagram ............................................................................................ 19
2.3.2 Dehydration Results ............................................................................................... 21
2.3.3 Physicochemical Analysis ...................................................................................... 21
2.3.4 Sensory Analysis .................................................................................................... 22
2.3.5 Industrial pilot line feasibility................................................................................ 22
2.4 Feasibility Test 3: Chicken recipes ............................................................................... 22
2.4.1 Process Flow Diagram ............................................................................................ 23
2.4.2 Dehydration results ................................................................................................. 24
2.4.3 Physicochemical Analysis ...................................................................................... 25
2.4.4 Sensory Analysis .................................................................................................... 26
2.4.5 Industrial Pilot Plant Feasibility ............................................................................. 26
2.5 Feasibility Test 4: Vegetable-based recipes .................................................................. 26
2.5.1 Process Flow Diagram ............................................................................................ 27
2.5.2 Dehydration Results ............................................................................................... 29
2.5.3 Physicochemical analysis ....................................................................................... 30
2.5.4 Sensory Analysis .................................................................................................... 31
2.5.5 Industrial Pilot Line feasibility ............................................................................... 31

iv
2.6 Feasibility Test 5: Fruit-based recipes .......................................................................... 31
2.6.1 Process Flow Diagram ............................................................................................ 32
2.6.2 Dehydration Results ............................................................................................... 32
2.7 Feasibility Test 6. Fish recipes ...................................................................................... 32
2.7.1 Process Flow Diagram ............................................................................................ 33
2.7.2 Dehydration results ................................................................................................. 35
2.7.3 Physicochemical analysis ....................................................................................... 35
2.7.5 Industrial Pilot line feasibility ............................................................................... 36
3.0 CONCLUSION .................................................................................................................. 37
BIBLIOGRAPHY ......................................................................................................................... 38

v
LIST OF FIGURES
Figure 1: Effect of different solutions on blood cells ..................................................................... 3 Figure 2: Micrographs of osmotic pressure on red blood cells (RBC) ........................................... 4 Figure 3: Plant cell under different environments .......................................................................... 4 Figure 4: Illustration of Osmofood® concept (left); and pilot plant Osmofood® system (right) .. 5 Figure 5: Adjust the gap of the extrusion die (left); finished extruder set up (right) ...................... 6 Figure 6: Detailed illustration of extruder gap adjustment ............................................................. 6 Figure 7: Actual extrusion of meat (left); measurement of meat thickness (right) ......................... 6 Figure 8: Preparation of meat strip: peeling off the paper and scrape off the excess meat ............ 7 Figure 9: Preparation of meat strip: folding back the paper ........................................................... 8 Figure 10: Preparation of meat strip: ready to proceed with osmosis ............................................. 8 Figure 11: Meat strip ready to enter the osmotic tank .................................................................... 9 Figure 12: Main steps of the dehydration process. ....................................................................... 11 Figure 13: Manual lamination of meat: frame (left); uniform thickness (right) ........................... 12 Figure 14: Manual removal of excess meat .................................................................................. 12 Figure 15: Manual soaking of meat strip ...................................................................................... 13 Figure 16: Rising the meat strip (left); peeling off paper (right) .................................................. 13 Figure 17: Beef-based Osmomeat process flow diagram ............................................................. 15 Figure 18. Pork-based Osmomeat process flow diagram ............................................................. 20 Figure 19. Chicken-based Osmomeat process flow diagram ........................................................ 24 Figure 20: Vegetable-based Osmofood process flow diagram for Test 1 .................................... 27 Figure 21: Vegetable-based Osmofood process flow diagram for Test 2 .................................... 28 Figure 22: Vegetable-based Osmofood process flow diagram for Test 3 .................................... 29 Figure 23: Fruit-based Osmofood process flow diagram ............................................................. 32 Figure 24: Fish-based Osmofood process flow diagram .............................................................. 34
vi
LIST OF TABLES
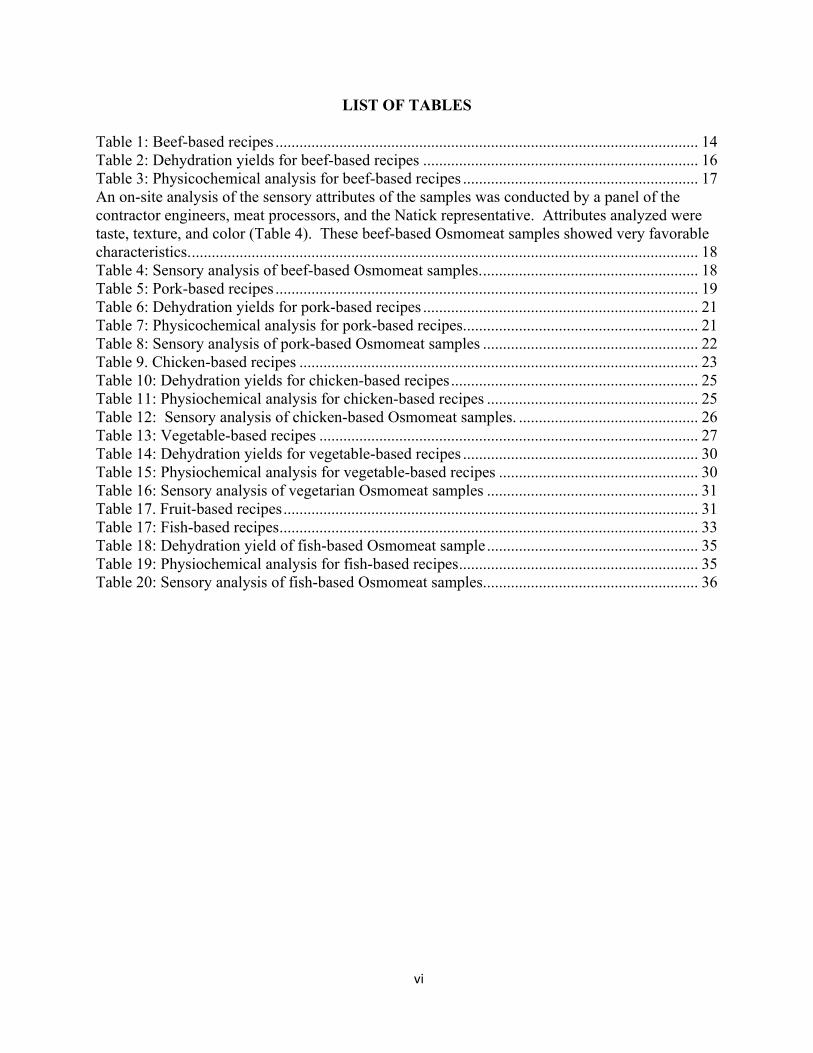
Table 1: Beef-based recipes .......................................................................................................... 14 Table 2: Dehydration yields for beef-based recipes ..................................................................... 16 Table 3: Physicochemical analysis for beef-based recipes ........................................................... 17 An on-site analysis of the sensory attributes of the samples was conducted by a panel of the contractor engineers, meat processors, and the Natick representative. Attributes analyzed were taste, texture, and color (Table 4). These beef-based Osmomeat samples showed very favorable characteristics. ............................................................................................................................... 18 Table 4: Sensory analysis of beef-based Osmomeat samples. ...................................................... 18 Table 5: Pork-based recipes .......................................................................................................... 19 Table 6: Dehydration yields for pork-based recipes ..................................................................... 21 Table 7: Physicochemical analysis for pork-based recipes. .......................................................... 21 Table 8: Sensory analysis of pork-based Osmomeat samples ...................................................... 22 Table 9. Chicken-based recipes .................................................................................................... 23 Table 10: Dehydration yields for chicken-based recipes .............................................................. 25 Table 11: Physiochemical analysis for chicken-based recipes ..................................................... 25 Table 12: Sensory analysis of chicken-based Osmomeat samples. ............................................. 26 Table 13: Vegetable-based recipes ............................................................................................... 27 Table 14: Dehydration yields for vegetable-based recipes ........................................................... 30 Table 15: Physiochemical analysis for vegetable-based recipes .................................................. 30 Table 16: Sensory analysis of vegetarian Osmomeat samples ..................................................... 31 Table 17. Fruit-based recipes ........................................................................................................ 31 Table 17: Fish-based recipes ......................................................................................................... 33 Table 18: Dehydration yield of fish-based Osmomeat sample ..................................................... 35 Table 19: Physiochemical analysis for fish-based recipes ............................................................ 35 Table 20: Sensory analysis of fish-based Osmomeat samples. ..................................................... 36

vii
PREFACE
This technical report documents a science and technology (S&T) initiative for a novel meat processing technology to produce shelf stable, high quality, and nutritious meat snacks for rations. The US Army Combat Capabilities Development Command (CCDC) Soldier Center, formerly known as the US Army Natick Soldier, Research, Development and Engineering Center (NSRDEC), conducted series of experiments titled “Novel Processing System for Ration Meat Items” to explore a French-developed technology for potential US industrial adaptation. The funding for the study came from the Foreign Comparative Testing (FTC) program sponsored by the Office of Secretary of Defense from fiscal year (FY)10-FY12, and from several ration improvement-related projects from FY12-FY16. This S&T initiative proceeded in three phases—feasibility, trial run, and purchase of the system for the US meat industry. This report documents the results of Phase 1.
The names and contact information of NSRDEC personnel who contributed to this study are
shown below:
Name Role/Organization Phone/Email Tom Yang Principal Investigator, Food
Engineering and Analysis Team US Army CCDC SC
(508) 233-4916 [email protected]
Olivier Rispal
Contractor ADIV ZAC Parc Industriel des Gravanches
04 73 98 53 80 [email protected]

1
NOVEL PROCESSING SYSTEM FOR RATION MEAT ITEMS -PHASE 1
1.0 INTRODUCTION
This report documents contract work performed from May 2010 to April 2012, and research work performed from Apr 2012 to Apr 2016, by the U.S. Army Combat Capabilities Development Command (CCDC) Soldier Center, formerly the Natick Soldier Research, Development and Engineering Center (NSRDEC), to explore a novel meat processing method developed by Association Pour Le Développement De L’Institut La Viande (ADIV), Clermont Ferrand, France. Currently, military rations containing meat items are either processed and produced via traditional retort sterilization [e.g., Meal, Ready-to-Eat (MRE) entrées] or via a series of curing and drying methods (e.g., jerky snack). Retort processing uses excessive heat for a long period of time (i.e., 90 min) to render foods sterile, but it also destroys quality and nutrients in the process. Retorted meats are often mushy, dry, and tasteless, which can result in lower consumption by the warfighter. Curing and drying methods currently employed to produce jerky are complex and costly because they require a delicate balance of safety, quality, and storageability. Also, jerky products are often too hard and too salty to consume, especially after long storage at elevated temperatures. The novel technology, using the Osmofood® system developed by ADIV (ADIV Patent, 2004), is a simple one-step process that uses inexpensive ground meat to produce shelf stable meat items with a desirable texture and targeted water activity to ensure safety and maintain shelf life. The system never uses extremely high temperature like a retort process, hence the quality and nutrients are well preserved. Furthermore, the system can be used to incorporate supplemental nutrients (e.g., curcumin, green tea extract) and quality enhancers (e.g., canola protein for meat succulence) to produce a meat roll-up that can be consumed as a savory snack or used as a filling for a shelf stable sandwich. Application of such a system to develop numerous new ration items that were previously impractical is now possible, due to its technical simplicity and compatibility with various hurdle technologies such as water activity, pH, and natural preservatives. The exploration of the technology proceeded in three phases: feasibility, trial run, and purchase of the system for the US meat industry. ADIV has developed and owns the technical expertise that is required to dehydrate minced meat laminated in thin layers using the Osmofood® osmotic dehydration technology. Thus, NSRDEC commissioned ADIV to perform osmotic dehydration tests of various food products for Phases 1 and 2. Phase 1: Laboratory feasibility study on ADIV premises in Clermont Ferrand, France -- The main purpose of this phase was to review and demonstrate all the possibilities of the Osmofood® technology. The technological limitations of the recipes tested were determined with regard to their further scaling up at the industrial production stage for meat (i.e., beef, pork, and chicken), fish (i.e., haddock), and fruit and vegetable products.

2
Phase 2: Pilot plant dehydration test on ADIV pilot plant in Clermont Ferrand, France-- The purpose of this phase was to test the recipes selected at the end of Phase 1 on ADIV's industrial pilot line. Phase 3: Purchase of a pilot industrial line by the US Army and installation, commissioning, and startup of this line under ADIV control and supervision at a U.S. food company. 1.1 Principle of Osmosis
Osmosis is the movement of a solvent across a semipermeable membrane toward a higher concentration of solute. In biological systems, the solvent is typically water, but osmosis can occur in other liquids, supercritical liquids, and even gases (Kramer and Myers, 2012 a & b). When a cell is submerged in water, the water molecules pass through the cell membrane from an area of low solute concentration to an area of high solute concentration. For example, if the cell is submerged in saltwater, water molecules move out of the cell. If a cell is submerged in freshwater, water molecules move into the cell.
When the membrane has a volume of pure water on both sides, water molecules pass in and out in each direction at exactly the same rate. There is no net flow of water through the membrane. The mechanism responsible for driving osmosis has commonly been represented in biology and chemistry texts as either the dilution of water by solute (resulting in lower concentration of water on the higher solute concentration side of the membrane and therefore a diffusion of water along a concentration gradient) or by a solute's attraction to water (resulting in less free water on the higher solute concentration side of the membrane and therefore net movement of water toward the solute). Both of these notions have been conclusively refuted.
The diffusion model of osmosis is rendered untenable by the fact that osmosis can drive water across a membrane toward a higher concentration of water (Kosinski and Morlok, 2008). The "bound water" model is refuted by the fact that osmosis is independent of the size of the solute molecules—a colligative property (Borg, 2003)—or how hydrophilic they are.
It is hard to describe osmosis without a mechanical or thermodynamic explanation. Basically, there is an interaction between the solute and water that counteracts the pressure that otherwise free solute molecules would exert. One fact to take note of is that heat from the surroundings is able to be converted into mechanical energy (water rising). Many thermodynamic explanations go into the concept of chemical potential and how the function of the water on the solution side differs from that of pure water due to the higher pressure and the presence of the solute counteracting such that the chemical potential remains unchanged. The virial theorem demonstrates that attraction between the molecules (water and solute) reduces the pressure, and thus the pressure exerted by water molecules on each other in solution is less than in pure water, allowing pure water to "force" the solution until the pressure reaches equilibrium (Borg, 2003).
Osmotic pressure is the main cause of support in many plants. The osmotic entry of water raises the turgor pressure exerted against the cell wall until it equals the osmotic pressure, creating a steady state. When a plant cell is placed in a solution that is hypertonic relative to the cytoplasm, water moves out of the cell and the cell shrinks. In doing so, the cell becomes flaccid. In extreme

3
cases, the cell becomes plasmolyzed – the cell membrane disengages with the cell wall due to lack of water pressure on it. When a plant cell is placed in a solution that is hypotonic relative to the cytoplasm, water moves into the cell and the cell swells to become turgid. Osmosis is responsible for the ability of plant roots to draw water from the soil. Plants concentrate solutes in their root cells by active transport, and water enters the roots by osmosis.
Osmosis is also responsible for controlling the movement of guard cells. Osmosis can be demonstrated when potato slices are added to a high salt solution. The water from inside the potato moves out to the solution, causing the potato to shrink and to lose its 'turgor pressure'. The more concentrated the salt solution, the bigger the difference in size and weight of the potato slice.
In unusual environments, osmosis can be very harmful to organisms. For example, freshwater and saltwater aquarium fish placed in water of a different salinity than that to which they are adapted to will die quickly. Another example of a harmful osmotic effect is the use of table salt to kill leeches and slugs. Suppose an animal or a plant cell is placed in a solution of sugar or salt in water:
If the medium is hypotonic relative to the cell cytoplasm — the cell will gain water through osmosis.
If the medium is isotonic — there will be no net movement of water across the cell membrane.
If the medium is hypertonic relative to the cell cytoplasm — the cell will lose water by osmosis.
Figures 1-3 show the effect of osmosis to biological matters.
Figure 1: Effect of different solutions on blood cells

4
Figure 2: Micrographs of osmotic pressure on red blood cells (RBC)
Figure 3: Plant cell under different environments
Essentially, this means that if a cell is put into a solution that has a solute concentration higher than its own, it will shrivel. If it is put into a solution with a lower solute concentration than its own, the cell will swell and may even burst.
1.2 PREPARATION OF A PILOT LINE OSMOFOOD® SYSTEM The illustration and a pilot line Osmofood® system are shown in Figure 4.

5
Figure 4: Illustration of Osmofood® concept (left); and pilot plant Osmofood® system (right)
Set up of pilot line:
1. Put the Strap rolls in place: Place the full roll on the infeed belt and the empty roll on the discharge conveyor. 2. Infeed belt:
a. Rinse the infeed belt to remove the cleaning chemicals b. Dry infeed belt with paper towels, and run the conveyor c. Position the paper rolls both top and bottom
3. Extruding device: Put in place and preset the extruding device. The measures are given to preset the extruding device.
The final adjustment is done based on the visual appearance of the extruded meat. The adjusting screws are adjusted manually. The aim is to obtain a regular plate meat having a thickness between 3 and 3.5 mm (Figures 5-7).

6
Figure 5: Adjust the gap of the extrusion die (left); finished extruder set up (right)
Figure 6: Detailed illustration of extruder gap adjustment
Figure 7: Actual extrusion of meat (left); measurement of meat thickness (right)

7
1. Laminate and attach the strap to laminated sheet:
a. After adjusting the extruding device, laminate the strip of meat on the infeed belt b. Stop the belt and attach the strap to the laminated sheet c. Cut the strip of meat at right angles d. Peel the paper and scrape off the meat, width = 15 cm (Figure 8)
Figure 8: Preparation of meat strip: peeling off the paper and scrape off the excess meat
e. Fold the paper back to the edge of the meat (Figure 9)
8
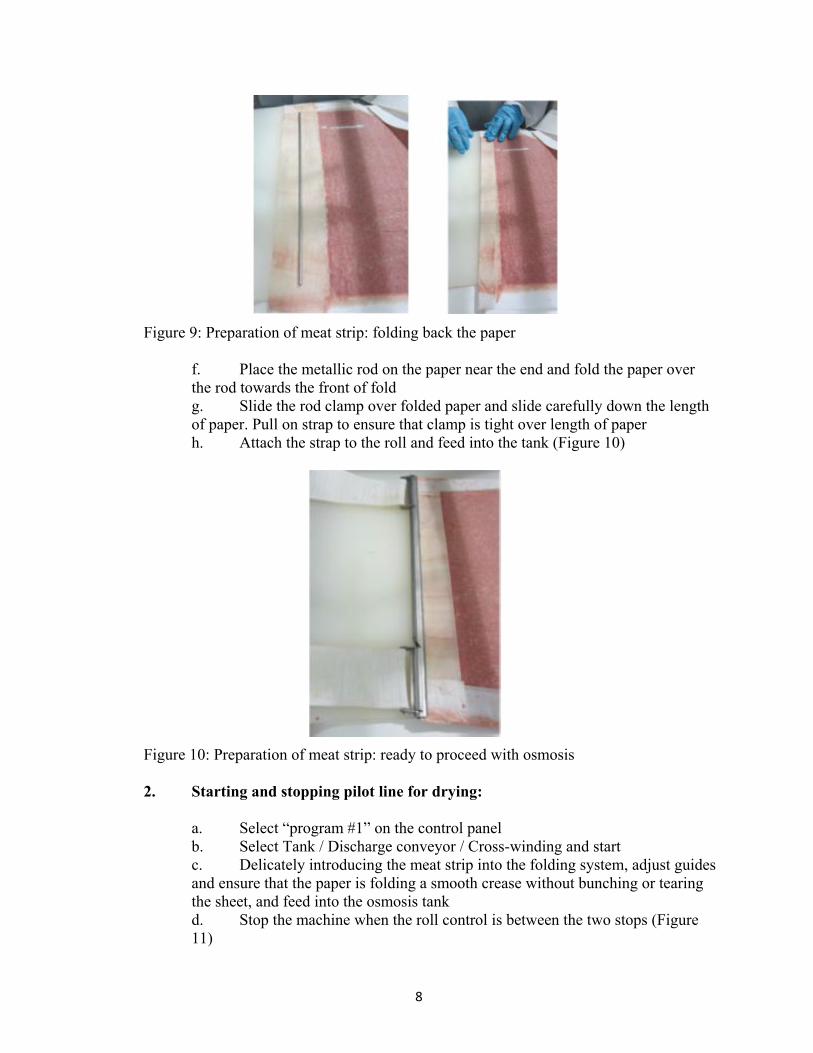
Figure 9: Preparation of meat strip: folding back the paper
f. Place the metallic rod on the paper near the end and fold the paper over the rod towards the front of fold g. Slide the rod clamp over folded paper and slide carefully down the length of paper. Pull on strap to ensure that clamp is tight over length of paper h. Attach the strap to the roll and feed into the tank (Figure 10)
Figure 10: Preparation of meat strip: ready to proceed with osmosis 2. Starting and stopping pilot line for drying:
a. Select “program #1” on the control panel b. Select Tank / Discharge conveyor / Cross-winding and start c. Delicately introducing the meat strip into the folding system, adjust guides and ensure that the paper is folding a smooth crease without bunching or tearing the sheet, and feed into the osmosis tank d. Stop the machine when the roll control is between the two stops (Figure 11)

9
Figure 11: Meat strip ready to enter the osmotic tank
e. Start the line (program #1) f. At the end of the extruded meat, stop the line prior to it entering tank g. Repeat step 4 above for attaching straps h. Place the entire laminated meat sheet into the osmosis tank i. Stop the process after the strap is seen on the second roller j. Curing operation – Every 15 min jog the tank for 20 s during the drying time of 3–4 h Pasteurization and unloading meat from system (program No# 2) k. Start the pasteurizing vat at 162 °F l. When the set temperature is reached, if necessary, adjust the level of the tank (70 inches) with water. 180 millibars on pressure sensor located at bottom of tank on operator side m. Rinsing and rolling finished product n. Roll up the dried meat, removing the paper, and place film between layers o. Make rolls 6-8 inches in diameter, removing and creating new rolls as the meat continues to discharge out of system. Place in cryovac bags and vacuum seal to finish sample rolls p. Stop the process after rolling all finished product
1.3 Phase 1: Feasibility Tests The objective was to explore and develop a new line of meat snacks in order to replace or complement traditional jerky in combat rations and other various applications. These snacks must meet several criteria and specifications: be palatable without further preparation, be nutritionally balanced and have a good calorie content, and have a minimum storage life of 3 years at ambient temperature. It was therefore proposed to evaluate the Osmofood® process, which offers a number of advantages, such as: Osmofood can use all kinds of meat and some fish or seafood, provided their fat content
is below 25%; Osmofood’s flexibility offers the possibility to create a multitude of

10
recipes, such as mixed meat, mixed meat with vegetables, and/or fruit and/or cereal products
Osmofood is a fast process, since the meat is dehydrated continuously in the osmotic bath Osmofood is an industrial process since the manufacturer, ADIV, and its partner have
already developed a production line that is 50 feet long and can produce 265 lb/h of dehydrated meat with an average yield of 65% (35% water loss)
Furthermore, it should be noted that this new process recycles the osmotic solution using a vacuum evaporator, which eliminates the water absorbed by the osmotic solution during the dehydration process. The lifetime of this osmotic solution under 24/24 industrial production conditions has not yet been determined. The project goal is to develop five jerky-type recipes using the Osmofood process. The corresponding products must be microbiologically stable to ensure a 3-year shelf life at room temperature. To achieve this objective, the study was divided into two main phases. The first phase consisted of developing five recipes of dried beef at the laboratory bench scale. It also included assessing the texture of fresh raw material, and its ability to be later implemented on the industrial line. The first phase ended with the selection of the recipes to be later tested in Phase 2. The second phase was designed to test the selected recipes on the pilot industrial lines. During this phase, the dehydrated products were further processed to guarantee that they were microbiologically safe. Treatments contemplated at this stage were high‐pressure processing and infrared (IR) treatment or grilling. The Phase 1 tests were conducted at ADIV facilities from 25-28 May 2010 in the presence of NSRDEC representative, Dr. Tom Yang.

11
2.0 MATERIAL, METHODS, AND RESULTS The main purpose of this phase was to review and demonstrate all the possibilities of the Osmofood technology. The technological limitations of the recipes tested with regard to their further scaling up at the industrial production stage were determined for meat (beef, pork, and chicken), fish (haddock), fruits, and vegetable products. In order to investigate a broad spectrum of opportunities, 18 different recipes were tested as follows: Seven recipes based on beef meat Three recipes based on chicken meat Three recipes based on pork meat One recipe based on fruit Three recipes based on vegetarian products One recipe based on lean fish meat (haddock)
Each recipe was dehydrated in two different osmotic solutions: one regular and one acidified to lower its pH to 3.2. Each dehydrated product was then pasteurized (72 °C for 2 min) or broiled (on a grill at 240 °C for 25 s on each side or IR exposure during 30 s on each side). As a result, 76 individual variations of these 18 recipes were produced. The main steps of the dehydration process are summarized in Figure 1:
Figure 12: Main steps of the dehydration process.
Each batch of 18 recipes was 4.5 lb or more.

12
2.1 Description of the different steps of the laboratory scale Osmofood® dehydration process The different steps of the laboratory scale process were as follows: Meat mincing with a 3 mm plate and/or product size reduction Seasoning with spices and additives, and then mixing Storage/under vacuum for 24 h Manual lamination in a stainless steel frame between two sheets of special paper until
reaching a 3 mm thickness: (Figure 13)
Figure 13: Manual lamination of meat: frame (left); uniform thickness (right)
After cutting the meat sheet along the frame, its edges were tightly squeezed together in
order to prevent the meat from entering in direct contact with the osmotic solution: (Figure 14)
Figure 14: Manual removal of excess meat
Static drying by immersion in the osmotic regular or acidified solution: (Figure 15)

13
Figure 15: Manual soaking of meat strip
Pasteurization in the osmotic solution (72 °C for 2 min). Tap water rinsing of the meat
sheet. Peeling off the two paper membranes: (Figure 16)
Figure 16: Rising the meat strip (left); peeling off paper (right)
If the product has not been pasteurized, it is then possible to broil the dehydrated meat, either on a grill at 240 °C for 25 s on each side, or by infrared radiations (30 s on each side), followed by vacuum packaging.
2.2 Feasibility Test 1: Beef-based recipes Beef-based recipes are detailed in Table 1.

14
Table 1: Beef-based recipes
2.2.1 Process Flow Diagram
Manual preparation of OSMOFOOD beef is illustrated in a process flow diagram (Figure 17).
Recipes Plain
beef Mexican
beef Vegetable
beef Original
beef jerky
Pepper beef jerky
Chipotle beef jerky
Shawarma beef jerky
Meat weight (kg) 2 2 2 2 2 2 2 Salt (g) 14 14 14 Nitrite salt (g) 40 40 40 Ascorbic acid (g) 2 2 2 2 2 2 2 Sodium lactate (60%) (g) 50 50 50 50 50 50 50 Black pepper (g) 3 3 3 Water (g) 40 40 Tomato paste (g) 100 Carrots (g) 360 Onions (g) 140 Mexican spices mix (g) 50 Brine (g) 200 200 200 200 Sugar (g) 40 40 40 40 Beef jerky original (g) 30 Pepper Jerky (g) 30 Chipotle (g) 30 Shawarma (g) 30

15
Figure 17: Beef-based Osmomeat process flow diagram
2.2.2 Dehydration Results The drying time was approximately 4 h 30 min for all the recipes. Table 2 summarizes the dehydration yields after osmotic treatment. These yields were calculated as follows: Yield = (Fresh weight) / Dry weight) x 100 % (1)

16
Table 2: Dehydration yields for beef-based recipes
The result provided the final weight of the product after dehydration. The quantity of water lost was calculated as follows: Water Extracted = 100 – yield (2) With the exception of the Mexican beef recipe, all the yields were higher for products treated in the regular solution. This result implies that the acidified solution speeds up the dehydration process for beef meat. It is also worth noticing that the addition of dry matter to the recipe, such as prunes for example, triggered a yield increase. 2.2.3 Physicochemical Analysis Table 3 presents physicochemical analysis (Dry matter, Humidity, pH, Aw) performed on the following recipes: Plain beef, normal and acid batch, pasteurized and unpasteurized Vegetable beef, normal and acid batch, pasteurized and unpasteurized Original beef jerky, normal batch, pasteurized and unpasteurized Prune beef, normal batch, pasteurized and unpasteurized

17
Table 3: Physicochemical analysis for beef-based recipes
Dry matter: Dry matter tended to be higher with the acidified osmotic solution. Humidity: Final moisture of the meat was lower with acid osmosis solution in plain and vegetarian beef samples. pH: pH was lower for products treated in the acidified solution. Pasteurization increased pH by an average of 0.17 units for products dried in the same solution. Aw: Average Aw for products dried in the acidified solution was 0.918 ± 0.001. Average Aw for products dried in the regular solution was 0.938 ± 0.002. The acidified solution lowered Aw by 0.02 point. For the exact same process, adding 10% dry matter (prunes) to the recipe lowered the Aw
by approximately 0.027 point.

18
2.2.4 Sensory Analysis An on-site analysis of the sensory attributes of the samples was conducted by a panel of the contractor engineers, meat processors, and the Natick representative. Attributes analyzed were taste, texture, and color (Table 4). These beef-based Osmomeat samples showed very favorable characteristics.
Table 4: Sensory analysis of beef-based Osmomeat samples.

19
2.2.5 Feasibility on the industrial pilot line No technical problems are anticipated in producing these seven recipes on the industrial pilot line. 2.3 Feasibility Test 2: Pork-based recipes Pork based recipes are described in Table 5.
Table 5: Pork-based recipes
2.3.1 Process Flow Diagram Figure 18 shows the process flow diagram for the Osmofood pork-based dehydrated products.

20
Figure 18. Pork-based Osmomeat process flow diagram
21
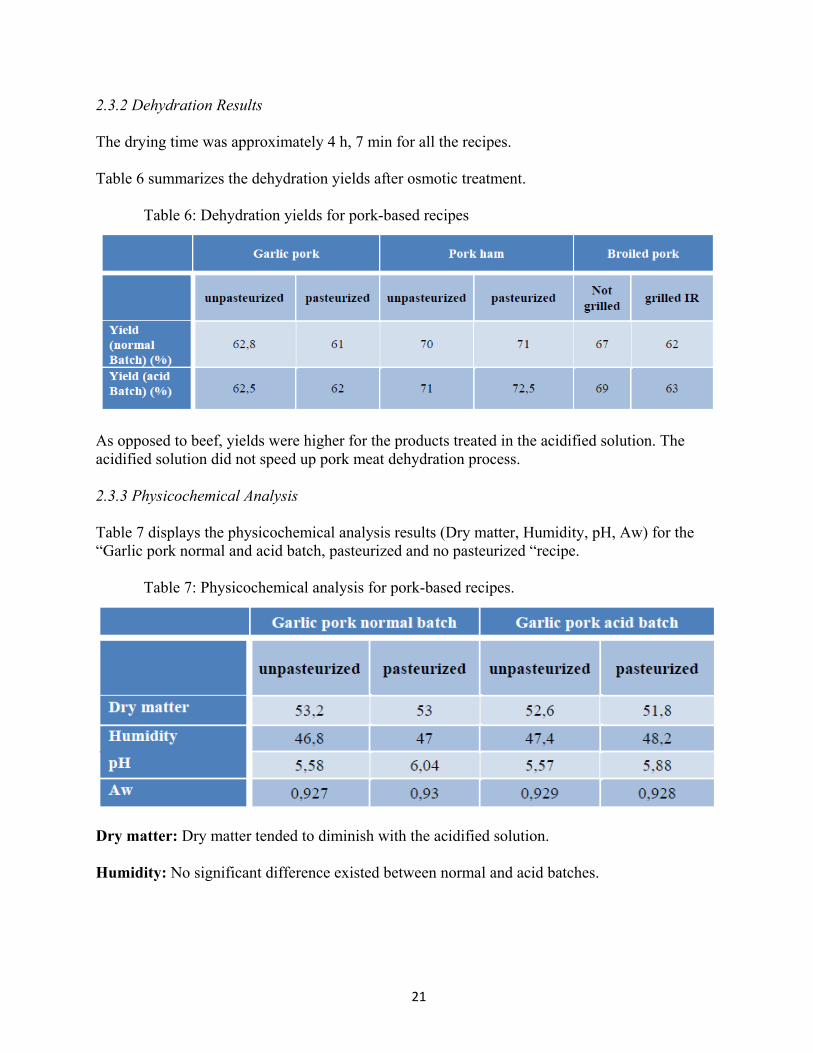
2.3.2 Dehydration Results The drying time was approximately 4 h, 7 min for all the recipes. Table 6 summarizes the dehydration yields after osmotic treatment.
Table 6: Dehydration yields for pork-based recipes
As opposed to beef, yields were higher for the products treated in the acidified solution. The acidified solution did not speed up pork meat dehydration process. 2.3.3 Physicochemical Analysis Table 7 displays the physicochemical analysis results (Dry matter, Humidity, pH, Aw) for the “Garlic pork normal and acid batch, pasteurized and no pasteurized “recipe.
Table 7: Physicochemical analysis for pork-based recipes.
Dry matter: Dry matter tended to diminish with the acidified solution. Humidity: No significant difference existed between normal and acid batches.

22
pH: • Products dehydrated in the acidified solution had a lower pH when compared to others. • When products were dehydrated in the same osmotic solution, pasteurization triggered a
0.39 pH unit average increase. Aw:
• For both dehydration processes, average Aw was 0.928 ± 0.001. • Osmotic solution acidity had no influence on the average Aw.
2.3.4 Sensory Analysis
On-site sensory analysis of pork samples is presented in Table 8. Results showed a flavorful pork-
based Osmomeat with good texture.
Table 8: Sensory analysis of pork-based Osmomeat samples
2.3.5 Industrial pilot line feasibility No technical problems are anticipated in producing these three recipes on the industrial pilot line.
2.4 Feasibility Test 3: Chicken recipes Table 9 describes chicken-based recipes.

23
Table 9. Chicken-based recipes
2.4.1 Process Flow Diagram Figure 19 summarizes the Osmofood chicken-based products process flow diagram.

24
Figure 19. Chicken-based Osmomeat process flow diagram 2.4.2 Dehydration results The drying time was approximately 4 h 10 min for all the recipes.

25
Table 10 provides the dehydration yields after osmotic dehydration.
Table 10: Dehydration yields for chicken-based recipes
Dehydration in the acidified solution tended to increase the yield. Dehydration in the acidified solution did not speed up the drying process. 2.4.3 Physicochemical Analysis Table 11 displays the results of the physicochemical analysis (Dry matter, Humidity, pH, Aw) performed on the following recipes: Chicken jerky, normal and acid batch, pasteurized and unpasteurized Broiled chicken, normal and acid batch.
Table 11: Physiochemical analysis for chicken-based recipes
Dry matter: There was no significant variation between acidified and regular solution. Compared to the untreated dehydrated product, IR broiling induced an average dry matter
increase of 2.9% for the regular solution treated products and a 7% increase for acidified solution treated products.
Humidity: No difference between normal and acid osmosis until treated with infrared when the acidified batch showed lower moisture. pH: pH is lower for acidified solution treated products.

26
When products were treated in the same conditions, pasteurization induced a 0.14 pH unit increase for the regular solution and a 0.23 pH unit increase for the acidified solution.
For the same dehydration process, IR broiling induced an average increase of 0.39 pH unit compared to the untreated dehydrated product.
Aw: Acidified osmotic solution triggered a decrease of 0.012 Aw units. Broiling had no influence on the Aw.
2.4.4 Sensory Analysis An on-site sensory analysis result is shown in Table 12. Results showed a pleasant chicken-based Osmomeat product with good color and texture.
Table 12: Sensory analysis of chicken-based Osmomeat samples.
2.4.5 Industrial Pilot Plant Feasibility No technical problems are anticipated in producing these three recipes on the industrial pilot line. 2.5 Feasibility Test 4: Vegetable-based recipes Table 13 provides the vegetable-based vegetarian recipes.

27
Table 13: Vegetable-based recipes
2.5.1 Process Flow Diagram Figures 20, 21 and 22 summarize the Osmofood vegetable-based products process flow diagram.
Figure 20: Vegetable-based Osmofood process flow diagram for Test 1

28
Figure 21: Vegetable-based Osmofood process flow diagram for Test 2

29
Figure 22: Vegetable-based Osmofood process flow diagram for Test 3
2.5.2 Dehydration Results The drying time was approximately 5 h for all recipes. Test 1 was very difficult to laminate. The product texture was not soft enough. Test 3 has no texture after dehydration. The sheet broke down under very light constraint. Only Test 2 provided an acceptable product before and after dehydration.
Table 14 provides dehydration yields after osmotic dehydration.

30
Table 14: Dehydration yields for vegetable-based recipes
Acidified solution dehydration tended to increase yields. Acidified solution did not improve dehydration speed. 2.5.3 Physicochemical analysis Table 15 presents the physicochemical analysis results (Dry matter, Humidity, pH, Aw) for the analysis performed on Test 2 for normal and acid batch, pasteurized and no pasteurized.
Table 15: Physiochemical analysis for vegetable-based recipes
Dry matter: There was no significant difference between: Regular and acidified dehydration, Pasteurized and unpasteurized product.
Humidity:
No significant difference in the final moisture between normal and acid batches.
pH: Products dehydrated in the acidified solution had a lower pH.

31
Pasteurization did not significantly change the pH. Aw: Acidified osmotic solution induced an average decrease of 0.006 Aw units.
2.5.4 Sensory Analysis
On-site sensory analysis showed a soft strip of non-meat sample prepared with Osmofood system. The sample exhibited soft texture with apple flavor (Table 16).
Table 16: Sensory analysis of vegetarian Osmomeat samples
2.5.5 Industrial Pilot Line feasibility Only Test 2 (i.e., normal batch) seems to be transferable to the OSMOFOOD industrial pilot line.
2.6 Feasibility Test 5: Fruit-based recipes Table 17 presents fruit-based recipes.
Table 17. Fruit-based recipes
32
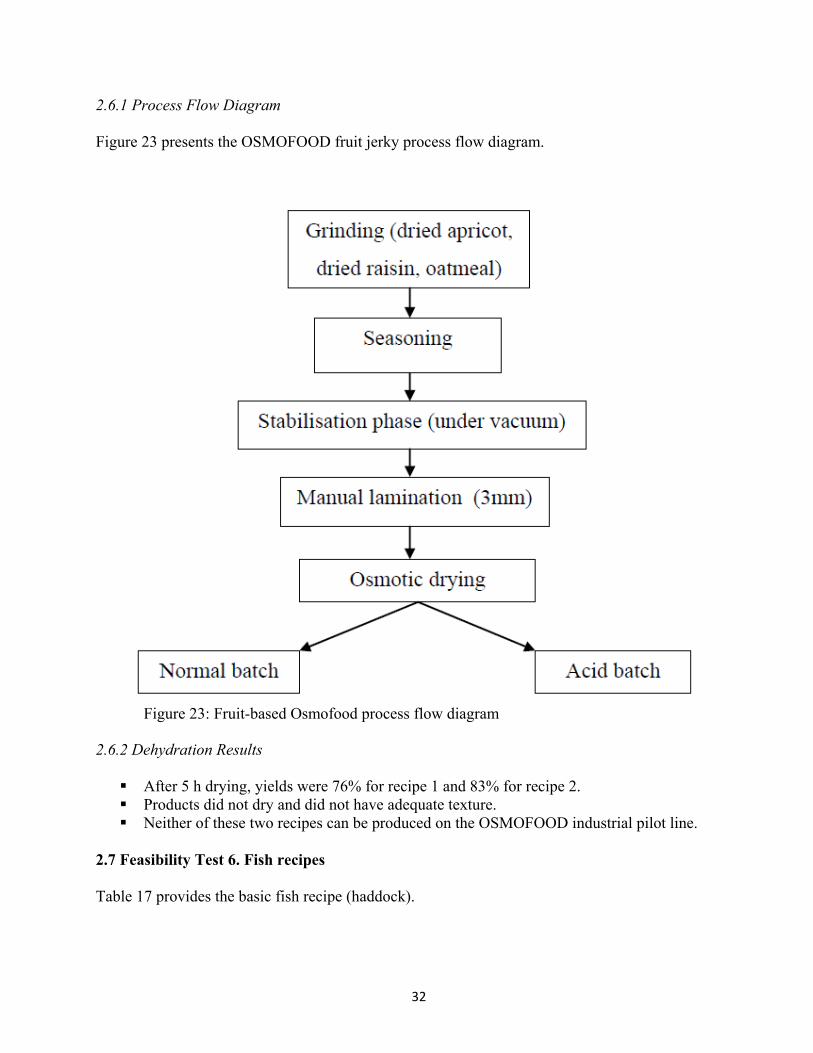
2.6.1 Process Flow Diagram Figure 23 presents the OSMOFOOD fruit jerky process flow diagram.
Figure 23: Fruit-based Osmofood process flow diagram
2.6.2 Dehydration Results After 5 h drying, yields were 76% for recipe 1 and 83% for recipe 2. Products did not dry and did not have adequate texture. Neither of these two recipes can be produced on the OSMOFOOD industrial pilot line.
2.7 Feasibility Test 6. Fish recipes Table 17 provides the basic fish recipe (haddock).

33
Table 17: Fish-based recipes 2.7.1 Process Flow Diagram Figure 24 describes the dehydrated fish process flow diagram.

34
Figure 24: Fish-based Osmofood process flow diagram

35
2.7.2 Dehydration results The drying time was approximately 3 h 30 min for all recipes. Table 18 summarizes the dehydration yields after osmotic treatment.
Table 18: Dehydration yield of fish-based Osmomeat sample
Yields obtained with the acidified osmotic solution were are the exact opposite of those obtained in other tests. This result will have to be confirmed during the industrial pilot plant tests. However, it must be noted that fish products dry very fast, irrespective of the type of osmotic solution used. 2.7.3 Physicochemical analysis Table 19 summarizes the physicochemical analysis (Dry matter, Humidity, pH, Aw) performed on the recipes for Haddock normal and acid batch, pasteurized and grill.
Table 19: Physiochemical analysis for fish-based recipes
Dry matter: There was no significant difference between: Regular and acidified dehydration Broiled and pasteurized products

36
Humidity: No significant difference in final moisture of the two batches. pH: Acidified solution dehydration favored a decrease in pH. It lowered from 6.2 for a
product dehydrated in the regular solution to 5.9 for the recipe dehydrated in the acidified solution (i.e., a 0.3 pH unit decrease).
Aw: The acidified solution induced an average 0.017 Aw unit decrease. Broiling triggered a 0.006 Aw unit increase when compared to the pasteurized product.
2.7.4 Sensory Analysis On-site sensory analysis showed a fish-based Osmomeat sample with strong fish odor and a leathery texture (Table 20).
Table 20: Sensory analysis of fish-based Osmomeat samples.
2.7.5 Industrial Pilot line feasibility There are no anticipated technical problems for producing this recipe on the OSMOFOOD industrial pilot line.

37
3.0 CONCLUSION There were 18 different basic recipes, with a total of 76 variations, most of which could be transferred on the Osmofood industrial pilot line, tested during this Phase 1 effort. This first phase laboratory stage testing program successfully identified and defined the possibilities and limits of the Osmofood technology for an extended range of products: Meat (beef, pork chicken, fish) Vegetables (tomato, carrot, onion, soybean, oatmeal) Fruit (banana, apple, raisin, prunes)
All products were submitted to physicochemical analysis as well as to an informal sensory analysis. This Phase 1 effort also provided the opportunity to evaluate the feasibility of successfully transferring the tested recipes to the Osmofood industrial pilot line. Most of the recipes tested had rheological, texture, color, aspect and taste characteristic that are compatible with such transfer. All meat and fish recipes should be easy to produce on the Osmofood industrial pilot line. However, only the Test 2 vegetarian recipe seemed to be transferable to the industrial pilot line. All other recipes whose main ingredients were fruit and vegetables gave indeed poor results, particularly from a texture point of view. These defects are most probably linked to the formulation of the recipes and could be corrected by adapting the fiber, protein, and moisture content of each recipe. Among meat-based samples, those obtained after dehydration in the acidified osmotic solution had a firmer but still smooth texture. All pasteurized samples had an interesting soft but crisp texture. As far as taste was concerned, the Osmofood technology proved to be very flexible because it did not significantly modify taste during the process. It also would allow for the design of products with specific nutritional profiles (e.g., low fat with fruits and vegetables, antioxidants, fibers, pre, and probiotic, etc.). The only rheological constraint was that the raw material, after maturation but before lamination, must have rheological and moisture characteristics similar to minced meat.
20/005

38
BIBLIOGRAPHY
ADIV Patent: Minced meat transformation. 2004. Patent #: A235-b-9749 FR. Also USA: A235-B-9749-WO; Brazil: A235-B-9749-BR; Europe: EP 1406501. Borg, F. 2003. "What is osmosis? Explanation and understanding of a physical phenomenon". arXiv:physics/0305011. Kosinski, R. J. and C. K. Morlok. 2008. "Challenging misconceptions about osmosis.". Association for Biology Laboratory Education. 30: 63–87. Kramer, E. and D. Myers. 2012. "Osmosis is not driven by water dilution". Trends in Plant Science. 18 (4): 195–197. doi:10.1016/j.tplants.2012.12.001. Kramer, E. and D. Myers. 2012. "Five popular misconceptions of osmosis". American Journal of Physics. 80 (694). Bibcode:2012AmJPh..80. 694K. doi:10.1119/1.4722325.