assessment of novel sire lines for meat quality traits
TRANSCRIPT
Assessment of Novel Sire Lines for Meat Quality
Traits
Caroline E. Mitchell
University of Bristol
Division of Farm Animal Science
Langford
Bristol
BS40 5DU
UK
Submitted 8th
September 2010
A dissertation submitted to the University of Bristol in accordance with the
requirements of the degree of MSc Meat Science and Technology in the Faculty of
Medical and Veterinary Sciences.
AUTHOR’S DECLARATION
I declare that the work in this dissertation was carried out in accordance with the
regulations of the University of Bristol. The work is original except where indicated
by special reference in the text and no part of the dissertation has been submitted for
any other degree.
Any views expressed in the dissertation are those of the author and in no way
represent those of the University of Bristol.
The dissertation has not been presented to any other University for examination either
in the United Kingdom or overseas.
Signed Date 8th
September 2010
3
Assessment of Novel SireLines for Meat Quality Traits.
Caroline Mitchell
University of Bristol, Division of Farm Animal Science, School of Clinical
Veterinary Science, Langford, Bristol, BS40 5DU, UK
Abstract
The aim of this project was to investigate whether there is a significant difference in
meat eating quality as assessed by shear force, drip loss and pH, between progeny
sired by different sire lines crossed with the same dam line. The effects of terminal
sire genotype (H line, RN- Hampshire; E line, Large White x Pietrain; F line, Large
White x Duroc; M line, Duroc x Pietrain) on meat quality characteristics of 91 pigs
slaughtered at 104-107kg live weight was measured. Data was analysed using both
age at slaughter and hot carcass weight as a covariate. Meat from H line pigs was
more tender, had a higher percentage moisture than the other lines and more
intramuscular fat than the E and F lines. There was no significant difference
between lines for percentage drip loss or percentage chill loss.
Keywords — Sire Line, Meat Quality, Duroc, Hampshire, Pietrain.
INTRODUCTION
Within the pig industry dam animals are selected based on their mothering abilities,
prolificacy, longevity and the production system that they will be in. Sire animals are
selected based on what is desired from the final commercial progeny e.g. large loin
eye area, large ham muscle or further processing ability. The inclusion of at least 50%
Duroc genetics, whilst having no effect on daily live weight gain or lean tissue
conversion ratio (Blanchard et al,. 1999b) results in significantly darker meat, firmer
fat and increased marbling (Blanchard et al., 1999b). The MLC (1992) Blueprint
recommends a minimum of 50% Duroc inclusion for improved pork tenderness and
juiciness.
The Hampshire breed is a known carrier of the Rendement Napole (RN-) gene and as
a result slaughter progeny carrying the gene are associated with acid meat (Fenandez
et al, 1992; Bertram, Petersen & Andersen, 2000). Carriers of the RN- gene have a
high glycogen content in the muscles which makes a lower ultimate pH possible
4
(Bertram, Petersen & Andersen, 2000). A low ultimate pH in meat is also associated
with a reduced water holding capacity (Bendall and Swatland, 1988). In addition
muscles from the Hampshire breed have been shown to have a darker, redder colour,
which is due to having higher concentrations of myoglobin, the pigment in muscle
(Monin & Sellier, 1985; Warriss, 2000).
Commercially the halothane gene is of interest since its presence is associated with an
increased content of lean meat in the carcass (Fisher et al, 2000). However, the gene
is also linked to porcine stress syndrome in pigs (PSS) which results in increased
levels of PSE in meat (Fisher et al, 2000; Oliver et al, 1993).
Different sire lines have been bred and improved by different genetics companies to
meet differing requirements of producers, processors and retailers. Sire lines are
selected by the producer to maximise their return based on their payment scheme e.g.
supply of pigs 75-85kg dead weight with a P2 <12mm. However, progressive
producers are increasingly using consumer acceptability as a key factor of influence
when selecting sire lines for commercial progeny, aiming at meeting specifications for
UK supermarkets’ premium pork ranges. To achieve the best eating quality possible
research suggests the following criteria need to be met:
Progeny must have ≥ 50% Duroc Genetics (Blanchard et al, 1999b)
Hampshire Sires used need to be either RN-/RN
- or rn
+/RN
- (Huiid, 2002;
Lindahl et al, 2001)
The sire lines need to be Halothane negative to prevent PSE meat. (Fisher et
al, 2000).
Research suggests that animals sired by Duroc have lower shear force values
(Channon et al, 2004) and animals sired by RN- animals show higher levels of drip
loss and lower pH ultimate values (Bertram, Petersen & Andersen, 2000). Hence, the
aim of this project was to investigate whether there is a significant difference in meat
eating quality as assessed by shear force, drip loss and pH, between progeny sired by
different sire lines crossed with the same dam line.
5
MATERIALS AND METHODS
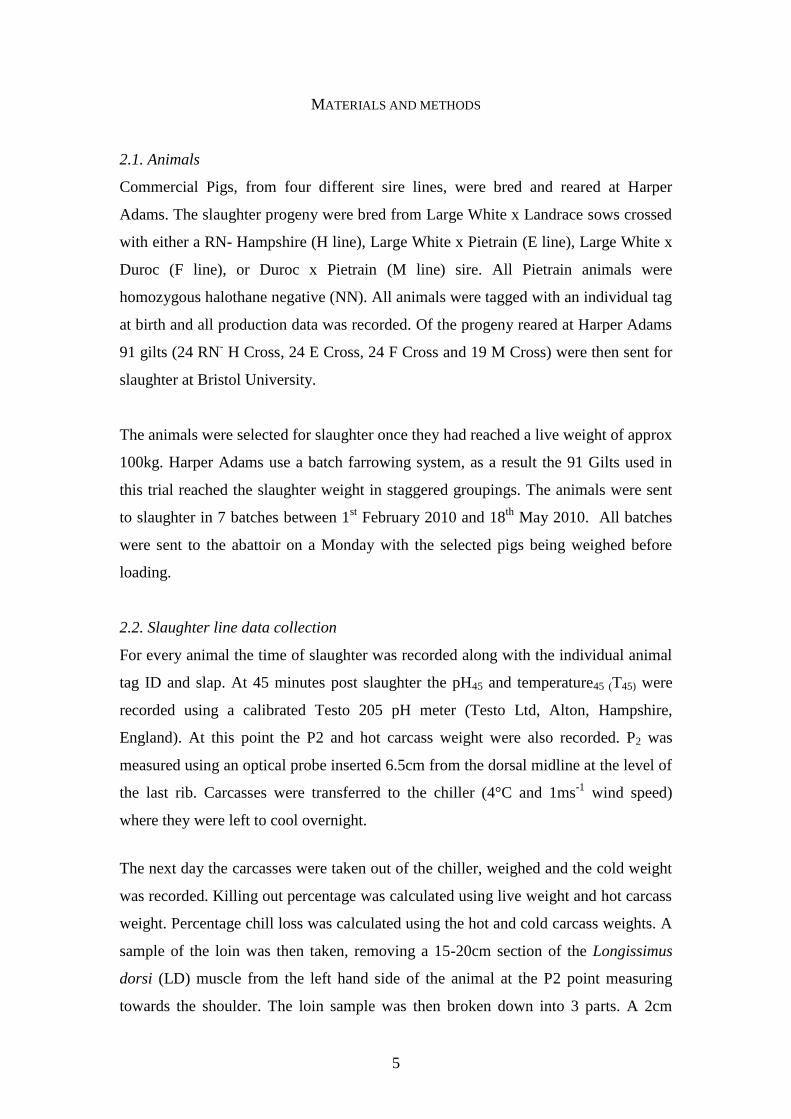
2.1. Animals
Commercial Pigs, from four different sire lines, were bred and reared at Harper
Adams. The slaughter progeny were bred from Large White x Landrace sows crossed
with either a RN- Hampshire (H line), Large White x Pietrain (E line), Large White x
Duroc (F line), or Duroc x Pietrain (M line) sire. All Pietrain animals were
homozygous halothane negative (NN). All animals were tagged with an individual tag
at birth and all production data was recorded. Of the progeny reared at Harper Adams
91 gilts (24 RN- H Cross, 24 E Cross, 24 F Cross and 19 M Cross) were then sent for
slaughter at Bristol University.
The animals were selected for slaughter once they had reached a live weight of approx
100kg. Harper Adams use a batch farrowing system, as a result the 91 Gilts used in
this trial reached the slaughter weight in staggered groupings. The animals were sent
to slaughter in 7 batches between 1st February 2010 and 18
th May 2010. All batches
were sent to the abattoir on a Monday with the selected pigs being weighed before
loading.
2.2. Slaughter line data collection
For every animal the time of slaughter was recorded along with the individual animal
tag ID and slap. At 45 minutes post slaughter the pH45 and temperature45 (T45) were
recorded using a calibrated Testo 205 pH meter (Testo Ltd, Alton, Hampshire,
England). At this point the P2 and hot carcass weight were also recorded. P2 was
measured using an optical probe inserted 6.5cm from the dorsal midline at the level of
the last rib. Carcasses were transferred to the chiller (4°C and 1ms-1
wind speed)
where they were left to cool overnight.
The next day the carcasses were taken out of the chiller, weighed and the cold weight
was recorded. Killing out percentage was calculated using live weight and hot carcass
weight. Percentage chill loss was calculated using the hot and cold carcass weights. A
sample of the loin was then taken, removing a 15-20cm section of the Longissimus
dorsi (LD) muscle from the left hand side of the animal at the P2 point measuring
towards the shoulder. The loin sample was then broken down into 3 parts. A 2cm
6
thick chop near the P2 point was removed, the freshly cut surface was used for
measurements and hence was uppermost when placed on a polystyrene tray. The chop
was covered with overwrap and placed in a chiller to bloom for one hour. The next
2cm chop was removed from the loin sample and used to measure drip. The remaining
section of the loin sample was vacuum packed and aged for 10 days at 1°C before
being frozen. Once all samples had been collected and frozen they were analysed for
texture and intramuscular fat (IMF).
2.3. Bloomed colour, pH24 and drip loss measurement
The colour of the bloomed chop (L*a*b*, CIE, 1976) was measured using a Konica
Minolta CR-400 Meter (Konica Camera Company, Milton Keynes, UK). The chops
were then used to measure pH24 using the calibrated Testo 205, vacuum packed and
frozen for subsequent analysis of IMF.
Drip loss was measured using the bag suspension method (Honikel, 1998). The 2cm
chop was trimmed of all subcutaneous fat and rind and weighed, threaded onto string
near the top of the eye muscle, placed in a net bag and suspended in a plastic bag
which was inflated around the chop. The bag was sealed ensuring that the bag did not
contact the meat surface and suspended in a cold room for 48hours at +1°C.
After 48 hours had passed the chops were removed from both the plastic and net bags,
gently blotted and re-weighed. Percentage drip loss was calculated as follows:
((weight before – weight after) / weight before)*100 = % drip or g/100g meat
2.4. Fat and moisture determination
The frozen chops were thawed in cold water in their bags for 20 minutes. All external
fat and connective tissue was removed and the remaining eye muscle was cut into
cubes and blended in a food processor until smooth. Any drip that remained on the
chopping board or in the vacuum bag was reincorporated during blending.
A 25g blended sample was weighed into a pre-weighed plastic pot which was lidded
and frozen overnight and stored at -20°C until ready to freeze dry in an Edwards
7
Modulyo Freeze dryer (-40°C, 10-1
mBar) for 3 days. Pots and contents were
reweighed and moisture content calculated:
((Pot & Wet Muscle Weight – Pot & Dry Muscle Weight) / (Pot & Wet Muscle
Weight – Empty Pot Weight)) * 100 = % Moisture
The dried muscle sample was ground into a fine dust, transferred into a cellulose
extraction thimble (Fisherbrand FB59483, Range 0007N0028 28mmx80mm) and
plugged with cotton wool. Fat was extracted by the Soxhlet method (British Standard,
BS 4267: part 10, 1994,) using 40-60°C petrol ether (Analytical reagent grade, Fisher
Scientific P/1760/17)
(Buchi Flask & Extracted Fat Weight – Empty Buchi Flask Weight) / (Pot & Wet
Muscle Weight – Empty Pot Weight)) * 100 = % Fat
2.5. Statistical Analysis
All data was analysed using the General Linear Model procedure of GenStat version
12.1 (VSN International Ltd). The data was analysed four times using four different
models. The first model used Line as a factor, the second used Line and date of
slaughter as factors and the final two models had covariates. One model used age at
slaughter as the covariate the other used hot carcass weight as a covariate.
The model for line as a factor:
Yik = μ + Li + eik
Where Yi is the phenotypic value on the trait for animal k. μ is the mean. Li is the
fixed effect of Linei (1,...4). eik is a random residual.
The model for line and date of slaughter as a factor:
Yijk = μ + Li + Dj + eijk
8
Where Yijk is the phenotypic value on the trait for animal k. μ is the mean. Li is the
fixed effect of Linei (1,...4). Dj is the fixed effect of date of slaughter j (1,…7). eijk is
a random residual.
The model for slaughter weight as a covariate:
Yijk = μ + Li + Dj + bAijk + eijk
Where Yijk is the phenotypic value on the trait for animal k. μ is the mean. Li is the
fixed effect of Linei (1,...4). Dj is the fixed effect of date of slaughter j (1,…7). Aijk
is the age at slaughter and b is the linear regression coefficient of Aijk on the trait.
eijk is a random residual.
The model for Hot carcass weight as a covariate:
Yijk = μ + Li + Dj + bWijk + eijk
Where Yijk is the phenotypic value on the trait for animal k. μ is the mean. Li is the
fixed effect of Linei (1,...4). Dj is the fixed effect of date of slaughter j (1,…7). Wijk
is the hot carcass weight and b is the linear regression coefficient of Wijk on the
trait. eijk is a random residual.
9
RESULTS
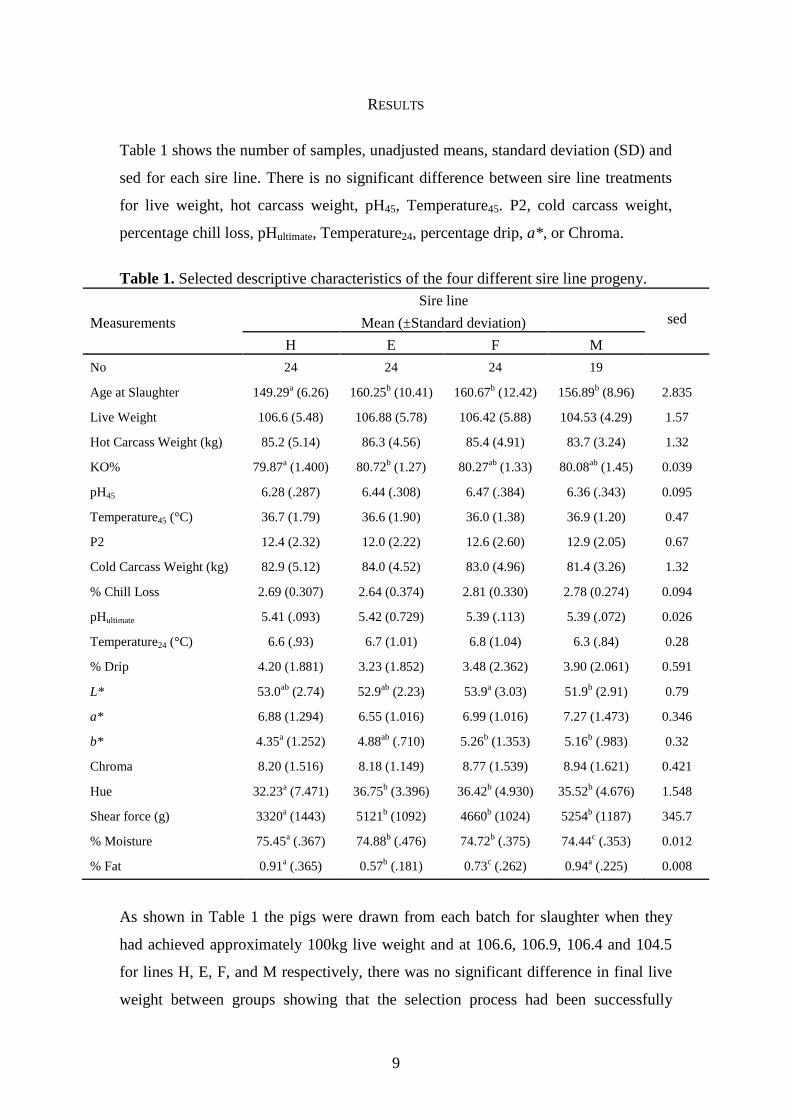
Table 1 shows the number of samples, unadjusted means, standard deviation (SD) and
sed for each sire line. There is no significant difference between sire line treatments
for live weight, hot carcass weight, pH45, Temperature45. P2, cold carcass weight,
percentage chill loss, pHultimate, Temperature24, percentage drip, a*, or Chroma.
Table 1. Selected descriptive characteristics of the four different sire line progeny.
Measurements
Sire line
Mean (±Standard deviation) sed
H E F M
No 24 24 24 19
Age at Slaughter 149.29a (6.26) 160.25
b (10.41) 160.67
b (12.42) 156.89
b (8.96) 2.835
Live Weight 106.6 (5.48) 106.88 (5.78) 106.42 (5.88) 104.53 (4.29) 1.57
Hot Carcass Weight (kg) 85.2 (5.14) 86.3 (4.56) 85.4 (4.91) 83.7 (3.24) 1.32
KO% 79.87a (1.400) 80.72
b (1.27) 80.27
ab (1.33) 80.08
ab (1.45) 0.039
pH45 6.28 (.287) 6.44 (.308) 6.47 (.384) 6.36 (.343) 0.095
Temperature45 (°C) 36.7 (1.79) 36.6 (1.90) 36.0 (1.38) 36.9 (1.20) 0.47
P2 12.4 (2.32) 12.0 (2.22) 12.6 (2.60) 12.9 (2.05) 0.67
Cold Carcass Weight (kg) 82.9 (5.12) 84.0 (4.52) 83.0 (4.96) 81.4 (3.26) 1.32
% Chill Loss 2.69 (0.307) 2.64 (0.374) 2.81 (0.330) 2.78 (0.274) 0.094
pHultimate 5.41 (.093) 5.42 (0.729) 5.39 (.113) 5.39 (.072) 0.026
Temperature24 (°C) 6.6 (.93) 6.7 (1.01) 6.8 (1.04) 6.3 (.84) 0.28
% Drip 4.20 (1.881) 3.23 (1.852) 3.48 (2.362) 3.90 (2.061) 0.591
L* 53.0ab
(2.74) 52.9ab
(2.23) 53.9a (3.03) 51.9
b (2.91) 0.79
a* 6.88 (1.294) 6.55 (1.016) 6.99 (1.016) 7.27 (1.473) 0.346
b* 4.35a (1.252) 4.88
ab (.710) 5.26
b (1.353) 5.16
b (.983) 0.32
Chroma 8.20 (1.516) 8.18 (1.149) 8.77 (1.539) 8.94 (1.621) 0.421
Hue 32.23a (7.471) 36.75
b (3.396) 36.42
b (4.930) 35.52
b (4.676) 1.548
Shear force (g) 3320a (1443) 5121
b (1092) 4660
b (1024) 5254
b (1187) 345.7
% Moisture 75.45a (.367) 74.88
b (.476) 74.72
b (.375) 74.44
c (.353) 0.012
% Fat 0.91a (.365) 0.57
b (.181) 0.73
c (.262) 0.94
a (.225) 0.008
As shown in Table 1 the pigs were drawn from each batch for slaughter when they
had achieved approximately 100kg live weight and at 106.6, 106.9, 106.4 and 104.5
for lines H, E, F, and M respectively, there was no significant difference in final live
weight between groups showing that the selection process had been successfully
10
applied. The H line was significantly younger than the E, F and M lines (P = <0.001;
<0.001 and 0.014 respectively) at point of slaughter even though there was no
significant difference in final live weight.
The killing out percentage for the E line sired slaughter animals was significantly
higher than the H lines (P = 0.033) although there were no other differences between
lines. The F line produced significantly darker meat then the M line (P = 0.02)
although there were no other significant differences in L* values between treatments.
The H line produced a significantly yellower meat with the b* value being
significantly lower then the F and M lines (P = 0.006 and 0.02 respectively). Hue
angle is significantly lower for the H line in comparison to the E, F and M lines (P =
0.004, 0.008 and 0.049 respectively). Shear force values for the E, F and M lines are
significantly higher than the H line (P = <0.001 for all sires). Percentage moisture is
significantly lower in M line progeny than the H, E and F lines (P = <0.001, <0.001
and 0.032 respectively) whilst the H line has significantly higher levels of moisture
than the E, F and M lines (P = <0.001 for all sires). H and M lines have significantly
higher levels of IMF than the E and F lines. The F line has significantly lower levels
of IMF than the H, E and M lines (P = 0.030, 0.039 and 0.012 respectively). Although
significantly higher then the F line the E line has significantly lower levels of IMF
compared to the H and M lines (P = <0.001).
3.1. Analysis of data using date of slaughter as a factor
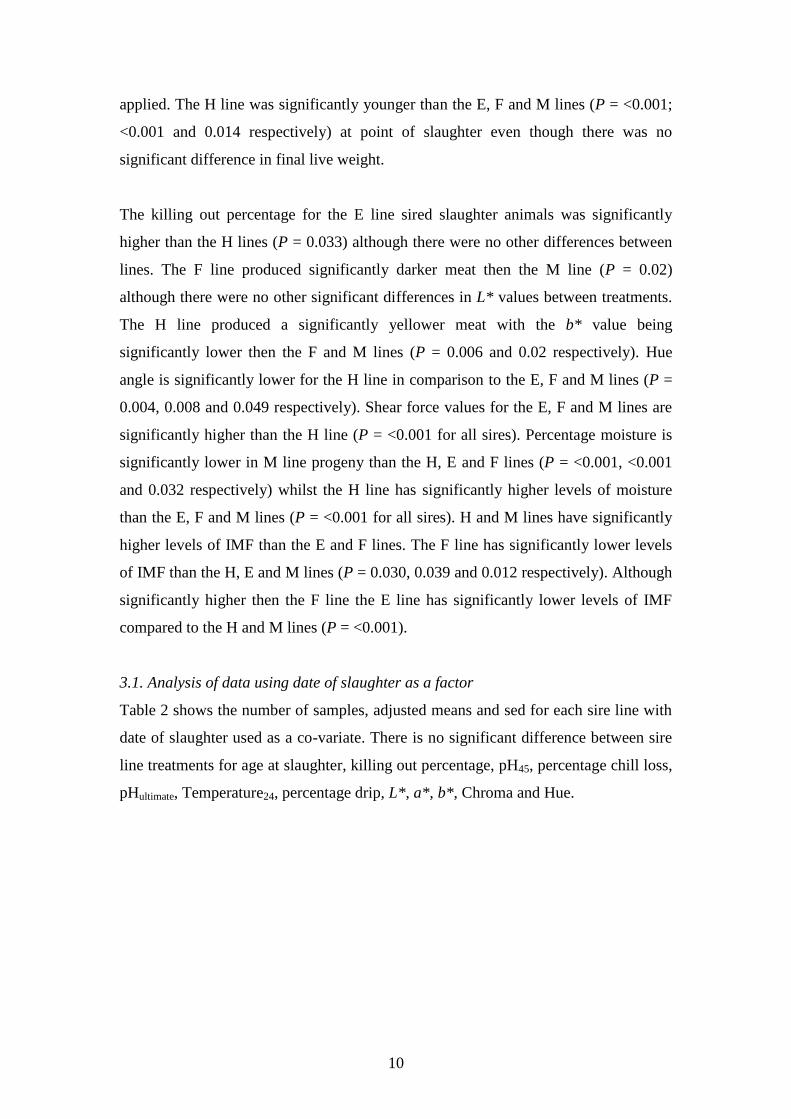
Table 2 shows the number of samples, adjusted means and sed for each sire line with
date of slaughter used as a co-variate. There is no significant difference between sire
line treatments for age at slaughter, killing out percentage, pH45, percentage chill loss,
pHultimate, Temperature24, percentage drip, L*, a*, b*, Chroma and Hue.
11
Table 2. Adjusted means of selected descriptive characteristics of the four different
sire line progeny using day of slaughter as a factor.
Measurements Sire line
Mean sed
H E F M
No 24 24 24 19
Age at Slaughter 149.29 153.24 152.9 149.78 2.18
Live Weight 106.6ab
107.1ab
109.7a 105.5
b 1.328
Hot Carcass Weight (kg) 85.2ab
85.8ab
87.3a 84.3
b 1.123
KO% 79.87 80.12 79.54 79.80 0.036
pH45 6.28 6.43 6.46 6.39 0.085
Temperature45 (°C) 36.7a 35.6
b 35.9
ab 36.5
a 0.371
P2 12.4a 12.7
a 13.4
ab 14.1
b 0.555
Cold Carcass Weight (kg) 82.9ab
83.6ab
85.0a 82.0
b 1.105
% Chill Loss 2.69 2.62 2.69 2.65 0.063
pHultimate 5.41 5.44 5.42 5.44 0.016
Temperature24 (°C) 6.6 7.0 6.8 7.3 0.169
% Drip 4.20 3.04 3.38 3.68 0.573
L* 53.0 52.9 53.4 51.6 0.774
a* 6.88 6.44 6.93 7.22 0.352
b* 4.35 4.38 4.90 4.62 0.294
Chroma 8.20 7.82 8.53 8.61 0.420
Hue 32.23 34.14 34.66 32.43 1.313
Shear force (g) 3320a 5182
c 4269
b 5147
c 325
% Moisture 75.45a 74.87
b 74.82
b 74.40
c 0.11
% Fat 0.91ab
0.65c 0.75
cb 1.06
a 0.07
Live weight of the F line is significantly higher than the M line (P = 0.009). This
significant difference also occurs for the hot carcass weight (P = 0.021) and cold
carcass weight (P = 0.024). The temperature45 of the E line is significantly lower then
the H and M lines (P = 0.01 and 0.04 respectively). The adjusted means show the
backfat for the M line as significantly thinner than the H line (1.7mm, P = 0.012) and
the E line (1.4mm, P = 0.030). The H line is significantly more tender then the E, F
and M lines (P = <0.001, 0.015 and <0.001 respectively). Although not as tender as
the H line the F line has significantly lower shear force compared to the E and M lines
(P = 0.015 and 0.022 respectively).
Percentage moisture is significantly lower in the M line then the H, E and F lines (P =
<0.001, <0.001 and 0.001 respectively). The H line has significantly more moisture
12
than the E, F and M lines (P = <0.001 for all sires). There is no significant difference
in moisture between the E and F lines.
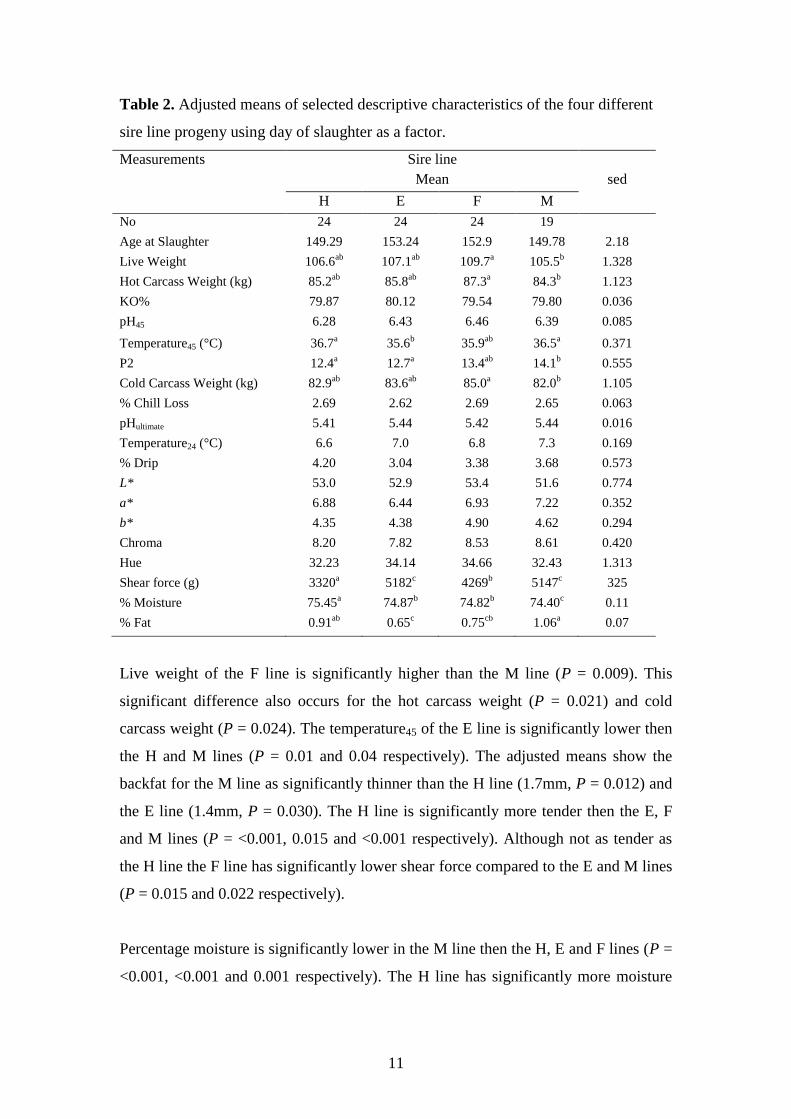
3.2. Analysis of age at slaughter and hot carcass weight as covariates:
Table 3 shows the estimates of covariate. From looking at the data we can see that age
at slaughter significantly affects percentage chill loss, percentage moisture and
percentage fat whilst hot carcass weight significantly affects P2, a*, Chroma, shear
force and percentage moisture, when used as covariates.
Table 3: Estimates of Covariate
Estimate of Covariate
Measurements Age at slaughter
Hot carcass
weight
pH45 -0.00229NS
-0.01132NS
Temp45 0.0061NS
0.0168NS
P2 -0.0053NS
0.1909***
pH24 -0.001550NS
-0.00166NS
% Chill Loss -0.00639* 0.01168NS
% Drip 0.0346NS
0.1103NS
L* -0.0474NS
0.1016NS
a* 0.0036NS
0.0775*
b* 0.0022NS
0.0539NS
Chroma 0.0036NS
0.0922*
Hue -0.0086NS
-0.057NS
Shear Force -9.0NS
-103.6***
% Moisture -0.01660** -0.0240*
% Fat 0.00726* 0.00811NS
% Fat inc P2 as Factor 0.00747* 0.00098NS
Table 3 shows that the age at slaughter has significant effects on percentage moisture
(P = 0.003) and percentage fat (P = 0.044) within a carcass. The estimate of the
covariate shows that as the age of slaughter increases the percentage moisture
decreases (-0.01660) and the percentage fat increases (0.00726). Percentage chill loss
significantly decreases as age at slaughter increases (P = 0.047). No other meat
quality attributes were significantly affected by age at slaughter.
13
When hot carcass weight is included in the statistical model the estimate of the
covariate (Table 3) has a significant affect on P2, a*, chroma, shear force and
percentage moisture. The estimate of the covariate shows as hot carcass weight
increases it has a significant (P < 0.001) additive affect (0.1909) on the P2 of the
animal. As hot carcass weight increases a* and chroma also significantly (P < 0.05)
increase (0.0775 and 0.0922 respectively). For every kilogram (kg) hot carcass weight
increases there is a significant (P < 0.001) decrease in shear force by 103.6g. A
decrease in percentage moisture of 0.0240% is also significantly (P < 0.05) associated
with hot carcass weight increase.
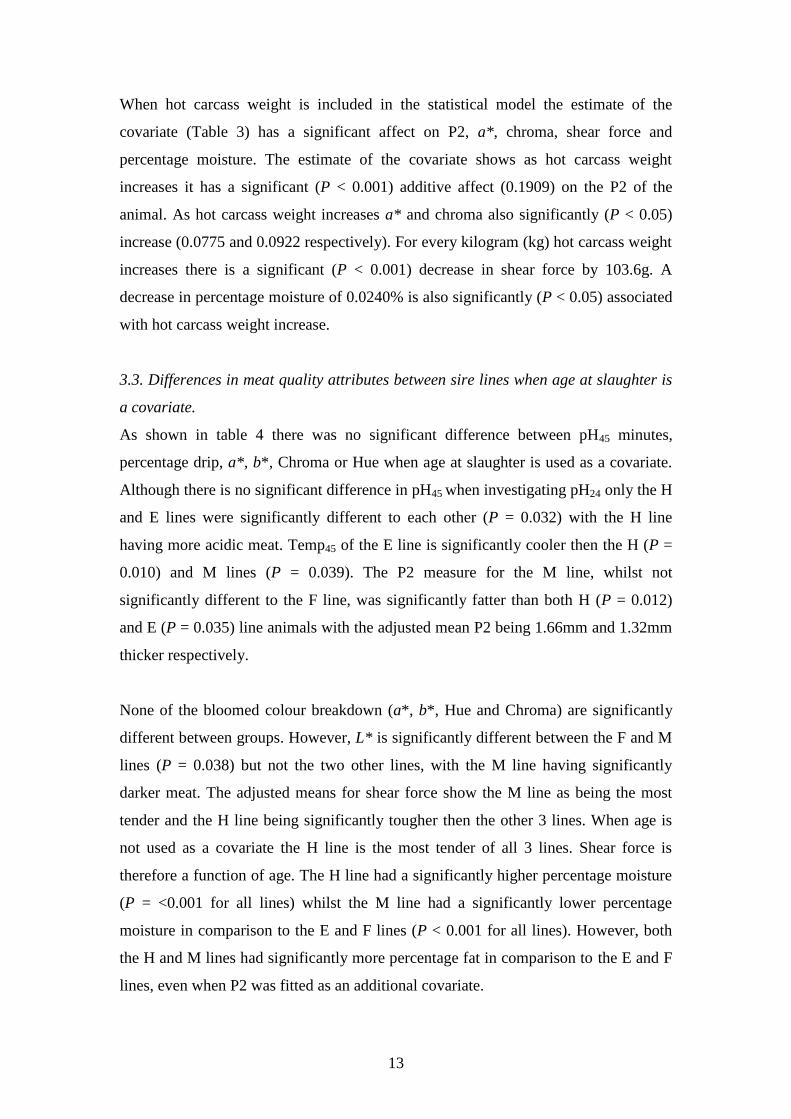
3.3. Differences in meat quality attributes between sire lines when age at slaughter is
a covariate.
As shown in table 4 there was no significant difference between pH45 minutes,
percentage drip, a*, b*, Chroma or Hue when age at slaughter is used as a covariate.
Although there is no significant difference in pH45 when investigating pH24 only the H
and E lines were significantly different to each other (P = 0.032) with the H line
having more acidic meat. Temp45 of the E line is significantly cooler then the H (P =
0.010) and M lines (P = 0.039). The P2 measure for the M line, whilst not
significantly different to the F line, was significantly fatter than both H (P = 0.012)
and E (P = 0.035) line animals with the adjusted mean P2 being 1.66mm and 1.32mm
thicker respectively.
None of the bloomed colour breakdown (a*, b*, Hue and Chroma) are significantly
different between groups. However, L* is significantly different between the F and M
lines (P = 0.038) but not the two other lines, with the M line having significantly
darker meat. The adjusted means for shear force show the M line as being the most
tender and the H line being significantly tougher then the other 3 lines. When age is
not used as a covariate the H line is the most tender of all 3 lines. Shear force is
therefore a function of age. The H line had a significantly higher percentage moisture
(P = <0.001 for all lines) whilst the M line had a significantly lower percentage
moisture in comparison to the E and F lines (P < 0.001 for all lines). However, both
the H and M lines had significantly more percentage fat in comparison to the E and F
lines, even when P2 was fitted as an additional covariate.
14
Table 4: Adjusted mean meat quality attributes using age at slaughter as a covariate
and the fixed effect of day of slaughter (i.e. all animals 149.29 days at slaughter)
Measurements Sire Line
H E F M sed
Number 24 24 24 19
Age at Slaughter 149.29 160.25 160.67 156.89
% Chill Loss 2.71 2.67 2.73 2.68 0.062
% Moisture 74.44a 73.93
b 73.87
b 73.40
c 0.01047
% Fat 0.91a 0.62
b 0.72
b 1.05
a 0.07
% Fat inc P2 as Factor 0.91a 0.60
b 0.69
b 0.99
a 0.07
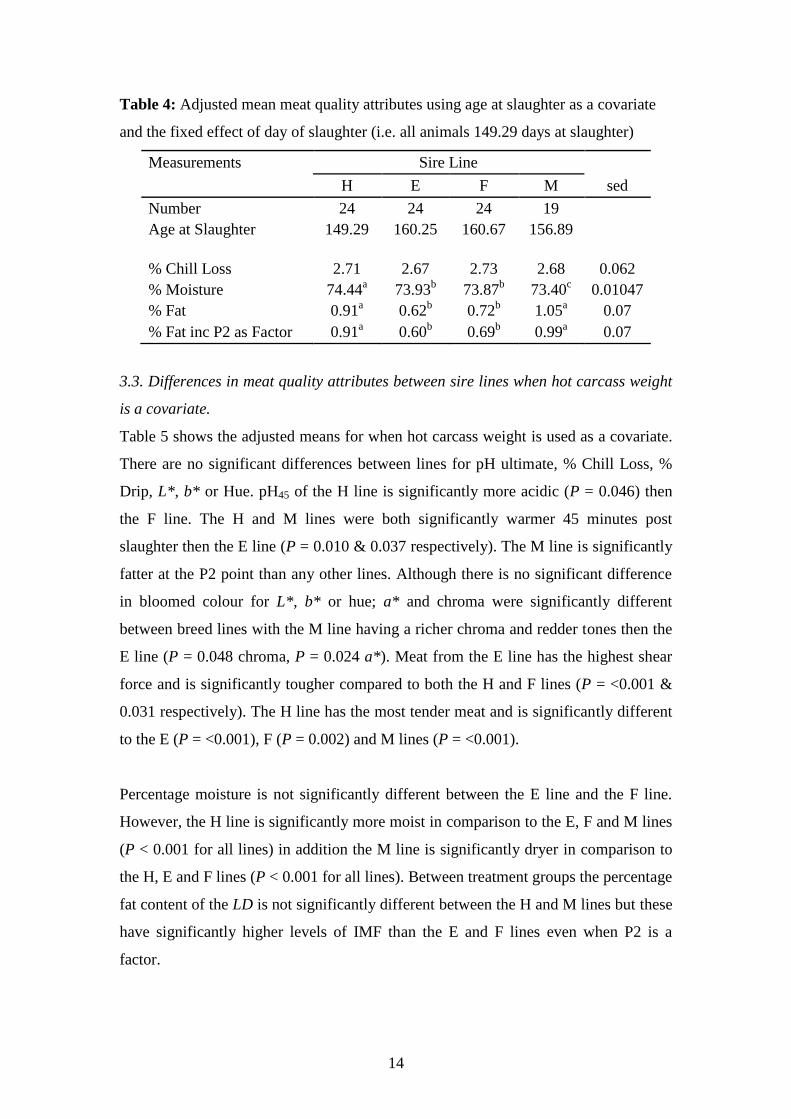
3.3. Differences in meat quality attributes between sire lines when hot carcass weight
is a covariate.
Table 5 shows the adjusted means for when hot carcass weight is used as a covariate.
There are no significant differences between lines for pH ultimate, % Chill Loss, %
Drip, L*, b* or Hue. pH45 of the H line is significantly more acidic (P = 0.046) then
the F line. The H and M lines were both significantly warmer 45 minutes post
slaughter then the E line (P = 0.010 & 0.037 respectively). The M line is significantly
fatter at the P2 point than any other lines. Although there is no significant difference
in bloomed colour for L*, b* or hue; a* and chroma were significantly different
between breed lines with the M line having a richer chroma and redder tones then the
E line (P = 0.048 chroma, P = 0.024 a*). Meat from the E line has the highest shear
force and is significantly tougher compared to both the H and F lines (P = <0.001 &
0.031 respectively). The H line has the most tender meat and is significantly different
to the E (P = <0.001), F (P = 0.002) and M lines (P = <0.001).
Percentage moisture is not significantly different between the E line and the F line.
However, the H line is significantly more moist in comparison to the E, F and M lines
(P < 0.001 for all lines) in addition the M line is significantly dryer in comparison to
the H, E and F lines (P < 0.001 for all lines). Between treatment groups the percentage
fat content of the LD is not significantly different between the H and M lines but these
have significantly higher levels of IMF than the E and F lines even when P2 is a
factor.
15
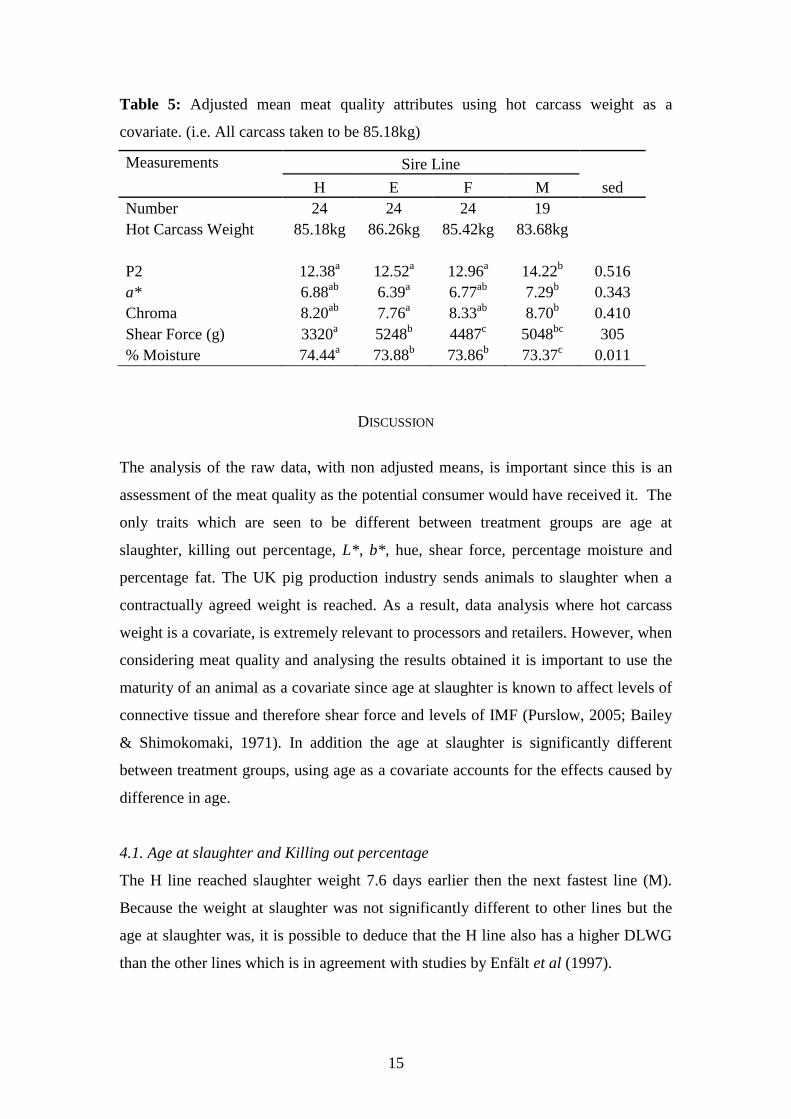
Table 5: Adjusted mean meat quality attributes using hot carcass weight as a
covariate. (i.e. All carcass taken to be 85.18kg)
Measurements Sire Line
H E F M sed
Number 24 24 24 19
Hot Carcass Weight 85.18kg 86.26kg 85.42kg 83.68kg
P2 12.38a 12.52
a 12.96
a 14.22
b 0.516
a* 6.88ab
6.39a 6.77
ab 7.29
b 0.343
Chroma 8.20ab
7.76a 8.33
ab 8.70
b 0.410
Shear Force (g) 3320a 5248
b 4487
c 5048
bc 305
% Moisture 74.44a 73.88
b 73.86
b 73.37
c 0.011
DISCUSSION
The analysis of the raw data, with non adjusted means, is important since this is an
assessment of the meat quality as the potential consumer would have received it. The
only traits which are seen to be different between treatment groups are age at
slaughter, killing out percentage, L*, b*, hue, shear force, percentage moisture and
percentage fat. The UK pig production industry sends animals to slaughter when a
contractually agreed weight is reached. As a result, data analysis where hot carcass
weight is a covariate, is extremely relevant to processors and retailers. However, when
considering meat quality and analysing the results obtained it is important to use the
maturity of an animal as a covariate since age at slaughter is known to affect levels of
connective tissue and therefore shear force and levels of IMF (Purslow, 2005; Bailey
& Shimokomaki, 1971). In addition the age at slaughter is significantly different
between treatment groups, using age as a covariate accounts for the effects caused by
difference in age.
4.1. Age at slaughter and Killing out percentage
The H line reached slaughter weight 7.6 days earlier then the next fastest line (M).
Because the weight at slaughter was not significantly different to other lines but the
age at slaughter was, it is possible to deduce that the H line also has a higher DLWG
than the other lines which is in agreement with studies by Enfält et al (1997).
16
The killing out percentage (KO%) is significantly different between the H and E lines
with the H line having a significantly lower killing out percentage. The main factors
that contribute to differences in KO% are those that affect the live weight of the
animal at the point of slaughter i.e. Housing, system, transport stress, food
withdrawal, dietary regime, gender, body weight and breed (BPEX, 2009). For all
animals the factors were the same except the breed. Therefore it must be the
difference in breed that has created the difference in KO%. This is in agreement with
Monin & Sellier (1985) who also found RN-Hampshire sire animals to have a lower
technological yield.
4.2. P2, percentage moisture and percentage fat
As the age of an animal increases its live weight also increases, however, the
composition within the animal is not constant. The ratio of fat:lean increases
throughout the life of the animal (Whittemore, 1993). The age at which it begins to
lay down more fat relative to lean depends upon the age at which an animal
approaches its mature body weight, with older animals tending to be fatter as
subcutaneous fat is the last tissue to mature (Warriss, 2000). As a result the older an
animal is, the more fat it will have in comparison to lean. Hence, two animals of the
same weight could have different lean to fat ratios due to difference in age. The M
line is significantly fatter (>1.3mm) at P2 then the other lines when means are
adjusted for hot carcass weight, which suggests that it has a lower mature carcass
weight. The results from this study show a positive correlation between percentage fat
and age at slaughter (0.00726) as well as a negative correlation in percentage moisture
and age at slaughter (-0.01660) which is in agreement with Whittemore (1993).
The H and M lines had the highest ratio of muscle lipid to subcutaneous fat thickness.
Wood et al (2004) also found that animals with Duroc genetics had the highest ratio
of muscle lipid to subcutaneous fat thickness. The RN- Hampshire is associated with a
leaner carcass (Enfalt et al, 1997) however, although the heritability of IMF
percentage and fat tissue is high (0.50 and 0.69 respectively) there is a low genetic
correlation between the two suggesting that it is possible to select for carcasses that
have a lean P2 and also have high IMF (Rosenvold & Anderson, 2003).
17
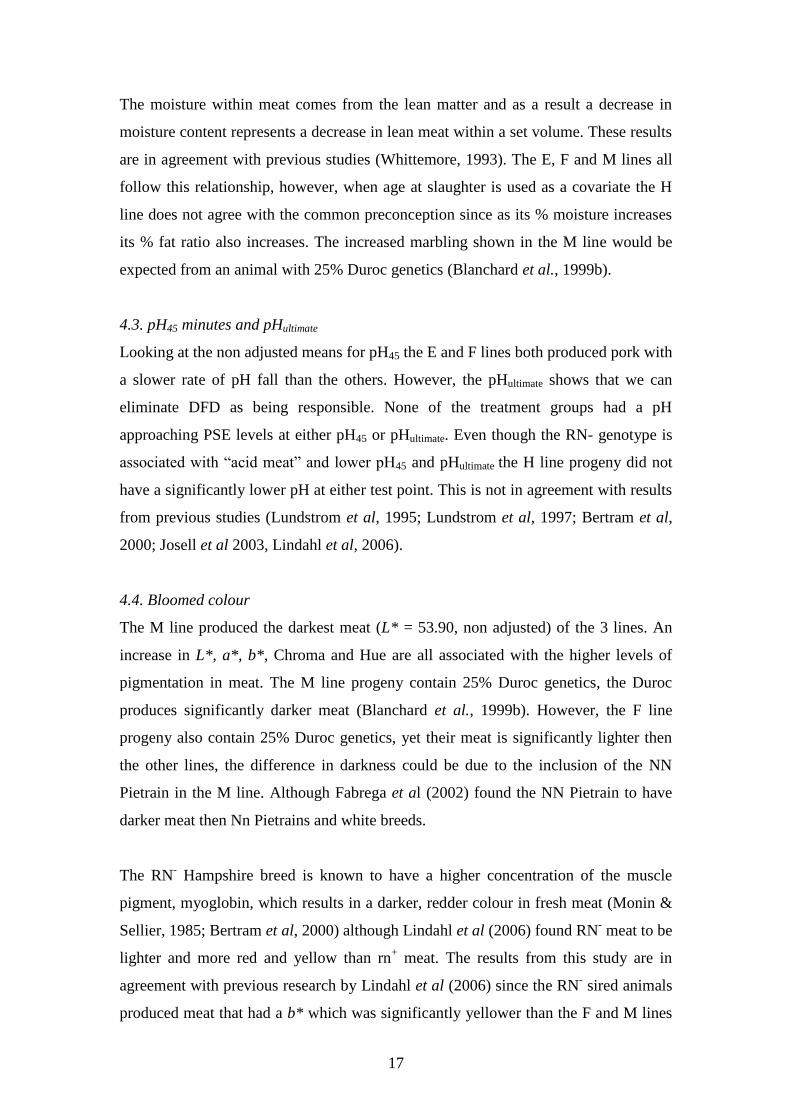
The moisture within meat comes from the lean matter and as a result a decrease in
moisture content represents a decrease in lean meat within a set volume. These results
are in agreement with previous studies (Whittemore, 1993). The E, F and M lines all
follow this relationship, however, when age at slaughter is used as a covariate the H
line does not agree with the common preconception since as its % moisture increases
its % fat ratio also increases. The increased marbling shown in the M line would be
expected from an animal with 25% Duroc genetics (Blanchard et al., 1999b).
4.3. pH45 minutes and pHultimate
Looking at the non adjusted means for pH45 the E and F lines both produced pork with
a slower rate of pH fall than the others. However, the pHultimate shows that we can
eliminate DFD as being responsible. None of the treatment groups had a pH
approaching PSE levels at either pH45 or pHultimate. Even though the RN- genotype is
associated with “acid meat” and lower pH45 and pHultimate the H line progeny did not
have a significantly lower pH at either test point. This is not in agreement with results
from previous studies (Lundstrom et al, 1995; Lundstrom et al, 1997; Bertram et al,
2000; Josell et al 2003, Lindahl et al, 2006).
4.4. Bloomed colour
The M line produced the darkest meat (L* = 53.90, non adjusted) of the 3 lines. An
increase in L*, a*, b*, Chroma and Hue are all associated with the higher levels of
pigmentation in meat. The M line progeny contain 25% Duroc genetics, the Duroc
produces significantly darker meat (Blanchard et al., 1999b). However, the F line
progeny also contain 25% Duroc genetics, yet their meat is significantly lighter then
the other lines, the difference in darkness could be due to the inclusion of the NN
Pietrain in the M line. Although Fabrega et al (2002) found the NN Pietrain to have
darker meat then Nn Pietrains and white breeds.
The RN- Hampshire breed is known to have a higher concentration of the muscle
pigment, myoglobin, which results in a darker, redder colour in fresh meat (Monin &
Sellier, 1985; Bertram et al, 2000) although Lindahl et al (2006) found RN- meat to be
lighter and more red and yellow than rn+ meat. The results from this study are in
agreement with previous research by Lindahl et al (2006) since the RN- sired animals
produced meat that had a b* which was significantly yellower than the F and M lines
18
although not significantly darker or lighter then the other treatments. This is reiterated
when looking at Hue. The RN- sired animals have a colour angle closer to yellow than
the other 3 lines as in agreement with Lindahl et al (2006).
4.5. Shear force
Conditioning of pork meat by storage increases its tenderness on cooking, with 80%
of tenderising being achieved in five days (Etherington, Taylor & Dransfield, 1987).
Wood et al (1996) found that aging pork for 10 days post-mortem had a greater effect
than genotype in improving tenderness. The significant differences in tenderness, for
both statistical models is not due to the 10 day aging process since all lines were aged
for the same length of time. In addition there is no significance between lines for the
standard deviation of shear force, meaning that the level of consistency in tenderness
is the same between lines. However, the lower shear force value demonstrated by the
H line is also seen in studies by Lundstrom, Andresson & Hansson (1996) and
Lundstrom et al (1998). The lower shear force of the H line may not be due to the
younger age at slaughter because the estimate of covariate is not significant. However,
the H line had a faster growth rate and in another large study at Bristol (Richardson,
personal communication), meat from faster growing pigs was more tender than that
from slower growing pigs or those observed to have had a growth check. Younger
animals have less stable collagen fibres (Bailey & Shimokomaki, 1971) and older
animals have increased collagen fibre diameter and mature crosslinks (Purslow,
2005). In addition, Blanchard et al (1999a) showed that pigs which are growing lean
tissue rapidly, particularly in the later stages of the growing period, produce more
tender meat. The H line was over 7 days younger at slaughter then the other breed
groups yet had the same slaughter weight and was not significantly different at the P2
level, thereby the H line had a faster lean tissue growth rate which may also account
for its improved tenderness.
4.7. Percentage drip and chill loss
Neither age at slaughter or hot carcass weight had a significant effect on drip loss.
Age at slaughter had a significant effect (P < 0.05) on percentage chill loss whereas
hot carcass weight did not. There was no significant difference seen between
genotypes for either percentage drip loss or chill loss. This is not in agreement with
other studies where the RN- genotype expressed significantly lower water holding
19
capacity than non-carriers (Lundstrom et al, 1995; Lundstrom et al, 1997; Bertram et
al, 2000; Josell et al 2003).
CONCLUSIONS
Of the 4 lines the RN- Hampshire meets the requirements of both the pig production
industry and the retail industry the best. It has a higher DLWG than the other lines and
produces meat that is significantly more tender than the other sire lines. This is unlike
the other 3 lines has significantly higher % moisture whilst maintaining significantly
higher levels of IMF which results in pork which is more acceptable to the consumer
(Bryhni et al 2002; Fortin, Robertson & Tong, 2005). In addition it does not
demonstrate the higher levels of chill loss or drip as expected from the RN- gene.

20
ACKNOWLEDGEMENTS
The author acknowledges valuable discussions and contributions from Dr Ian
Richardson and Dr Grant Walling, assistance in animal slaughter from Anthony Kelly,
Colin Walters and Richard Ley help with laboratory procedures from Fran
Whittington, Kathy Hallett and Kevin Gibson. All pigs were supplied by JSR
Genetics Ltd. The work was sponsored by JSR Genetics Ltd and BPEX.
21
REFERENCES
Blanchard, P. J., Ellis, M., Warcup, C. C., Hardy, B., Chadwick, J. P. and Deans, G.
A, (1999a). The influence of rate of lean and fat tissue development on pork eating
quality. Animal Science, 68, 477-485
Blanchard, P. J., Warkup, C. C., Ellis, M., Willis, M. B., and Avery, P. (1999b) The
influence of the proportion of Duroc genes on growth, carcass and pork eating quality
characteristics. Animal Science, 68, 495-501
Bailey, A. J. and Shimokomaki, M. S. (1971). Age related changes in the reducible
cross-links of collagen. FEBS Letters, Vol 16, No. 2
Bendall, J. R. and Swatland, H. J. (1988). Review of the relationships of pH with
physical aspects of pork quality. Meat Science, 24, 85-126
Bertram, H. C., Petersen, J. S. and Andersen, H. J. (2000). Relationship between RN-
genotype and drip loss in meat from Danish pigs. Meat Science, 56, 49-55
BPEX (2009), Pre-abattoir factors which can cause variation in killing out percentage.
BPEX, Agriculture and Horticulture Development Board, Stoneleigh Park,
Kenilworth, Warwickshire, CV8 2TL
Brown, S. N., Warriss, P. D., Nute, G. R., Edwards, J. E., and Knowles, T. G. (1998).
Meat quality in pigs subjected to minimal preslaughter stress. Meat Science, 49, 257-
265
Bryhni, E. A., Byrne, D. V., Rødbotten, M., Claudi-Magnussen, C., Agerhem, H.,
Johansson, M., Lea, P. and Martens, M. (2002). Consumer perceptions of pork in
Denmark, Norway and Sweden. Food Quality and Preference. 13, 257-266
Channon, H. A., Kerr, M. G., and Walker P. J. (2004). Effect of Duroc content, sex
and aging period on meat and eating quality attributes of pork loin. Meat Science, 66,
881-888
22
Etherington, D. J., Taylor, M. A. J. and Dransfield E. (1987). Conditioning of meat
from different species. Relationship between tenderising and the levels of Cathepsin
B, Cathepsin L, Calpain I, Calpain II and β-glucuronidase. Meat Science, 20, 1-18
Enfält, A. C., Lundström, K., Hansson, I., Johansen, S. and Nystöm, P.-E. (1997).
Comparison of non-carriers and heterozygous carriers of the RN- allele for carcass
composition, muscle distribution and technological meat quality in Hampshire-sired
pigs. Livestock Production Science, 47, 221-229
Fabrega, E., Manteca, X., Font, J., Gispert, M., Carrion, D., Velarde, A., Ruiz-de-la-
Torre, J. L. and Diestre, A. (2002) Effects of halothane gene and pre-slaughter
treatment on meat quality and welfare from two pig crosses. Meat Science, 62, 463-
472
Fernandez, A., Tornberg, E., Naveau, L., Talmant., and Monin, G. (1992). Bimodal
distribution of muscle glycolytic potential in French and Swedish population of
Hampshire crossbred pigs. Journal of Science Food & Agriculture, 59, 307-311
Fisher, P., Mellett, F. D. and Hoffman (2000) Halothane genotype and pork quality. 1.
Carcass and meat quality characteristics of three halothane genotypes. Meat Science,
54, 97-105
Fortin, A., Robertson, W. M. and Tong, A. K. W. (2005). The eating quality of
Canadian pork and its relationship with intramuscular fat. Meat Science, 69, 297-305
Honikel, K.O. (1998) Reference methods for the assessment of physical
characteristics of meat. Meat Science 49, 447-457.
Huiid, M. (2002) Proceedings of the 7th World Congress on Genetics Applied to
Livestock Production, Montpellier, France, August, 2002, Plenary Session
23
Josell, A., von Seth, G., and Tornberg, E. (2003) Sensory and meat quality traits of
pork in relation to post-slaughter treatment and RN genotype. Meat Science, 66, 113-
124
Lindahl, G., Enfalt, A.-C., Andersen, H. and Lundstrom, K. (2006). Impact of RN
genotype and aging time on colour characteristics of the port muscles longissimus
dorsi and semimembranosus. Meat Science. 74, 746-755.
Lindahl, G., Lundstrom, K. and Tornberg, E. (2001) Contribution of pigment content,
myoglobin forms and internal reflectance to the colour of pork loin and ham from
pure breed pigs. Meat Science, 59, 141-151
Lundström, K., Andresson, A. and Hansson, I. (1996). Effects of the RN gene on
technological and sensory meat quality in crossbred pigs with Hampshire as terminal
sire. Meat Science, 42, 2 145-153
Lundström, K., Enfält, A.-C., Tornberg, E. and Agerhem, H. (1998). Sensory and
technological meat quality in carriers and non-carriers of the RN- allele in Hampshire
crosses and in purebred Yorkshire pigs. Meat Science, 48, 1/2, 115-124
Monin, G. and Sellier, P. (1985). Pork of low technological quality with normal rate
of muscle pH fall in the immediate post-mortem period: The case of Hampshire breed.
Meat Science, 20, 149-158
Meat & Livestock Commission. (1992) Blueprint for Quality British Pork, Meat
Technology Transfer Group, PO Box 44, Winterhill House, Snowdon Drive,
Winterhill, Milton Keynes, MK6 1AX.
Oliver, M. A., Gispert, M. and Diestre, A. (1993). The effects of Breed and Halothane
Sensitivity on Pig Meat Qulity. Meat Science, 35, 105-118
Purslow, P. P. (2005). Intramuscular connective tissue and its role in meat quality.
Meat Science 70, 435 - 447
24
Rosenvold, K. and Andersen, H. J. (2003). Factors of significance for pork quality – a
review. Meat Science, 64, 219-237
Warriss, P. D., (2000) Meat science: An introductory text. CABI publishing.
IBSN 0 85199 424 5
Wood, J. D., Brown, S. N., Nute, G. R., Whittington, F.M., Perry, A. M., Johnson, S.
P. and Enser, M. (1996). Effects of breed, feed level and conditioning time on
tenderness of pork. Meat Science, 44, 105-112.
Wood, J. D., Nute, G. R., Richardson, R. I., Whittington, F. M., Southwood, O.,
Plastow, G., Mansbridge, R., da Costa, N. and Chang, K. C. (2004). Effects of breed,
diet and muscle on fat deposition and eating quality in pigs. Meat Science, 67, 651-
667
Whittemore, C. (1993). The Science and Practice of Pig Production. Longman
Scientific & Technical, pp51. ISBN 0-582-09220-5
Assessment of Novel Sire Lines for Meat Quality
Traits
Caroline E. Mitchell
University of Bristol
Division of Farm Animal Science
Langford
Bristol
BS40 5DU
UK
Submitted 8th
September 2010
A dissertation submitted to the University of Bristol in accordance with the
requirements of the degree of MSc Meat Science and Technology in the Faculty of
Medical and Veterinary Sciences.
2
AUTHOR’S DECLARATION
I declare that the work in this dissertation was carried out in accordance with the
regulations of the University of Bristol. The work is original except where indicated
by special reference in the text and no part of the dissertation has been submitted for
any other degree.
Any views expressed in the dissertation are those of the author and in no way
represent those of the University of Bristol.
The dissertation has not been presented to any other University for examination either
in the United Kingdom or overseas.
Signed Date 8th
September 2010
3
CONTENTS:
1. Introduction: ............................................................................................................... 5
1.1 PSE and DFD meat .................................................................................................. 5
1.2 Tenderness of meat .................................................................................................. 8
2. Breeding Stock: ........................................................................................................ 11
2.1 Selecting the Dam Line: ......................................................................................... 11
2.2 Selecting the Sire Line: .......................................................................................... 13
2.2.1 Duroc Sire lines: ................................................................................................. 13
2.2.2 Hampshire Sire lines: .......................................................................................... 14
2.3 Genetics Affecting Pork Quality ............................................................................ 15
2.3.1 Halothane Gene: .................................................................................................. 15
2.3.2 The RN¯ Gene: ................................................................................................... 15
2.3.3 Polygenic effects: ................................................................................................ 16
3. Feeding: .................................................................................................................... 17
3.1 Lifetime feeding: .................................................................................................... 17
3.2 Magnesium Supplementation: ............................................................................... 18
3.3 Selenium Supplementation (Sel-Plex or Organic Selenium): ................................ 19
3.4 Vitamin D Supplementation: ................................................................................. 19
3.5 Vitamin E Supplementation: .................................................................................. 20
4. Boar Taint: ............................................................................................................... 21
4.1 Introduction: ........................................................................................................... 21
4.2 Androstenone: ........................................................................................................ 22
4.3 Skatole: .................................................................................................................. 23
4.4 Levels of Tolerance: .............................................................................................. 25
4.5 Feeding and boar taint: ........................................................................................... 25
5. Transport .................................................................................................................. 30
5.2 Stocking Density, Temperature and Ventilation: ................................................... 33
5.3 Journey Time and Associated Stressors: ................................................................ 35
5.4 Handling: ................................................................................................................ 36
5.5 Conclusions: ........................................................................................................... 36
6. Lairage: .................................................................................................................... 38
7. Slaughter & Refrigeration: ....................................................................................... 39

4
7.1 Slaughter Method: .................................................................................................. 39
7.2 Refrigeration: ......................................................................................................... 39
8. Consumer acceptability: ........................................................................................... 42
References: ................................................................................................................... 44
5
1. INTRODUCTION:
There are many factors to consider when analysing pork meat quality. It is necessary
to test pig lines to ensure that they produce the growth rates, productivity and
economy of production required by the pig production industry, whilst ensuring that it
is also visually and organoleptically acceptable to the consumer without loosing
technological yield or being microbially hazardous. All these areas are encapsulated
by the term meat quality.
Meat quality can be divided into technological quality and quality attributes both
depend on animal-related and environmental factors (Lammens et al, 2007). Quality
assessment looks at the inherent properties of meat such as water-holding capacity,
tenderness, colour, fat content and composition, oxidative stability and uniformity
(Rosenvold et al, 2003), as well as suitability for further processing, storage and retail.
Animal-related and environmental factors include, breed, genotype, nutrition, pre-
slaughter handling, stunning, slaughter method and post-slaughter handling. All these
factors can affect muscle metabolism and therefore affect the development of PSE
(pale, soft, exudative) and DFD (dark, firm, dry) meat. Both PSE and DFD meat are a
major problem for the pork industry (Lammens et al, 2007). All the levels of quality
are mainly affected by whether the meat is PSE (Pale, Soft, Exudative), DFD (Dark,
Firm, Dry) or acid meat (Hampshire Effect).
1.1 PSE AND DFD MEAT
Both PSE & DFD meat are a direct result of the levels of stress received by the
animal:
o PSE – Acute stress, lasting hours, minutes prior to slaughter
o DFD – Chronic stress, lasting hours, day, weeks etc prior to slaughter
(Warriss, 2000)
6
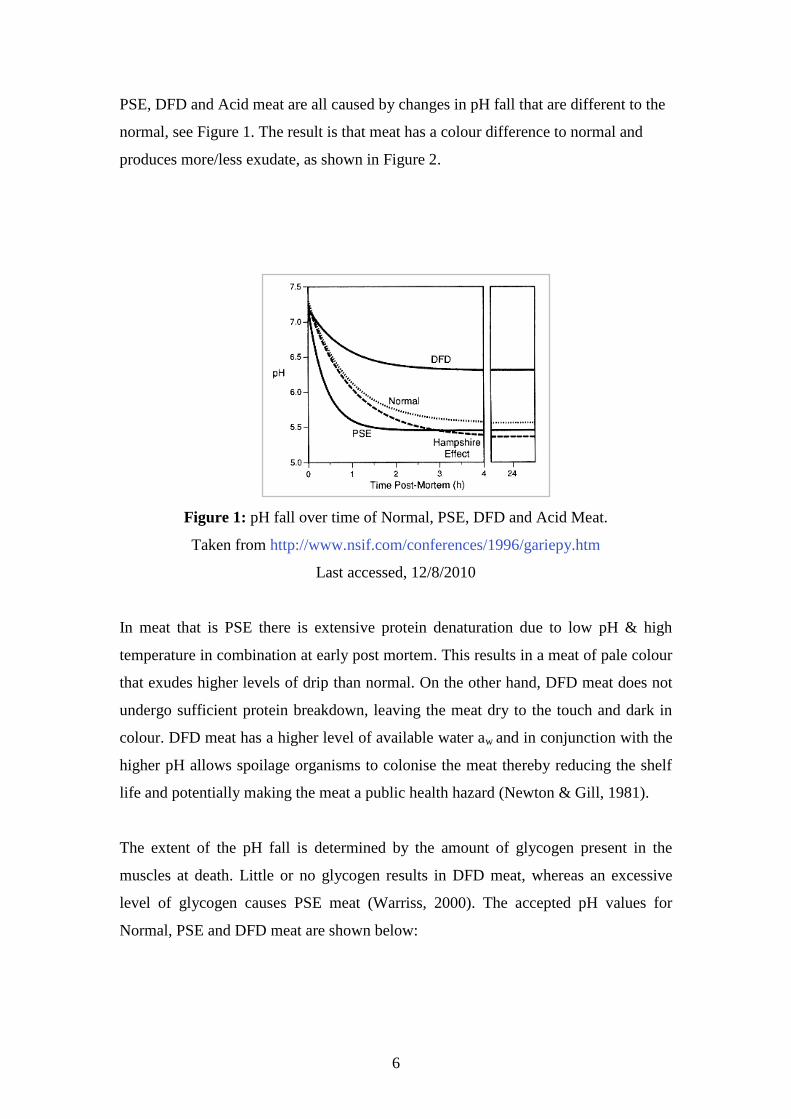
PSE, DFD and Acid meat are all caused by changes in pH fall that are different to the
normal, see Figure 1. The result is that meat has a colour difference to normal and
produces more/less exudate, as shown in Figure 2.
Figure 1: pH fall over time of Normal, PSE, DFD and Acid Meat.
Taken from http://www.nsif.com/conferences/1996/gariepy.htm
Last accessed, 12/8/2010
In meat that is PSE there is extensive protein denaturation due to low pH & high
temperature in combination at early post mortem. This results in a meat of pale colour
that exudes higher levels of drip than normal. On the other hand, DFD meat does not
undergo sufficient protein breakdown, leaving the meat dry to the touch and dark in
colour. DFD meat has a higher level of available water aw and in conjunction with the
higher pH allows spoilage organisms to colonise the meat thereby reducing the shelf
life and potentially making the meat a public health hazard (Newton & Gill, 1981).
The extent of the pH fall is determined by the amount of glycogen present in the
muscles at death. Little or no glycogen results in DFD meat, whereas an excessive
level of glycogen causes PSE meat (Warriss, 2000). The accepted pH values for
Normal, PSE and DFD meat are shown below:
7
Standard pH Plot
pH45 pH24
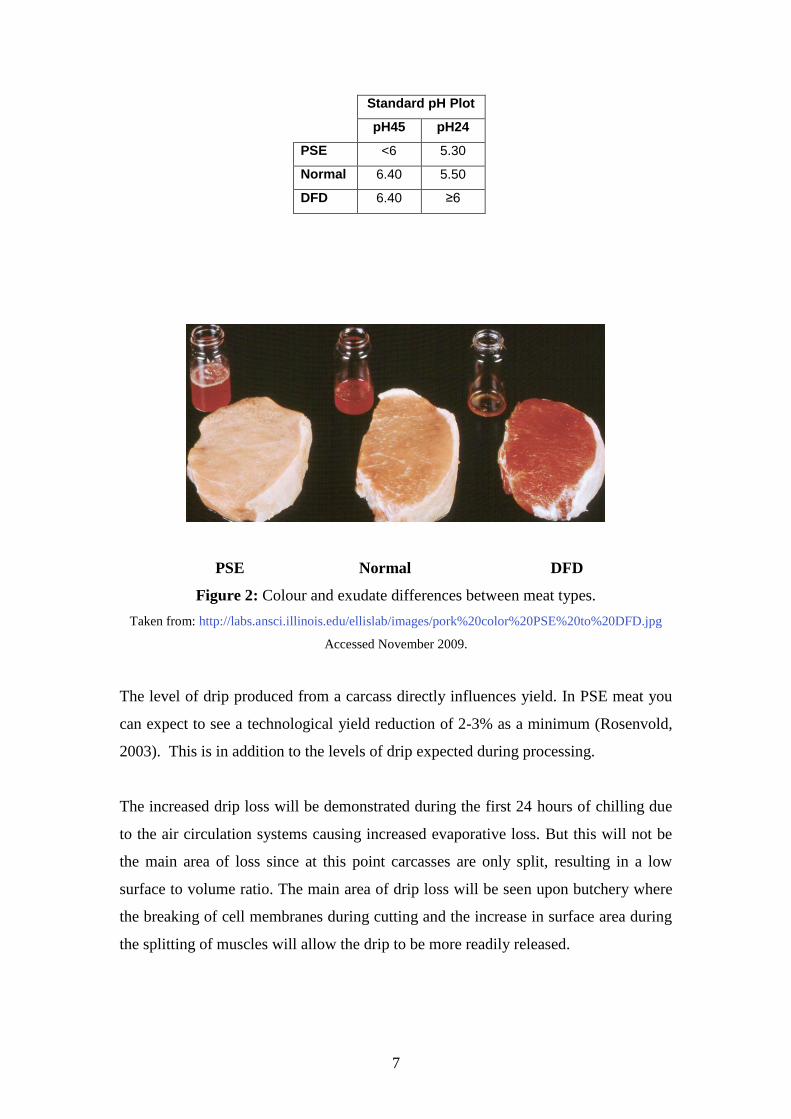
PSE <6 5.30
Normal 6.40 5.50
DFD 6.40 ≥6
PSE Normal DFD
Figure 2: Colour and exudate differences between meat types.
Taken from: http://labs.ansci.illinois.edu/ellislab/images/pork%20color%20PSE%20to%20DFD.jpg
Accessed November 2009.
The level of drip produced from a carcass directly influences yield. In PSE meat you
can expect to see a technological yield reduction of 2-3% as a minimum (Rosenvold,
2003). This is in addition to the levels of drip expected during processing.
The increased drip loss will be demonstrated during the first 24 hours of chilling due
to the air circulation systems causing increased evaporative loss. But this will not be
the main area of loss since at this point carcasses are only split, resulting in a low
surface to volume ratio. The main area of drip loss will be seen upon butchery where
the breaking of cell membranes during cutting and the increase in surface area during
the splitting of muscles will allow the drip to be more readily released.
8
DFD meat, whilst not affecting the yield of a carcass negatively, has a reduced shelf
life and will become spoiled by pathogens faster than normal meat due to a greater aw
value. The aw of meat determines what spoilage organisms will flourish and will
directly affect the safety of the final product. DFD meat also has poor processing
characteristics with slow/uneven formation of cured meat pigments. Flavour
development is poor in both processed and cooked fresh DFD meat. If DFD meat is
vacuum-packed a green colouration may develop due to sulphmyoglobin.
There is also evidence that stress pre-slaughter may predispose animals to showing
blood splash in their muscles and other tissues which results in yield loss (Channon et
al, 2002). Due to PSE & DFD meat being the result of stressors there are many areas
to investigate.
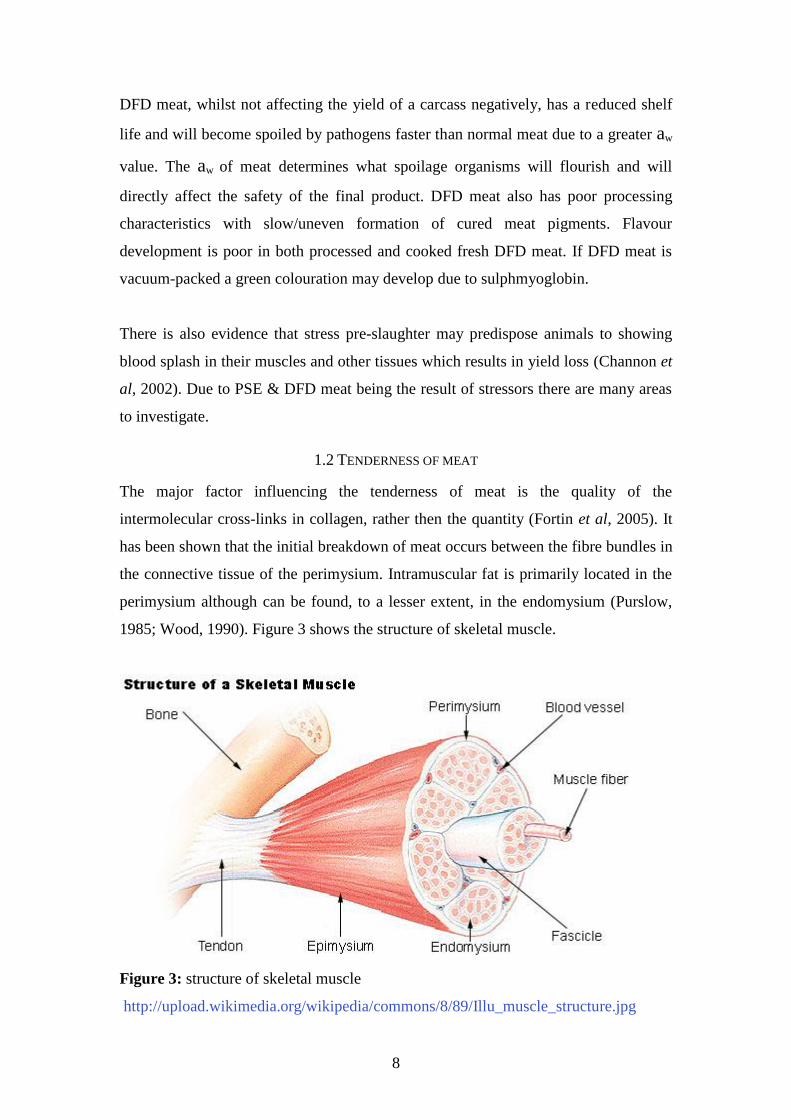
1.2 TENDERNESS OF MEAT
The major factor influencing the tenderness of meat is the quality of the
intermolecular cross-links in collagen, rather then the quantity (Fortin et al, 2005). It
has been shown that the initial breakdown of meat occurs between the fibre bundles in
the connective tissue of the perimysium. Intramuscular fat is primarily located in the
perimysium although can be found, to a lesser extent, in the endomysium (Purslow,
1985; Wood, 1990). Figure 3 shows the structure of skeletal muscle.
Figure 3: structure of skeletal muscle
http://upload.wikimedia.org/wikipedia/commons/8/89/Illu_muscle_structure.jpg
9
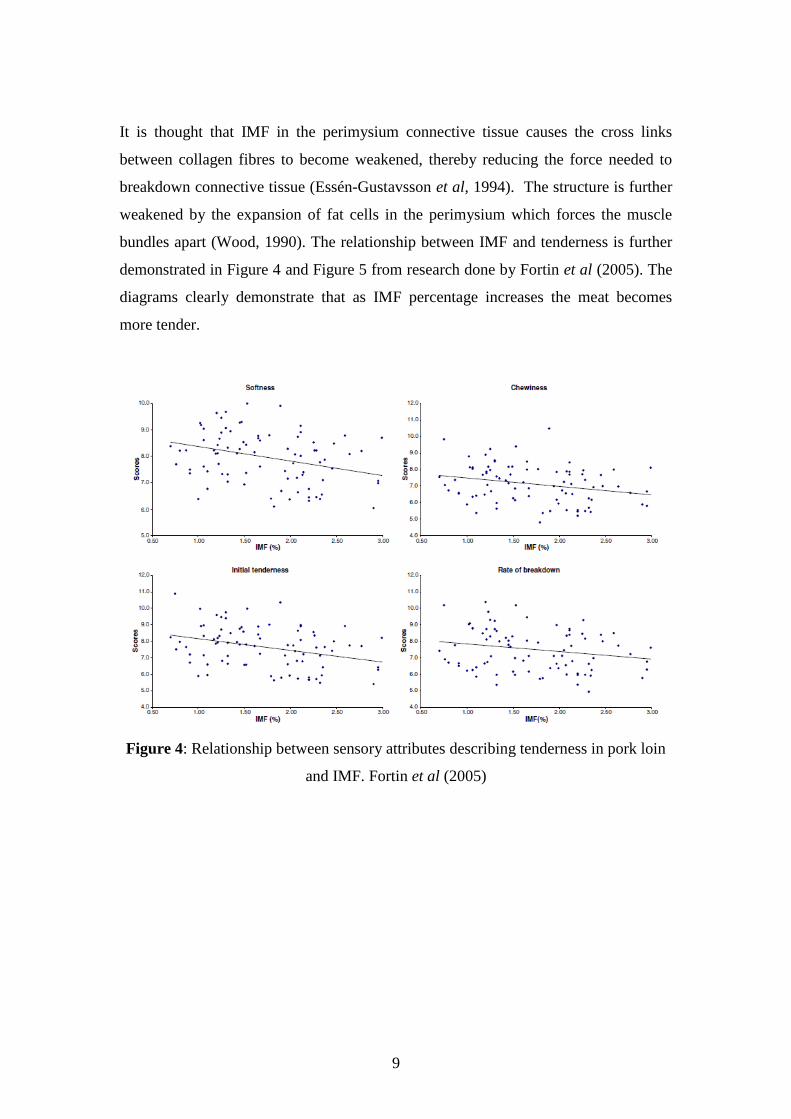
It is thought that IMF in the perimysium connective tissue causes the cross links
between collagen fibres to become weakened, thereby reducing the force needed to
breakdown connective tissue (Essén-Gustavsson et al, 1994). The structure is further
weakened by the expansion of fat cells in the perimysium which forces the muscle
bundles apart (Wood, 1990). The relationship between IMF and tenderness is further
demonstrated in Figure 4 and Figure 5 from research done by Fortin et al (2005). The
diagrams clearly demonstrate that as IMF percentage increases the meat becomes
more tender.
Figure 4: Relationship between sensory attributes describing tenderness in pork loin
and IMF. Fortin et al (2005)
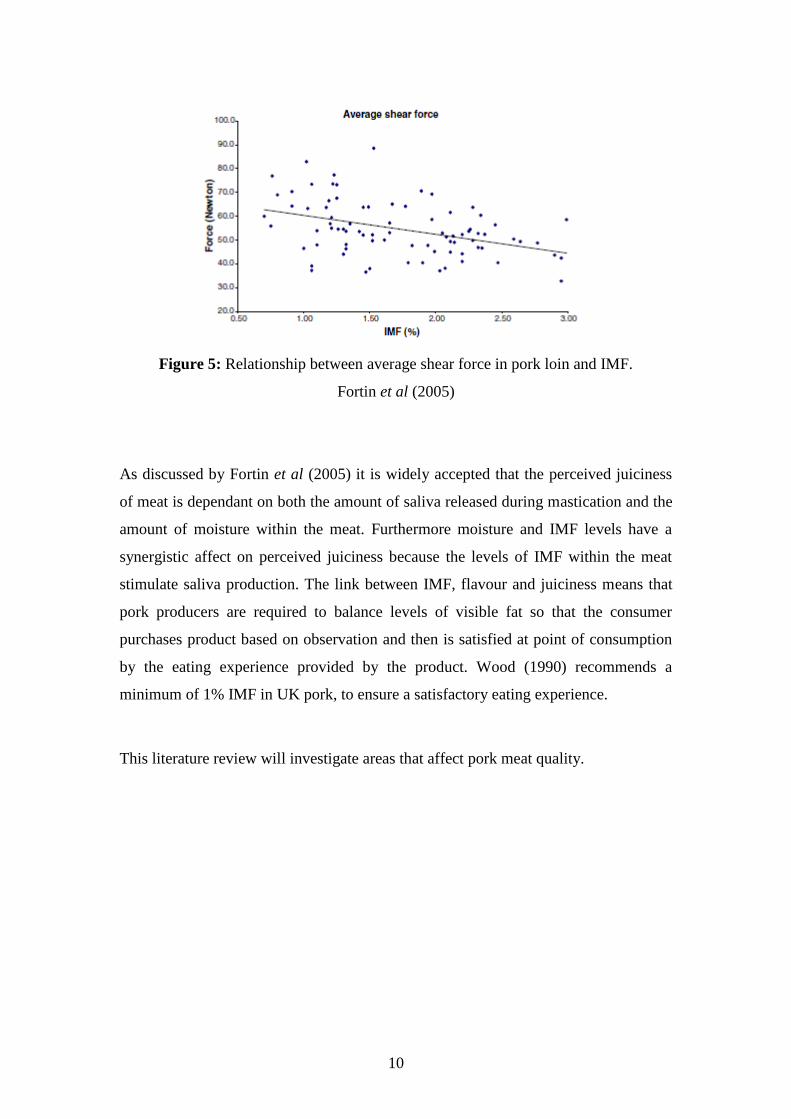
10
Figure 5: Relationship between average shear force in pork loin and IMF.
Fortin et al (2005)
As discussed by Fortin et al (2005) it is widely accepted that the perceived juiciness
of meat is dependant on both the amount of saliva released during mastication and the
amount of moisture within the meat. Furthermore moisture and IMF levels have a
synergistic affect on perceived juiciness because the levels of IMF within the meat
stimulate saliva production. The link between IMF, flavour and juiciness means that
pork producers are required to balance levels of visible fat so that the consumer
purchases product based on observation and then is satisfied at point of consumption
by the eating experience provided by the product. Wood (1990) recommends a
minimum of 1% IMF in UK pork, to ensure a satisfactory eating experience.
This literature review will investigate areas that affect pork meat quality.
11
2. BREEDING STOCK:
Pork meat comes from the progeny that result from using Sire Line genetics on a
commercial crossbred sow. In the UK pig industry indoor pig production systems
favour a Large White x Landrace sow. The sows have been bred for their mothering
abilities, prolificacy, longevity and the production system that they will be in. Sire
animals are selected based on what is desired from the final commercial progeny e.g.
large loin eye area, large ham muscle or further processing ability. The inclusion of at
least 50% Duroc genetics, whilst having no effect on daily live weight gain or lean
tissue conversion ratio (Blanchard et al,. 1999) results in significantly darker meat,
firmer fat and increased marbling (Blanchard et al., 1999). The MLC (1992) Blueprint
recommends a 50-75% Duroc inclusion for improved pork tenderness and juiciness.
However, other commercially used sire lines are known to have meat quality
advantages.
Pig producers aim to produce slaughter animals that have an efficient conversion of
feed into good-quality lean meat, since consumers demand lean meat at the lowest
possible cost (Aumaitre et al, 1982). Commercially the halothane gene is of interest
since its presence is associated with an increased content of lean meat in the carcass
(Fisher et al, 2000). However, the gene is also linked to porcine stress syndrome in
pigs (PSS) which results in increased levels of PSE in meat (Fisher et al, 2000; Oliver
et al, 1993).
Different sire lines have been bred and improved by different genetics companies to
meet the specific remit of processors and retailers. However, consumer acceptability
is only just becoming a key factor of influence when selecting sire lines for
commercial progeny.
2.1 SELECTING THE DAM LINE:
The choice of dam line is affected by the production system to be used. However, it
should be considered that some dam lines contain Duroc in their genetics that will
improve the eating quality of the offspring if used with a Duroc sire line (Channon et
12
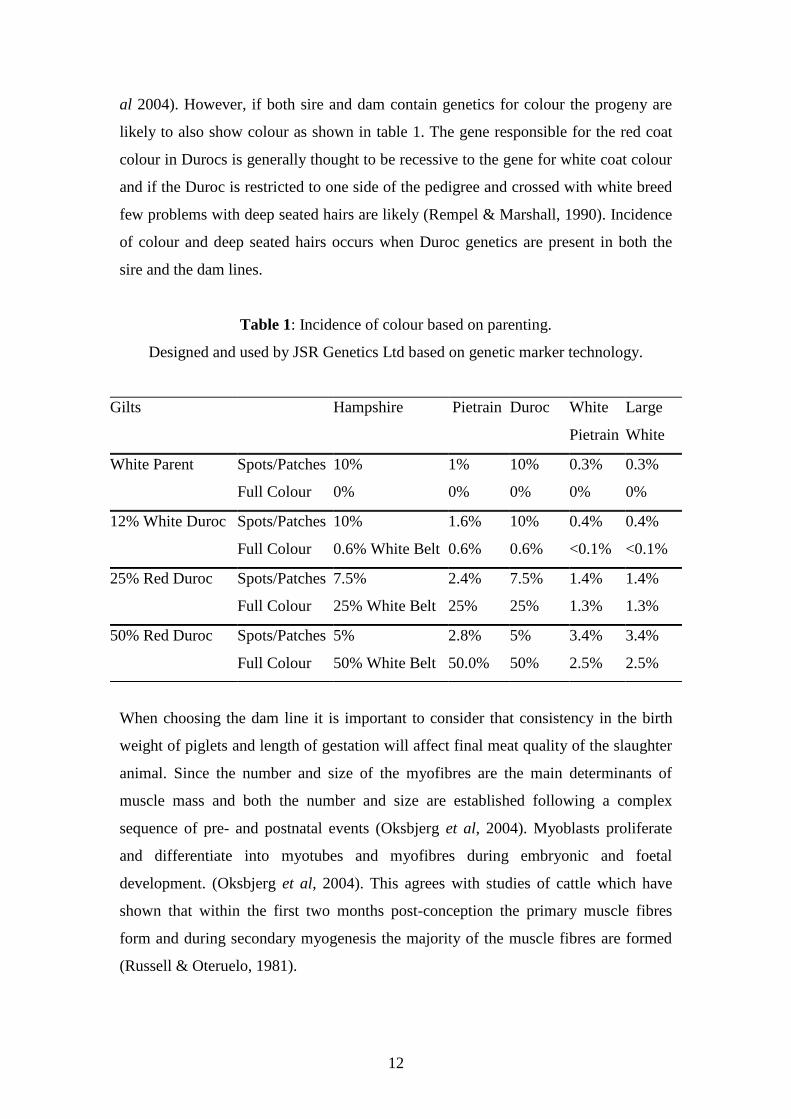
al 2004). However, if both sire and dam contain genetics for colour the progeny are
likely to also show colour as shown in table 1. The gene responsible for the red coat
colour in Durocs is generally thought to be recessive to the gene for white coat colour
and if the Duroc is restricted to one side of the pedigree and crossed with white breed
few problems with deep seated hairs are likely (Rempel & Marshall, 1990). Incidence
of colour and deep seated hairs occurs when Duroc genetics are present in both the
sire and the dam lines.
Table 1: Incidence of colour based on parenting.
Designed and used by JSR Genetics Ltd based on genetic marker technology.
Gilts Hampshire Pietrain Duroc White
Pietrain
Large
White
White Parent Spots/Patches
Full Colour
10%
0%
1%
0%
10%
0%
0.3%
0%
0.3%
0%
12% White Duroc Spots/Patches
Full Colour
10%
0.6% White Belt
1.6%
0.6%
10%
0.6%
0.4%
<0.1%
0.4%
<0.1%
25% Red Duroc
Spots/Patches
Full Colour
7.5%
25% White Belt
2.4%
25%
7.5%
25%
1.4%
1.3%
1.4%
1.3%
50% Red Duroc Spots/Patches
Full Colour
5%
50% White Belt
2.8%
50.0%
5%
50%
3.4%
2.5%
3.4%
2.5%
When choosing the dam line it is important to consider that consistency in the birth
weight of piglets and length of gestation will affect final meat quality of the slaughter
animal. Since the number and size of the myofibres are the main determinants of
muscle mass and both the number and size are established following a complex
sequence of pre- and postnatal events (Oksbjerg et al, 2004). Myoblasts proliferate
and differentiate into myotubes and myofibres during embryonic and foetal
development. (Oksbjerg et al, 2004). This agrees with studies of cattle which have
shown that within the first two months post-conception the primary muscle fibres
form and during secondary myogenesis the majority of the muscle fibres are formed
(Russell & Oteruelo, 1981).
13
2.2 SELECTING THE SIRE LINE:
Sire line is often chosen based on hybrid vigour, disease resistance and conformation.
However, a sire line boar with good conformation does not mean the progeny will
have good meat eating quality. Carcass quality and Meat quality are only weakly
related, if at all.
There are only two sire line breeds (Duroc and Hampshire) that have been proven to
produce consistently high eating quality meat. However, when using good eating
quality sire lines the genetics of these lines also need to be considered. To achieve the
best eating quality possible the following criteria need to be met:
Progeny must have ≥ 50% Duroc Genetics (Blanchard et al, 1999)
Hampshire Sires used need to be either RN-/RN
- or rn
+/ RN
- (Huiid, 2002;
Lindahl et al 2001)
The sire lines need to be Halothane negative (Fàbrega et al, 2002)
2.2.1 DUROC SIRE LINES:
To ensure worthwhile improvement in eating quality it has been recommended that
there is at least a 50% inclusion of Duroc in the slaughter generation (MLC, 1992;
Blanchard et al., 1999). There is no significant difference in daily live weight gain to
white sire line genotypes, whilst the lean tissue and subcutaneous fat growth rates are
higher (P<0.05) in 50% Duroc progeny (Blanchard et al., 1999). However, whilst
there is no significant difference in lean tissue food conversion ration, the FCR in
50% Duroc progeny is lower than that seen in 25% or 0% progeny (Blanchard et al.,
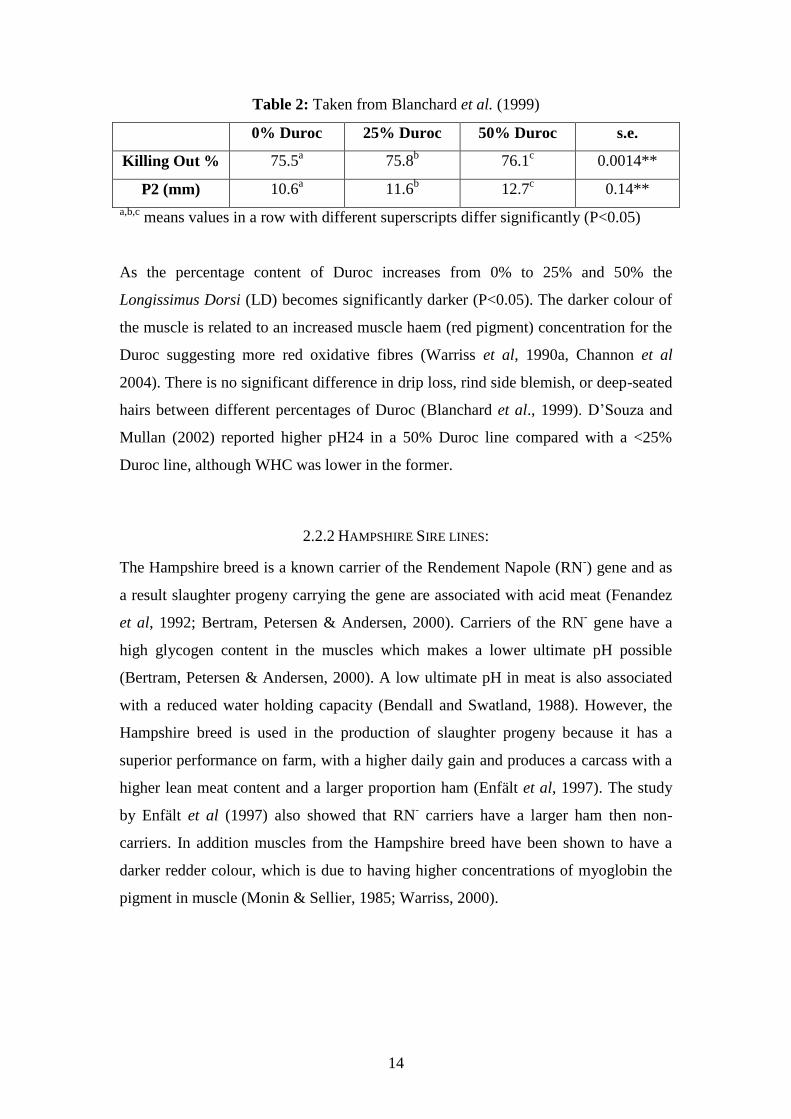
1999). In addition as the inclusion level of Duroc increased the killing out percentage
was positively affected and the P2 fat thickness also increased (See Table 2). In
addition 50% Duroc animals have higher fat firmness scores and higher penetrometer
values compared to the 25% and 0% inclusion animals (Blanchard et al., 1999).
14
Table 2: Taken from Blanchard et al. (1999)
0% Duroc 25% Duroc 50% Duroc s.e.
Killing Out % 75.5a 75.8
b 76.1
c 0.0014**
P2 (mm) 10.6a 11.6
b 12.7
c 0.14**
a,b,c means values in a row with different superscripts differ significantly (P<0.05)
As the percentage content of Duroc increases from 0% to 25% and 50% the
Longissimus Dorsi (LD) becomes significantly darker (P<0.05). The darker colour of
the muscle is related to an increased muscle haem (red pigment) concentration for the
Duroc suggesting more red oxidative fibres (Warriss et al, 1990a, Channon et al
2004). There is no significant difference in drip loss, rind side blemish, or deep-seated
hairs between different percentages of Duroc (Blanchard et al., 1999). D’Souza and
Mullan (2002) reported higher pH24 in a 50% Duroc line compared with a <25%
Duroc line, although WHC was lower in the former.
2.2.2 HAMPSHIRE SIRE LINES:
The Hampshire breed is a known carrier of the Rendement Napole (RN-) gene and as
a result slaughter progeny carrying the gene are associated with acid meat (Fenandez
et al, 1992; Bertram, Petersen & Andersen, 2000). Carriers of the RN- gene have a
high glycogen content in the muscles which makes a lower ultimate pH possible
(Bertram, Petersen & Andersen, 2000). A low ultimate pH in meat is also associated
with a reduced water holding capacity (Bendall and Swatland, 1988). However, the
Hampshire breed is used in the production of slaughter progeny because it has a
superior performance on farm, with a higher daily gain and produces a carcass with a
higher lean meat content and a larger proportion ham (Enfält et al, 1997). The study
by Enfält et al (1997) also showed that RN- carriers have a larger ham then non-
carriers. In addition muscles from the Hampshire breed have been shown to have a
darker redder colour, which is due to having higher concentrations of myoglobin the
pigment in muscle (Monin & Sellier, 1985; Warriss, 2000).
15
2.3 GENETICS AFFECTING PORK QUALITY:
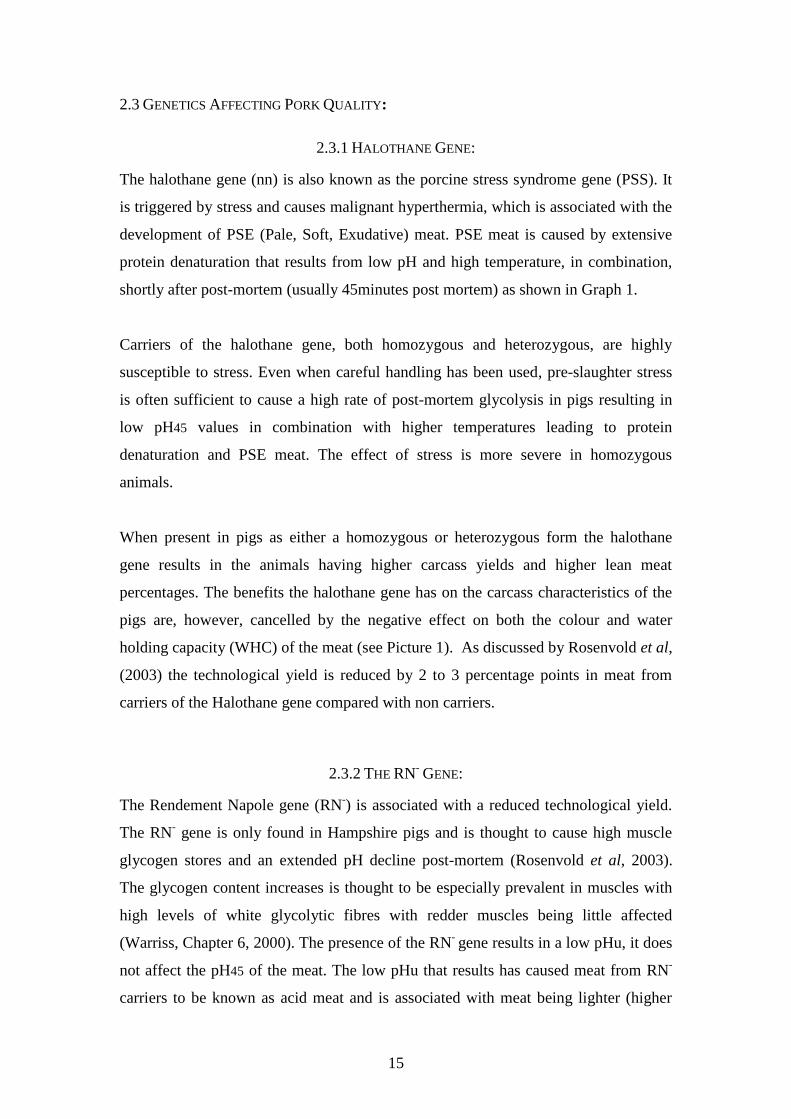
2.3.1 HALOTHANE GENE:
The halothane gene (nn) is also known as the porcine stress syndrome gene (PSS). It
is triggered by stress and causes malignant hyperthermia, which is associated with the
development of PSE (Pale, Soft, Exudative) meat. PSE meat is caused by extensive
protein denaturation that results from low pH and high temperature, in combination,
shortly after post-mortem (usually 45minutes post mortem) as shown in Graph 1.
Carriers of the halothane gene, both homozygous and heterozygous, are highly
susceptible to stress. Even when careful handling has been used, pre-slaughter stress
is often sufficient to cause a high rate of post-mortem glycolysis in pigs resulting in
low pH45 values in combination with higher temperatures leading to protein
denaturation and PSE meat. The effect of stress is more severe in homozygous
animals.
When present in pigs as either a homozygous or heterozygous form the halothane
gene results in the animals having higher carcass yields and higher lean meat
percentages. The benefits the halothane gene has on the carcass characteristics of the
pigs are, however, cancelled by the negative effect on both the colour and water
holding capacity (WHC) of the meat (see Picture 1). As discussed by Rosenvold et al,
(2003) the technological yield is reduced by 2 to 3 percentage points in meat from
carriers of the Halothane gene compared with non carriers.
2.3.2 THE RN- GENE:
The Rendement Napole gene (RN-) is associated with a reduced technological yield.
The RN- gene is only found in Hampshire pigs and is thought to cause high muscle
glycogen stores and an extended pH decline post-mortem (Rosenvold et al, 2003).
The glycogen content increases is thought to be especially prevalent in muscles with
high levels of white glycolytic fibres with redder muscles being little affected
(Warriss, Chapter 6, 2000). The presence of the RN- gene results in a low pHu, it does
not affect the pH45 of the meat. The low pHu that results has caused meat from RN-
carriers to be known as acid meat and is associated with meat being lighter (higher
16
reflectance) having a greater drip and cooking loss due to reduced water holding
capacity. Due to the low technical yields that result from carcasses of RN- carriers the
processing industry have a preference for animals that are non carriers. This is
because while the presence of the Halothane gene has a dramatic effect on WHC, the
RN- gene only increases drip loss by approximately 1 percentage point. In contrast,
the technological yield is reduced by 5 to 6 percentage points (Rosenvold et al, 2003)
although Warriss (2000) found an 8% technological decrease.
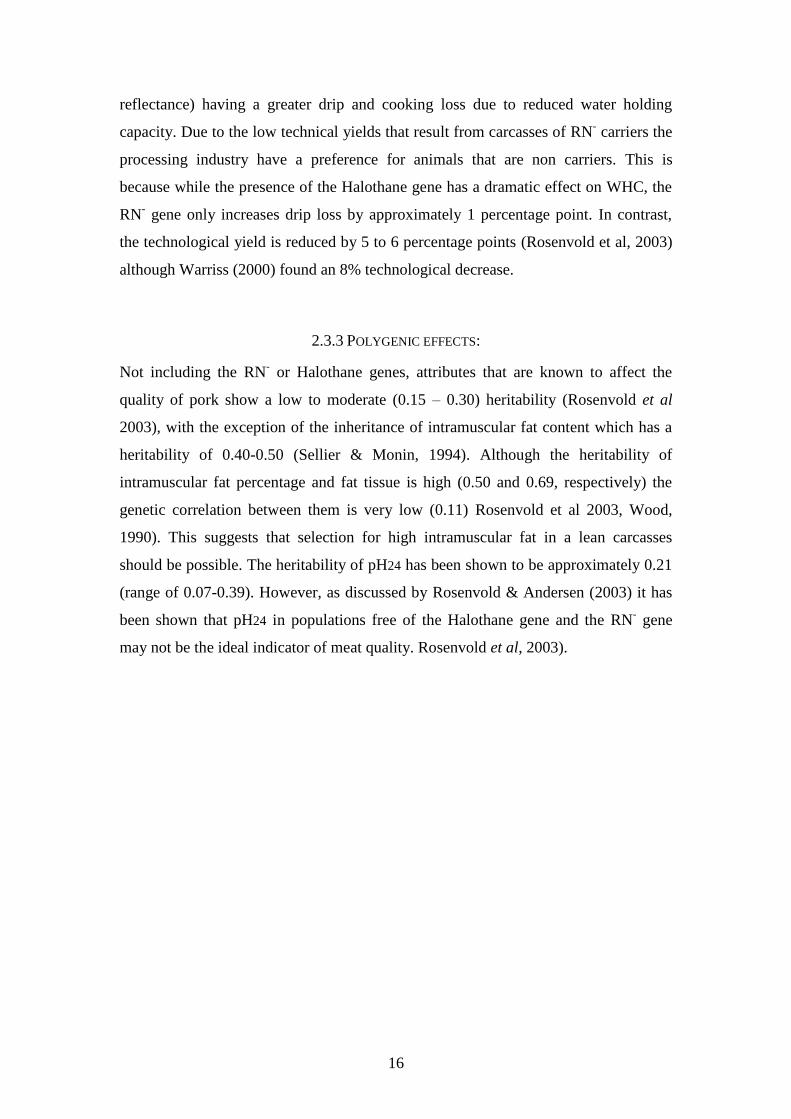
2.3.3 POLYGENIC EFFECTS:
Not including the RN- or Halothane genes, attributes that are known to affect the
quality of pork show a low to moderate (0.15 – 0.30) heritability (Rosenvold et al
2003), with the exception of the inheritance of intramuscular fat content which has a
heritability of 0.40-0.50 (Sellier & Monin, 1994). Although the heritability of
intramuscular fat percentage and fat tissue is high (0.50 and 0.69, respectively) the
genetic correlation between them is very low (0.11) Rosenvold et al 2003, Wood,
1990). This suggests that selection for high intramuscular fat in a lean carcasses
should be possible. The heritability of pH24 has been shown to be approximately 0.21
(range of 0.07-0.39). However, as discussed by Rosenvold & Andersen (2003) it has
been shown that pH24 in populations free of the Halothane gene and the RN- gene
may not be the ideal indicator of meat quality. Rosenvold et al, 2003).
17
3. FEEDING:
Meat Quality of monogastric animals, such as pigs, can be influenced both positively
and negatively by altering the composition of pig feed and using additional
supplementation. Pigs are able to transfer the nutrients directly to the muscle and
tissue thereby altering the composition of the meat. Both the fat and lean tissue can be
altered by feeding and it has been shown that glycogen levels at the time of slaughter,
and therefore rate of pH decline, can also be manipulated.
3.1 LIFETIME FEEDING:
By ensuring the pigs receive Ad libitum lifetime feed the meat quality is improved
since there is no stress during their time on the farm as a result of prolonged feed
withdrawal – a factor that is known to be linked to DFD meat.
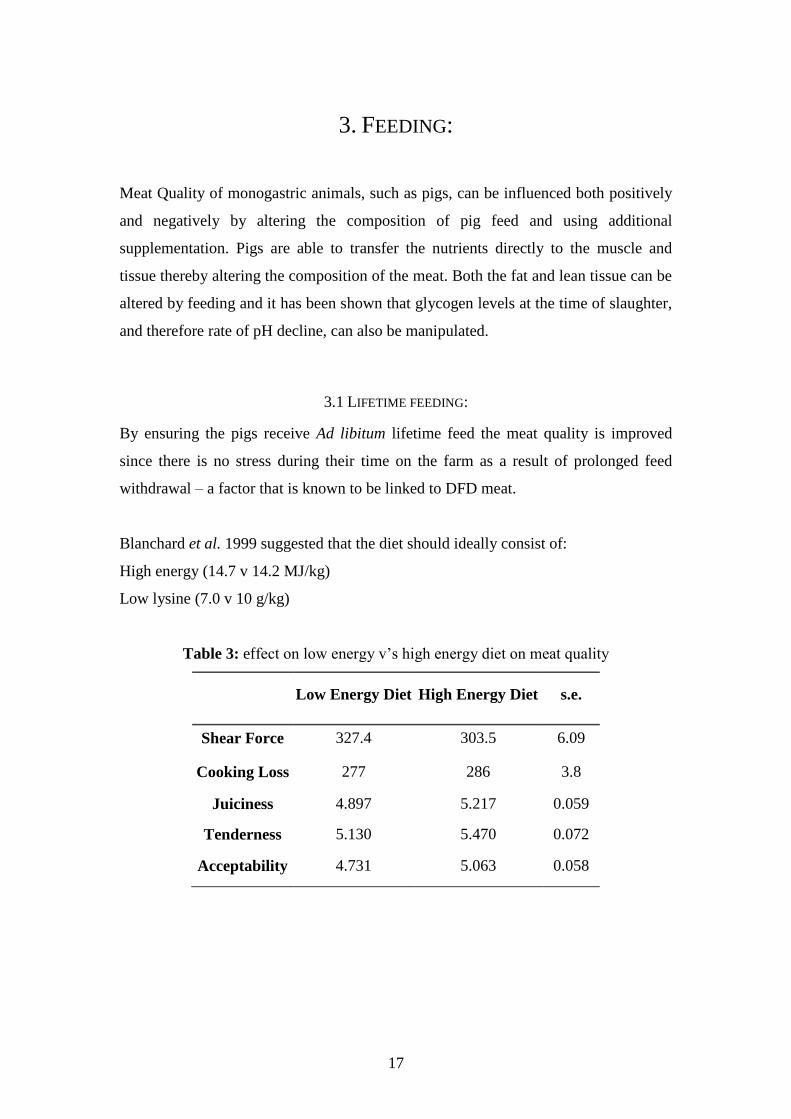
Blanchard et al. 1999 suggested that the diet should ideally consist of:
High energy (14.7 v 14.2 MJ/kg)
Low lysine (7.0 v 10 g/kg)
Table 3: effect on low energy v’s high energy diet on meat quality
Low Energy Diet High Energy Diet s.e.
Shear Force 327.4 303.5 6.09
Cooking Loss 277 286 3.8
Juiciness 4.897 5.217 0.059
Tenderness 5.130 5.470 0.072
Acceptability 4.731 5.063 0.058
18
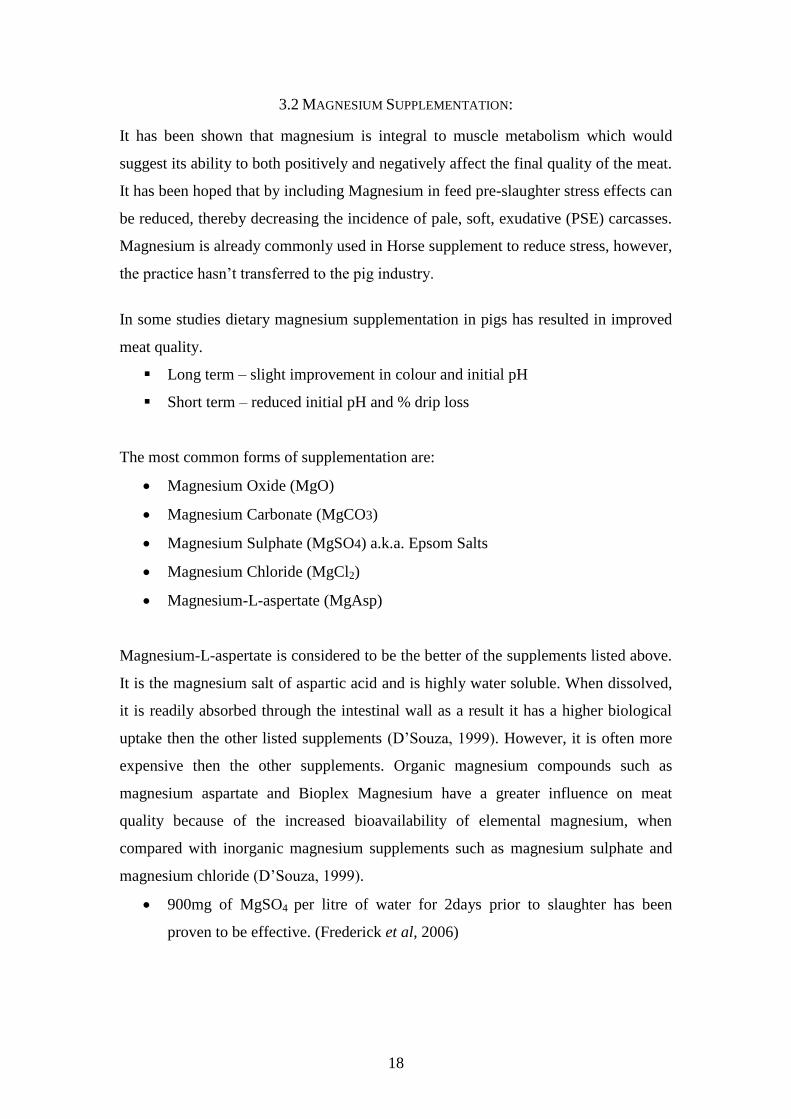
3.2 MAGNESIUM SUPPLEMENTATION:
It has been shown that magnesium is integral to muscle metabolism which would
suggest its ability to both positively and negatively affect the final quality of the meat.
It has been hoped that by including Magnesium in feed pre-slaughter stress effects can
be reduced, thereby decreasing the incidence of pale, soft, exudative (PSE) carcasses.
Magnesium is already commonly used in Horse supplement to reduce stress, however,
the practice hasn’t transferred to the pig industry.
In some studies dietary magnesium supplementation in pigs has resulted in improved
meat quality.
Long term – slight improvement in colour and initial pH
Short term – reduced initial pH and % drip loss
The most common forms of supplementation are:
Magnesium Oxide (MgO)
Magnesium Carbonate (MgCO3)
Magnesium Sulphate (MgSO4) a.k.a. Epsom Salts
Magnesium Chloride (MgCl2)
Magnesium-L-aspertate (MgAsp)
Magnesium-L-aspertate is considered to be the better of the supplements listed above.
It is the magnesium salt of aspartic acid and is highly water soluble. When dissolved,
it is readily absorbed through the intestinal wall as a result it has a higher biological
uptake then the other listed supplements (D’Souza, 1999). However, it is often more
expensive then the other supplements. Organic magnesium compounds such as
magnesium aspartate and Bioplex Magnesium have a greater influence on meat
quality because of the increased bioavailability of elemental magnesium, when
compared with inorganic magnesium supplements such as magnesium sulphate and
magnesium chloride (D’Souza, 1999).
900mg of MgSO4 per litre of water for 2days prior to slaughter has been
proven to be effective. (Frederick et al, 2006)
19
Supplementation of 3.2g elemental Mg for 5 days pre-slaughter significantly improves
pork quality in pigs by reducing drip loss and improving pork colour and muscle pH
as well as reducing catecholamine levels. Such were the benefits that there where no
PSE carcasses in the magnesium supplementation treatment groups, irrespective of
handling pre-slaughter. (D’Souza et al, 1998)
In two experiments D’Souza (1999, 2000) and his team showed that 5 days of pre-
slaughter dietary supplementation of magnesium can improve pork quality by
significantly reducing the incidence of PSE meat. However, other research has been
less positive, often showing little or no improvement in pork quality. The most recent
study by Humphreys et al (2009) also found no significant benefit to using
magnesium, however, he did hypothesise that there may be no visible effect due to the
high welfare standards of pigs used in the trial. This, therefore, suggests that higher
welfare systems, such as those used in the UK, do not warrant a Magnesium additive
and if indeed there is a prevalence of PSE it is the production system itself that should
be investigated, not the feed ration.
3.3 SELENIUM SUPPLEMENTATION (SEL-PLEX OR ORGANIC SELENIUM):
Organic selenium significantly improves meat quality by decreasing cell membrane
oxidation leading to reduced muscle drip loss (Close et al, 2008). Sodium selenite,
which is often found in feed, can increase drip loss, however, organic selenium
(Selenomethionine at 0.3ppm) reduces drip loss(Close et al, 2008). When organic
selenium is included in the finisher diet the average yield increases for loin is 1.5%
(Zhan et al, 2007). In addition when organic selenium is used in conjunction with
Vitamin E (200ppm) there is increased colour stability, therefore prolonging shelf life.
Sel-Plex supplementation results in higher selenium levels in the loin muscle at both
0.1 and 0.3ppm in the future Selenium rich foods may be well placed as functional
foods (Close et al, 2008).
3.4 VITAMIN D SUPPLEMENTATION:
In situ tenderisation of meat is due to the free activate-calpain which is controlled by
calcium ion concentration (Dransfield, 1993).Vitamin D has been show to increase the
20
amount of free calcium (Swigert et al, 2004). Vit D3 supplementation could improve
the tenderness of meat by increasing meat calcium levels thereby activating the
calpain systems during the aging process In steers Vit D3 supplementation for 7 and
10days pre-slaughter resulted in increased plasma and muscle calcium levels and
improve tenderness (Swantek et al, 1999). However, Vit D3 failed to show consistent
benefits when used on its own, however, when used in conjunction with magnesium
pork quality was significantly improved (Swantek et al, 1999)
3.5 VITAMIN E SUPPLEMENTATION:
Vitamin can not be synthesised by animals, as a result levels found in fat and muscle
are a reflection of dietary inclusion (Jensen et al, 1998). Vitamin E supplementation
improves meat quality by reducing lipid oxidation in fresh meat and meat products.
Meat quality is improved by reduction of thiobarbituric acid reactive substances
(TBARS – markers for rancidity and off-flavours) to scores below 0.50mg
malondialdehyde equivalents (MDA eq.) which is the borderline level for detection of
rancidity and off-flavours by trained sensory panellists.
Supplementing 200mg/kg synthetic vitamin E decreased pork lipid oxidation,
however, discolouration still occurred (Boler et al, 2009). Guo et al, (2006) also
observed an improvement in lipid stability but no benefit to colour. When 200mg/kg
of feed was added by Hoving-Bolink et al, (1998) they did see a change in meat
colour. Vitamin E supplementation on muscle colour is perhaps more evident in
species that have higher levels of myoglobin. Therefore minimal effect in pork.
21
4. BOAR TAINT:
4.1 INTRODUCTION:
Boar taint is an unpleasant odour that is associated with the fatty tissue and, more
precisely with the nonsaponifiable fraction (Bonneau, 1982) of boar meat. In 1959
Craig and Pearson carried out the first attempts to identify the compound(s)
responsible (Bonneau, 1982) for the taint. However, it was suggested by Sink (1967)
that steroids which have a musk-like odour could be responsible for boar taint.
Two main compounds were identified as being the cause of boar taint. Androstenone
was isolated in 1966 as being a sex odour in the fat of the entire male. Skatole was
also identified as being a prime cause of boar taint. However, skatole is not unique to
the pig and can be found in all mammals. There are many other compounds that may
contribute to the odour and flavour of meat however, it is the levels of androstenone
and skatole that are the main contributing factors towards boar taint.
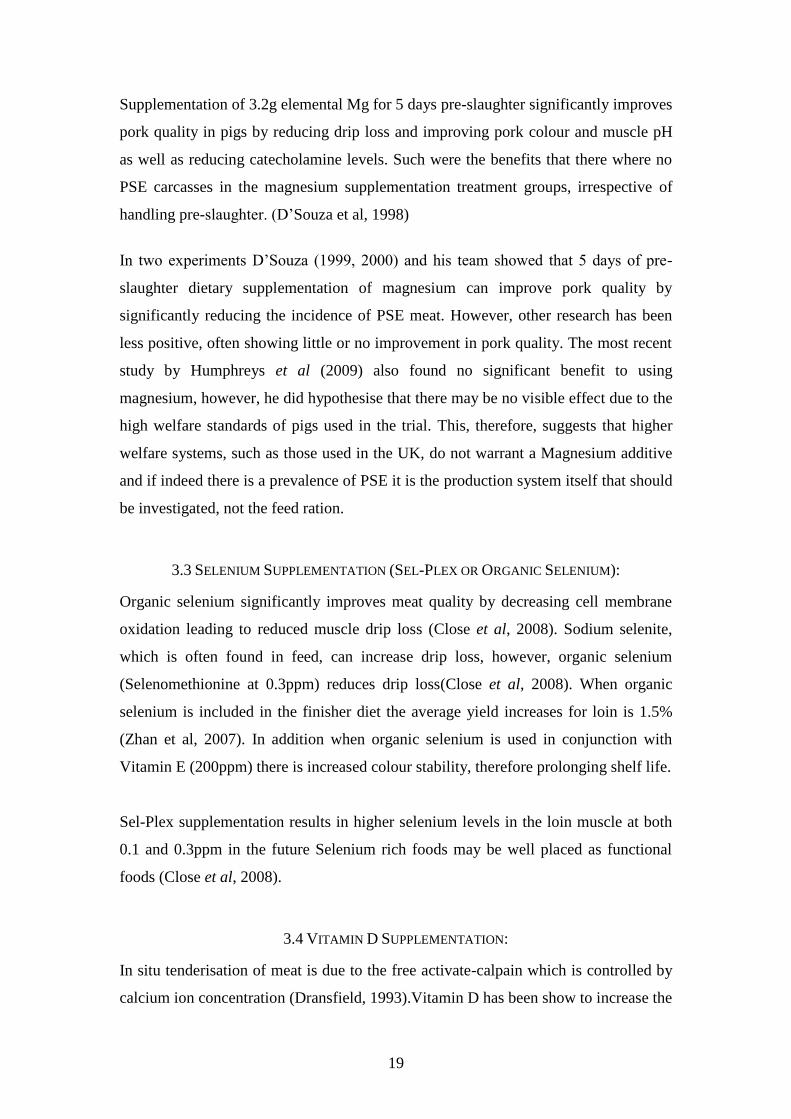
Androstenone is fat-soluble and can be used to predict the presence of boar taint in
backfat. Skatole is useful for determining levels of boar taint in both fat and lean meat
since it is both fat and water soluble (Lundström et al, 1988) (see Figure 6)
Lundström et al, 1988
Figure 6a): The relationship between androstenone and skatole concentrations in
backfat. Lundström et al, 1988
22
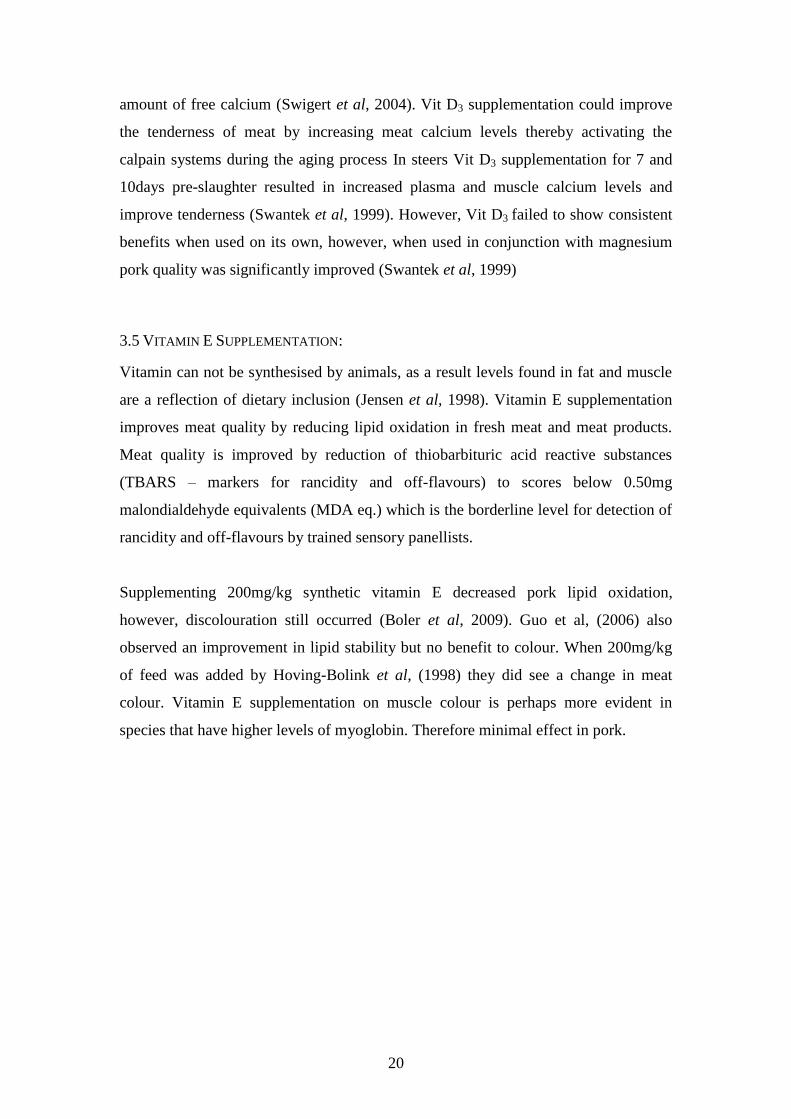
Figure 6b): The relationship between boar taint intensity and androstenone
concentration in backfat. Lundström et al, 1988
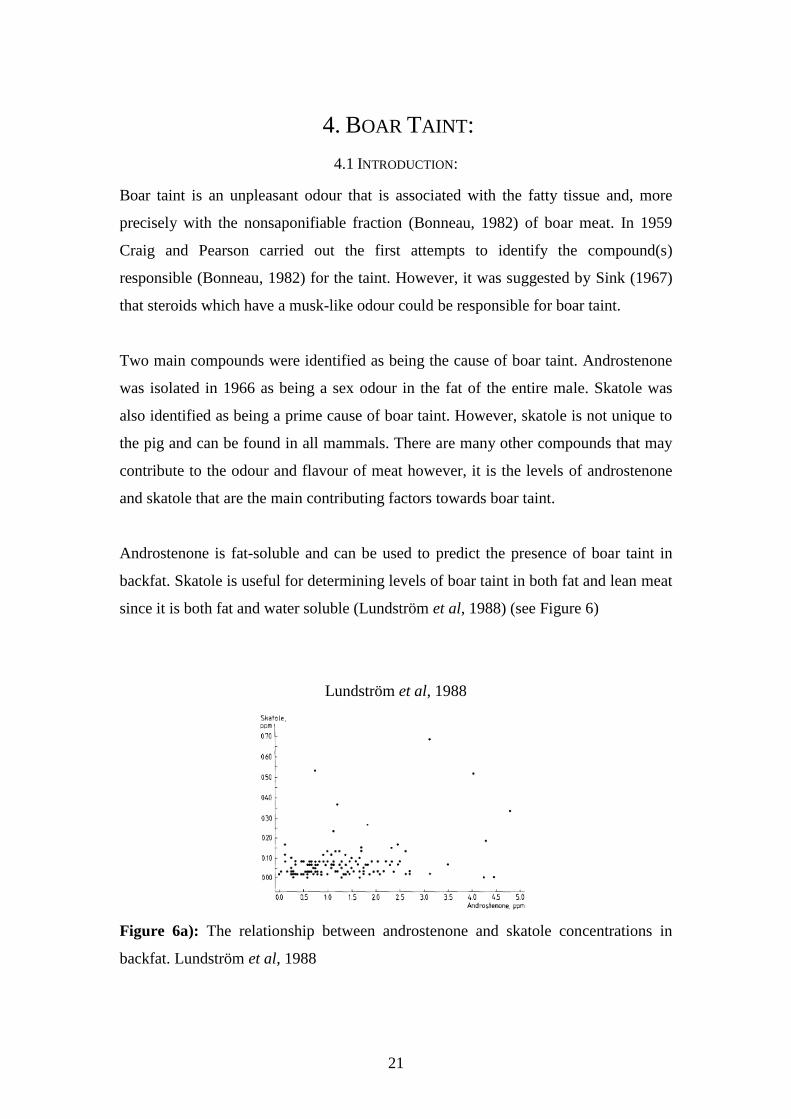
Figure 6c): The relationship between boar taint intensity and skatole concentration in
backfat. Lundström et al, 1988
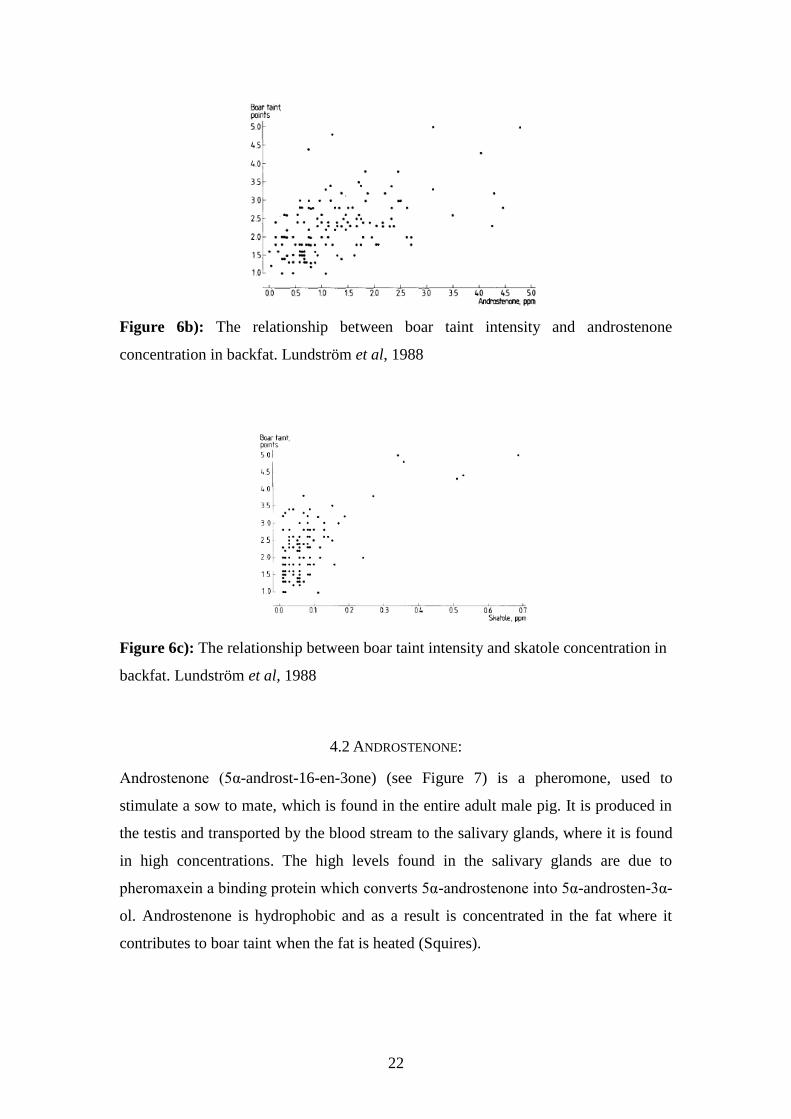
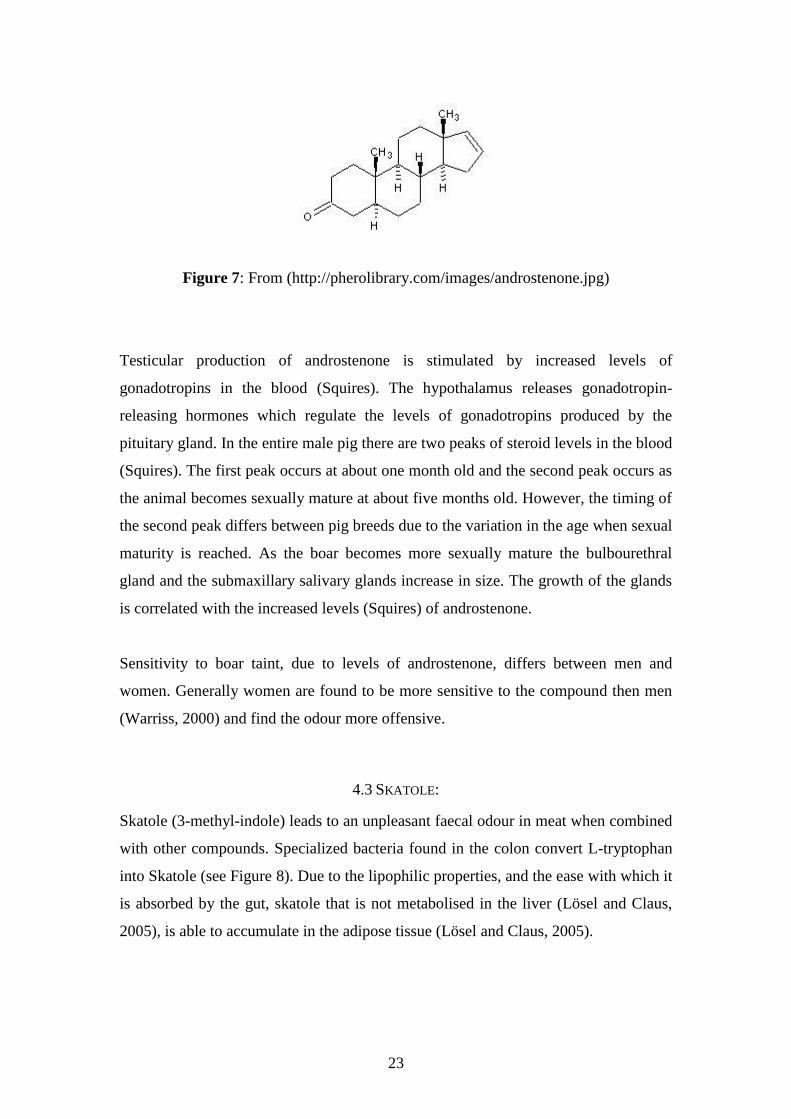
4.2 ANDROSTENONE:
Androstenone (5α-androst-16-en-3one) (see Figure 7) is a pheromone, used to
stimulate a sow to mate, which is found in the entire adult male pig. It is produced in
the testis and transported by the blood stream to the salivary glands, where it is found
in high concentrations. The high levels found in the salivary glands are due to
pheromaxein a binding protein which converts 5α-androstenone into 5α-androsten-3α-
ol. Androstenone is hydrophobic and as a result is concentrated in the fat where it
contributes to boar taint when the fat is heated (Squires).
23
Figure 7: From (http://pherolibrary.com/images/androstenone.jpg)
Testicular production of androstenone is stimulated by increased levels of
gonadotropins in the blood (Squires). The hypothalamus releases gonadotropin-
releasing hormones which regulate the levels of gonadotropins produced by the
pituitary gland. In the entire male pig there are two peaks of steroid levels in the blood
(Squires). The first peak occurs at about one month old and the second peak occurs as
the animal becomes sexually mature at about five months old. However, the timing of
the second peak differs between pig breeds due to the variation in the age when sexual
maturity is reached. As the boar becomes more sexually mature the bulbourethral
gland and the submaxillary salivary glands increase in size. The growth of the glands
is correlated with the increased levels (Squires) of androstenone.
Sensitivity to boar taint, due to levels of androstenone, differs between men and
women. Generally women are found to be more sensitive to the compound then men
(Warriss, 2000) and find the odour more offensive.
4.3 SKATOLE:
Skatole (3-methyl-indole) leads to an unpleasant faecal odour in meat when combined
with other compounds. Specialized bacteria found in the colon convert L-tryptophan
into Skatole (see Figure 8). Due to the lipophilic properties, and the ease with which it
is absorbed by the gut, skatole that is not metabolised in the liver (Lösel and Claus,
2005), is able to accumulate in the adipose tissue (Lösel and Claus, 2005).
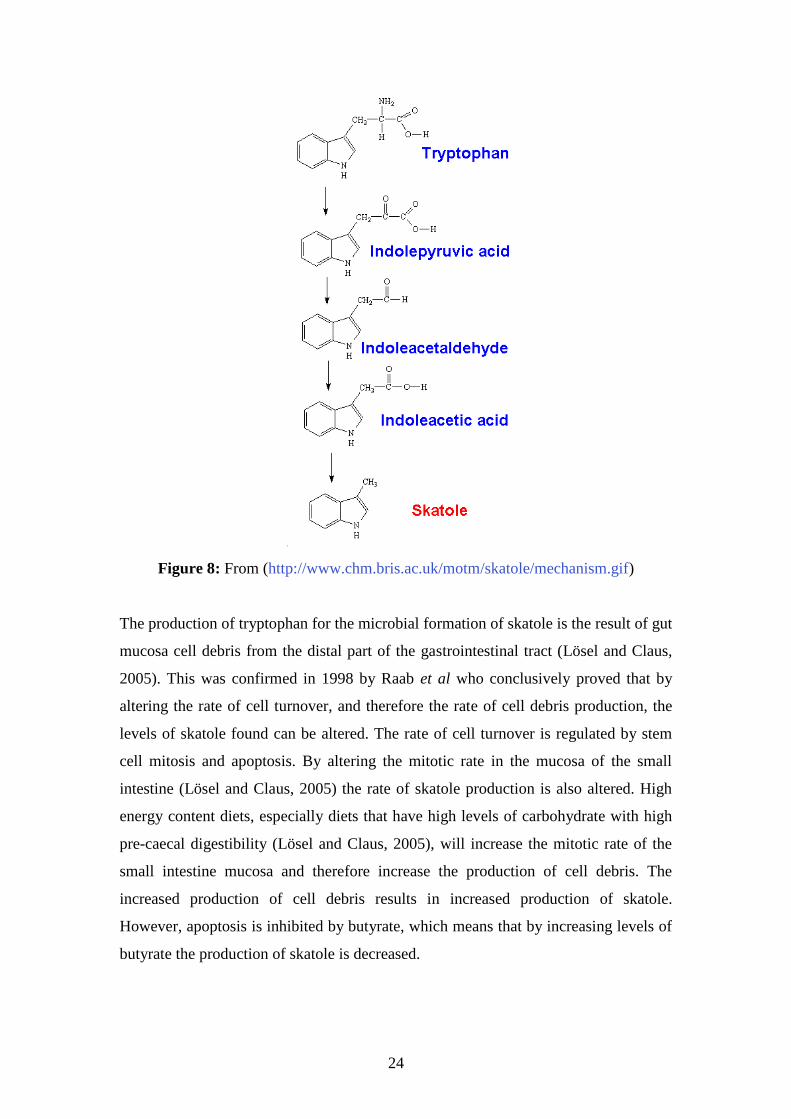
24
Figure 8: From (http://www.chm.bris.ac.uk/motm/skatole/mechanism.gif)
The production of tryptophan for the microbial formation of skatole is the result of gut
mucosa cell debris from the distal part of the gastrointestinal tract (Lösel and Claus,
2005). This was confirmed in 1998 by Raab et al who conclusively proved that by
altering the rate of cell turnover, and therefore the rate of cell debris production, the
levels of skatole found can be altered. The rate of cell turnover is regulated by stem
cell mitosis and apoptosis. By altering the mitotic rate in the mucosa of the small
intestine (Lösel and Claus, 2005) the rate of skatole production is also altered. High
energy content diets, especially diets that have high levels of carbohydrate with high
pre-caecal digestibility (Lösel and Claus, 2005), will increase the mitotic rate of the
small intestine mucosa and therefore increase the production of cell debris. The
increased production of cell debris results in increased production of skatole.
However, apoptosis is inhibited by butyrate, which means that by increasing levels of
butyrate the production of skatole is decreased.
25
4.4 LEVELS OF TOLERANCE:
It has been suggested that there may be an interaction between the effects of skatole
and androstenone so that the levels of one compound may determine the importance
of levels of the other (Warriss, 2000). Although it has been observed that sensitivity to
androstenone varies between men and women there is thought to be no variation
between sexes for skatole sensitivity. Due to the national variation in sensitivity it has
been suggested that, for meat acceptability, the maximum concentrations in fat should
be Androstenone: 0.5 – 1.0 μg g-1
and Skatole 0.20 – 0.25 μg g-1
(Warriss, 2000).
4.5 FEEDING AND BOAR TAINT:
Androstenone which is enhanced by Skatole concentrations above 0.15µg/g (Godt et
al, 1996) can be affected through diet, by controlling Skatole levels. Since,
Carbohydrates which have a lower pre-caecal digestibility and favour butyrate
formation in the colon decrease skatole synthesis (Lösel and Claus, 2005), thereby
reducing the affect of androstenone. As a result by modifying the diet it is possible to
improve the sensorial quality of pork. Neupert et al, (1995) demonstrated that the
amount and type of energy in the diet has a considerable effect on the skatole
concentration in adipose tissue of pigs, so that the differences in feeding may exceed
sex-dependent effects (Lösel and Claus, 2005).
Stem-cell mitosis in the small intestine is regulated by the formation of insulin-like
growth factor-1 (IGF-1). Glucose formation from easily digestible starch stimulates
the formation of IGF-1 which in turn leads to higher rates of apoptosis and therefore,
higher levels of skatole.
Potato Starch:
In 2005 both Lösel and Claus and Zamaratskaia et al used potato starch in the diet to
alter the intestinal skatole formation and adipose tissue accumulation in the pig. Lösel
and Claus (2005) used barrows (castrated males) and gilts in equal numbers and
reared them to a live weight of 105kg (castrates) or 115kg (gilts). When the pigs
weighed approximately 98kg live weight they were split into 4 groups, 3 were fed a
diet with varying levels of raw potato starch and the 4th
group was fed a diet
containing pre-gelatinised potato starch. Due to the transformation of raw potato
26
starch to volatile fatty acids energy is lost, Lösel and Claus compensated for this by
increasing the kg/day of feed based on the levels of potato starch in the diet.
Lösel and Claus (2005) found that skatole levels decreased continuously with
increasing amounts of potato starch in the diet. The trial further confirmed that raw
potato starch reduces the intestinal formation and adipose tissue storage of skatole in
the pig in a dose-dependant manner.
Further on from their study in 2005 Lösel and Claus with Lacorn and Büttner looked
at the flavour improvement of pork from barrows and gilts (Lösel et al, 2006). They
found that 300g of raw potato starch/ kg of body weight significantly (P < 0.001)
reduced concentration of skatole in back fat from 25 to 1.4 ng/g in barrows and from
40 to 9ng/g in gilts. Lösel et al (2006) also used a trained taste panel, rating from 1-5
(very unpleasant to very pleasant) to look at the odour of the cooked pork. Pork with
low skatole levels was rated at 3.07 and meat with both medium and high levels of
skatole was rated at 2.66 (P < 0.05). Thereby proving that the eating quality of pork
can be improved by the addition of raw potato starch to the diet of the pigs.
Zamaratskaia et al (2005) also looked at the effect of potato starch on levels of
skatole, however they also looked at the effects potato starch had on the levels of
Androstenone in the entire male pig. The study used 111 pigs, which were housed in
pens of 7-9 animals either mixed or single sex. The animals were “all fed the same
commercial diet until an average pen weight of 100kg was reached” (Zamaratskaia et
al (2005)). For two weeks prior to slaughter 33 of the animals were then fed
0.6kg/pig/day of raw potato starch. Zamaratskaia et al (2005) found that entire males
from the higher weight groups (115kg) that were not fed the potato starch had
significantly higher levels of skatole and testicular steroids then the pigs from the
lower and middle weight range (90kg and 100kg). However, there was no significant
difference in levels of skatole and testicular steroids between the lower and middle
weight groups. Zamaratskaia et al (2005) concluded that the diet with raw potato
starch induced a decline in skatole levels in plasma and fat (P < 0.001), but not
plasma levels of testicular steroids and fat levels of androstenone (P >0.05). As a
result it is possible to deduce that slaughter at a lower weight or dietary supplement of
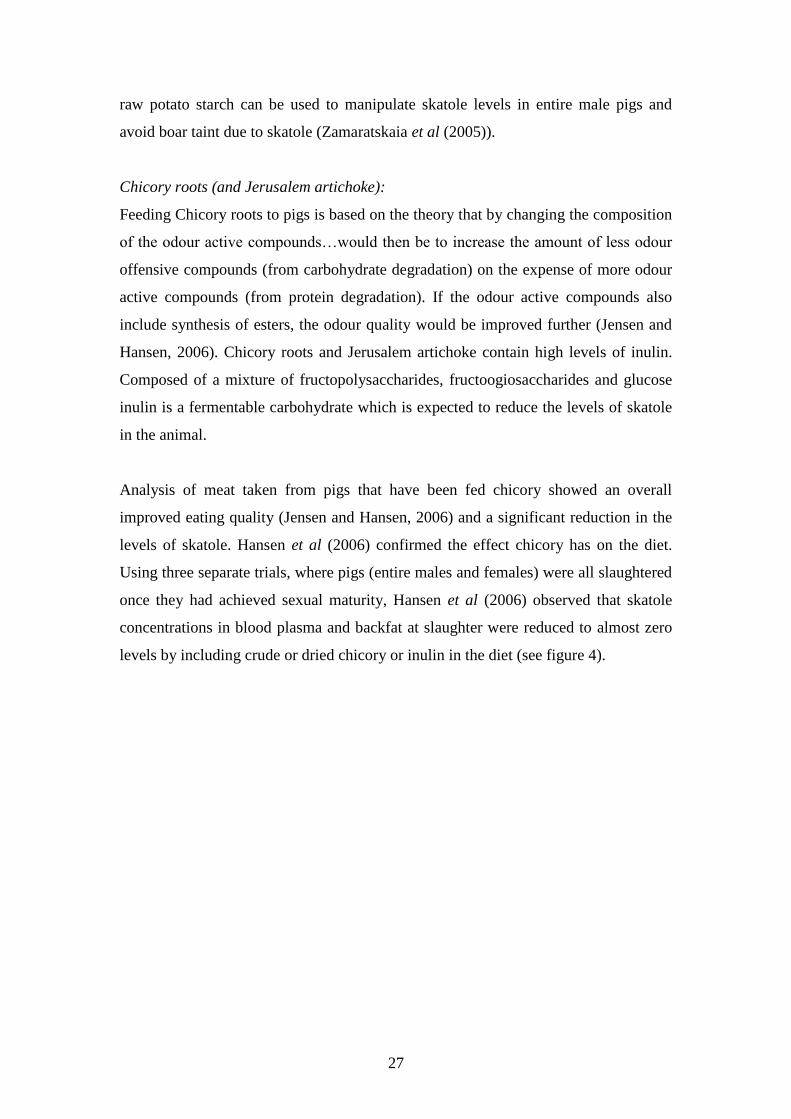
27
raw potato starch can be used to manipulate skatole levels in entire male pigs and
avoid boar taint due to skatole (Zamaratskaia et al (2005)).
Chicory roots (and Jerusalem artichoke):
Feeding Chicory roots to pigs is based on the theory that by changing the composition
of the odour active compounds…would then be to increase the amount of less odour
offensive compounds (from carbohydrate degradation) on the expense of more odour
active compounds (from protein degradation). If the odour active compounds also
include synthesis of esters, the odour quality would be improved further (Jensen and
Hansen, 2006). Chicory roots and Jerusalem artichoke contain high levels of inulin.
Composed of a mixture of fructopolysaccharides, fructoogiosaccharides and glucose
inulin is a fermentable carbohydrate which is expected to reduce the levels of skatole
in the animal.
Analysis of meat taken from pigs that have been fed chicory showed an overall
improved eating quality (Jensen and Hansen, 2006) and a significant reduction in the
levels of skatole. Hansen et al (2006) confirmed the effect chicory has on the diet.
Using three separate trials, where pigs (entire males and females) were all slaughtered
once they had achieved sexual maturity, Hansen et al (2006) observed that skatole
concentrations in blood plasma and backfat at slaughter were reduced to almost zero
levels by including crude or dried chicory or inulin in the diet (see figure 4).
28
Figure 9: Hansen et al (2006).
Levels of (a) Skatole, (b) Androstenone and (c) Indole in blood of entire males given
a concentrate with dried chicory from days 7 to 14 (DC1) and from day 0 to 14
(DC2).
The results observed by Hansen were not affected by the weight at slaughter or the
length of feeding period. However, androstenone levels were only reduced in pigs
which were fed crude chicory for nine weeks (see figure 9).
.
Dietary supplementation can be highly effective in reducing the levels of skatole
found in pig meat. By adding potato starch or chicory roots to the diet of pigs the
production of skatole is reduced. However, the effect of dietary supplementation on
the levels of androstenone found in the adipose tissue is varied.
Chicory is an ideal supplement for reducing boar taint because it does not effect the
production or proportion of lean mean in the animal and consistently reduced skatole
without reducing performance (Hansen et al, 2006) and when fed for extended periods
of time a significant reduction in androstenone levels was also observed. Feeding
crude or dried chicory roots with a high content of inulin, or purified inulin strongly

29
reduces the boar-taint compound skatole (Hansen et al, 2006). Moreover, skatole is
known to enhance the off-odour and off-flavour of androstenone (Hansen et al, 2006;
Godt et al, 1996) as a result of reducing skatole levels in pigs the effects of
androstenone on the meat quality is also reduced, thereby producing a pig that is more
commercially acceptable.
30
5. TRANSPORT
5.1 The effect of transport on the welfare of pigs:
To be able to understand the effect transport has on the welfare of an animal the
definition of welfare needs to be understood, as well as how welfare is assessed. To
measure welfare several areas are studied:
Environment and facilities available
Overall animal condition
Animal behaviour and response
Experimental measures of physiology, biochemical and neurophysical
condition
Retrospective assessments based on outcomes (Wilkins, 2008)
As explained by Warriss (1996) there are two main welfare indicators used in the
assessment of welfare during transport. These are indicators which reflect an animal’s
ability to cope with environmental stresses and those which reflect the amount of
effort required to cope. For example by looking at the rate of mortality during
transportation it is possible to see how many animals were exposed to conditions that
they were unable to cope with. As the rate of mortality increases the standard of
welfare can be assumed to have decreased. Traumatic injuries gained during
transportation are also indicators of reduced welfare since injuries are associated with
unnecessary pain.
When studying the amount of effort required by an animal to cope with transportation
physiological and behavioural responses are observed. The more effort that is
required, the less acceptable is the animal’s welfare (Warriss, 1996). It is possible to
identify the type, and to a point, severity of the stressor by taking blood and tissue
samples. For example reduced liver glycogen, increased levels of free fatty acids and
increased ketones in the blood is indicative of prolonged food deprivation. If an
animal is dehydrated it will have increased blood osmolarity and higher levels of
blood plasma proteins. To study the extent of muscle fatigue or exposure to exercise
31
the blood activity of creatine phosphokinase (CPK) is looked at. The higher the levels
of CPK, the greater the fatigue and therefore, the greater the stress. Warriss (1996)
observed that psychological stresses such as fear produce elevations in the blood
concentrations of hormones such as adrenaline, cortisol and corticosterone.
Once the areas of assessment, and methods to be used, have been identified the
definition of welfare needs to be considered. There are three main definitions for
welfare:
Mental status
Physical status
“Naturalness”
Welfare with regards to mental status looks at how the animal feels opposed to the
health status or fitness of the animal. Physical status with regards to welfare considers
how an animal copes with its environment and the environmental effects on the
animal. Naturalness considers the ability of an animal to express behaviours which
would be observed in the natural, non-managed environment. In combination the three
welfare definitions have created the five freedoms:
1. Freedom from Hunger and Thirst - by ready access to fresh water and a diet to
maintain full health and vigour.
2. Freedom from Discomfort - by providing an appropriate environment including
shelter and a comfortable resting area.
3. Freedom from Pain, Injury or Disease - by prevention or rapid diagnosis and
treatment.
4. Freedom to Express Normal Behaviour - by providing sufficient space, proper
facilities and company of the animal's own kind.
5. Freedom from Fear and Distress - by ensuring conditions and treatment which
avoid mental suffering.
(As defined by: FAWC, Accessed 2008)
An animal treated in such a way that it does not have these freedoms may be looked
upon as being subjected to experiences associated with varying degrees of stress
32
(Warriss, 1996) and therefore, has been exposed to reduced welfare. The transport of
animals is inherently stressful as a result of handling during loading and unloading,
change of environment and separation from social groupings. During the
transportation process the pigs are exposed to noise, unfamiliar smells, vibration,
extremes of temperature (Warriss, 1996) the pigs will also be exposed to food and
water deprivation as well as close confinement and crowded conditions.
The EC and United Kingdom Government Legislation have specific guidelines for the
transportation of animals’ off-farm. The guidelines are designed to protect animals
from compromises to welfare. As a result, within the UK, all animals being
transported are done so by the standards set out in The Welfare of Animals
(Transport) Order 1997 (S.I. 1997 No. 1480). Within the EU pigs can often be
exposed to long journey times due to the possibility of movement between member
states. Even though there are regulations in place in both the EC council directive
(1991) and government legislation that are designed to protect pigs during
transportation the associated handling and transportation process will always
adversely affects the welfare of pigs. The loading and unloading stages of
transportation are regulated by The Welfare of Farm Animals (England) Regulations
2000 (S.I. 2000 No.1870). It should be noted that Wales and Scotland have their own
versions of The Welfare of Farm Animals (England) Regulations 2000.
There are many transport methods that are available to the pig industry, i.e., Air, Rail,
and Road. However, in the United Kingdom the most common method of
transportation is by road. There are approximately 13 million pigs sent to slaughter in
the UK every year (Warriss, 1996). The transport times and distances are increasing
due to the closure of smaller, local, family owned abattoirs in favour of large
automated abattoirs with an annual throughput in excess of 100,000 pigs per year,
such as those owned by Vion and Tulip.
The pigs are often transported to slaughter in lorries that are able to hold in excess of
200 commercial slaughter animals. However, there are several stages in the life cycle
of a commercial pig during which such transportation may be used. It is not
uncommon for farms to have a grow out unit where pigs are transported from the
breeding farm at about 35kg to the grow out. The animals will then stay on the unit
33
until they reach slaughter weight, approximately 90kg, before being transported to the
abattoir.
During the transportation period the welfare of the pigs is determined by the length of
the journey and the conditions under which the animals are transported (Warriss,
1996). As journey time increases the importance of the conditions of transportation
also increase. It has been mentioned that the factors which affect the suitability of the
conditions of transport are stocking density, ventilation, temperature and humidity,
noise and vibration (Warriss, 1996).
5.2 STOCKING DENSITY, TEMPERATURE AND VENTILATION:
It has often been thought that during transportation the ideal is probably a density at
which all animals can just lie down together (Collins, 1993). For this to occur an area
of between 0.41m2 and 1.09m
2 per 100kg is required. It is thought that lower densities
will allow more space for lying down and greater opportunity for the pigs to regulate
their body temperatures by behavioural adaptations (Warriss et al, 1998) whereas
higher densities may reduce the risk of pigs being thrown around (Warriss et al,
1998). However, as discussed by Guise et al (1998) the predominant behaviour during
short journeys (3hours or less) is for most pigs to stand whilst the vehicle is moving.
However, on long journeys in excess of 24hrs lying becomes the predominant
behaviour within 2 to 5 hours of the journey commencing.
In order to be able to recommend a stocking density to reduce stress levels and
increase welfare during short journey transit (≤ 3hrs) Guise et al (1998) looked at the
effects of four different stocking densities on the carcass measurements of pigs. The
maximum stocking density, as set out by Directive 95/29 of the EU legislation, is
235kg/m2 however, during their study Guise et al (1998) looked at densities both
above and below the maximum and found that overall, the measurements made
produced no evidence that transport stocking density had an effect on the carcass
quality or welfare on short journeys. However, during a further study by Warriss et al
(1998), which looked at the physiological response of the pigs during transit, they
found that increasing stocking densities during transit were associated with increased
circulating CPK levels. As already discussed, increased levels of CPK reflect
34
increasing physical stress, since the enzyme is released from the muscle fibres under
the influence of intense muscular exertion (Warriss et al, 1998). The increased levels
of CPK suggest that at higher stocking densities the pigs were not able to settle down
and tended to be jostled more (Warriss et al, 1998) which over extended periods of
time would lead to fatigue. The difference in the results, between the two studies,
shows the importance of considering both the mental and physical welfare of an
animal. Therefore, with regards to stocking density it can be concluded that when
looking at physiological responses higher stocking densities result in more physical
stress, even if carcass measurements remain unchanged.
However, stocking density does have a direct effect on the temperatures and humidity
of the conditions the animals are transported under. By influencing the rate at which
heat can be dissipated from animals’ bodies, stocking density affects mortality
attributed to hyperthermia (Warriss, 1996). It has been shown that mortality rate
within the transportation lorry is affected by the location of the pig within the penned
areas. The area with the highest rate of mortality is directly behind the cab on the
lower deck (Warriss, 2008 Personal Communication) this area has been shown to
have the least effective ventilation and therefore pigs kept in this pen are exposed to
heat stress. As a result pigs which have been transported on the lower deck are often
associated with Pale Soft Exudative (PSE) meat and have been shown to have
increased levels of cortisol. The presence of PSE meat is a form of retrospective
assessment of the welfare of the pigs since PSE is know to be caused by acute stress.
Moreover, certain breeds of pigs, such as the Pietrain and Landrace, have a genetic
tendency to suffer from Porcine Stress Syndrome (PSS). The gene is associated with
acute stress, as well as sudden death as a result of malignant hyperthermia. The
malignant hyperthermia, and often resultant death, is exasperated by temperature
increases and poor ventilation. The ventilation within the lorry is maintained by the
air flowing through as the vehicle moves forward, however, when the vehicle stops
the temperature rises. The relationship between temperature and mortality is
curvilinear with temperature increases above 15°C having more deleterious effect
(Warriss, 1996). The relationship between temperature increases and mortality means
that there is often seasonal effect, with the largest frequency of deaths occurring
during the summer months. Warriss (1996) estimates that 10500 pigs die during
35
transportation every year, however, the number of pigs exposed to poor welfare is
much greater than that and it is only the few animals that have been exposed to
conditions beyond their coping ability that die.
5.3 JOURNEY TIME AND ASSOCIATED STRESSORS:
Legislation sets maximum journey times for pigs based on the type of transportation
used. A standard vehicle has a maximum journey time of 8hrs whereas a vehicle that
meets the additional specifications can carry pigs for 24hours as long as continuous
access to water is available. If there are extenuating circumstances the journey time
can be increased to 26hours. If the journey time is expected to take longer then the
specified allowance then a 24 hour resting period is required before the journey can
commence.
Due to the extended periods of time spent on the transportation lorry pigs are exposed
to long periods of time where they are deprived of food. In addition, pigs are often not
fed prior to loading when being sent to slaughter, since a full gut during evisceration
has the possibility of contaminating the carcass. In addition pigs are monogastric, and
do not have a rumen, therefore, the deprivation of food becomes a stressor earlier than
in Cattle and Sheep which use the rumen as food/water reservoir. However, feed
deprivation can also be seen as improving welfare since pigs are thought to suffer
from motion sickness with symptoms being more acute in recently fed animals and as
mentioned by Warriss (1996) recently fed pigs have a slightly higher risk of dying
during transport.
In addition during transportation pigs are often removed from their social groupings
and mixed at the point of loading. Mixing in itself is inheritantly stressful due to pigs
being naturally antagonistic. Having established dominance hierarchies throughout
their time on farm they have been removed from a stable social grouping and will
fight upon mixing to re-establish a hierarchy. However, whilst the vehicle is moving
the animals are unable to interact and fight, according to Warriss (1996) the problems
arise when the vehicle stops allowing the pigs to fight causing additional stress,
increasing body temperature and possibly resulting in physical trauma and injury.
However, the increase in body temperature becomes difficult to manage in a stopped
36
vehicle since the ventilation is compromised, thereby increasing the risk of death due
to hyperthermia. As a result it is recommended that stops during journey periods are
reduced in length and frequency.
5.4 HANDLING:
It is generally accepted that the largest stressor during the transportation of pigs is
during loading and unloading. Pigs are mixed into unfamiliar groups, loaded into an
unfamiliar environment and exposed to human contact. With regards to welfare it is
accepted that pigs loaded using less stressful systems may endure the rigours of the
journey better and so loading systems could considerably influence the overall welfare
of the transported animals (Brown et al, 2005)
The loading mechanism is often not ideal for the movement of pigs. The tailgate of
lorries often lays an angles in excess of 29° (Brown et al, 2005) which animals find
difficult to negotiate. Brown et al (2005) looked at three different loading systems that
are commercially available, the experimental results suggest that ramps of 18° or the
use of hydraulic tail-lifts are preferable with the animals showing no significant
increases in cortisol levels. The lack of cortisol increase is a good indicator that the
animals were not unduly stressed by the handling process.
The human interaction with the animals can be more stressful during the loading since
the pigs will often have had very limited human contact whilst on the farm, yet at
point of loading the stockman will remove pigs from their penned groups and using
pig boards and goading methods herd the animals towards the transportation. When
observing the loading process it can often be fairly noisy with stockman vocalising in
an attempt to encourage the animals to load quickly. This period of human interaction
will be mentally stressful if not physically so.
5.5 CONCLUSIONS:
The reason behind the transportation of animals over long periods of time is often due
to economical reasons as well as the location of facilities. Welfare concerns with
37
regards to animals for meat are relatively new and are often only found in Western
Countries which have a secure food supply chain.
The improvement of welfare is often directly associated with improved stockmanship
since the most stressful stage of the transportation is often regarded as being at the
points of loading and unloading. By training people that come into contact with pigs
during the transportation process to handle the animals in an empathic way welfare is
automatically improved. By ensuring that stops during journey periods are reduced in
length and frequency fighting during transportation is reduced and temperature
increases are minimised. With regards to stocking density if can be concluded that
when looking at physiological responses higher stocking densities result in more
physical stress, even if carcass measurements remain unchanged.
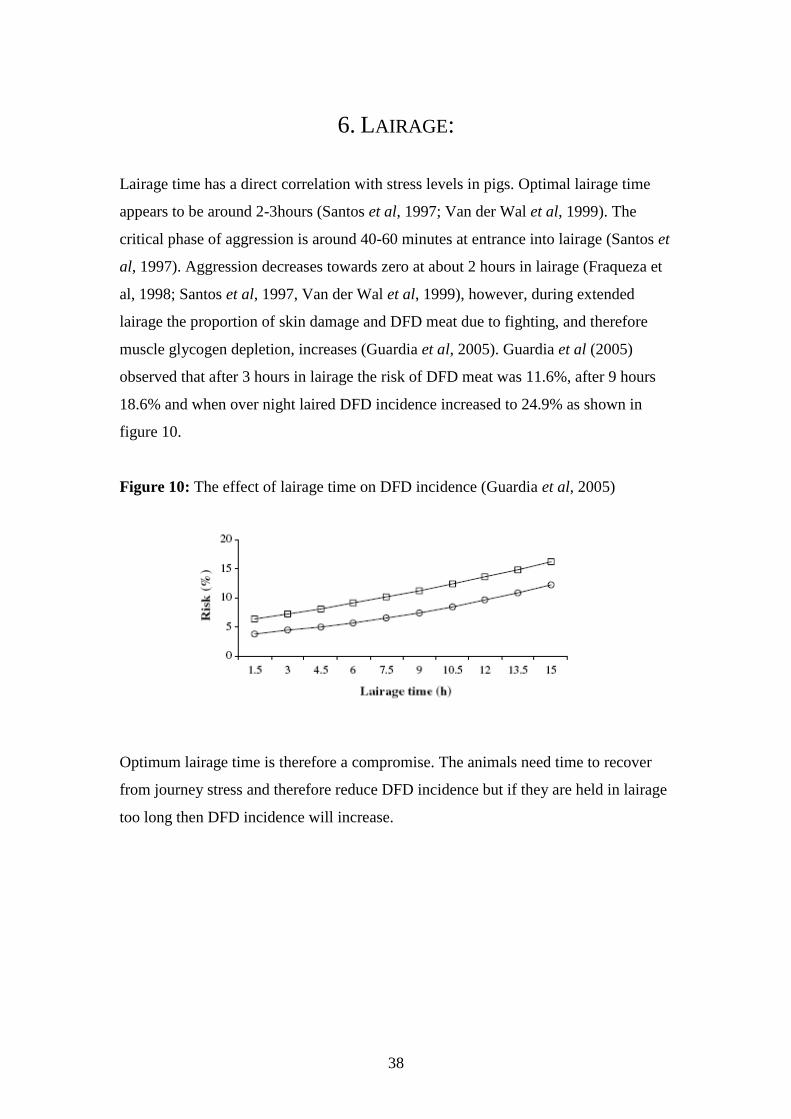
38
6. LAIRAGE:
Lairage time has a direct correlation with stress levels in pigs. Optimal lairage time
appears to be around 2-3hours (Santos et al, 1997; Van der Wal et al, 1999). The
critical phase of aggression is around 40-60 minutes at entrance into lairage (Santos et
al, 1997). Aggression decreases towards zero at about 2 hours in lairage (Fraqueza et
al, 1998; Santos et al, 1997, Van der Wal et al, 1999), however, during extended
lairage the proportion of skin damage and DFD meat due to fighting, and therefore
muscle glycogen depletion, increases (Guardia et al, 2005). Guardia et al (2005)
observed that after 3 hours in lairage the risk of DFD meat was 11.6%, after 9 hours
18.6% and when over night laired DFD incidence increased to 24.9% as shown in
figure 10.
Figure 10: The effect of lairage time on DFD incidence (Guardia et al, 2005)
Optimum lairage time is therefore a compromise. The animals need time to recover
from journey stress and therefore reduce DFD incidence but if they are held in lairage
too long then DFD incidence will increase.
39
7. SLAUGHTER & REFRIGERATION:
7.1 SLAUGHTER METHOD:
It is a legal requirement (Council Directive 93/119/CEE, 1993) that all slaughter
animals are rendered instantaneously insensible. They must remain in this state until
there is a complete loss of brain response due to exsanguination. The two most widely
used method in the UK are electrical stunning and killing by exposure to Carbon
Dioxide (CO2). To evaluate the slaughter methods the presence of haemorrhages,
blood splash and bone fractures are considered.
In general although pH24 is not significantly affected, muscle from electrically
stunned pigs have a more rapid early post-mortem pH decline and reduced WHC in
comparison to meat from CO2 stunned pigs (Channon, Payne & Warner, 2000;
Channon, Payne & Warner, 2002). The rapid post-mortem pH decline and reduced
WHC are caused by increased energy metabolism within the muscle (Josell, von Seth
& Tornberg, 2003) which suggests that electrical stunning results in greater
physiological stress than CO2 killing. Channon, Payne & Warner (2000) also found a
reduction in blood splash incidence when CO2 stunning was used in comparison to
Electrical stunning. However, not all research agrees that CO2 is the most welfare
friendly option. Becerril-Herrera et al (2009) found that CO2 stunning lead to major
mineral imbalances, resulting in reduced pH hypercapnia, hypercalcemia and
hyperglucemia, in comparison to electrical stunning. These metabolic imbalances may
all possibly lead to compromised welfare.
7.2 REFRIGERATION:
Chilling has serious effects on meat if it is carried out rapidly when the meat is still in
a pre-rigor condition. Under normal conditions the onset of rigor-mortis occurs 6-8hrs
post-slaughter (D’Souza et al, 1998). In pork the rate of breakdown of ATP is more
rapid and under moderate chilling regimes, cold-shortening will not occur. However,
in pork meat high muscle temperatures and low pH are known to cause PSE meat
(Savell et al, 2005). To reduce PSE incidence it is recommended that an internal
muscle temperature of 10ºC at 12 hours and 2-4ºC at 24 hours.
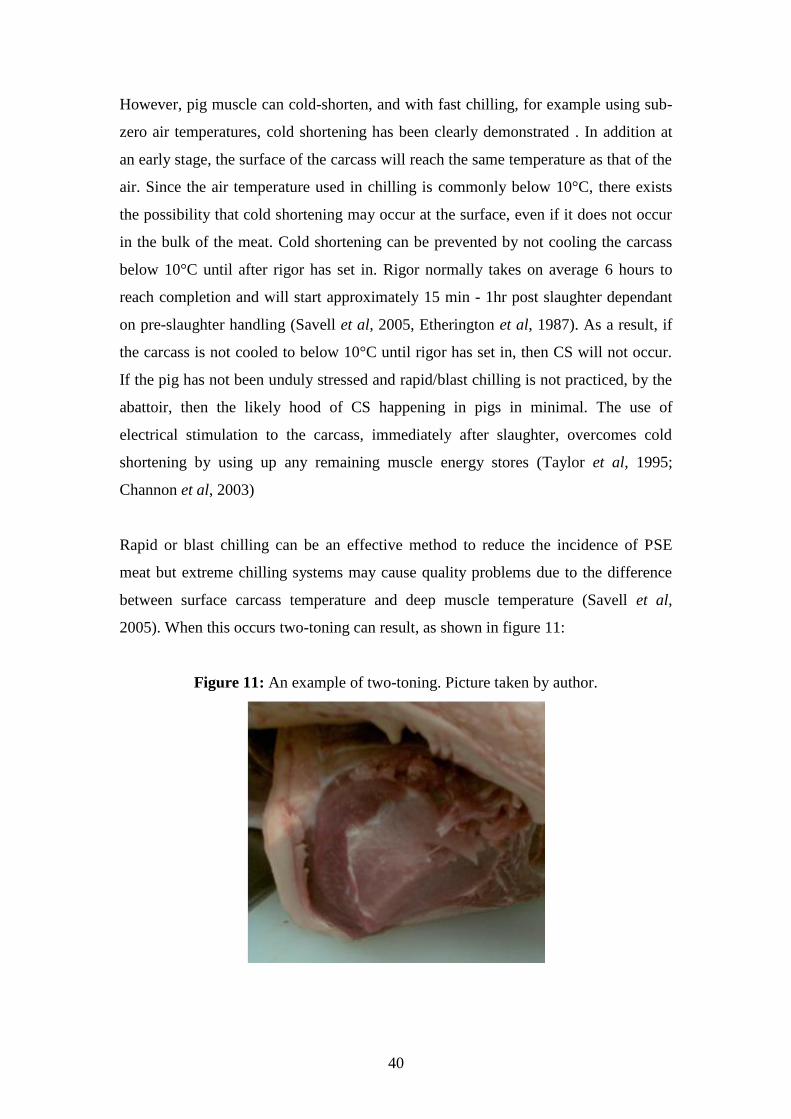
40
However, pig muscle can cold-shorten, and with fast chilling, for example using sub-
zero air temperatures, cold shortening has been clearly demonstrated . In addition at
an early stage, the surface of the carcass will reach the same temperature as that of the
air. Since the air temperature used in chilling is commonly below 10°C, there exists
the possibility that cold shortening may occur at the surface, even if it does not occur
in the bulk of the meat. Cold shortening can be prevented by not cooling the carcass
below 10°C until after rigor has set in. Rigor normally takes on average 6 hours to
reach completion and will start approximately 15 min - 1hr post slaughter dependant
on pre-slaughter handling (Savell et al, 2005, Etherington et al, 1987). As a result, if
the carcass is not cooled to below 10°C until rigor has set in, then CS will not occur.
If the pig has not been unduly stressed and rapid/blast chilling is not practiced, by the
abattoir, then the likely hood of CS happening in pigs in minimal. The use of
electrical stimulation to the carcass, immediately after slaughter, overcomes cold
shortening by using up any remaining muscle energy stores (Taylor et al, 1995;
Channon et al, 2003)
Rapid or blast chilling can be an effective method to reduce the incidence of PSE
meat but extreme chilling systems may cause quality problems due to the difference
between surface carcass temperature and deep muscle temperature (Savell et al,
2005). When this occurs two-toning can result, as shown in figure 11:
Figure 11: An example of two-toning. Picture taken by author.

41
During blast chilling it is also possible that the surface of the meat is becoming
frozen. If this occurs the integrity of the muscle structure is compromised and upon
thaw there are increased levels of drip shown.
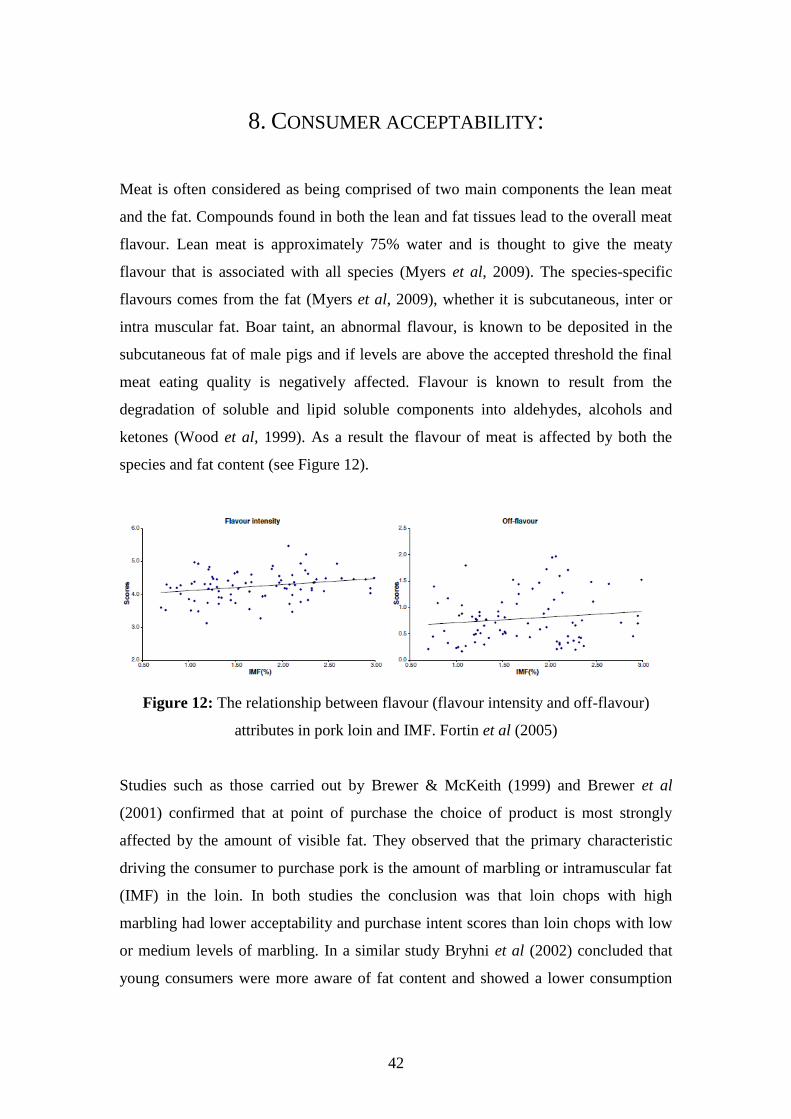
42
8. CONSUMER ACCEPTABILITY:
Meat is often considered as being comprised of two main components the lean meat
and the fat. Compounds found in both the lean and fat tissues lead to the overall meat
flavour. Lean meat is approximately 75% water and is thought to give the meaty
flavour that is associated with all species (Myers et al, 2009). The species-specific
flavours comes from the fat (Myers et al, 2009), whether it is subcutaneous, inter or
intra muscular fat. Boar taint, an abnormal flavour, is known to be deposited in the
subcutaneous fat of male pigs and if levels are above the accepted threshold the final
meat eating quality is negatively affected. Flavour is known to result from the
degradation of soluble and lipid soluble components into aldehydes, alcohols and
ketones (Wood et al, 1999). As a result the flavour of meat is affected by both the
species and fat content (see Figure 12).
Figure 12: The relationship between flavour (flavour intensity and off-flavour)
attributes in pork loin and IMF. Fortin et al (2005)
Studies such as those carried out by Brewer & McKeith (1999) and Brewer et al
(2001) confirmed that at point of purchase the choice of product is most strongly
affected by the amount of visible fat. They observed that the primary characteristic
driving the consumer to purchase pork is the amount of marbling or intramuscular fat
(IMF) in the loin. In both studies the conclusion was that loin chops with high
marbling had lower acceptability and purchase intent scores than loin chops with low
or medium levels of marbling. In a similar study Bryhni et al (2002) concluded that
young consumers were more aware of fat content and showed a lower consumption
43
than older consumers but that flavour was still the single most important sensory
characteristic.
The tenderness of meat has long been known to affect the acceptability of meat to the
consumer. Tenderness can be improved by the aging of the meat. Carcasses or meat
are aged by holding them at refrigeration temperatures for extended periods of time
after slaughter and initial chill. Aging (or conditioning) improves the tenderness and
flavour of meat. There are two methods for aging meat: wet aging and dry aging.
Wood et al (1996) found that aging pork for 10 days post-mortem had a greater effect
than genotype in improving tenderness. Aging has also been shown to improve
sensory tenderness and overall liking scores of pork meat (Taylor et al, 1995).
However, studies in beef by Huffman et al (1996) found that flavour had a stronger
relationship (R2 = 0.67) than any other factor when consumers prepared meat at home.
A similar study by Sitz et al (2005) showed that flavour was the most important factor
affecting meat buying habits and preferences when tenderness of beef was held
constant.
44
REFERENCES:
Aumaitre, A., Symesma, W., Vanderhaegen, J., Whittemore, C. T. and Zivkovic, S.
(1982). IV. Pigs. Livestock Production Science, 9, 127-161
Becceril-Herrera, M., Alonso-Spilsbury, M., Lemos-Flores, C., Guerrero-Legarreta, I.,
Olmos-Hernandez, A., Ramirez-Necoechea, R. and Mota-Rojas, D. (2009). CO2
stunning may compromise swine welfare compared with electrical stunning. Meat
Science, 81, 233-237
Bendall, J. R. and Swatland, H. J. (1988). Review of the relationships of pH with
physical aspects of pork quality. Meat Science, 24, 85-126
Bertram, H. C., Petersen, J. S. and Andersen, H. J. (2000). Relationship between RN-
genotype and drip loss in meat from Danish pigs. Meat Science, 56, 49-55
Blanchard, P. J., Warkup, C. C., Ellis, M., Willis, M. B., and Avery, P. (1999). The
influence of the proportion of Duroc genes on growth, carcass and pork eating quality
characteristics. Animal Science, 68, 495-501
Boler, D. D., Gabriel, S. R., Yang, H., Balsbaugh, R., Mahan, D. C., Brewer, M. S.,
McKeith, F. K. and Killefer, J. (2009). Effect of different dietary levels of natural-
source vitamin E in grow-finish pigs on pork quality and shelf life. Meat Science, 83,
723-730.
Bonneau, M. (1982) Compounds Responsible For Boar Taint, With Special Emphasis
On Androstenone - A Review. Livestock Production Science, 9, 687-705.
Brewer, M. S. and McKeith, F. K. (1999). Consumer rated quality characteristics as
related to purchase intent of fresh pork. Journal of Food Science, 64, 171-174
45
Brewer, M. S., Zhu, L. G., and McKeith, F. K. (2001). Marbling effects on quality
characteristics of pork loin chops: consumer purchaseintent visual and sensory
characteristics. Meat Science, 59, 153-163
Brown, S. N., Knowles, T. G., Wilkins, L. J., Chadd, S. A. and Warriss, P. D. (2005)
The Response of Pigs to Being Loaded or Unloaded onto Commercial Animal
Transporters Using Three Systems. The Veterinary Journal. 170, pp 91-100
Bryhni, E. A., Byrne, D. V., Rødbotten, M., Claudi-Magnussen, C., Agerhem, H.,
Johansson, M., Lea, P. and Martehns, M. (2002) Consumer perceptions of pork in
Denmark, Norway and Sweden. Food Quality and Preference, 13, 257 – 266
Buys, E. M., Nortje, Â G. L., Jooste, P. J, and Holy, A. V. (2000). Combined effect of
modified atmosphere bulk packaging, dietary vitamin E supplementation and
microbiological contamination on colour stability of Musculus gluteus medius. Meat
Science, 55, 403-411
Channon, H. A., Baud, S. R., Kerr, M.. G. and Walker, P. J. (2003). Effect of low
voltage electrical stimulation of pig crcasses and ageing on sensory attribures of fresh
pork. Meat Science, 65, 1315-1324
Channon, H. A., Kerr, M. G. and Walker P. J. (2004). Effect of Duroc content, sex
and aging period on meat and eating quality attributes of pork loin. Meat Science, 66,
881-888
Channon, H. A., Payne, A. M. and Warner, R. D. (2000). Halothane genotype, pre-
slaughter handling and stunning method all influence pork quality. Meat Science, 56,
291-299
Channon, H. A., Payne, A. M. and Warner, R. D. (2002). Comparison of CO2
stunning with manual electrical stunning (50Hz) of pigs on carcass and meat quality.
Meat Science, 60, 63-68
46
Close, W. H., Surai, P. F. and Taylor-Pickard, J. A. (2008) Selenium in pig nutrition.
Current advances in selenium research and applications. Eds. Suri, P. F. and Taylor-
Picjard, J. A. pp263
Collins J.R. (1993) Welfare in Transit. Pig Vet. J., 30, pp 23-29
Dransfield, E. (1993). Modeling post-mortem tenerization-IV: role of calpains and
calpastin in conditioning. Meat Science, 37, 391-409
D’Souza, D. N. and Mullen, B. P. (2002). The effect of genotype, sex and
management strategy on the eating quality of pork. Meat Science, 60, 95-101
D’Souza, D. N., Dunshae, F. R., Warner, R. D. and Leury, B. J. (1998). The effect of
handling pre-slaughter and carcass processing rate post-slaughter on pork quality.
Meat Science, 50, 429-437
D’Souza, D. N., Warner, R. D., Dunshea, F. R. and Leury, B. J. (1999). Comparison
of different dietary magnesium supplements on pork quality. Meat Science, 51, 221-
225
D’Souza, D. N, Warner, R. D., Leury, B. J. and Dunshea, F. R. (1998). The effect of
dietary magnesium aspartate supplementation on pork quality. Journal of Animal
Science, 76, 104-109
Enfält, A. C., Lundström, K., Hansson, I., Johansen, S. and Nystöm, P.-E. (1997).
Comparison of non-carriers and heterozygous carriers of the RN- allele for carcass
composition, muscle distribution and technological meat quality in Hampshire-sired
pigs. Livestock Production Science, 47, 221-229
Essén-Gustavsson, B., Karlsson, A., Lundström, K., and Enfält, A-C. (1994).
Intramuscular fat and muscle fibre lipidcontents in halothane-gene-free pigs fed high
or low protein diets and its relation to meat quality. Meat Science, 38, 269 – 277
47
Etherington, D. J., Taylor, M. A. J. and Dransfield E. (1987). Conditioning of meat
from different species. Relationship between tenderising and the levels of Cathepsin
B, Cathepsin L, Calpain I, Calpain II and β-glucuronidase. Meat Science, 20, 1-18
Fàbrega, E., Manteca, X., Font, J., Gispert, M., Carrión, D., Velarde, A., Ruiz-de-la-
Torre, J. L., and Diestre, A. (2002) Effects of halothane gene and pre-slaughter
treatment on meat quality and welfare from two pig crosses. Meat Science, 62, 463-
472
Faustman, C., Chan, W. K. M., Schaefer D. M. and Havens, A. (1998) Beef Color
Update: The Role for Vitamin E, Journal of American Society of Animal Science, 76,
1019–1026
Fernandez, A., Tornberg, E., Naveau, L., Talmant., and Monin, G. (1992). Bimodal
distribution of muscle glycolytic potential in French and Swedish population of
Hampshire crossbred pigs. Journal of Science Food & Agriculture, 59, 307-311
Fisher, P., Mellett, F. D. and Hoffman (2000) Halothane genotype and pork quality. 1.
Carcass and meat quality characteristics of three halothane genotypes. Meat Science,
54, 97-105
Fortin, A., Robertson, W. M. and Tong, A. K. W. (2005) The eating quality of
Canadian pork and its relationship with intramuscular fat. Meat Science, 69, 297-305
Fraqueza, M. J., Roseiro, L. C., Almeida, J., Matias, E., Santos, C. and Randall, J. M.
(1998) Effects of lairage temperature and holding time on pig behaviour and on
carcass meat quality. Applied Animal Behaviour Science, 60, 317-330
Frederick, B. R., van Heughten, E. and See, M. T. (2006). Effects of pig age at market
weight and magnesium supplementation through drinking water on pork quality.
Journal of Animal Science, 84, 1512-1519.
48
Guardia, M. D., Estany, J., Balasch, S., Oliver, M.A., Gispert, M. and Diestre, A.
(2005). Risk assessment of DFD meat due to pre-slaughter conditions in pigs. Meat
Science, 70, 709-716
Guo, Q., Richert, B. T, Burgess, J. R., Webel, D. M., Orr, D. E., Blair, M., Fitzner, G.
E., Hall, D. D., Grant, A. L. and Gerrard, D. E. (2006). Effects of dietary vitamin E
and fat supplementation on pork quality. Journal of Animal Science, 84, 3089-3099.
Godt, J., Kristensen, K., Poulsen, C. S., Juhl, H. J. and Bech, A. C. (1996) A
consumer study of Danish entire male pigs. Fleischwirtschaft, 76, 518-520.
Guise, H. J., Riches, H. L., Hunter, E. J., Jones, T. A., Warriss, P. D. and Kettlewell,
P. J (1998) The Effect of Stocking Density in transit on the Carcass Quality and
Welfare of Slaughter Pigs: 1. Carcass Measurements. Meat Science Vol. 50, No. 4, pp
439-446
Hansen, L. L., Mejer, H., Thamsborg, S. M., Byrne, D. V., Roepstorff, A., Karlsson,
A. H., Hansen-Moller, J., Jensen, M. T. and Tuomola, M. (2006) Influence of chicory
roots (Cichorium intybus L) on boar taint in entire male and female pigs. Animal
Science, 82, 359-368.
Hoving-Bolink, A. H., Eikelenboom, G., van Diepen, J. Th. M., Jongbloed, A. W. and
Houben, J. H. (1998). Effect of dietary vitamin E supplementation on Pork Quality.
Meat Science, 49, 205-212.
Huffman, K. L., Miller, M. F., Hoover, L. C., Wu, C. K., Brittin, H. C. and Ramsey,
C. B. (1996). Effect of beef tenderness on consumer satisfaction with steaks
consumed in the home and reastaurant. Journal of Animal Science, 74 (1), 91-97.
Huiid, M. (2002) Proceedings of the 7th World Congress on Genetics Applied to
Livestock Production, Montpellier, France, August, 2002, Plenary Session
49
Humphreys, J. L., Carlson, M. S. and Lorenzen, C. L. (2009) Dietary supplementation
of magnesium sulphate and sodium bicarbonate and its effect on pork quality during
environmental stress. Livestock Science, 125, 15-21
Jensen, M. T. & Hansen, L. L. (2006) Feeding with chicory roots reduces the amount
of odorous compounds in colon and rectal contents of pigs. Animal Science, 82, 369-
376.
Jensen, C., Lauridsen, C, and Bertelsen, G. (1998). Dietary vitamin E: Quality and
storage stability of pork and poultry. Trends in Food Science and Technology, 9, 62-
72.
Josell, A., von Seth, G., and Tornberg, E. (2003) Sensory and meat quality traits of
pork in relation to post-slaughter treatment and RN genotype. Meat Science, 66, 113-
124
Lammens, V., Peeters, E., De Maere, H., De Mey, E., Paelinck, H., Leyten, J. and
geers, R. (2007). A survey of pork quality in relation to pre-slaughter conditions,
slaughterhouse facilities, and quality assurance. Meat Science, 75, 381-387
Lindahl, G., Enfält, A-C., Anderson, H. J. and Lundstrom, K. (2006). Impact of RN
genotype and aging time on colour characteristics of the pork muscle longissimus
dorsi and semimembranosus.
Lindahl, G., Lundstrom, K. and Tornberg, E. (2001) Contribution of pigment content,
myoglobin forms and internal reflectance to the colour of pork loin and ham from
pure breed pigs. Meat Science, 59, 141-151
Losel, D. and Claus, R. (2005) Dose-dependent effects of resistant potato starch in the
diet on intestinal skatole formation and adipose tissue accumulation in the pig.
Journal of Veterinary Medicine Series a-Physiology Pathology Clinical Medicine, 52,
209-212.
50
Losel, D., Lacorn, M., Buttner, D. and Claus, R. (2006) Flavor improvement in pork
from barrows and gilts via inhibition of intestinal skatole formation with resistant
potato starch. Journal of Agricultural and Food Chemistry, 54, 5990-5995.
Lund, M. N. Lametsch, R., Hviid, M. S. Jensen, O. N. and Skibsted, L. H. (2007 a)
High-oxygen packaging atmosphere influences protein oxidation and tenderness of
porcine longissimus dorsi during chill storage. Meat Science, 77, 295–303
Lund. M. N., Hviid, M. S., and Skibsted, L. H. (2007 b). The combined effect of
antioxidants and modified atmosphere packaging on protein and lipid oxidation in
beef patties during chill storage. Meat Science, 76, 226–233
Lundstrom, K., Malmfors, B., Malmfors, G., Stern, S., Petersson, H., Mortensen, A.
B. and Sorensen, S. E. (1988) Skatole, androstenone and taint in boars fed 2 different
diets. Livestock Production Science, 18, 55-67.
Lynch, M. P., Kerry, J. P., Buckley, D. J., Faustman, C. and Morrissey, P. A. (1999).
Effect of dietary vitamin E supplementation on the colour and lipid stability of fresh,
frozen and vacuum-packaged beef, Meat Science, 52, 95-99
Meat & Livestock Commission. (1992). Second Stotfold Pig Development Unit trial
results. Meat and Livestock Commission, Milton Keynes, UK (Now part of BPEX &
MLC Ltd)
Meat & Livestock Commission. (1992) Blueprint for Quality British Pork, Meat
Technology Transfer Group, PO Box 44, Winterhill House, Snowdon Drive,
Winterhill, Milton Keynes, MK6 1AX.
Monin, G. and Sellier, P. (1985). Pork of low technological quality with normal rate
of muscle pH fall in the Immediate post-mortem period: The case of Hampshire
breed. Meat Science, 20, 149-158
51
Myers, A. J., Scramlin, S. M., Dilger, A. C., Souza, C. M., McKeith, F. K. and
Killefer, J. (2009) Contribution of lean, fat, muscle colour and degree of doneness to
pork and beef species flavour. Meat Science, 82, 59-63
Neupert, B., Claus, R., Herbert, E. and Weiler, U. (1995) Influence of sex, energy
supply and light on fattening traits and carcass composition and their relation to
androstenone and skatole concentrations in adipose-tissue of pigs. Zuchtungskunde,
67, 317-331.
Newton, K. G. and Gill, C. O. (1981). The microbiology of DFD fresh meats: a
review. Meat Science 5, 223-232
Oksbjerg, N., Gondret, F. and Vestergaard, M. (2004) Basic principles of muscle
development and growth in meat-producing mammals as affected by the insulin-like
growth factor (IGF) system. Domestic Animal Endocrinology 27, 219-240
Oliver, M. A., Gispert, M. and Diestre, A. (1993). The effects of Breed and Halothane
Sensitivity on Pig Meat Qulity. Meat Science 35, 105-118
Raab, S., Leiser, R., Kemmer, H. and Claus, R. (1998) Effects of energy and purines
in the diet on proliferation, differentiation, and apoptosis in the small intestine of the
pig. Metabolism-Clinical and Experimental, 47, 1105-1111.
Rempel, W. E. and Marshall, M. L. (1990) Inheritance of coat colour in swine. In
Genetics of swine (ed. L. D. Young), pp 41-44. Technical Committee of North
Central Regional Research Project, NC-103.
Robbins, K., Jensen, J., Ryan K. J., Homco-Ryan, C., McKeith, F. K. and Brewer, M.
S. (2003), Dietary vitamin E supplementation effects on the color and sensory
characteristics of enhanced beef steaks. Meat Science, 64, 279–285
52
Rosenvold, K. and Andersen, H. J. (2003). Factors of significance for pork quality – a
review. Meat Science, 64, 219-237
Russell, R. G., and Oteruelo, F. T. (1981). An ultrastructural study of the
differentiation of skeletal muscle in the bovine fetus. Anatomy and Embryology, 162,
403-417
Santos, C., Almeida, J. M., Matia, E. C., Fraqueza, M. J., Roseiro, C. and Sardina, L.
(1997). Influence of lairage environmental conditions and resting time on meat quality
in pigs. Meat Science, 45, 253-262
Savell, J. W., Mueller, S. L., Baird, B. E. (2005) The chilling of carcasses. Meat
Science, 70, 449-459
Sellier, P. and Monin, G. (1994). Genetics of pig meat quality: a review. Journal of
Muscle Foods, 5, 187-219
Sink, J. D. (1967) Theoretical aspects of sex odor in swine. Journal of Theoretical
Biology, 17, 174-180.
Sitz, B. M., Calkins, C. R., Feuz, D. M., Umberger, W. J., and Eskridge, K. M.
(2005). Consumer sensory acceptance and value of domestic, Canadian, and
Australian grass-fed beef steaks. Journal of Animal Science, 83 (12), 2863-2868
Smith, G. C. Morgan, J. B., Sofos, J. N. and Tatum, J. D (1996). Supplemental
vitamin E in beef cattle diets to improve shelf-life of beef. Animal Feed Science
Technology, 59, 207-214
Squires, E. J., Development and detection of boar taint. Session 4 165 – 173
(Journal acquired from Fran Whittington exact source unknown).
Swigert, K. S., McKeith, F. K., Carr, T. C., Brewer, M. S. and Culbertson (2004).
Effects of dietary vitamin D3, vitamin E, and magnesium supplementation on pork
quality. Meat Science, 67, 81-86
53
Swantek, S., Morgan, J. B., Owens, F. N., Gill, D. R., Strasia, C. A., Dolezal, H. G.,
and Ray, F. K. (1999). Vitamin D3 supplementation on beef steers increases
longissimus tenderness. Journal of Animal Science, 77, 874-881
Taylor, A. A., Nute, G. R. and Warkup, C. C. (1995). The effect of chilling, electrical
stimulation and conditioning on pork eating quality. Meat Science, 39, 339-347
Torngren, M. N., (2003). Effect of packaging method on colour and eating quality of
beef loin steaks. 49th
international congress of meat science and technology, 2nd
Brazilian of Meat Science and Technology, 495-496
Van der Wal, P. G., Engel, B. and Reimert, H. G. M. (1999). The effect of stress,
applied immediately before stunning, on pork quality. Meat Science, 53, 101-106
Warriss, P. D., Brown, S. N., Adams, S. J. M. and Lowe, D. B. (1990a) Variation in
haem pigment concentration and colour in meat from British pigs. Meat Science 28,
321-329
Warriss, P. D., Brown, S. N., Rolph, T. P. and Kestin, S. C. (1990b) Interactions
between the beta-adrenergic agonist salbutamol and genotype on meat quality in pigs.
Journal of Agricultural Research 31, 421-430
Warriss, P. D. (1996) The Welfare of Animals During Transport. In. RAW, M-E. and
Parkinson, T. J. (Eds.), The Veterinary Annual, Volume 36, Blackwell Science Ltd,
Oxford. pp 73-85.
Warriss, P. D., Brown, S. N., Knowles, T. G., Edwards, J. E., Kettlewell, P. J. and
Guise H. J. (1998) The Effect of Stocking Density in Transit on the Carcass Quality
and Welfare of Slaughter Pigs: 2. Results from the Analysis of Blood and Meat
Samples. Meat Science, Vol 50. No. 4, pp 447-456
Warriss, P. D., (2000) Meat science: An introductory text. CABI publishing.
IBSN 0 85199 424 5
54
Wilkins (2008) Introduction to module, MSc Meat Science: Animal Welfare Module,
Personal Communication.
Wood, J. D. (1990). Consequences for meat quality of reducing carcass fatness. In J.
D. Wood and M. Enser (Eds.), Reducing fat in meat animals (pp. 344-397)
Wood, J. D., Brown, S. N., Nute, G. R., Whittington, F.M., Perry, A. M., Johnson, S.
P. and Enser, M. (1996). Effects of breed, feed level and conditioning time on
tenderness of pork. Meat Science, 44, 105-112.
Zakrys, P. I., Hogan, S. A., O’Sullivan, M. G., Allen, P. and Kerry, J. P. (2008).
Effects of oxygen concentration on the sensory evaluation and quality indicators of
beef muscle packed under modified atmosphere, Meat Science, (in press)
Zamaratskaia, G., Babol, J., Andersson, H. K., Andersson, K. and Lundstrom, K.
(2005) Effect of live weight and dietary supplement of raw potato starch on the levels
of skatole, androstenone, testosterone and oestrone sulphate in entire male pigs.
Livestock Production Science, 93, 235-243.
Zhan, X. A., Wang, M., Zhao, R. Q., Li, W. F. and Xu, Z. R. (2007). Effects of
different selenium source on selenium distribution, loin quality and antioxidant status
in finishing pigs. Animal feed science and technology, 132, 202-211
Web Sites:
FAWC, Farm Animal Welfare Council. http://www.fawc.org.uk/freedoms.htm
Accessed: November 2008