novel loci underlie natural variation in vitamin e levels ...novel loci underlie natural variation...
TRANSCRIPT

LARGE-SCALE BIOLOGY ARTICLE
Novel Loci Underlie Natural Variation in Vitamin E Levels inMaize GrainOPEN
Christine H. Diepenbrock,a Catherine B. Kandianis,a,b,1 Alexander E. Lipka,c,2 Maria Magallanes-Lundback,b
Brieanne Vaillancourt,d Elsa Góngora-Castillo,d,3 Jason G. Wallace,c,4 Jason Cepela,d Alex Mesberg,b
Peter J. Bradbury,c,e Daniel C. Ilut,a Maria Mateos-Hernandez,f,5 John Hamilton,d Brenda F. Owens,f Tyler Tiede,f,6
Edward S. Buckler,a,c,e Torbert Rocheford,f C. Robin Buell,d Michael A. Gore,a,7 and Dean DellaPennab,7
a Plant Breeding and Genetics Section, School of Integrative Plant Science, Cornell University, Ithaca, New York 14853bDepartment of Biochemistry and Molecular Biology, Michigan State University, East Lansing, Michigan 48824c Institute for Genomic Diversity, Cornell University, Ithaca, New York 14853dDepartment of Plant Biology, Michigan State University, East Lansing, Michigan 48824eU.S. Department of Agriculture-Agricultural Research Service, Robert W. Holley Center for Agriculture and Health, Ithaca, New York14853f Department of Agronomy, Purdue University, West Lafayette, IN 47907
ORCID IDs: 0000-0001-6327-6993 (E.G.-C.); 0000-0002-8937-6543 (J.G.W.); 0000-0003-3775-9881 (A.M.); 0000-0001-7497-9109(D.C.I.); 0000-0002-3100-371X (E.S.B.); 0000-0002-6727-4677 (C.R.B.); 0000-0001-6896-8024 (M.A.G.); 0000-0001-9505-7883 (D.D.P.)
Tocopherols, tocotrienols, and plastochromanols (collectively termed tocochromanols) are lipid-soluble antioxidantssynthesized by all plants. Their dietary intake, primarily from seed oils, provides vitamin E and other health benefits.Tocochromanol biosynthesis has been dissected in the dicot Arabidopsis thaliana, which has green, photosynthetic seeds,but our understanding of tocochromanol accumulation in major crops, whose seeds are nonphotosynthetic, remains limited.To understand the genetic control of tocochromanols in grain, we conducted a joint linkage and genome-wide associationstudy in the 5000-line U.S. maize (Zea mays) nested association mapping panel. Fifty-two quantitative trait loci for individualand total tocochromanols were identified, and of the 14 resolved to individual genes, six encode novel activities affectingtocochromanols in plants. These include two chlorophyll biosynthetic enzymes that explain the majority of tocopherol variation,which was not predicted given that, like most major cereal crops, maize grain is nonphotosynthetic. This comprehensiveassessment of natural variation in vitamin E levels in maize establishes the foundation for improving tocochromanol and vitaminE content in seeds of maize and other major cereal crops.
INTRODUCTION
Tocochromanols are synthesized by all plant tissues but aremostabundant in seeds, where they limit the oxidation of membraneand storage lipids,making themessential for seed viability (Sattleret al., 2004; Mène-Saffrané et al., 2010) and overall plant fitness(Maedaetal., 2006;MaedaandDellaPenna,2007;DellaPennaand
Mène-Saffrané, 2011; Inoue et al., 2011). In the human diet, to-cochromanols serve as both lipid-soluble antioxidants and theessential nutrient vitamin E (Hussain et al., 2013; Ahsan et al.,2015), with a-tocopherol having the highest vitamin E activity,a-tocotrienol and g-tocopherol 3- and 6-fold lower activity, re-spectively, and that of other tocochromanols being negligible(Kamal-Eldin and Appelqvist, 1996; DellaPenna and Mène-Saffrané, 2011). While plant seed oils are the major source ofdietary vitamin E, seeds of most crops predominantly containtocochromanols with low vitamin E activity (DellaPenna andMène-Saffrané, 2011).Tocochromanols are synthesized in plastids using various
prenyl-diphosphates derived from the plastidic isopentenylpyrophosphate (IPP) pathway and homogentisic acid (HGA), anintermediate in aromatic amino acid catabolism (Figure 1).Condensation of HGA with phytyl-diphosphate (phytyl-DP),geranylgeranyl-diphosphate (GGDP), or solanesyl-diphosphate(solanesyl-DP) yields committed intermediates that are cyclizedandmethylatedtoproducethea,b,g,andd isoformsof tocopherolsand tocotrienols, and plastochromanol-8 (PC-8), respectively.Tocochromanol biosynthesis is fully elucidated in Arabidopsisthaliana and involves36enzymatic activities (encodedby53genes)
1Current address: Advancing Eco Agriculture, Middlefield, OH 44062.2 Current address: Department of Crop Sciences, University of Illinois atUrbana-Champaign, Urbana, IL 61801.3 Current address: Department of Biotechnology, Yucatan Center forScientific Research, Merida, Yucatan, Mexico 97200.4 Current address: Department of Crop and Soil Sciences, University ofGeorgia, Athens, GA 30602.5 Current address: Monsanto Company, Stonington, IL 62567.6 Current address: Department of Agronomy and Plant Genetics,University of Minnesota, St. Paul, MN 55108.7 Address correspondence to [email protected] or [email protected] authors responsible for distribution of materials integral to thefindings presented in this article in accordance with the policy describedin the Instructions for Authors (www.plantcell.org) are: Michael A. Gore([email protected]) and Dean DellaPenna ([email protected]).OPENArticles can be viewed without a subscription.www.plantcell.org/cgi/doi/10.1105/tpc.17.00475
The Plant Cell, Vol. 29: 2374–2392, October 2017, www.plantcell.org ã 2017 ASPB.

for the biosynthesis of HGA, prenyl-diphosphates, and the coretocochromanol pathway itself (vitamin E [VTE] loci 1 through 6;DellaPenna and Mène-Saffrané, 2011; Lipka et al., 2013). Genesencoding these enzymatic reactions are considered a priori can-didates in the Arabidopsis genome that may influence naturalvariation for tocochromanol traits. Because these 36 enzymaticreactions are conserved across the plant kingdom (Cheng et al.,2003; Sattler et al., 2004; Karunanandaa et al., 2005; Gilliland et al.,2006; Tang et al., 2006; DellaPenna and Mène-Saffrané, 2011;Fritsche et al., 2012; Wang et al., 2012) a priori homologs can bereadily identified in both monocot and dicot species (e.g., themaize [Zea mays] genome contains 80 such a priori candidatesthat encode these 36 activities; Supplemental Data Set 1). Inaddition, like most monocots, maize also encodes homoge-ntisate geranylgeranyl transferase (HGGT), the committed stepin tocotrienol biosynthesis (Cahoon et al., 2003).
The cloning of Arabidopsis VTE genes allowed the core toco-chromanol pathway to be engineered for improved nutritionalcontent and composition in various plants (Shintani andDellaPenna,1998; Savidge et al., 2002; Collakova and DellaPenna, 2003;Karunanandaa et al., 2005; Kumar et al., 2005; Raclaru et al.,2006; Hunter and Cahoon, 2007; Li et al., 2010; DellaPenna andMène-Saffrané, 2011; Lu et al., 2013; Zhang et al., 2013). Alteringthe expression of the pathway methyltransferase genes, vte3and vte4, has profound impacts on the qualitative profiles ofspecific tocopherols and tocotrienols in leaves and seedwithout affecting total tocochromanol levels (Shintani andDellaPenna, 1998; Cheng et al., 2003; Van Eenennaam et al.,2003; Karunanandaa et al., 2005; DellaPenna and Mène-Saffrané, 2011; Lu et al., 2013). Engineering total tocotrienolcontent has proven relatively straightforward, with hggt1overexpression increasing tocotrienols to levels several times
Figure 1. Tocochromanol Biosynthetic Pathways in Maize.
Precursorpathwaysaresummarized ingrayboxes.Thesevenquantifiedcompoundsareshown inblack textwith their correspondingstructures.Keyapriorigenesare inbold italicized text at thepathwaystep(s) executedby their encodedenzymewith theeight apriori genes identified in this studyhighlighted in redtext.Compoundabbreviations:SDP, solanesyl diphosphate;Phytyl-DP,phytyl diphosphate;GGDP,geranylgeranyl diphosphate;HGA,homogentisic acid;MSBQ, 2-methyl-6-solanyl-1,4-benzoquinol; MPBQ, 2-methyl-6-phytyl-1,4-benzoquinol; MGGBQ, 2-methyl-6-geranylgeranyl-1,4-benzoquinol; PQ-9,plastoquinone-9; DMPBQ, 2,3-dimethyl-6-phytyl-1,4-benzoquinol; and DMGGBQ, 2,3-dimethyl-5-geranylgeranyl-1,4-benzoquinol. Gene abbreviations:1-deoxy-D-xylulose-5-phosphate synthase (dxs2 and 3); arogenate/prephenate dehydrogenase family protein (arodeH2); solanesyl diphosphate synthase(sds); phytol kinase (vte5); phytol phosphate kinase (vte6); p-hydroxyphenylpyruvate dioxygenase (hppd1); homogentisate geranylgeranyltransferase(hggt1); MPBQ/MSBQ/MGGBQ methyltransferase (vte3); and g-tocopherol methyltransferase (vte4).
Novel Vitamin E Loci in Maize Grain 2375

that of tocopherols (Cahoon et al., 2003; Kim et al., 2011; Yanget al., 2011; Zhang et al., 2013; Tanaka et al., 2015). In contrast,engineering total tocopherol content ismore difficult, and evenwith coordinate overexpression of multiple pathway steps, theincreasesachievedweremodest (Savidgeet al., 2002;CollakovaandDellaPenna, 2003; Karunanandaa et al., 2005; Raclaru et al.,2006; Lu et al., 2013). Identification of the tocopherol-deficientArabidopsis vte5 and vte6 mutants (Valentin et al., 2006; VomDorp et al., 2015), encoding kinases that sequentially phos-phorylate phytol to generate phytyl-DP, suggestedamechanismunderlying the divergent engineering results for tocotrienols andtocopherols: While tocotrienol biosynthesis can directly utilizeGGDP, tocopherol biosynthesis requires phytol to be producedfrom GGDP and then phosphorylated.
Recent genome-wide association studies (GWAS) inmaize andrice (Oryza sativa) grain (Li et al., 2012; Lipka et al., 2013; Wanget al., 2015) showed strong associations of g-tocopherol meth-yltransferase (vte4) with a-tocopherol concentrations and muchweaker associations of tocopherol cyclase (vte1), hggt1, and anarogenate/prephenatedehydratasewith tocotrienol traits inmaizegrain (Lipka et al., 2013). The panel sizes and density of single-nucleotidepolymorphisms (SNPs) in thesestudies limitedboth theidentificationof controlling loci andgene-level resolutionof causalvariants. In this study, we leveraged the superior statistical powerandmapping resolution of themaize nested associationmapping(NAM) panel of ;5000 recombinant inbred lines (RILs) (Yu et al.,2008; McMullen et al., 2009) and the ;29 million sequence var-iants of maize HapMap v1 and v2 (Gore et al., 2009; Chia et al.,2012) to comprehensively investigate the quantitative trait loci(QTL) and underlying genes responsible for natural variation intocochromanol andvitaminE levels inmaizegrain, oneof themostabundantly consumed food staples on the planet.
RESULTS
Genetic Dissection of Tocochromanol Accumulation inMaize Grain
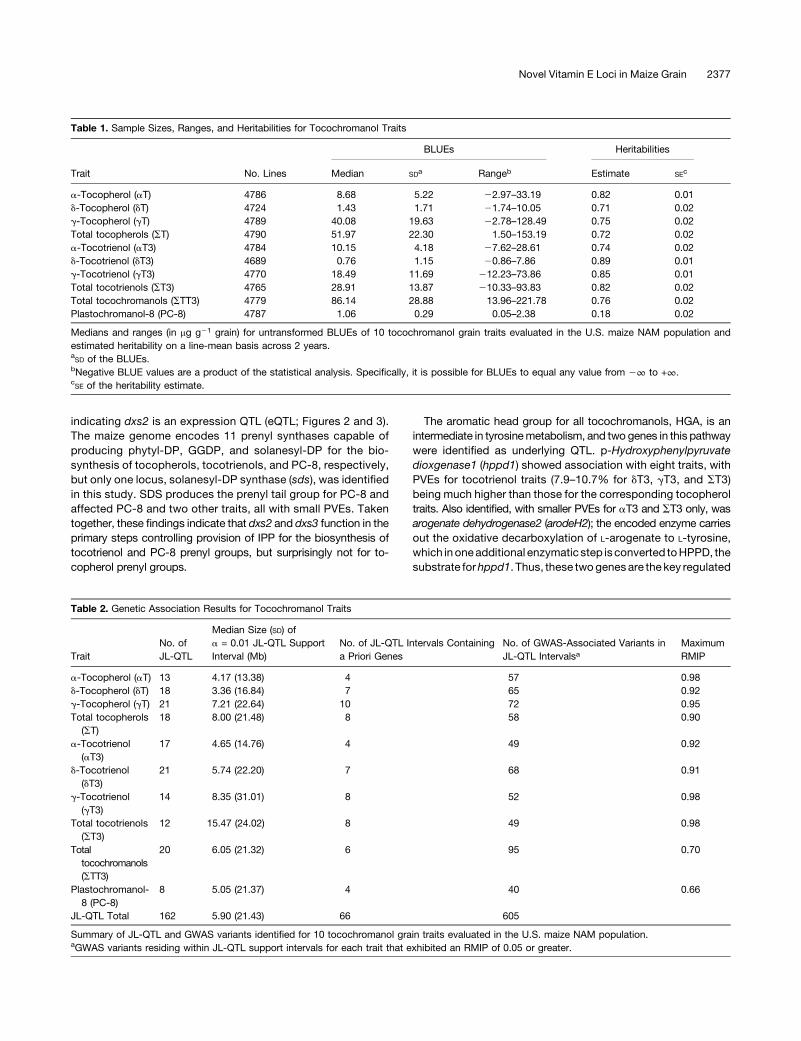
Weassessed the genetic basis of tocochromanol traits across the25 RIL families of the U.S. maize NAMpopulation. Physiologicallymature grain samples were quantified for seven tocochromanolcompounds by HPLC with fluorescence detection, and the dataused to calculate best linear unbiased estimators (BLUEs) for thesevencompounds, total tocopherols (ST), total tocotrienols (ST3),and total tocochromanols (STT3) (Table 1; Supplemental Data Set2). With the exception of PC-8, all traits had high estimates ofheritability (0.71 to 0.89; Table 1). Although the seven tocochro-manols are synthesized by a shared biosynthetic pathway (Figure1), only three pairs of compounds had correlations greater than;0.4 (Supplemental Figure 1).
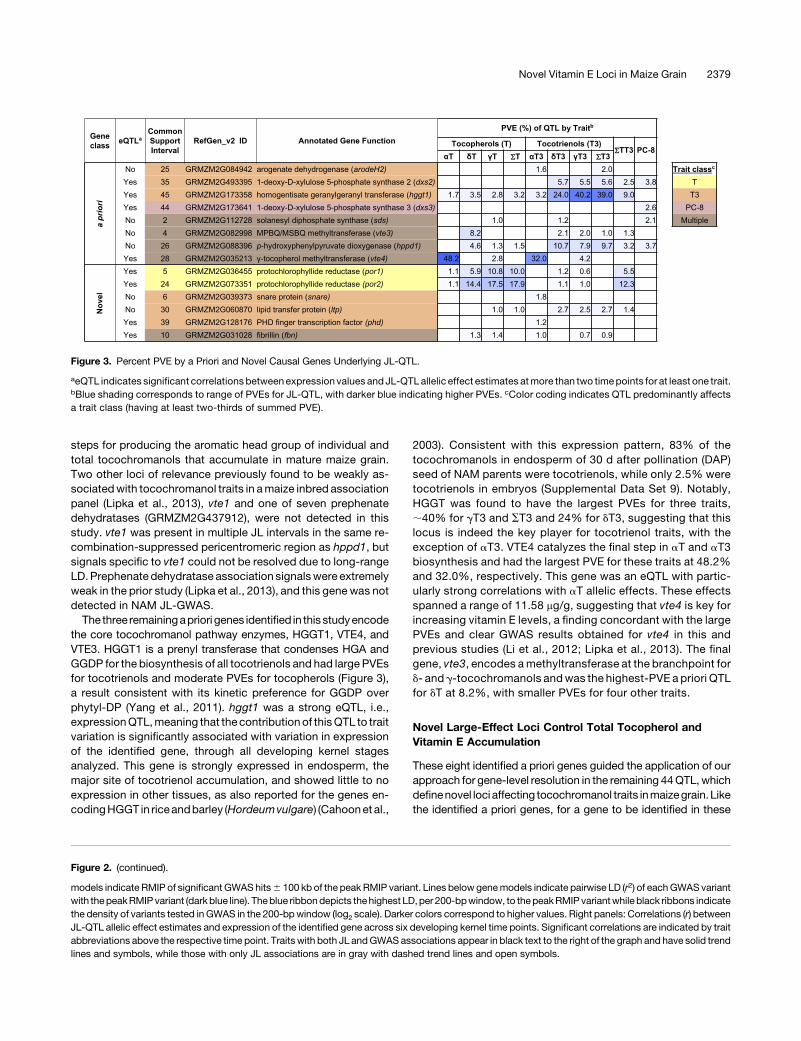
We mapped QTL across the 25 NAM families by joint-linkage(JL) analysis using a composite genetic map of;14,000 markers(Ogut et al., 2015). This identified162QTL,with eight to21QTLpertrait (Table 2; Supplemental Data Set 3) and phenotypic varianceexplained (PVE) of 0.6 to 48.2% (Supplemental Data Sets 4 and 5).Given the biosynthetic relationshipsof tocochromanols (Figure 1),it seemed likely that multiple traits could be affected by individual
QTL and indeed, 90%of overlappingQTL support intervalswerealso significantly pleiotropic (Supplemental Data Set 6 andSupplemental Figure 2). When overlapping QTL were merged,their numberswere reduced from162 to52uniqueQTL intervals,of which 31 affected multiple traits (Supplemental Data Set 4).To more finely resolve these 52 unique QTL, we conducted
a GWAS using the;29million variants of maize HapMap v1 andv2 imputed onto the ;4900 NAM RILs. A total of 1752 marker-trait associations achieved a resample model inclusion prob-ability (RMIP) value $0.05 (Valdar et al., 2009; SupplementalDataSet 7). Of these, 34.5% localized to a corresponding trait JLinterval (Table 2), with 47 markers having associations with twoto four traits, for a total of 605marker-trait associations. Linkagedisequilibrium (LD) decays rapidly in the NAM panel, with themajority of HapMap v1 and v2 polymorphisms (Gore et al., 2009;Chia et al., 2012) showing average LD decay in genic regions tobackground levels (r2 < 0.2) by 1 kb, but with large variancedependent on allele frequencies (Wallace et al., 2014). As ourGWAS-detected markers showed a similar trend of LD decay(Supplemental Figure 3), we limited our candidate gene searchspace to 6100 kb of GWAS-detected variants, which is ap-propriategiven thehighmarkerdensity and reported localizationof NAM GWAS signals to within a few kilobases of causal var-iants (Wallace et al., 2014).To aid in the identification of genes underlying QTL, we
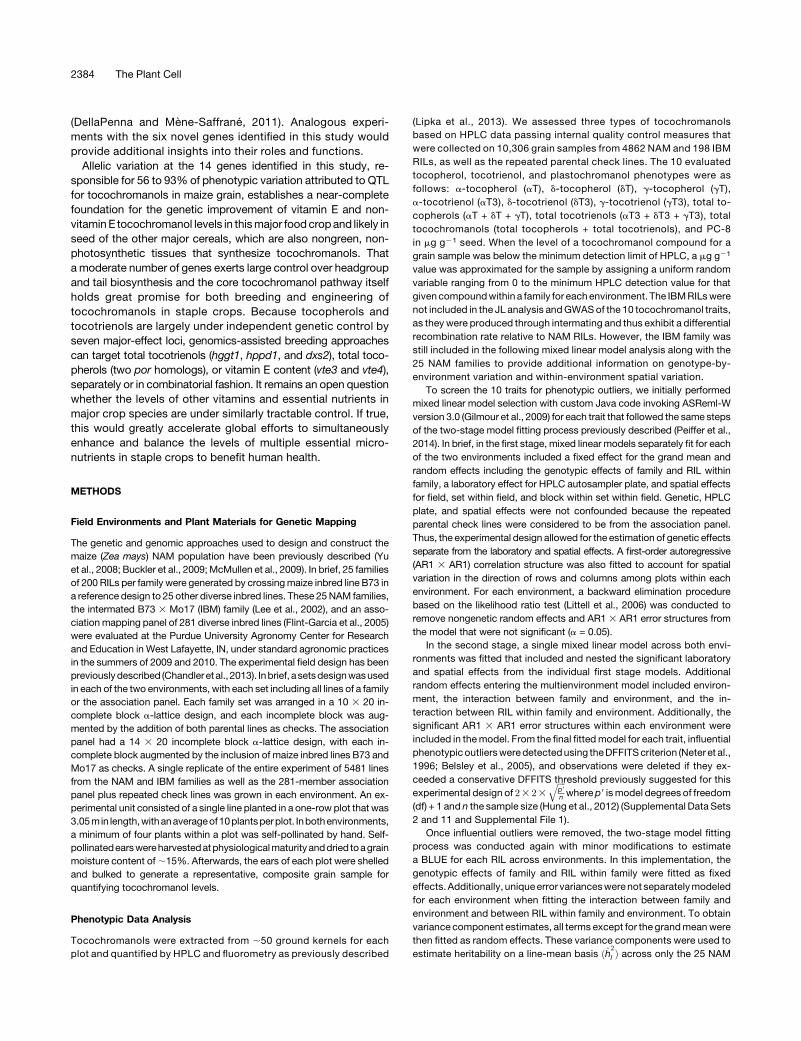
employeda triangulation approach (Ritchieet al., 2015) that testedfor correlations between (1) genotype ofGWASmarker(s), (2) log2-transformed RNA-seq expression levels across six developingkernel stages of the NAM parents for all genes in a search space(Supplemental Figure 4, Supplemental Table 1, andSupplementalData Set 8), and (3) transformed allelic effect estimates of in-dividual-trait QTL for each family compared with B73, the firstmaize reference genome and common parent of the U.S. maizeNAM population. We initially focused on the 23 unique QTLwhose intervals contained one or more of the 81 a priori genes(Supplemental Data Set 1) reasoning that they provide a high-quality set of known targets, which if positively identified in aninterval, could guide application of the approach to intervals thatlacked a priori candidate genes. Based on the narrow searchspace defined by LD and GWAS signals in combination with thetriangulation data sets, eight a priori genes were determined tounderlie a unique QTL (Figure 2; Supplemental Figure 5). Theseinclude three genes involved in prenyl group biosynthesis, two inaromatic head group biosynthesis, and three core tocochro-manol pathway enzymes (Figures 1 and 3).
The Role of a Priori Pathway Genes
The prenyl diphosphates for tocochromanol biosynthesis aremade using five-carbon building blocks from the plastidic IPPpathway (eight activities encoded by 15 genes in maize). Onlytwo IPP pathway genes were found to underlie QTL; both en-code 1-deoxy-D-xylulose-5-phosphate synthase, the first andcommitted step of the pathway. dxs2 affected five traits (2.5–5.7% PVE), and dxs3 was specific for PC-8 (2.6% PVE), butunexpectedly, neither was associated with tocopherol traits.Allelic effect estimates and the expression ofdxs2, but notdxs3,were strongly correlated from mid-grain development onward,
2376 The Plant Cell
indicating dxs2 is an expression QTL (eQTL; Figures 2 and 3).The maize genome encodes 11 prenyl synthases capable ofproducing phytyl-DP, GGDP, and solanesyl-DP for the bio-synthesis of tocopherols, tocotrienols, and PC-8, respectively,but only one locus, solanesyl-DP synthase (sds), was identifiedin this study. SDS produces the prenyl tail group for PC-8 andaffected PC-8 and two other traits, all with small PVEs. Takentogether, these findings indicate that dxs2 and dxs3 function in theprimary steps controlling provision of IPP for the biosynthesis oftocotrienol and PC-8 prenyl groups, but surprisingly not for to-copherol prenyl groups.
The aromatic head group for all tocochromanols, HGA, is anintermediate in tyrosinemetabolism, and two genes in this pathwaywere identified as underlying QTL. p-Hydroxyphenylpyruvatedioxgenase1 (hppd1) showed association with eight traits, withPVEs for tocotrienol traits (7.9–10.7% for dT3, gT3, and ST3)being much higher than those for the corresponding tocopheroltraits. Also identified, with smaller PVEs for aT3 and ST3 only, wasarogenate dehydrogenase2 (arodeH2); the encoded enzyme carriesout the oxidative decarboxylation of L-arogenate to L-tyrosine,which in oneadditional enzymatic step is converted toHPPD, thesubstrate forhppd1. Thus, these twogenesare the key regulated
Table 1. Sample Sizes, Ranges, and Heritabilities for Tocochromanol Traits
Trait No. Lines
BLUEs Heritabilities
Median SDa Rangeb Estimate SEc
a-Tocopherol (aT) 4786 8.68 5.22 22.97–33.19 0.82 0.01d-Tocopherol (dT) 4724 1.43 1.71 21.74–10.05 0.71 0.02g-Tocopherol (gT) 4789 40.08 19.63 22.78–128.49 0.75 0.02Total tocopherols (ST) 4790 51.97 22.30 1.50–153.19 0.72 0.02a-Tocotrienol (aT3) 4784 10.15 4.18 27.62–28.61 0.74 0.02d-Tocotrienol (dT3) 4689 0.76 1.15 20.86–7.86 0.89 0.01g-Tocotrienol (gT3) 4770 18.49 11.69 212.23–73.86 0.85 0.01Total tocotrienols (ST3) 4765 28.91 13.87 210.33–93.83 0.82 0.02Total tocochromanols (STT3) 4779 86.14 28.88 13.96–221.78 0.76 0.02Plastochromanol-8 (PC-8) 4787 1.06 0.29 0.05–2.38 0.18 0.02
Medians and ranges (in mg g21 grain) for untransformed BLUEs of 10 tocochromanol grain traits evaluated in the U.S. maize NAM population andestimated heritability on a line-mean basis across 2 years.aSD of the BLUEs.
bNegative BLUE values are a product of the statistical analysis. Specifically, it is possible for BLUEs to equal any value from 2∞ to +∞.cSE of the heritability estimate.
Table 2. Genetic Association Results for Tocochromanol Traits
TraitNo. ofJL-QTL
Median Size (SD) ofa = 0.01 JL-QTL SupportInterval (Mb)
No. of JL-QTL Intervals Containinga Priori Genes
No. of GWAS-Associated Variants inJL-QTL Intervalsa
MaximumRMIP
a-Tocopherol (aT) 13 4.17 (13.38) 4 57 0.98d-Tocopherol (dT) 18 3.36 (16.84) 7 65 0.92g-Tocopherol (gT) 21 7.21 (22.64) 10 72 0.95Total tocopherols
(ST)18 8.00 (21.48) 8 58 0.90
a-Tocotrienol(aT3)
17 4.65 (14.76) 4 49 0.92
d-Tocotrienol(dT3)
21 5.74 (22.20) 7 68 0.91
g-Tocotrienol(gT3)
14 8.35 (31.01) 8 52 0.98
Total tocotrienols(ST3)
12 15.47 (24.02) 8 49 0.98
Totaltocochromanols(STT3)
20 6.05 (21.32) 6 95 0.70
Plastochromanol-8 (PC-8)
8 5.05 (21.37) 4 40 0.66
JL-QTL Total 162 5.90 (21.43) 66 605
Summary of JL-QTL and GWAS variants identified for 10 tocochromanol grain traits evaluated in the U.S. maize NAM population.aGWAS variants residing within JL-QTL support intervals for each trait that exhibited an RMIP of 0.05 or greater.
Novel Vitamin E Loci in Maize Grain 2377

Figure 2. Master Summaries for Selected Identified Genes.
Marker shapes correspond to trait class: circles, tocopherols; triangles, tocotrienols; squares, total tocochromanols, and diamonds, PC-8. Marker colorsindicate compound type: yellow, alpha (a); orange, delta (d); cyan, gamma (g); purple, PC-8; brown, summed traits (S). Gene names are as they appear inFigure 3. Left panels: Directional gene models are depicted as black arrows and the identified gene as a green arrow. Lines with trait names above gene
2378 The Plant Cell
steps for producing the aromatic head group of individual andtotal tocochromanols that accumulate in mature maize grain.Two other loci of relevance previously found to be weakly as-sociatedwith tocochromanol traits in amaize inbred associationpanel (Lipka et al., 2013), vte1 and one of seven prephenatedehydratases (GRMZM2G437912), were not detected in thisstudy. vte1 was present in multiple JL intervals in the same re-combination-suppressed pericentromeric region as hppd1, butsignals specific to vte1 could not be resolved due to long-rangeLD. Prephenate dehydratase association signalswere extremelyweak in the prior study (Lipka et al., 2013), and this gene was notdetected in NAM JL-GWAS.
The three remainingapriori genes identified in this studyencodethe core tocochromanol pathway enzymes, HGGT1, VTE4, andVTE3. HGGT1 is a prenyl transferase that condenses HGA andGGDP for the biosynthesis of all tocotrienols and had large PVEsfor tocotrienols and moderate PVEs for tocopherols (Figure 3),a result consistent with its kinetic preference for GGDP overphytyl-DP (Yang et al., 2011). hggt1 was a strong eQTL, i.e.,expressionQTL,meaning that the contribution of thisQTL to traitvariation is significantly associated with variation in expressionof the identified gene, through all developing kernel stagesanalyzed. This gene is strongly expressed in endosperm, themajor site of tocotrienol accumulation, and showed little to noexpression in other tissues, as also reported for the genes en-codingHGGT in riceandbarley (Hordeumvulgare) (Cahoonet al.,
2003). Consistent with this expression pattern, 83% of thetocochromanols in endosperm of 30 d after pollination (DAP)seed of NAM parents were tocotrienols, while only 2.5% weretocotrienols in embryos (Supplemental Data Set 9). Notably,HGGT was found to have the largest PVEs for three traits,;40% for gT3 and ST3 and 24% for dT3, suggesting that thislocus is indeed the key player for tocotrienol traits, with theexception of aT3. VTE4 catalyzes the final step in aT and aT3biosynthesis and had the largest PVE for these traits at 48.2%and 32.0%, respectively. This gene was an eQTL with partic-ularly strong correlations with aT allelic effects. These effectsspanned a range of 11.58 mg/g, suggesting that vte4 is key forincreasing vitamin E levels, a finding concordant with the largePVEs and clear GWAS results obtained for vte4 in this andprevious studies (Li et al., 2012; Lipka et al., 2013). The finalgene, vte3, encodes amethyltransferase at the branchpoint ford- and g-tocochromanols andwas the highest-PVE a priori QTLfor dT at 8.2%, with smaller PVEs for four other traits.
Novel Large-Effect Loci Control Total Tocopherol andVitamin E Accumulation
These eight identified a priori genes guided the application of ourapproach for gene-level resolution in the remaining 44QTL, whichdefinenovel loci affecting tocochromanol traits inmaizegrain. Likethe identified a priori genes, for a gene to be identified in these
Figure 2. (continued).
models indicate RMIP of significant GWAShits6 100 kb of the peak RMIP variant. Lines below genemodels indicate pairwise LD (r2) of eachGWASvariantwith thepeakRMIPvariant (darkblue line). Theblue ribbondepicts thehighest LD,per 200-bpwindow, to thepeakRMIPvariantwhile black ribbons indicatethe density of variants tested in GWAS in the 200-bpwindow (log2 scale). Darker colors correspond to higher values. Right panels: Correlations (r) betweenJL-QTL allelic effect estimates and expression of the identified gene across six developing kernel time points. Significant correlations are indicated by traitabbreviations above the respective time point. Traits with both JL andGWASassociations appear in black text to the right of the graph and have solid trendlines and symbols, while those with only JL associations are in gray with dashed trend lines and open symbols.
Figure 3. Percent PVE by a Priori and Novel Causal Genes Underlying JL-QTL.
aeQTL indicates significant correlations betweenexpression values and JL-QTL allelic effect estimates atmore than two timepoints for at least one trait.bBlue shading corresponds to range of PVEs for JL-QTL, with darker blue indicating higher PVEs. cColor coding indicates QTL predominantly affectsa trait class (having at least two-thirds of summed PVE).
Novel Vitamin E Loci in Maize Grain 2379

44 QTL intervals, it must meet at least two of three criteria: haveat least onesignificantGWASvariantwithin6100kbof thegene,at least two significant FPKM x JL allelic effect estimate cor-relations, andacompellingbiological function for involvement intocochromanol biosynthesis/accumulation. Applying thesecriteria to the 44 remaining QTL resulted in the identification ofsix genes not known to affect tocochromanol traits in any plantsystem that fall into three categories: metabolism, metabolitetransport/storage, and transcriptional regulation.
Both metabolic genes identified for QTL5 and QTL24 encodehomologs of protochlorophyllide reductase (POR), a highlyregulated step in chlorophyll biosynthesis (Figure 4C). Notably,por2 (QTL24) had thehighestPVEs in thepanel forgT, dT,ST, andSTT3 and por1 (QTL5) the second highest PVEs for gT and ST(Figure 3); together, they account for the largest allelic effectsobserved (well beyond those of a priori genes) for tocopheroltraits (Figure 3; Supplemental Figure 6). The twopor loci were themost robust eQTL in this study and had the largest epistatic
interactions (Figure 5), contributing2.2 to 4.0%additional PVE tothe four tocopherol traits.The strong and specific association of two chlorophyll bio-
synthetic geneswith tocopherolswasunexpected for amonocotseed like maize that lacks obvious green coloration during de-velopment and is chlorophyll-deficient at physiological maturity(i.e., in dry grain). To assess whether, despite the lack of greencoloration in developing grain, chlorophylls might still be pres-ent, we dissected embryos and endosperm from the NAMparents at 16, 20, 24, 30, and 36 DAP to quantify the levels oftocochromanols and four major classes of chlorophyll metab-olites: chlorophylls a andb, chlorophyllides a andb, pheophytinsa and b, and pheophorbides a and b (Supplemental Data Set 9).Embryo tocochromanols are composed of >90% tocopherols,whose absolute levels reflect the extreme diversity of NAMparents, varying by 10- to 100-fold at each developmental stage(Supplemental Figure 7). Surprisingly, developing embryos alsocontain extremely low, but detectable, levels of chlorophylls
Figure 4. Chlorophyll Metabolism in Relation to Phytol Generation and Tocopherol Biosynthesis in Developing Maize Embryos and Endosperm.
(A) Correlation of chlorophyll metabolites and total tocopherol concentrations (pmol g21).(B) Compound concentration means (log scale) of NAM parents.(C)Overview of chlorophyll biosynthesis and degradation and phytol generation inmaize embryos and endospermwith the protochlorophyllide reductaseexpressionQTL indicated in red. Compoundsmeasured are in bold black text with the four detectable chlorophyll metabolites in embryos (only chlorophyllawas measurable in endosperm) highlighted in boxes colored as in (A) and (B). Other relevant compounds are in gray and relevant enzymes in black bolditalics. Arrow widths represent mean gene expression (FPKM) across embryo development in B73. The black dashed arrows show the proposed route forgenerating phytol for tocopherol biosynthesis in maize embryos from chlorophyll biosynthetic intermediates, instead of by chlorophyll degradation.Compound abbreviations: ƩT, total tocopherols = aT+dT+gT; Chlide: chlorophyllide; Chl, chlorophyll; Pheo, pheophytin; Protochlide, protochlorophyllide;Phytyl-DP, phytyl diphosphate; GGDP, geranylgeranyl diphosphate.
2380 The Plant Cell

a and b, chlorophyllide a, and pheophytin a (Figure 4B), whilethe other four chlorophyll metabolites assessed were belowdetection in all samples. Though detectable, total chlorophyllmetabolite levels are;500 times lower in embryos than in leaves(Ma et al., 2008), and 100- to 1000-fold lower than embryo toco-pherols (Figure 4B). The correlation of total tocopherols withchlorophyll a, chlorophyll b, and chlorophyllide a was strong at16 DAP (r = 0.71–0.76); chlorophyll a correlations with total to-copherols peaked at r=0.93 at 20DAP, andwith the exception of30 DAP remained above r = 0.7. Correlations with chlorophyllidea and chlorophyll b with total tocopherols gradually decreasedto r = 0.48 and r = 0.36, respectively, at 30 DAP, after whichchlorophyll b correlation increased. Pheophytin a is a key in-termediate and metabolite marker for the chlorophyll degradationpathway in senescing leaves (Schelbert et al., 2009; HörtensteinerandKräutler, 2011;Hörtensteiner, 2013),where it providesphytol forsenescence-associated tocopherol biosynthesis (Schelbert et al.,2009; Zhang et al., 2014; Vom Dorp et al., 2015), but pheophytina only showedweak correlationswith total tocopherols at 16 and20 DAP (r = 0.23 and 0.31, respectively) and was negatively
correlated at later developmental stages. Tocopherols accu-mulated in endosperm to levels <2% that in embryos, and en-dosperm chlorophyll metabolite levels were similarly reduced,with only chlorophyll a being consistently above the limits ofdetection (Supplemental Data Set 9; Figure 4B). Nonetheless,correlations of chlorophyll awith total tocopherols in endospermranged from r = 0.50 to 0.74 at three stages of development(Figure 4A).A second group of novel genes has predicted roles in the
transport and storage of lipophilic molecules. The identified geneinQTL10, affecting five traits, is oneof 12genes inmaize encodingplastid-localized fibrillins, structural proteins that bind hydro-phobic molecules and play various roles in their biosynthesis andaccumulation in other systems (Deruère et al., 1994; Kim et al.,2015). Fibrillins are prominent components of plastoglobules(Ytterberg et al., 2006; Bréhélin et al., 2007), subcompartments ofthe chloroplast that also contain tocochromanols, carotenoids,lipids, and various biosynthetic enzymes including tocopherolcyclase.Thegeneticassociationofafibrillingene familymemberwithtocochromanol content is thus consistent with prior biochemical
Figure 5. Genome-Wide Distribution of Tocochromanol JL-QTL and Their Pairwise Epistatic Interactions.
From the outermost ring to the center: Black arcs show chromosomes labeled in 20-Mb increments, with small open circles marking centromeres. Genenames are as they appear in Figure 3 and are adjacent to purple and green capsules that indicate a priori and novel gene classes, respectively. Radial, lightblue lines show the positions of peak markers for the 162 individual-trait QTL. Lines linking markers show significant epistatic (additive 3 additive) in-teractions, with line thickness proportional to phenotypic variance explained by the interaction term (which range from 0.3% to 4.0%). Links are colored bytrait class for the interaction: yellow, tocopherols (T); orange, tocotrienols (T3); black, total tocochromanols (STT3).
Novel Vitamin E Loci in Maize Grain 2381

knowledge that other members of the fibrillin family bind hy-drophobic metabolites (e.g., carotenoids). QTL30 also affectedmultiple traits, and its identified gene encodes a cytosolicglycol(neutral)lipid transfer protein that could participate in thetransport of tocochromanols to oil bodies for storage. Finally,QTL6 only affectsaT3, and its underlying gene encodes a type ofSNARE protein predicted to be plastid-targeted and whosefunction is consistent with a role in vesicular transport. Of thesethree genes, only QTL10 was an eQTL. The final gene identified,in QTL39, was an eQTL that affected aT3 and encodes a pre-dicted transcription factor with plant homeodomain zinc fingerdomains.
DISCUSSION
This study, a comprehensive assessment of natural variation invitaminE levels inmaize grain, provides important insights into thecontrol of tocochromanol content and composition in a globalstaple crop, with major implications for human nutrition. In total,52 unique QTL were identified with PVEs as large as 48.2%. Weresolved 14 QTL to the gene level using an approach integratingJL-QTL effect estimates, localization of GWAS signals, and RNA-seq data from six stages of developing kernels for the NAM pa-rental genotypes. Only two of the 14 genes identified in this studyhad been previously associated with natural variation for toco-chromanols inmaizegrain (Li et al., 2012; Lipka et al., 2013). These14 genes included seven of the nine intervals with largest PVEs(Figure 3; Supplemental Table 2) and in an additive model ex-plained 56 to 93%of phenotypic variation attributed toQTL for thetraitsanalyzed in thisstudy (Supplemental Figure8). Thisdegreeofgene-level resolution of JL-GWAS signals was much greater thanin earlier NAM studies (Buckler et al., 2009; Brown et al., 2011;Kumpet al., 2011; Poland et al., 2011; Tian et al., 2011;Cook et al.,2012; Peiffer et al., 2014; Wallace et al., 2014; Yan et al., 2015;Zhang et al., 2015) due to three main factors: clear molecularevidence of functional involvement through the incorporation ofRNA-seq data, increased marker density provided by the addi-tional 27.4 million HapMap v2 variants, and the tractable geneticarchitecture of tocochromanol traits (oligogenic and highly heri-table). Eight of the 14 identified genes were on a list of 81 a priorimaize candidate genes generated based on prior elucidation ofprecursor and core tocochromanol pathways, primarily in Arabi-dopsis, while the remaining six encode functions not previouslydemonstrated to affect tocochromanols in any plant species de-spite over two decades of molecular genetic studies (Shintani andDellaPenna, 1998; Savidge et al., 2002; Cahoon et al., 2003; Chenget al., 2003; Sattler et al., 2004; Valentin et al., 2006; DellaPennaandMène-Saffrané, 2011). With the exception of HGGT, which is onlypresent in the monocot lineage, and the plant homeodomaintranscription factor, all other genes identified in this study haveclear homologs inmajormonocot and dicot crop species, providingclear targets to assess in other crops for potential association withdesired tocochromanol traits.
Inmost cases, the eight a priori genes affected tocochromanoltraits in ways consistent with the known biochemical activities oftheir encoded enzymes (Shintani andDellaPenna, 1998; Cahoonet al., 2003; Cheng et al., 2003; Collakova andDellaPenna, 2003;
Van Eenennaam et al., 2003; Karunanandaa et al., 2005; Kumaret al., 2005; Tang et al., 2006; Hunter and Cahoon, 2007;DellaPenna and Mène-Saffrané, 2011). For example, the twopathway methyltransferases, vte3 and vte4 (Shintani andDellaPenna, 1998; Cheng et al., 2003; Van Eenennaam et al.,2003), were key for determining the degree ofmethylation, andhence, the types of tocochromanols accumulated (i.e.,a, g, or d),but had no impact on total tocochromanol levels. Similarly, thearomatic head group for all tocochromanols, HGA, is producedbyhppd1 (Norris et al., 1998;Rippert et al., 2004;DellaPennaandMène-Saffrané, 2011), which affected nearly every tocochro-manol trait, though with larger contributions for tocotrienols. Asa group, the eight a priori genes also highlight major differencesin the genetic control of tocopherol versus tocotrienol traits inmaize grain, particularly in the generation and coupling of theirprenyl tail groups toHGA.A single gene for the first and regulatedstep of the plastidic IPP pathway, dxs2, was strongly andspecifically associated with tocotrienol traits, but neither it norany other IPP pathway gene was associated with tocopheroltraits. HGGT, the committed enzyme for tocotrienol biosynthesis,showed extremely strong tocotrienol associations and limitedassociations with tocopherol traits, a result consistent with itsoverexpression conferring high levels of tocotrienol productionin numerous plant tissues and systems (Cahoon et al., 2003;DellaPenna and Mène-Saffrané, 2011; Zhang et al., 2013;Tanaka et al., 2015) and with the enzyme preferentially con-densing HGA with GGDP (Yang et al., 2011). In contrast, thecorresponding enzyme that condenses HGA with phytyl-DPfor tocopherol biosynthesis, homogentisate phytyltransferase(HPT), lacked association with tocopherol traits. This was un-expected as like hggt overexpression, hpt overexpression in-creases total tocopherol content in a number of dicot plantsystems and tissues (Savidge et al., 2002; Collakova andDellaPenna, 2003; Karunanandaa et al., 2005; Lu et al., 2013).While the genetic control of total tocotrienol content in maizegrain is relatively simple, with three, large-effect a priori genes(dxs2, hppd1, and hggt1) collectively accounting for 81% oftrait variation, a priori genes account for only 8% of variation intotal tocopherol content. Instead, the trait is controlled primarilyby novel loci (Supplemental Figure 8), indicating that in maizegrain and likely other monocot seed, a fundamentally differentprocess regulates biosynthetic flux to total tocopherols.Key insight into the regulation of tocopherol biosynthesis in
maize grain comes from our finding that twomajor determinantsof tocopherol natural variation in maize grain are homologsencoding POR, which carries out a key reaction in chlorophyllbiosynthesis. The two identifiedpor genes accounted for 46%oftotal tocopherol variation attributed to QTL in an additive model(Supplemental Figure 8), the largest PVEs for dT, gT, andST, anda substantial pairwise epistatic effect that is roughly one-thirdthe dynamic range of their additive effects. The key role ofprotochlorophyllide reductases in tocopherol biosynthesis inmaize grain was especially surprising given that this tissue, likemost monocot seed, is nonphotosynthetic and lacks any ob-vious green coloration.Our identification of two chlorophyll biosynthetic genes (por
homologs) as major determinants of tocopherol content inmaize grain and supporting metabolite and expression data in
2382 The Plant Cell

developing embryo are consistent with chlorophyll degra-dation playing a minor role at best in tocopherol biosynthesisin nonphotosynthetic tissues likemaize grain. First, of the fourchlorophyll metabolites detectable in developing embryos,pheophytin a, a committed intermediate and metabolic markerfor chlorophyll degradation, had the lowest correlation with totaltocopherol levels (Figure 4A), opposite of what would be ex-pected if chlorophyll degradation provided themajority of phytolfor tocopherol biosynthesis. Instead, chlorophylls a and b andchlorophyllide a, late-stage intermediates in chlorophyll bio-synthesis, were strongly and positively correlated with totaltocopherol levels throughout embryo development. Addition-ally, in developing maize embryos (i.e., 30 DAP), the chlorophyll:tocopherolmolar ratio is;1:800, andasonly a singlemolecule ofphytol is released for each chlorophyll degraded, degradationwould only provide a trace of the phytol needed for tocopherolbiosynthesis, unless massive flux to degradation occurs. Whilewe cannot eliminate this possibility, it seems unlikely, as ex-pression of chlorophyll biosynthetic enzymes prior to POR isextremely low (e.g., 0.1–1% that in leaves; Supplemental DataSet 10) and consistent with the low levels of chlorophyll me-tabolites in developing embryos (;0.3%of leaf levels;Ma et al.,2008). In contrast, the two enzymes downstream of POR,chlorophyll synthase (which esterifiesGGDP to chlorophyllidesa and b) and geranylgeranyl reductase (which reduces thegeranylgeranylated intermediates to chlorophylls a and b) arethe most highly expressed steps of the pathway in embryos(e.g., 9–18% that in leaves; Supplemental Data Set 10). Thissuggests that their reactions are strongly favored, which isconsistent with chlorophyll a levels being 10- to 100-fold higherthan those of other chlorophyll metabolites. Taken together,these findings suggest that aspects of chlorophyll biosynthesis,likely a cycle involving repeated removal of phytol from chlorophylla followed by efficient reesterification of the resulting chlorophyllideswith GGDP and reduction of the geranylgeranylated inter-mediates to (“phytyl”)-chlorophylls, generate the large amountsof phytol needed for tocopherol biosynthesis in maize embryos(Figure 4C).
Unlike maize grain, developing Arabidopsis seed are green,photosynthetic, and contain high levels of tocopherol at a 2- to4-fold molar excess to chlorophylls (Zhang et al., 2014), while inunstressed leaves, tocopherol levels are much lower andchlorophyll is oftenat 20- to50-foldmolar excess to tocopherols(Collakova and DellaPenna, 2003). As each mole of chlorophyllcontains one mole of esterified phytol, bulk chlorophyll deg-radation has long been proposed as the source of phytol fortocopherol biosynthesis in such green, photosynthetic tissues(Rise et al., 1989; Chrost et al., 1999; Valentin et al., 2006). Thechlorophyll degradation pathway has recently been elucidatedinArabidopsis (Schelbert et al., 2009;Hörtensteiner andKräutler,2011; Hörtensteiner, 2013) (Figure 4C), and the phytol releasedfrom pheophytin a by pheophytinase could be esterified to fattyacids to yield fatty acid phytyl esters or phosphorylated by VTE5and VTE6 to yield phytyl-DP (Valentin et al., 2006; Tanaka et al.,2010; DellaPennaandMène-Saffrané, 2011; Lippold et al., 2012;Zhang et al., 2014; Vom Dorp et al., 2015) (Figure 4C). Thislatter route clearly provides phytyl-DP for the large amounts oftocopherol synthesized by senescing Arabidopsis leaves, as
mutation of the pheophytinase gene eliminates both chlorophylldegradation and the senescence-associated increases in to-copherol and fatty acid phytyl ester levels (Schelbert et al.,2009; Zhang et al., 2014; Vom Dorp et al., 2015). If flux throughthis chlorophyll degradation pathway provided the majority ofphytol for tocopherol biosynthesis in other tissues and leafdevelopment stages, one would expect a similarly severe im-pact on tocopherol levels in these tissues. However, in non-senescing leaves and mature seed, tocopherol content in thepheophytinase mutant was unchanged (Zhang et al., 2014).Chlorophyllases can also remove phytol from chlorophyll a andhavebeenproposed as an alternate route for generating phytol,but mutations disrupting the two Arabidopsis chlorophyllases,singly or in combination with the pheophytinase mutant, againhad no effect on seed tocopherol levels (Zhang et al., 2014).These combined data indicate that though phytol is released bychlorophyll degradation late in Arabidopsis seed maturation,this phytol contributes little to tocopherol biosynthesis in de-veloping seed, and instead phytol for tocopherol biosynthesisin seed and nonsenescing leaves of Arabidopsis is providedfrom another source. Tocopherol biosynthesis from this al-ternative source of phytol is still dependent on VTE5 (phytolkinase activity), as in vte5 mutants, tocopherol levels are re-duced by 80% and leaf tocopherol contents by 65% (Valentinet al., 2006). We suggest that like maize grain, Arabidopsisoperates a chlorophyll-based cycle for generating phytol fortocopherol biosynthesis in most tissues and developmentalstages that is separate from the bulk chlorophyll pool.In addition to the por loci, the other novel genes identified in
this study provide important insights into the accumulation oftocochromanols in plants, but especially for tocopherols, whichhave higher vitamin E activities than tocotrienols (Kamal-Eldinand Appelqvist, 1996; DellaPenna and Mène-Saffrané, 2011).For example, we identified proteins with transport and storagefunctions that areassociatedwith tocochromanols at thegeneticlevel. Three of the novel loci encode such functions, includingtwo, a fibrillin and a lipid transfer protein, affecting multipletocopherol and tocotrienol traits. Fibrillins are encoded bymoderate-sized gene families, with individual members havingdiverse functions ranging from storage of xanthophylls in fruitand flower chromoplasts to interaction with enzymes involvedin plastoquinone biosynthesis (Deruère et al., 1994; Singh andMcNellis, 2011; Kim et al., 2015). Tocopherolswere reported asminor constituents of fibrillins isolated from red bell pepper(Capsicum annuum) fruit (Deruère et al., 1994), and severalmembers localize to plastoglobuli along with various lipid-solublecompounds and enzymes, including tocopherol cyclase (Ytterberget al., 2006; Bréhélin et al., 2007). The association of multipletocochromanol traits with a single member of the maize fibrillinfamily (GRMZM2G031028) suggests that the encoded proteinspecializes in tocochromanol storage in grain. Finally, lipidtransferproteinsareencodedby largegene families inplants andhave likewise been implicated in the movement of variouslipophilic compounds between membranes. Here, we showthat GRMZM2G060870 is a lipid transfer protein implicated inthe transport of tocochromanols. Overexpression and knock-out studies of a priori genes in other systems have yieldedimportant insight into their roles in tocochromanol biosynthesis
Novel Vitamin E Loci in Maize Grain 2383
(DellaPenna and Mène-Saffrané, 2011). Analogous experi-ments with the six novel genes identified in this study wouldprovide additional insights into their roles and functions.
Allelic variation at the 14 genes identified in this study, re-sponsible for 56 to 93% of phenotypic variation attributed to QTLfor tocochromanols in maize grain, establishes a near-completefoundation for the genetic improvement of vitamin E and non-vitamin E tocochromanol levels in thismajor food crop and likely inseed of the other major cereals, which are also nongreen, non-photosynthetic tissues that synthesize tocochromanols. Thata moderate number of genes exerts large control over headgroupand tail biosynthesis and the core tocochromanol pathway itselfholds great promise for both breeding and engineering oftocochromanols in staple crops. Because tocopherols andtocotrienols are largely under independent genetic control byseven major-effect loci, genomics-assisted breeding approachescan target total tocotrienols (hggt1, hppd1, and dxs2), total toco-pherols (two por homologs), or vitamin E content (vte3 and vte4),separately or in combinatorial fashion. It remains an open questionwhether the levels of other vitamins and essential nutrients inmajor crop species are under similarly tractable control. If true,this would greatly accelerate global efforts to simultaneouslyenhance and balance the levels of multiple essential micro-nutrients in staple crops to benefit human health.
METHODS
Field Environments and Plant Materials for Genetic Mapping
The genetic and genomic approaches used to design and construct themaize (Zea mays) NAM population have been previously described (Yuet al., 2008; Buckler et al., 2009; McMullen et al., 2009). In brief, 25 familiesof 200 RILs per family were generated by crossingmaize inbred line B73 ina reference design to 25 other diverse inbred lines. These 25NAM families,the intermated B73 3 Mo17 (IBM) family (Lee et al., 2002), and an asso-ciation mapping panel of 281 diverse inbred lines (Flint-Garcia et al., 2005)were evaluated at the Purdue University Agronomy Center for Researchand Education in West Lafayette, IN, under standard agronomic practicesin the summers of 2009 and 2010. The experimental field design has beenpreviouslydescribed (Chandler et al., 2013). Inbrief, asetsdesignwasusedin each of the two environments, with each set including all lines of a familyor the association panel. Each family set was arranged in a 10 3 20 in-complete block a-lattice design, and each incomplete block was aug-mented by the addition of both parental lines as checks. The associationpanel had a 14 3 20 incomplete block a-lattice design, with each in-complete block augmented by the inclusion of maize inbred lines B73 andMo17 as checks. A single replicate of the entire experiment of 5481 linesfrom the NAM and IBM families as well as the 281-member associationpanel plus repeated check lines was grown in each environment. An ex-perimental unit consisted of a single line planted in a one-row plot that was3.05min length,withanaverageof10plantsperplot. Inbothenvironments,a minimum of four plants within a plot was self-pollinated by hand. Self-pollinatedearswereharvestedatphysiologicalmaturity anddried toagrainmoisture content of;15%. Afterwards, the ears of each plot were shelledand bulked to generate a representative, composite grain sample forquantifying tocochromanol levels.
Phenotypic Data Analysis
Tocochromanols were extracted from ;50 ground kernels for eachplot and quantified by HPLC and fluorometry as previously described
(Lipka et al., 2013). We assessed three types of tocochromanolsbased on HPLC data passing internal quality control measures thatwere collected on 10,306 grain samples from 4862 NAM and 198 IBMRILs, as well as the repeated parental check lines. The 10 evaluatedtocopherol, tocotrienol, and plastochromanol phenotypes were asfollows: a-tocopherol (aT), d-tocopherol (dT), g-tocopherol (gT),a-tocotrienol (aT3), d-tocotrienol (dT3), g-tocotrienol (gT3), total to-copherols (aT + dT + gT), total tocotrienols (aT3 + dT3 + gT3), totaltocochromanols (total tocopherols + total tocotrienols), and PC-8in mg g21 seed. When the level of a tocochromanol compound for agrain sample was below the minimum detection limit of HPLC, a mg g21
value was approximated for the sample by assigning a uniform randomvariable ranging from 0 to the minimum HPLC detection value for thatgiven compoundwithin a family for each environment. The IBMRILswerenot included in the JL analysis andGWASof the 10 tocochromanol traits,as they were produced through intermating and thus exhibit a differentialrecombination rate relative to NAM RILs. However, the IBM family wasstill included in the following mixed linear model analysis along with the25 NAM families to provide additional information on genotype-by-environment variation and within-environment spatial variation.
To screen the 10 traits for phenotypic outliers, we initially performedmixed linear model selection with custom Java code invoking ASReml-Wversion 3.0 (Gilmour et al., 2009) for each trait that followed the same stepsof the two-stage model fitting process previously described (Peiffer et al.,2014). In brief, in the first stage, mixed linear models separately fit for eachof the two environments included a fixed effect for the grand mean andrandom effects including the genotypic effects of family and RIL withinfamily, a laboratory effect for HPLC autosampler plate, and spatial effectsfor field, set within field, and block within set within field. Genetic, HPLCplate, and spatial effects were not confounded because the repeatedparental check lines were considered to be from the association panel.Thus, the experimental design allowed for the estimation of genetic effectsseparate from the laboratory and spatial effects. A first-order autoregressive(AR1 3 AR1) correlation structure was also fitted to account for spatialvariation in the direction of rows and columns among plots within eachenvironment. For each environment, a backward elimination procedurebased on the likelihood ratio test (Littell et al., 2006) was conducted toremove nongenetic random effects and AR1 3 AR1 error structures fromthe model that were not significant (a = 0.05).
In the second stage, a single mixed linear model across both envi-ronments was fitted that included and nested the significant laboratoryand spatial effects from the individual first stage models. Additionalrandom effects entering the multienvironment model included environ-ment, the interaction between family and environment, and the in-teraction between RIL within family and environment. Additionally, thesignificant AR1 3 AR1 error structures within each environment wereincluded in themodel. From the final fitted model for each trait, influentialphenotypic outliersweredetectedusing theDFFITScriterion (Neter et al.,1996; Belsley et al., 2005), and observations were deleted if they ex-ceeded a conservative DFFITS threshold previously suggested for thisexperimental design of 23 23
ffiffiffiffip9n
qwhere p9 is model degrees of freedom
(df) + 1 and n the sample size (Hung et al., 2012) (Supplemental Data Sets2 and 11 and Supplemental File 1).
Once influential outliers were removed, the two-stage model fittingprocess was conducted again with minor modifications to estimatea BLUE for each RIL across environments. In this implementation, thegenotypic effects of family and RIL within family were fitted as fixedeffects. Additionally, unique error varianceswere not separatelymodeledfor each environment when fitting the interaction between family andenvironment and between RIL within family and environment. To obtainvariance component estimates, all terms except for the grandmeanwerethen fitted as random effects. These variance components were used toestimate heritability on a line-mean basis ðh2l Þ across only the 25 NAM
2384 The Plant Cell

families (Hung et al., 2012), and the standard errors of these estimateswere approximated using the delta method (Holland et al., 2003).
Prior to conducting JL mapping of QTL in the NAM population, theBLUEs of each trait were screened to detect any remaining statisticaloutliers using PROC MIXED in SAS version 9.3 (SAS Institute). Specifi-cally, the Studentized deleted residuals (Kutner et al., 2004) were ex-amined, which were obtained from a parsimonious linear model fittedwith fixed effects for the grand mean and a single randomly sampled,representative SNP marker (PZA02014.3) from the NAM genetic linkagemap of 1106 SNPmarkers (McMullen et al., 2009). For each trait, a BLUEof each RIL was considered an outlier and removed if it generatedaStudentizeddeleted residual,withn –p –1df, that hadanabsolute valuegreater than the Bonferroni critical value of t(1 – a/2n; n – p – 1), wheret denotes the t-distribution, a the significance level of 0.05, n the samplesize of 5460 RILs, and p the number of predictor variables (SupplementalData Sets 2 and 11, Supplemental Figure 9, and Supplemental File 2).Finally, for the trait dT3, a single RIL was removed that was seen to exertunduly high leverage within the trait JL model, particularly upon the in-clusion of interaction terms in epistasis analyses. The observed inflationof allelic effect estimates and PVEs was most severe for a JL peakmarker with low alternate allele frequency, as has been previously ob-served (Rao and Province, 2016).
Next, for each trait, the Box-Cox power transformation (Box andCox, 1964) was performed on BLUEs with the aforementioned parsi-monious model to identify the most appropriate transformation thatcorrected for unequal variances and non-normality of error terms. Thisprocess was conducted using PROC TRANSREG in SAS version 9.3(SAS Institute) and tested lambda values ranging from 22 to +2 inincrements of 0.05 before applying the optimal lambda for each trait. Ofthe 10 traits, six had a variable number of RILs (range: 3–258) witha BLUE of negative value. Negative values were a product of the shift inlocation (mean) and scale (SD) of the metabolite trait distributions thattakes place in the generation of BLUEs (Burkschat, 2009). A constant ofthe lowest possible integer needed to make all values positive—a re-quirement of the Box-Cox power transformation—was added to theBLUEs for a given trait before conducting the transformation pro-cedure. The constants and Box-Cox lambda values applied for eachtrait are provided in Supplemental Table 3.
JL Analysis
A consensus genetic linkagemap comprising 14,772markers and derivedacross the 25 NAM families was used for JL analysis. The map wasconstructed by scoring 4892 available NAM RILs with a genotyping-by-sequencingprotocol (Elshire et al., 2011;Glaubitz et al., 2014) and imputingSNP markers at evenly spaced 0.1-cM intervals following a previouslydescribed procedure (Ogut et al., 2015). Using this consensus map,a previously described JL analysis procedure (Buckler et al., 2009) wasconducted across the 25 families of the NAM population to identify anddefine positions of QTL controlling phenotypic variability of the 10 to-cochromanol traits. In brief, a joint stepwise regression procedure wasimplemented using modified source code in TASSEL version 3.0 (pro-vided on Github), in which transformed tocochromanol trait BLUEs werethe response variable, the family main effect forced into the model firstwas an explanatory variable, and each of the 14,772 possible markereffects nested within family terms considered for inclusion into the finalmodel were explanatory variables. The model entry or exit selectioncriterion of marker-by-family effects was based on a permutation pro-cedure, where the transformed BLUEs of each tocochromanol trait werepermuted 1000 times and the entry P value thresholds (from a partialF-test) were chosen to control the type I error rate at a = 0.05. Thesethresholds are listed in Supplemental Table 3. To prevent the simulta-neous entry andexit of an effect in the samestep, exit thresholdswere setequal to twice the value of entry thresholds.
Given that strong linkage between these high-density genetic markerscould introduce extensive collinearity among marker genotypes, wedeveloped an additional model fitting approach to correct for multi-collinearity and more precisely determine QTL locations and effectestimates thereafter. For the three tocotrienol compounds, their sum,and total tocochromanols, at least one pair of peak JL markers (i.e., themarkers in the optimal model determined from stepwise model selec-tion) exhibited an absolute Pearson correlation coefficient (r) greaterthan 0.8 in their SNP genotype states, calculated using the “pearson”method within the ‘cor’ base function in R. In these cases, the markerwith smaller sum of squares within each pair in the corresponding JLmodel was removed. For each of the remaining peak markers in the JLmodel for that trait, a rescan procedure was then implemented to test ifany closely adjacent markers were more significantly associated withthe trait than the peak marker identified in stepwise model selection.Specifically, if a marker on either side was showing, after the multi-collinearity correction, a larger sum of squares than the original peakmarker, that adjacent marker would replace the original peak marker inthe model. This process was repeated until the peak marker underconsideration showed the highest sum of squares compared with bothof its neighbors, representing a localmaximum.All final peak JLmarkersfollowing rescan, along with the family term, were then refitted to obtaina final JLmodel for each trait. Allelic effect estimates of theseQTLwithineach family were generated by fitting final trait models using the ‘lm’
function within the lme4 package in R, which also tests the significanceof each effect within a family term in two-sided independent t tests. TheBenjamini-Hochberg procedure (Benjamini and Hochberg, 1995) wasused to control the false discovery rate at 0.05 when identifying po-tentially significant QTL effects.
For each joint QTL in the final models for all traits, a support interval(using P value threshold of 0.01) was calculated as previously described(Tian et al., 2011). Logarithm of the odds scores were calculated using the‘logLik’base function inR. ThePVEby each jointQTLwas calculated usingprevious methods (Li et al., 2011), with some modifications. This modifiedmethodaccounted forwithin-family variationof allele frequenciesby takinga weighted average of an allelic effect of a marker based on its allelefrequencywithineach family and thepopulation sizeof that family. Solely toassess the true magnitude and direction of QTL allelic effects both withinand across NAM families, allelic effect estimates were also generatedusing untransformedBLUEs, refitting the family termand final JLmarkersderived from the transformed BLUE model without further model se-lection or rescan.
GWAS
For each chromosome and each trait, residuals for conducting a GWASwereobtained from the final full JLmodelswith the family termandany jointQTL from that chromosome removed. The genotypic data set used toperform theGWAS in theNAMpopulation consistedof 28.9million variants(SNPs and short indels of 15 or fewer base pairs in length) contained inHapMap versions 1 and 2, aswell as;0.8million copy number variants, aspreviously described (Wallace et al., 2014). To conduct a GWAS for eachtrait, these 29.7 million segregating variants were projected onto the NAMRILsbasedon theirgenotypicdataand thedense0.1-cMresolution linkagemap. Using these projected variants, a forward selection regressionprocedure was repeated 100 times for each chromosome. This proceduresubsampled 80% of the RILs from each family without replacement; thisprocedure was run separately on chromosome-specific residuals usingthe NAM-GWAS plug-in in TASSEL version 4.1.32 (Bradbury et al., 2007)as previously described (Wallace et al., 2014). For each trait, the sig-nificance threshold for the entry of a marker in the model was empiricallydetermined using apermutation procedure run1000 times onchromosome-specific residuals. The results of permutations were then averaged acrosschromosomes (Wallace et al., 2014) to control the genome-wide type I error
Novel Vitamin E Loci in Maize Grain 2385

rate at (a = 0.05). The entry thresholds determined from permutationsand used in GWAS are provided in Supplemental Table 3. For each traitand marker, the RMIP value, defined as the proportion of 100 sub-samples in which a tested marker was included in the final, forwardselection-derived regression model, was calculated. Only markerswith an RMIP value of 0.05 or greater were further examined in tri-angulation analyses.
Growth Environments and Plant Materials for RNA-Seq
A total of three biological replications of the NAM founders were plantedon May 10 (rep 1), May 20 (rep 2), and June 1 (rep 3), 2011, at PurdueUniversity’s Agronomy Center for Research and Education in WestLafayette, IN, with;15 plants per plot. All plants in each plot were self-pollinated, and pollination dates were recorded. A single ear froma given plot was harvested at (each of) 12, 16, 20, 24, 30, and 36 DAP.Immediately after harvest, whole ears were frozen in liquid nitrogen. Theears were stored at 280°C until kernels could be removed from thestill-frozen ears, placed in test tubes, and maintained at 280°C.Kernels from each sample were packed in dry ice and shipped toMichigan State University, from which 30 kernels were randomlysampled and bulked across replicates. For the majority of samples,three biological replicates were available, and 10 seeds were takenfrom each. In a small number of instances, two or only one replicatewas available; in these cases, 15 and 30 seeds were taken from thereplicates, respectively.
For root and shoot tissues, seed from the NAM founders weresurface-sterilized and germinated onwet filter paper for 4 to 5 d undergrow lamps at room temperature. Next, three germinated seedlingswere transplanted to 18.93-liter containers with SureMix potting mix(Michigan Grower Products) and fertilized with 13 Hoagland solu-tion. Plants were grown in the greenhouse under long-day conditionsfor 14 d at 30 to 33°C at which time the plants were removed from potsand rinsed with water to remove the soil. Roots and shoots wereharvested separately, immediately frozen in liquid nitrogen, andstored at 280°C until RNA extraction. Equal weights of shoots orroots from the three individual plants were combined into a singlesample for RNA isolation.
RNA-Seq and Sample Quality Assessment
Frozen samples were ground to a fine powder in liquid nitrogen. Total RNAfrom100mgof frozenkernel, shoot, and root tissueswas isolatedusing thehot borate protocol (Wan andWilkins, 1994) except that aQiagen shreddercolumn was used to filter the lysate prior to the LiCl precipitation step. Toassess thequality andconcentrationofRNA, sampleswereanalyzedusinga NanoDrop (Thermo Fisher Scientific) and Bioanalyzer 2100 (AgilentTechnologies).mRNA-seq librarieswere constructed from total RNAusingthe Illumina RNASeq kit following the manufacturer’s instructions. Se-quencingwasperformedon the IlluminaGAIIx andHiSeq2000 instrumentsat the Michigan State University Research Technology Support Facility.Reads (50–55 nucleotides; 11–140 M reads per sample) were generatedand their quality evaluated using FastQC (http://www.bioinformatics.babraham.ac.uk/projects/fastqc/). A small number of libraries were se-quenced inpaired-endmode,butall downstreamanalyses treated readsassingle-end.
Identification of SNPs in RNA-Seq Data
ForSNPdetection,RNA-seq readswerecleaned forqualityusingCutadapt(v 1.4.1) (Martin, 2011). Specifically, Illumina adapter andprimer sequenceswere removed (using the –b option), as well as bases at the 39 end that hada quality score less than 20 and reads that were fewer than 30 bases inlength after cleaning. RNA-seq reads were then aligned to the maize B73
reference genome (AGPv2; http://ftp.maizesequence.org/) using TopHat(v1.4.1) (Langmead et al., 2009) and SAMTools (v0.1.12a) (Li et al., 2009).TopHat was run with a minimum and maximum intron size of five and60,000 bp, respectively. Indel detection was disabled, and only uniquealignments were reported using the -g option; all other options were set todefault. BAMTools (v 1.0.2) (Barnett et al., 2011) was used to calculatemapping result statistics. The BAM file for each sample was sorted byleftmost coordinates using the SAMTools sort function (v 0.1.12a) (Li et al.,2009). This file was then indexed using SAMTools index, and a pileup filegenerated using SAMTools pileup with options –Bcf. An unfiltered matrixfile wasmade and filtered to detect SNPs. SNPswere filtered according tothe following requirements: (1) five readsper individual; (2) for anallele to becalled within an individual, it had to be in 20% or more of the reads with atleast two reads supporting it; (3) be homozygous (monoallelic) in eachindividual; (4) support by two individuals for an allele to exist; and (5) thepositionhad tobepolymorphic (at least twoalleles) (Hirschetal., 2014). Theidentified SNPs, i.e., those passing all of these filters, were analyzed andclustered by genotype to identify any mislabeled samples. In addition,genetic distances between all samples were calculated as previouslydescribed and clustered with seedling transcriptome-derived SNPsidentified in the WiDiv 1.0 panel (Hirsch et al., 2014) to further confirmgenotype authenticity. All samples passing these quality control steps foran individual genotype were then merged using the SAMTools mergefunction, and the pipeline repeated from the sort and index step. A total of175 samples representing 21 root, 21 shoot, and 133 kernel samples (12,16, 20, 24, 30, and 36DAP) from 24 of the 26NAMparents passed qualityassessments and were used for SNP detection, and 172 of these wereused for triangulation analyses (Supplemental Table 1 and SupplementalData Set 8).
Gene Expression Analysis
RNA-seq reads were aligned to the maize B73 reference genome (AGPv2;http://ftp.maizesequence.org/) using TopHat (v 1.4.1) (Langmead et al.,2009) and SAMTools (v 0.1.12a) (Li et al., 2009); expression abundanceswere estimated using Cufflinks (v 1.3.0) (Trapnell et al., 2010) using theRefGen_v2 5b Filtered Gene Set (FGS) (http://ftp.maizesequence.org/release-5b/filtered-set/). When running TopHat, the minimum andmaximum intron length was set to 5 and 60,000 bp, respectively, andthe same maximum intron length was used for running Cufflinks.The –G and –b options were used when running Cufflinks; all otherparameters were left at default. Boundaries of gene models in theAGPv2 annotation were corrected for GRMZM2G012966 (lycopeneepsilon cyclase) and GRMZM2G084942 (arogenate dehydrogenase),both which were incorrectly fused with a flanking gene. GRMZM2G012966(lycopene epsilon cyclase) was split, resulting in a new locus labeled asGRMZM6G010010 (kinase-domain-containing protein). GRMZM2G084942(arogenate dehydrogenase) was split, resulting in a new locus labeled asGRMZM6G010020 (CBF1 interacting corepressor) and the fragmentsper kilobase exon model per million fragments mapped (FPKM) valuesrecalculated just for these modified loci. Expression data were reportedin FPKM values. A Pearson correlation coefficient (r) was calculated forall pairwise comparisons of all samples using FPKM data. Raw FPKMdata were input into R (version 3.1.0) and transformed into a data matrix.Correlations for all observations were calculated using the “pearson”method of the ‘cor’ base function in R. The calculated correlation co-efficients were then visualized for all pairwise comparisons using the‘heatmap.2’ function within the gplots package in R (SupplementalFigure 4).
FPKM Filtering
FPKM reads were annotated by gene not transcripts, mapping to a total of39,455 loci. The 5b FGS gene set was filtered such that at least one of the
2386 The Plant Cell

kernel developmental samples in at least one sampled founder line had anFPKM greater than 1.0; a total of 27,187 genes remained upon filteringwith this criterion. Expression data for genes passing the specifiedthreshold were transformed according to log2(FPKM + 1), where theconstant of 1 was added to allow the transformation of “0” values. Theselog2-transformed values are herein specified as “gene expression.”Within the filtered and transformed transcriptomic data set, early kernelsamples correlatedmore closely in expression abundanceswith root andshoot samples than with mid- to late-kernel samples (SupplementalFigure 4). The number of aligned 50- or 55-bp reads per sample, bothunique and multiple-mapping, had a median of 40 million reads (median86% of total reads) with SD of 16million reads (Supplemental Table 1 andSupplemental Data Set 8).
Triangulation Analysis
Genomic regions in which both JL and GWAS associations colocalizedwere further investigated using the following procedure. First, JL supportintervals from two or more individual-trait models that showed physicaloverlap were merged to form common support intervals. Supportintervals detected for a single trait, with no physical overlap within othertrait models, were also retained. For each final distinct support interval,Pearson correlationswere tested in all pairwise comparisons between (1)QTL effect estimates for that interval in individual-trait JL model(s); (2)genotype state of significant GWAS marker(s) in the interval for the re-spective trait(s); and (3) log2-transformed expression values of candidategene(s) directly hit by or within6100 kb of any of these significant GWASmarkers.Theuseof 100kb todefine thecandidategenesearch rangewasestablished through examination of LD decay and is further elaborated inthe results section.
To test for significance of the correlation between JL allelic effectestimates and expression values of each candidate gene proximal tosignificant GWAS markers, a multiple testing correction to control falsediscovery rate at 0.05 was imposed on P values of the correlationobtained for each gene. Namely, the Benjamini-Hochberg method(Benjamini and Hochberg, 1995) based on the total number of genesproximal to the GWAS marker (within 6 100 kb) was applied using theGAPIT package (Lipka et al., 2012) in R. For those correlations involvingone of the two traits with a negative optimal lambda for the Box-Coxtransformation (i.e., an inverse power transformation was applied for dTand dT3), the sign of the correlation was flipped in graphical and tabularrepresentations (Figure 2 and Supplemental Figure 5 for master genesummaries; Supplemental Figure 2 and Supplemental Table 6 forpleiotropy) to represent the true directionality of the relationship be-tween traits.
Epistasis
For each trait, all possible pairwise interactions (additive 3 additive)between markers comprising the final JL model were individually testedfor significance in a model containing all marker main (additive) effects.The P value threshold required for an interaction to enter the model wasdetermined by modeling 1000 null permutations of transformed traitBLUEswith only additive terms in themodel to approximate a type I errorrate at a = 0.05. Interaction effects passing this threshold were usedtogetherwith themain effects ofmarkers comprising the final JLmodel tofit the final epistatic model. Calculations of PVE were performed usingeffect estimates and allele frequencies within families as describedabove, except that pairwise genotype scores were collapsed into threeclasses for interaction terms due to insufficient degrees of freedom tomodel all possible genotype states in the two-locus case. Specifically,the two vectors of genotype state scores were multiplied to obtaincomposite scores of 21 (one locus is homozygous for reference alleleand the other for minor), 0 (at least one heterozygote, meaning the two
alleles are assumed to cancel any interaction), or 1 (both loci are ho-mozygous for reference, or both for minor). Interactions were graphicallydepicted using the Circos software package (Krzywinski et al., 2009)(Figure 5).
Pleiotropy
Pleiotropy, or shared genetic basis, was assessed between pairs oftraits as previously described (Buckler et al., 2009), by applying the JLQTL model for each trait to every other trait. Pearson correlationsbetween allelic effect estimates derived from the final JL model fora trait itself and themodel applied from every other trait were evaluatedfor significance at a = 0.01, which with 23 df means a cutoff of |r| >0.504. The sharedness, or percentage of shared QTL, between twotraits was calculated as the sum of the percentage of significantcorrelations when the trait 1 model was applied to trait 2 and thepercentage when vice versa. Connections among QTL showingsharedness were visualized using the networkR package (Butts, 2008,2015) (Supplemental Figure 2).
Pleiotropy was also examined within common support intervals tovalidate the merging of individual-trait intervals, a step conducted inprevious NAM JL analyses (Tian et al., 2011). In contrast to the above-described pleiotropy analysis, this QTL-level analysis fit the single peak JLmarkerwithin the common interval for each trait to every other trait that hada peak JL marker in the interval.
LD Analysis
For each marker showing an RMIP of 0.05 or higher for one or moretraits in GWAS, pairwise LD with all other markers within 61 Mb wasestimated through custom Python and R scripts using squared allele-frequency correlations (r2) as previously described (Weir, 1996). A nulldistribution for LD was generated by performing the same estimationfor 50,000 markers selected at random. The same imputed genotypicdata set of 29.7 million segregating markers used in JL-GWAS wasused to estimate LD.
Standardized Effect Sizes
To more fully compare JL results across traits, effect sizes of JL peakmarkers were standardized and visualized in relation to the allele fre-quencies at these markers (Supplemental Figure 6). Given that 12 was thesmallest number of QTL detected for a tocochromanol trait aside fromPC-8, an outlier in both JLmodel size (eight QTL) and line-mean heritability(lowest by4-fold), JLwas rerunconstraining thenumberofmarkersper traitto 12 using transformed BLUEs. Allelic effect estimates were obtained bysubsequently refitting these 12-QTL models with untransformed BLUEsand scaled by multiplying by the total heritable variance for each trait(Brown et al., 2011). Total heritable variance was estimated on a by-traitbasis, as the line-mean heritability in NAM divided by the SD of un-transformed trait BLUEs in the Goodman-Buckler inbred diversity panel(Lipka et al., 2013). Allele frequencies were derived based on foundersexhibiting NAM JL allelic effect estimates significantly different from thoseof B73, using estimates from transformed BLUEs given the involvement ofstatistical inference.
Preparation and Identification of Standards for Chlorophylls andTheir Derivatives
Chlorophylls a and b were isolated from fresh spinach (Spinacia oleracea)leaves as previously described (Canjura and Schwartz, 1991). Chlor-ophyllideswere prepared by grinding fresh spinach leaves in 80%acetonewith 20% 40 mM sodium citrate, pH 8, and incubating overnight at roomtemperature in darkness (Holden, 1961). After centrifuging to pellet debris,
Novel Vitamin E Loci in Maize Grain 2387

the supernatant was extracted twice with diethyl ether. The diethyl etherextracts were pooled, dried over anhydrous sodium sulfate, evaporated,and dissolved in 80:20 methanol:acetone. Pheophytins a and b andpheophorbides a and b were prepared by acidification of their corre-sponding purified chlorophylls and chlorophyllides, respectively, as de-scribed (Schwartz et al., 1981; Canjura and Schwartz, 1991). Eachcompound was isolated by semipreparative HPLC using a ShimadzuProminence HPLC and 5 mm Spherisorb ODS-2 column (250 3 4.6 mm)(Orochem Technologies). Pigments were eluted using a linear gradient at1 mL/min in which Solvent A was 80%methanol in acetone and Solvent Bwas 80%methanol in 1M ammonium acetate. The gradient used was 0 to100% solvent A for 15 min, hold solvent A at 100% for 15 min, and thenreturn to solvent B and reequilibrate for 7 min. Individual compounds wereidentified and quantified by a combination of their retention and spectralcharacteristics (Camara, 1985; Lichtenthaler, 1987; Zapata et al., 1987;Milenkovic et al., 2012).
Extraction and Analysis of Chlorophylls and Derivatives
Embryos and endosperm from each NAM parent were dissected fromfrozen kernels on a metal plate on dry ice to ensure all tissues remainedfrozen. Embryo and endosperm tissues were ground in liquid nitrogenand 50 to 60 mg tissue was extracted with 600 mL 10% (v/v) 0.2 M Tris-HCl, pH 8.0, in acetone precooled to 220°C (Schelbert et al., 2009;Christ et al., 2012) that contained 1 mg/mL butylated hydroxytoluene,1 mg/mL bixin, and 1 mg/mL DL-a-tocopherol acetate as internal re-covery controls. Three 3-mm glass beads were added and extractionwas done for 5 min by shaking using a commercial paint shaker (HERO).Samples were centrifuged for 5 min at 13,000 RPM in a microfuge, andthe supernatant was transferred to a new tube. Three hundred micro-liters of HPLC-grade water and 500 mL of diethyl ether were added,vortexed, and centrifuged at 13,000 RPM for 2 min to allow for phaseseparation. The upper (diethyl ether) fraction was transferred to a newmicrocentrifuge tube, evaporated, and dissolved in 200 mL 100% ac-etone, which was divided into two aliquots and evaporated. One aliquotwas dissolved in 100 mL of 3:1 (v/v) methanol:methyl tert-butyl ether foranalyses of tocochromanols as previously described (Lipka et al., 2013).The second aliquot was dissolved in 100 mL of 80:20 (v/v) methanol:acetone and assessed by HPLC for levels of the eight target chlorophyllmetabolites as described above. Pheophorbide b and pheophytin b,whose presence indicates artifactual conversions during extraction,were below detection levels in all samples analyzed. For each of thedetected chlorophyll metabolites, Pearson correlations with total to-copherol levels were calculated within each time point after removingvalues (concentration, pmol g21) that were more than three standarddeviations from the mean for the respective compound (the chlorophyllmetabolite and/or total tocopherols) within that time point.
Accession Numbers
Genes identified in this study are as listed in Figure 3, using the followingaccession numbers as available in MaizeGDB: GRMZM2G084942,GRMZM2G493395,GRMZM2G173358,GRMZM2G173641,GRMZM2G112728,GRMZM2G082998,GRMZM2G088396,GRMZM2G035213,GRMZM2G036455,GRMZM2G073351,GRMZM2G039373,GRMZM2G060870,GRMZM2G128176,and GRMZM2G031028. HapMap sequence data, as described by Chiaet al. (2012) and Gore et al. (2009), can be found in the NCBI Short ReadArchive with accession numbers SRA051245 (HapMap v. 2) andSRP001145 (HapMapv. 1). BothSNPdata sets are also available atwww.panzea.org. The data reported in this article are tabulated in the sup-plemental data and archived in the following places: All RNA-seq readsare available at the National Center of Biotechnology Information Se-quence Read Archive under BioProject Number PRJNA174231. SNPs
and expression abundances (FPKMs) are available from the DRYADrepository (http://dx.doi.org/10.5061/dryad.5t8d9). Scripts used inthis study are available on GitHub (https://github.com/GoreLab/Vitamaize_NAM_GWAS_LabVersion.git).
Supplemental Data
Supplemental Figure 1. Pairwise phenotypic correlations betweenuntransformed best linear unbiased estimators of 10 tocochromanolgrain traits.
Supplemental Figure 2. Pleiotropy of 162 quantitative trait lociidentified in joint-linkage analysis for 10 grain tocochromanol traits inthe U.S. maize nested association mapping population.
Supplemental Figure 3. Linkage disequilibrium estimates betweenGWAS variants in the NAM population.
Supplemental Figure 4. Heat map displaying Pearson’s (r2) correla-tion coefficient of expression abundances across all samples in thisstudy.
Supplemental Figure 5. Master summaries for the remaining genesidentified in this study.
Supplemental Figure 6. Frequency distributions of standardized joint-linkage allelic effect estimates (absolute values) for tocopherol traitsand tocotrienol traits, for quantitative trait loci in each of three classes.
Supplemental Figure 7. Concentrations (pmol g21, log scale) ofchlorophyll pathway compounds and total tocopherols in embryosand endosperm of NAM parents analyzed across developing kernelstages.
Supplemental Figure 8. Relative explanation of phenotypic variancefor 10 tocochromanol grain traits by each of three classes of joint-linkage quantitative trait loci.
Supplemental Figure 9. Distribution of untransformed best linearunbiased estimators for 10 grain tocochromanol traits across the U.S.maize nested association mapping population.
Supplemental Table 1. Summary of samples used for RNA isolation inthis study.
Supplemental Table 2. Percent phenotypic variance explained forunresolved joint-linkage quantitative trait loci.
Supplemental Table 3. Lambda values used in Box-Cox transforma-tion and joint-linkage and genome-wide association study entrythresholds determined from permutations for each trait.
Supplemental Data Set 1. Genomic information for the 81 a prioricandidate genes.
Supplemental Data Set 2. Transformed and untransformed bestlinear unbiased estimators for the U.S. maize nested associationmapping population used in the present study.
Supplemental Data Set 3. Final joint-linkage models for the 10 toco-chromanol traits evaluated in the U.S. maize nested associationmapping population.
Supplemental Data Set 4. Summary of joint linkage-quantitative traitloci and associated GWAS signals for 10 tocochromanol grain traitsevaluated in the U.S. maize nested association mapping population.
Supplemental Data Set 5. Summary of joint-linkage quantitative traitlocus allelic effect estimates for the 10 tocochromanol traits evaluatedin the U.S. maize nested association mapping population.
Supplemental Data Set 6. Summary of pleiotropy analyses.
Supplemental Data Set 7. Complete list of genome wide associationstudy results.
2388 The Plant Cell
Supplemental Data Set 8. Tissue and RNA-seq information forsamples used in this study.
Supplemental Data Set 9. Concentrations (pmol g21) of tocochro-manol and chlorophyll metabolites in developing embryo and endo-sperm tissue.
Supplemental Data Set 10. Chlorophyll-related gene expression indeveloping B73 embryos.
Supplemental Data Set 11. Summary of observations and genotypesremoved in the “difference in fits” and Studentized deleted residualsoutlier detection stages, conducted pre- and postgeneration of bestlinear unbiased estimators, respectively.
Supplemental File 1. Distribution of raw HPLC phenotypic values for10 grain tocochromanol traits across and within the U.S. maize nestedassociation mapping population.
Supplemental File 2. Distribution of untransformed best linear un-biased estimators for 10 grain tocochromanol traits across and withinthe U.S. maize nested association mapping population.
ACKNOWLEDGMENTS
This research was supported by the National Science Foundation (DBI-0922493 to D.D.P., C.R.B, E.S.B., and T.R. and DBI-0820619 and IOS-1238014 to E.S.B.), by the USDA-ARS (E.S.B.), by Cornell Universitystartup funds (M.A.G.), and by a USDA National Needs Fellowship(C.H.D.). We gratefully acknowledge Evan Klug and Emily McKinney forassistance with sample processing and HPLC, Elodie Gazave for initialCircos scripts, JasonPeiffer for customJavacode callingASReml, andPatBrown for pleiotropy plot scripts.
AUTHOR CONTRIBUTIONS
C.H.D., M.A.G., and D.D.P. cowrote the manuscript. C.H.D., C.B.K., andA.E.L. co-led data analysis. M.M.-L. performed HPLC analyses and me-tabolite quantifications. B.V., E.G.-C., J.H., and J.C. performed transcrip-tomeanalysis. J.G.W.generatedmarkerdatasets. J.G.W.andD.C.I. codedGWAS, GWAS permutation, and figure scripts. J.C. created website/databases. A.M. made RNA and RNA-seq libraries. P.J.B. modifiedTASSEL source code and oversaw epistasis calculations. T.R. managedNAMpopulationgrowth.M.M.-H.managedplanting, pollination,harvest-ing, and processing of the NAM population. B.F.O. and T.T. generateddeveloping kernels for transcriptome analysis. E.S.B. oversaw germplasm,genotyping, and imputation and advised onmapping analysis. C.R.B. over-saw RNA-seq and transcriptome analysis and managed all informatics.M.A.G. oversaw data analysis, project management, design, and coordina-tion. D.D.P. conducted projectmanagement and coordination, and oversawdata and metabolite analyses and biological interpretation.
Received June 19, 2017; revised August 23, 2017; accepted September29, 2017; published October 2, 2017.
REFERENCES
Ahsan, H., Ahad, A., and Siddiqui, W.A. (2015). A review of character-ization of tocotrienols from plant oils and foods. J. Chem. Biol. 8: 45–59.
Barnett, D.W., Garrison, E.K., Quinlan, A.R., Strömberg, M.P., andMarth, G.T. (2011). BamTools: a C++ API and toolkit for analyzingand managing BAM files. Bioinformatics 27: 1691–1692.
Belsley, D.A., Kuh, E., and Welsch, R.E. (2005). Regression Diag-nostics: Identifying Influential Data and Sources of Collinearity.(Hoboken, NJ: John Wiley & Sons).
Benjamini, Y., and Hochberg, Y. (1995). Controlling the false dis-covery rate: a practical and powerful approach to multiple testing.J. Roy. Stat. Soc. B Met. 57: 289–300.
Box, G.E.P., and Cox, D.R. (1964). An analysis of transformations.J. Roy. Stat. Soc. B Met. 26: 211–252.
Bradbury, P.J., Zhang, Z., Kroon, D.E., Casstevens, T.M.,Ramdoss, Y., and Buckler, E.S. (2007). TASSEL: software for as-sociation mapping of complex traits in diverse samples. Bioinformatics23: 2633–2635.
Bréhélin, C., Kessler, F., and van Wijk, K.J. (2007). Plastoglobules:versatile lipoprotein particles in plastids. Trends Plant Sci. 12: 260–266.
Brown, P.J., Upadyayula, N., Mahone, G.S., Tian, F., Bradbury,P.J., Myles, S., Holland, J.B., Flint-Garcia, S., McMullen, M.D.,Buckler, E.S., and Rocheford, T.R. (2011). Distinct genetic archi-tectures for male and female inflorescence traits of maize. PLoSGenet. 7: e1002383.
Buckler, E.S., et al. (2009). The genetic architecture of maize flow-ering time. Science 325: 714–718.
Burkschat, M. (2009). Linear estimators and predictors based ongeneralized order statistics from generalized Pareto distributions.Commun. Stat. Theor. M. 39: 311–326.
Butts, C. (2008). Network: a package for managing relational data inR. J. Stat. Softw. 24: 1–36.
Butts, C. (2015). Network: Classes for Relational Data. The StatnetProject, http://statnet.org.
Cahoon, E.B., Hall, S.E., Ripp, K.G., Ganzke, T.S., Hitz, W.D., andCoughlan, S.J. (2003). Metabolic redesign of vitamin E biosynthesisin plants for tocotrienol production and increased antioxidant con-tent. Nat. Biotechnol. 21: 1082–1087.
Camara, B. (1985). Prenylation of chlorophyllide a in Capsicumplastids. Methods Enzymol. 110: 274–281.
Canjura, F.L., and Schwartz, S.J. (1991). Separation of chlorophyllcompounds and their polar derivatives by high-performance liquidchromatography. J. Agric. Food Chem. 39: 1102–1105.
Chandler, K., Lipka, A.E., Owens, B.F., Li, H., Buckler, E.S.,Rocheford, T., and Gore, M.A. (2013). Genetic analysis of visu-ally scored orange kernel color in maize. Crop Sci. 53: 189–200.
Cheng, Z., Sattler, S., Maeda, H., Sakuragi, Y., Bryant, D.A., andDellaPenna, D. (2003). Highly divergent methyltransferases catalyzea conserved reaction in tocopherol and plastoquinone synthesis in cy-anobacteria and photosynthetic eukaryotes. Plant Cell 15: 2343–2356.
Chia, J.M., et al. (2012). Maize HapMap2 identifies extant variationfrom a genome in flux. Nat. Genet. 44: 803–807.
Christ, B., Schelbert, S., Aubry, S., Süssenbacher, I., Müller, T.,Kräutler, B., and Hörtensteiner, S. (2012). MES16, a member ofthe methylesterase protein family, specifically demethylates fluo-rescent chlorophyll catabolites during chlorophyll breakdown inArabidopsis. Plant Physiol. 158: 628–641.
Chrost, B., Falk, J., Kernebeck, B., Mölleken, H., and Krupinska, K.(1999). Tocopherol biosynthesis in senescing chloroplasts: a mecha-nism to protect envelope membranes against oxidative stress anda prerequisite for lipid remobilization. In The Chloroplast: FromMolecularBiology to Biotechnology, J.H. Argyroudi-Akoyunoglou and H. Senger,eds (Dordrecht, The Netherlands: Springer Netherlands), pp. 171–176.
Collakova, E., and DellaPenna, D. (2003). Homogentisate phytyl-transferase activity is limiting for tocopherol biosynthesis in Arabi-dopsis. Plant Physiol. 131: 632–642.
Cook, J.P., McMullen, M.D., Holland, J.B., Tian, F., Bradbury, P.,Ross-Ibarra, J., Buckler, E.S., and Flint-Garcia, S.A. (2012). Ge-netic architecture of maize kernel composition in the nested
Novel Vitamin E Loci in Maize Grain 2389
association mapping and inbred association panels. Plant Physiol.158: 824–834.
DellaPenna, D., and Mène-Saffrané, L. (2011). Vitamin E. In Ad-vances in Botanical Research, F. Rebeille and R. Douce, eds (Am-sterdam, The Netherlands: Elsevier), pp. 179–227.
Deruère, J., Römer, S., d’Harlingue, A., Backhaus, R.A., Kuntz, M.,and Camara, B. (1994). Fibril assembly and carotenoid over-accumulation in chromoplasts: a model for supramolecular lipo-protein structures. Plant Cell 6: 119–133.
Elshire, R.J., Glaubitz, J.C., Sun, Q., Poland, J.A., Kawamoto, K.,Buckler, E.S., and Mitchell, S.E. (2011). A robust, simple geno-typing-by-sequencing (GBS) approach for high diversity species.PLoS One 6: e19379.
Flint-Garcia, S.A., Thuillet, A.C., Yu, J., Pressoir, G., Romero, S.M.,Mitchell, S.E., Doebley, J., Kresovich, S., Goodman, M.M., andBuckler, E.S. (2005). Maize association population: a high-resolutionplatform for quantitative trait locus dissection. Plant J. 44: 1054–1064.
Fritsche, S., Wang, X., Li, J., Stich, B., Kopisch-Obuch, F.J.,Endrigkeit, J., Leckband, G., Dreyer, F., Friedt, W., Meng, J.,and Jung, C. (2012). A candidate gene-based association study oftocopherol content and composition in rapeseed (Brassica napus).Front. Plant Sci. 3: 129.
Gilliland, L.U., Magallanes-Lundback, M., Hemming, C., Supplee, A.,Koornneef, M., Bentsink, L., and Dellapenna, D. (2006). Genetic basisfor natural variation in seed vitamin E levels in Arabidopsis thaliana. Proc.Natl. Acad. Sci. USA 103: 18834–18841.
Gilmour, A.R., Gogel, B.J., Cullis, B.R., and Thompson, R. (2009).ASReml User Guide: Release 3.0. (Hemel Hempstead, UK: VSNInternational).
Glaubitz, J.C., Casstevens, T.M., Lu, F., Harriman, J., Elshire, R.J.,Sun, Q., and Buckler, E.S. (2014). TASSEL-GBS: a high capacitygenotyping by sequencing analysis pipeline. PLoS One 9: e90346.
Gore, M.A., Chia, J.M., Elshire, R.J., Sun, Q., Ersoz, E.S., Hurwitz,B.L., Peiffer, J.A., McMullen, M.D., Grills, G.S., Ross-Ibarra, J.,Ware, D.H., and Buckler, E.S. (2009). A first-generation haplotypemap of maize. Science 326: 1115–1117.
Hirsch, C.N., and Foerster, J.M., et al. (2014). Insights into the maizepan-genome and pan-transcriptome. Plant Cell 26: 121–135.
Holden, M. (1961). The breakdown of chlorophyll by chlorophyllase.Biochem. J. 78: 359–364.
Holland, J.B., Nyquist, W.E., and Cervantes-Martínez, C.T. (2003).Estimating and interpreting heritability for plant breeding: an up-date. In Plant Breeding Reviews, J. Janick, ed (Oxford, UK: JohnWiley & Sons), pp. 9–112.
Hörtensteiner, S. (2013). Update on the biochemistry of chlorophyllbreakdown. Plant Mol. Biol. 82: 505–517.
Hörtensteiner, S., and Kräutler, B. (2011). Chlorophyll breakdown inhigher plants. Biochim. Biophys. Acta 1807: 977–988.
Hung, H.Y., et al. (2012). The relationship between parental genetic orphenotypic divergence and progeny variation in the maize nestedassociation mapping population. Heredity (Edinb.) 108: 490–499.
Hunter, S.C., and Cahoon, E.B. (2007). Enhancing vitamin E in oilseeds:unraveling tocopherol and tocotrienol biosynthesis. Lipids 42: 97–108.
Hussain, N., Irshad, F., Jabeen, Z., Shamsi, I.H., Li, Z., and Jiang, L.(2013). Biosynthesis, structural, and functional attributes of toco-pherols in planta; past, present, and future perspectives. J. Agric.Food Chem. 61: 6137–6149.
Inoue, S., Ejima, K., Iwai, E., Hayashi, H., Appel, J., Tyystjärvi, E.,Murata, N., and Nishiyama, Y. (2011). Protection by a-tocopherol ofthe repair of photosystem II during photoinhibition in Synechocystis sp.PCC 6803. Biochim. Biophys. Acta 1807: 236–241.
Kamal-Eldin, A., and Appelqvist, L.-Å. (1996). The chemistry and antioxi-dant properties of tocopherols and tocotrienols. Lipids 31: 671–701.
Karunanandaa, B., et al. (2005). Metabolically engineered oilseedcrops with enhanced seed tocopherol. Metab. Eng. 7: 384–400.
Kim, E.H., Lee, Y., and Kim, H.U. (2015). Fibrillin 5 is essential forplastoquinone-9 biosynthesis by binding to solanesyl diphosphatesynthases in Arabidopsis. Plant Cell 27: 2956–2971.
Kim, Y.H., et al. (2011). Antioxidant activity and inhibition of lipidperoxidation in germinating seeds of transgenic soybean express-ing OsHGGT. J. Agric. Food Chem. 59: 584–591.
Krzywinski, M., Schein, J., Birol, I., Connors, J., Gascoyne, R.,Horsman, D., Jones, S.J., and Marra, M.A. (2009). Circos: an in-formation aesthetic for comparative genomics. Genome Res. 19:1639–1645.
Kumar, R., Raclaru, M., Schüsseler, T., Gruber, J., Sadre, R., Lühs,W., Zarhloul, K.M., Friedt, W., Enders, D., Frentzen, M., andWeier, D. (2005). Characterisation of plant tocopherol cyclases andtheir overexpression in transgenic Brassica napus seeds. FEBS Lett.579: 1357–1364.
Kump, K.L., Bradbury, P.J., Wisser, R.J., Buckler, E.S., Belcher,A.R., Oropeza-Rosas, M.A., Zwonitzer, J.C., Kresovich, S.,McMullen, M.D., Ware, D., Balint-Kurti, P.J., and Holland, J.B.(2011). Genome-wide association study of quantitative resistanceto southern leaf blight in the maize nested association mappingpopulation. Nat. Genet. 43: 163–168.
Kutner, M.H., Nachtsheim, C.J., Neter, J., and Li, W. (2004). AppliedLinear Statistical Models. (Boston: McGraw Hill Irwin).
Langmead, B., Trapnell, C., Pop, M., and Salzberg, S.L. (2009).Ultrafast and memory-efficient alignment of short DNA sequencesto the human genome. Genome Biol. 10: R25.
Lee, M., Sharopova, N., Beavis, W.D., Grant, D., Katt, M., Blair, D.,and Hallauer, A. (2002). Expanding the genetic map of maize withthe intermated B73 x Mo17 (IBM) population. Plant Mol. Biol. 48:453–461.
Li, H., Bradbury, P., Ersoz, E., Buckler, E.S., and Wang, J. (2011).Joint QTL linkage mapping for multiple-cross mating design sharingone common parent. PLoS One 6: e17573.
Li, H., Handsaker, B., Wysoker, A., Fennell, T., Ruan, J., Homer, N.,Marth, G., Abecasis, G., and Durbin, R.; 1000 Genome ProjectData Processing Subgroup (2009). The Sequence Alignment/Mapformat and SAMtools. Bioinformatics 25: 2078–2079.
Li, Q., Yang, X., Xu, S., Cai, Y., Zhang, D., Han, Y., Li, L., Zhang, Z.,Gao, S., Li, J., and Yan, J. (2012). Genome-wide associationstudies identified three independent polymorphisms associatedwith a-tocopherol content in maize kernels. PLoS One 7: e36807.
Li, Y., Zhou, Y., Wang, Z., Sun, X., and Tang, K. (2010). Engineeringtocopherol biosynthetic pathway in Arabidopsis leaves and its ef-fect on antioxidant metabolism. Plant Sci. 178: 312–320.
Lichtenthaler, H.K. (1987). Chlorophylls and carotenoids: pigments ofphotosynthetic biomembranes. Methods Enzymol. 148: 350–382.
Lipka, A.E., Tian, F., Wang, Q., Peiffer, J., Li, M., Bradbury, P.J., Gore,M.A., Buckler, E.S., and Zhang, Z. (2012). GAPIT: genome associationand prediction integrated tool. Bioinformatics 28: 2397–2399.
Lipka, A.E., Gore, M.A., Magallanes-Lundback, M., Mesberg, A.,Lin, H., Tiede, T., Chen, C., Buell, C.R., Buckler, E.S., Rocheford,T., and DellaPenna, D. (2013). Genome-wide association study andpathway-level analysis of tocochromanol levels in maize grain. G33: 1287–1299.
Lippold, F., vom Dorp, K., Abraham, M., Hölzl, G., Wewer, V.,Yilmaz, J.L., Lager, I., Montandon, C., Besagni, C., Kessler, F.,Stymne, S., and Dörmann, P. (2012). Fatty acid phytyl ester syn-thesis in chloroplasts of Arabidopsis. Plant Cell 24: 2001–2014.
Littell, R.C., Milliken, G.A., Stroup, W.W., Wolfinger, R.D., andSchabenberger, O. (2006). SAS� for Mixed Models, (Cary, NC: SASInstitute).
2390 The Plant Cell
Lu, Y., Rijzaani, H., Karcher, D., Ruf, S., and Bock, R. (2013). Effi-cient metabolic pathway engineering in transgenic tobacco andtomato plastids with synthetic multigene operons. Proc. Natl. Acad.Sci. USA 110: E623–E632.
Ma, Y., Baker, R.F., Magallanes-Lundback, M., DellaPenna, D.,and Braun, D.M. (2008). Tie-dyed1 and sucrose export defective1act independently to promote carbohydrate export from maizeleaves. Planta 227: 527–538.
Maeda, H., and DellaPenna, D. (2007). Tocopherol functions inphotosynthetic organisms. Curr. Opin. Plant Biol. 10: 260–265.
Maeda, H., Song, W., Sage, T.L., and DellaPenna, D. (2006). To-copherols play a crucial role in low-temperature adaptation andPhloem loading in Arabidopsis. Plant Cell 18: 2710–2732.
Martin, M. (2011). Cutadapt removes adapter sequences from high-throughput sequencing reads. EMBnet.journal 17: 10–12.
McMullen, M.D., et al. (2009). Genetic properties of the maize nestedassociation mapping population. Science 325: 737–740.
Mène-Saffrané, L., Jones, A.D., and DellaPenna, D. (2010). Plas-tochromanol-8 and tocopherols are essential lipid-soluble anti-oxidants during seed desiccation and quiescence in Arabidopsis.Proc. Natl. Acad. Sci. USA 107: 17815–17820.
Milenkovic, S.M., Zvezdanovic, J.B., AnCelkovic, T.D., andMarkovic, D.Z. (2012). The identification of chlorophyll and its de-rivatives in the pigment mixtures: HPLC-chromatography, visibleand mass spectroscopy studies. Adv. Technol. 1: 16–24.
Neter, J., Kutner, M.H., Nachtsheim, C.J., and Wasserman, W.(1996). Applied Linear Statistical Methods. (Chicago: Irwin).
Norris, S.R., Shen, X., and DellaPenna, D. (1998). Complemen-tation of the Arabidopsis pds1 mutation with the gene encodingp-hydroxyphenylpyruvate dioxygenase. Plant Physiol. 117: 1317–1323.
Ogut, F., Bian, Y., Bradbury, P.J., and Holland, J.B. (2015). Joint-multiple family linkage analysis predicts within-family variationbetter than single-family analysis of the maize nested associationmapping population. Heredity (Edinb.) 114: 552–563.
Peiffer, J.A., Romay, M.C., Gore, M.A., Flint-Garcia, S.A., Zhang,Z., Millard, M.J., Gardner, C.A., McMullen, M.D., Holland, J.B.,Bradbury, P.J., and Buckler, E.S. (2014). The genetic architectureof maize height. Genetics 196: 1337–1356.
Poland, J.A., Bradbury, P.J., Buckler, E.S., and Nelson, R.J. (2011).Genome-wide nested association mapping of quantitative resistance tonorthern leaf blight in maize. Proc. Natl. Acad. Sci. USA 108: 6893–6898.
Raclaru, M., Gruber, J., Kumar, R., Sadre, R., Lühs, W., Zarhloul,M.K., Friedt, W., Frentzen, M., and Weier, D. (2006). Increase ofthe tocochromanol content in transgenic Brassica napus seeds byoverexpression of key enzymes involved in prenylquinone bio-synthesis. Mol. Breed. 18: 93–107.
Rao, T.J., and Province, M.A. (2016). A framework for interpretingtype I error rates from a product-term model of interaction appliedto quantitative traits. Genet. Epidemiol. 40: 144–153.
Rippert, P., Scimemi, C., Dubald, M., and Matringe, M. (2004).Engineering plant shikimate pathway for production of tocotrienoland improving herbicide resistance. Plant Physiol. 134: 92–100.
Rise, M., Cojocaru, M., Gottlieb, H.E., and Goldschmidt, E.E.(1989). Accumulation of a-tocopherol in senescing organs as re-lated to chlorophyll degradation. Plant Physiol. 89: 1028–1030.
Ritchie, M.D., Holzinger, E.R., Li, R., Pendergrass, S.A., and Kim, D.(2015). Methods of integrating data to uncover genotype-phenotypeinteractions. Nat. Rev. Genet. 16: 85–97.
Sattler, S.E., Gilliland, L.U., Magallanes-Lundback, M., Pollard, M.,and DellaPenna, D. (2004). Vitamin E is essential for seed longevityand for preventing lipid peroxidation during germination. Plant Cell16: 1419–1432.
Savidge, B., Weiss, J.D., Wong, Y.-H.H., Lassner, M.W., Mitsky,T.A., Shewmaker, C.K., Post-Beittenmiller, D., and Valentin, H.E.(2002). Isolation and characterization of homogentisate phytyltransferasegenes from Synechocystis sp. PCC 6803 and Arabidopsis. PlantPhysiol. 129: 321–332.
Schelbert, S., Aubry, S., Burla, B., Agne, B., Kessler, F., Krupinska,K., and Hörtensteiner, S. (2009). Pheophytin pheophorbide hy-drolase (pheophytinase) is involved in chlorophyll breakdown duringleaf senescence in Arabidopsis. Plant Cell 21: 767–785.
Schwartz, S.J., Woo, S.L., and von Elbe, J.H. (1981). High-performanceliquid chromatography of chlorophylls and their derivatives in freshand processed spinach. J. Agric. Food Chem. 29: 533–535.
Shintani, D., and DellaPenna, D. (1998). Elevating the vitamin Econtent of plants through metabolic engineering. Science 282:2098–2100.
Singh, D.K., and McNellis, T.W. (2011). Fibrillin protein function: thetip of the iceberg? Trends Plant Sci. 16: 432–441.
Tanaka, H., Yabuta, Y., Tamoi, M., Tanabe, N., and Shigeoka, S.(2015). Generation of transgenic tobacco plants with enhancedtocotrienol levels through the ectopic expression of rice homoge-ntisate geranylgeranyl transferase. Plant Biotechnol. 32: 233–238.
Tanaka, R., Rothbart, M., Oka, S., Takabayashi, A., Takahashi, K.,Shibata, M., Myouga, F., Motohashi, R., Shinozaki, K., Grimm,B., and Tanaka, A. (2010). LIL3, a light-harvesting-like protein,plays an essential role in chlorophyll and tocopherol biosynthesis.Proc. Natl. Acad. Sci. USA 107: 16721–16725.
Tang, S., Hass, C.G., and Knapp, S.J. (2006). Ty3/gypsy-like retro-transposon knockout of a 2-methyl-6-phytyl-1,4-benzoquinonemethyltransferase is non-lethal, uncovers a cryptic paralogous mu-tation, and produces novel tocopherol (vitamin E) profiles in sun-flower. Theor. Appl. Genet. 113: 783–799.
Tian, F., Bradbury, P.J., Brown, P.J., Hung, H., Sun, Q., Flint-Garcia, S., Rocheford, T.R., McMullen, M.D., Holland, J.B., andBuckler, E.S. (2011). Genome-wide association study of leaf ar-chitecture in the maize nested association mapping population.Nat. Genet. 43: 159–162.
Trapnell, C., Williams, B.A., Pertea, G., Mortazavi, A., Kwan, G.,van Baren, M.J., Salzberg, S.L., Wold, B.J., and Pachter, L.(2010). Transcript assembly and quantification by RNA-Seq revealsunannotated transcripts and isoform switching during cell differ-entiation. Nat. Biotechnol. 28: 511–515.
Valdar, W., Holmes, C.C., Mott, R., and Flint, J. (2009). Mapping instructured populations by resample model averaging. Genetics 182:1263–1277.
Valentin, H.E., Lincoln, K., Moshiri, F., Jensen, P.K., Qi, Q.,Venkatesh, T.V., Karunanandaa, B., Baszis, S.R., Norris, S.R.,Savidge, B., Gruys, K.J., and Last, R.L. (2006). The Arabidopsisvitamin E pathway gene5-1 mutant reveals a critical role for phytolkinase in seed tocopherol biosynthesis. Plant Cell 18: 212–224.
Van Eenennaam, A.L., et al. (2003). Engineering vitamin E content:from Arabidopsis mutant to soy oil. Plant Cell 15: 3007–3019.
Vom Dorp, K., Hölzl, G., Plohmann, C., Eisenhut, M., Abraham,M., Weber, A.P.M., Hanson, A.D., and Dörmann, P. (2015).Remobilization of phytol from chlorophyll degradation is essentialfor tocopherol synthesis and growth of Arabidopsis. Plant Cell 27:2846–2859.
Wallace, J.G., Bradbury, P.J., Zhang, N., Gibon, Y., Stitt, M., andBuckler, E.S. (2014). Association mapping across numerous traitsreveals patterns of functional variation in maize. PLoS Genet. 10:e1004845.
Wan, C.Y., and Wilkins, T.A. (1994). A modified hot borate methodsignificantly enhances the yield of high-quality RNA from cotton(Gossypium hirsutum L.). Anal. Biochem. 223: 7–12.
Novel Vitamin E Loci in Maize Grain 2391

Wang, X., Zhang, C., Li, L., Fritsche, S., Endrigkeit, J., Zhang, W.,Long, Y., Jung, C., and Meng, J. (2012). Unraveling the geneticbasis of seed tocopherol content and composition in rapeseed(Brassica napus L.). PLoS One 7: e50038.
Wang, X.Q., Yoon, M.Y., He, Q., Kim, T.S., Tong, W., Choi, B.W.,Lee, Y.S., and Park, Y.J. (2015). Natural variations in OsgTMTcontribute to diversity of the a-tocopherol content in rice. Mol.Genet. Genomics 290: 2121–2135.
Weir, B.S. (1996). Genetic Data Analysis II. (Sunderland, MA: SinauerAssociates).
Yan, J., Lipka, A.E., Schmelz, E.A., Buckler, E.S., and Jander, G.(2015). Accumulation of 5-hydroxynorvaline in maize (Zea mays)leaves is induced by insect feeding and abiotic stress. J. Exp. Bot.66: 593–602.
Yang, W., Cahoon, R.E., Hunter, S.C., Zhang, C., Han, J.,Borgschulte, T., and Cahoon, E.B. (2011). Vitamin E biosynthesis:functional characterization of the monocot homogentisate ger-anylgeranyl transferase. Plant J. 65: 206–217.
Ytterberg, A.J., Peltier, J.B., and van Wijk, K.J. (2006). Proteinprofiling of plastoglobules in chloroplasts and chromoplasts. A
surprising site for differential accumulation of metabolic enzymes.Plant Physiol. 140: 984–997.
Yu, J., Holland, J.B., McMullen, M.D., and Buckler, E.S. (2008).Genetic design and statistical power of nested association mappingin maize. Genetics 178: 539–551.
Zapata, M., Ayala, A.M., Franco, J.M., and Garrido, J.L. (1987).Separation of chlorophylls and their degradation products in marinephytoplankton by reversed-phase high-performance liquid chro-matography. Chromatographia 23: 26–30.
Zhang, C., Cahoon, R.E., Hunter, S.C., Chen, M., Han, J., andCahoon, E.B. (2013). Genetic and biochemical basis for alternativeroutes of tocotrienol biosynthesis for enhanced vitamin E antioxi-dant production. Plant J. 73: 628–639.
Zhang, N., et al. (2015). Genome-wide association of carbon andnitrogen metabolism in the maize nested association mappingpopulation. Plant Physiol. 168: 575–583.
Zhang, W., Liu, T., Ren, G., Hörtensteiner, S., Zhou, Y., Cahoon,E.B., and Zhang, C. (2014). Chlorophyll degradation: the tocoph-erol biosynthesis-related phytol hydrolase in Arabidopsis seeds isstill missing. Plant Physiol. 166: 70–79.
2392 The Plant Cell
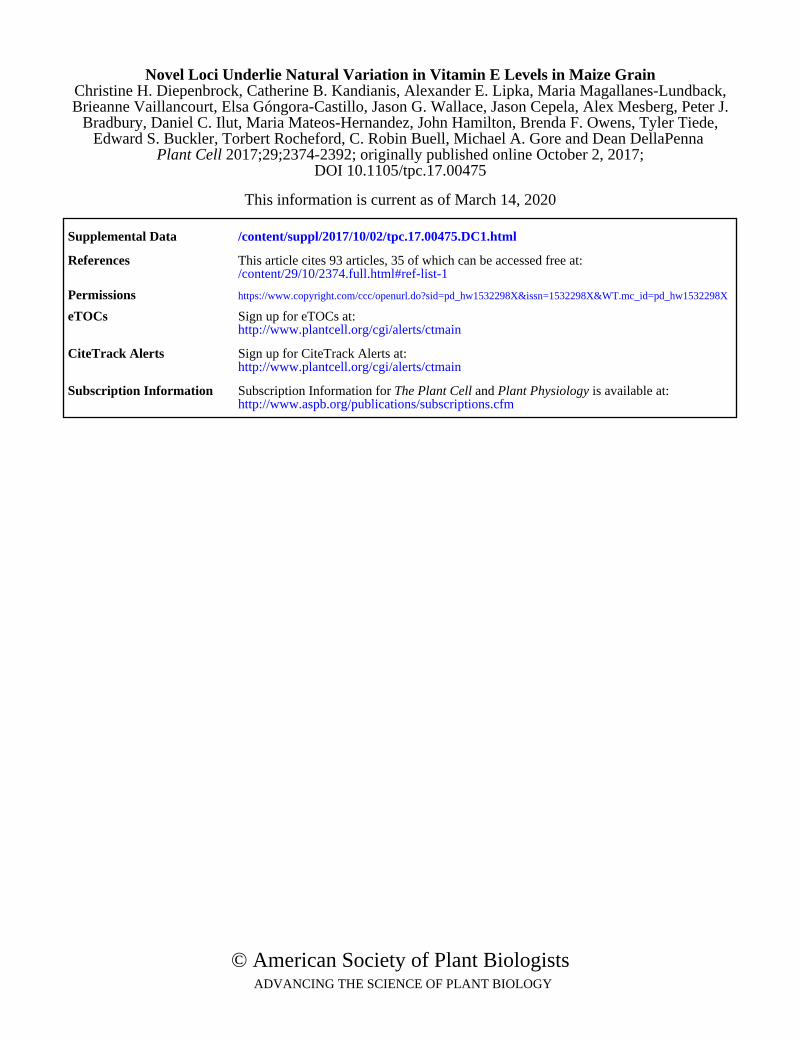
DOI 10.1105/tpc.17.00475; originally published online October 2, 2017; 2017;29;2374-2392Plant Cell
Edward S. Buckler, Torbert Rocheford, C. Robin Buell, Michael A. Gore and Dean DellaPennaBradbury, Daniel C. Ilut, Maria Mateos-Hernandez, John Hamilton, Brenda F. Owens, Tyler Tiede,
Brieanne Vaillancourt, Elsa Góngora-Castillo, Jason G. Wallace, Jason Cepela, Alex Mesberg, Peter J. Christine H. Diepenbrock, Catherine B. Kandianis, Alexander E. Lipka, Maria Magallanes-Lundback,
Novel Loci Underlie Natural Variation in Vitamin E Levels in Maize Grain
This information is current as of March 14, 2020
Supplemental Data /content/suppl/2017/10/02/tpc.17.00475.DC1.html
References /content/29/10/2374.full.html#ref-list-1
This article cites 93 articles, 35 of which can be accessed free at:
Permissions https://www.copyright.com/ccc/openurl.do?sid=pd_hw1532298X&issn=1532298X&WT.mc_id=pd_hw1532298X
eTOCs http://www.plantcell.org/cgi/alerts/ctmain
Sign up for eTOCs at:
CiteTrack Alerts http://www.plantcell.org/cgi/alerts/ctmain
Sign up for CiteTrack Alerts at:
Subscription Information http://www.aspb.org/publications/subscriptions.cfm
is available at:Plant Physiology and The Plant CellSubscription Information for
ADVANCING THE SCIENCE OF PLANT BIOLOGY © American Society of Plant Biologists