exploring neurocognitive processes that underlie reading
TRANSCRIPT

University of South Carolina University of South Carolina
Scholar Commons Scholar Commons
Theses and Dissertations
Spring 2021
Exploring Neurocognitive Processes That Underlie Reading Exploring Neurocognitive Processes That Underlie Reading
Performance in Children: A Foundational Study Performance in Children: A Foundational Study
Ayan Mitra
Follow this and additional works at: https://scholarcommons.sc.edu/etd
Part of the Scholarship of Teaching and Learning Commons
Recommended Citation Recommended Citation Mitra, A.(2021). Exploring Neurocognitive Processes That Underlie Reading Performance in Children: A Foundational Study. (Doctoral dissertation). Retrieved from https://scholarcommons.sc.edu/etd/6300
This Open Access Dissertation is brought to you by Scholar Commons. It has been accepted for inclusion in Theses and Dissertations by an authorized administrator of Scholar Commons. For more information, please contact [email protected].

EXPLORING NEUROCOGNITIVE PROCESSES THAT UNDERLIE READING
PERFORMANCE IN CHILDREN: A FOUNDATIONAL STUDY
by
Ayan Mitra
Bachelor of Arts (Honors)
The University of Calcutta, 2010
Master of Arts
Presidency University, 2012
Master of Philosophy
Jadavpur University, 2016
Submitted in Partial Fulfillment of the Requirements
For the Degree of Doctor of Philosophy in
Teaching and Learning
College of Education
University of South Carolina
2021
Accepted by:
Lucy K. Spence, Major Professor
Scott L. Decker, Committee Member
Angela C. Baum, Committee Member
Michele Myers, Committee Member
Tracey L. Weldon, Interim Vice Provost and Dean of the Graduate School

ii
© Copyright by Ayan Mitra, 2021
All Rights Reserved.

iii
DEDICATION
I dedicate this dissertation to my father Dr. Abhijit Mitra who was a
neuropsychiatrist. He was devoted to his patients and always set a very high example
of what service to others meant. Even when he was undergoing chemotherapy for
lung cancer he would go out in the community and see his patients in between his
weekly treatment sessions. We frequently discussed research on brain, neuroscience,
and early childhood education, and life in general. Those experiences motivated me
to better understand how children come to read, write, and speak. What does it mean
for a child to learn something? During that time, I asked my dad why he thought
nursery rhymes stay with us forever. “How do we remember it from our childhood
and what happens in the brain when such verses are introduced to us?” My dad
smiled and looked at me, and said, “I guess that's a real question and you have to
find the answer for yourself.” When my father passed, I set off to the United States
to find the answers to my questions. The reason for taking up this challenge was to
work for the community of school children who faced reading difficulties. That is
why I decided to bridge reading education and neuroimaging.

iv
ACKNOWLEDGEMENTS
A page of acknowledgement is not enough to express the gratitude that I feel
towards people who supported me through this dissertation. First and foremost, I would
like to acknowledge my advisers, Dr. Lucy K. Spence and Dr. Scott L. Decker, and my
dissertation committee members, Dr. Michele Myers and Dr. Angela Baum, for their
unwavering belief, conviction, and support in my project. Among my past mentors, I
would like to thank Dr. Anuradha Mukherjee, Dr. Arpita Chattaraj Mukhopadhay, Aloka
Reba Sarkar, and Dr. Rimi B Chatterjee, whose training during the formative part of my
research career in India helped me understand the rigor associated with research and
pursue a doctoral degree. Among my family and loved ones, I would like to thank my
friend Kyryl Kozenko for his love and support during the most crucial last two years of
my dissertation research. My late Mother Ira was, is, and always will be my muse for
inspiration for any challenge and for teaching me how to dream. My sister Bidisha Mitra,
has been one of the strongest support systems for me in the last five years of this
dissertation journey, beginning from making my life as comfortable as possible in the
United States, while dealing with all the issues back in India, after Mom and Dad passed
away. I would also like to thank my best friend Shreerupa Banerjee, my lab mates
Michael and Chris, my buddies Harveen, Swanandi, Xiao, Stevie, and Kelvin and my
friend, philosopher, and guide John Spence for making me smile throughout this journey.
Finally, I would like to thank my schoolteachers Koely Ghosh and Joyeeta Mukherjee for
inspiring hope in an otherwise ordinary school kid. I appreciate all of you.
v
ABSTRACT
With advancement in brain research, neuroscience researchers have collectively
informed our understanding of reading-related processes. Despite an extensive body of
literature, many educators are not aware of specific neuroimaging findings related to
phonological processing and word reading. Therefore, the study builds on this body of
research by exploring the connection between the brain and reading scores. Quantitative
EEG and standardized academic achievement analyses were performed on 60 school-
aged children. Intrahemispheric coherence analysis at rest were conducted across the
sample of participants and several coherence networks were extracted and compared to
standardized reading achievement scores. Specifically, networks that included Brodmann
area 44 and 45 (Brocas Area-associated with reading) whose coherence values were
significantly correlated with standardized reading scores were examined. Results indicate
total of five coherence networks across the two brain hemispheres, that are correlated
with reading achievement scores in children. In addition to Brodmann area 44 and 45,
these coherence networks include BAs in the left frontotemporal lobe, right
occipitotemporal lobe, left temporoparietal lobe, and the right occipital lobe. This
dissertation seeks to disseminate this information to an audience of educators. Findings
discussed in this dissertation include the QEEG coherence patterns specifically associated
with letter word identification, reading fluency, passage comprehension, and broad
reading scores measured by the Woodcock Johnson III Test of Achievement contributing
to educators’ understanding of brain connectivity in relation to reading performance.

vi
PREFACE
As someone who was always fascinated by how children learn to read —
especially in India — with activities like nursery rhymes, I wanted to explore the
neuroscientific basis of literacy. My passion for early childhood education and the brain,
and my vision of having a greater impact in informing classroom practices, led me down
this path in education. Not being a schoolteacher, I nevertheless gravitated toward the
classroom environment. I wanted to approach reading from the ground level and align it
with the best practices in neuroscience.
My research attempts to bridge the gap between education and neuroscience. I
want to understand how connectivity across different regions of the brain (coherence) is
predictive of reading measures in widely used cognitive reading assessments. With
rapidly evolving neuroimaging techniques providing better spatial and temporal
resolution to brain imaging, it is increasingly important for literacy scholars to theorize
the neural basis of reading.
My research will help teachers and reading specialists understand the brain in
relation to literacy. This can help them implement appropriate strategies in the classroom.
Understanding how the brain processes written and spoken language might help them
devise new curricula. My engagement with this field has already forged connections
between education and psychology leading to research, presentations, and the U of SC
Literacy Lab.

vii
TABLE OF CONTENTS
Dedication .......................................................................................................................... iii
Acknowledgements ............................................................................................................ iv
Abstract ................................................................................................................................v
Preface................................................................................................................................ vi
List of Tables ................................................................................................................... viii
List of Figures ......................................................................................................................x
List of Symbols .................................................................................................................. xi
List of Abbreviations ........................................................................................................ xii
Chapter 1: Introduction ........................................................................................................1
Chapter 2: Methodology ....................................................................................................22
Chapter 3: Results ..............................................................................................................33
Chapter 4: Discussion ........................................................................................................53
References ..........................................................................................................................72
Appendix A: Adapted Prisma Flow Diagram ....................................................................83
Appendix B: Principal Component Analysis Loading Weights ........................................84

viii
LIST OF TABLES
Table 1.1 Associated Regions of Interest to Reading and Their Functions .........................7
Table 2.1 Demographic Characteristics .............................................................................22
Table 2.2 Sample Descriptive Statistics for WJ-III Ach
Reading Standard Scores .......................................................................................22
Table 3.1 Extracted components and Eigenvalue variance
explained for Brodmann Area 44 ..........................................................................41
Table 3.2 Extracted components and Eigenvalue variance
explained for Brodmann Area 45 ...........................................................................43
Table 3.3 Significant Pearson’s Correlations between PCA
components reading tests in BA 44 .......................................................................45
Table 3.4 Significant Pearson’s Correlations between PCA
components reading tests in BA 45 .......................................................................46
Table 3.5 Multiple linear regression model using coherence components
to see their association with Broad Reading composite score ...............................49
Table 3.6 Multiple linear regression models using coherence components
to see their association with reading subtests ........................................................50
Table 3.7 Significant Pearson’s Correlations between reading coherence
components and Broad Math scores ......................................................................52
Table B.1 Rotated Delta component #2 matrix in the
left hemisphere (BA 44).........................................................................................84
Table B.2 Rotated Theta component #2 matrix in the
right hemisphere (BA 44) ......................................................................................85
Table B.3 Rotated Beta 2 component #3 matrix in the
right hemisphere (BA 44) ......................................................................................85

ix
Table B.4 Rotated Alpha 1 component # 3 matrix in the
left hemisphere (BA 45).........................................................................................86
Table B.5 Rotated Beta 2 component # 3 matrix in the
left hemisphere (BA 45).........................................................................................86

x
LIST OF FIGURES
Figure 1.1 The Reading Brain ..............................................................................................6
Figure 2.1 10/20 Electrode Placement ...............................................................................32
Figure 3.1 Associated coherence components for BA 44 ..................................................47
Figure 3.2 Associated coherence components for BA 45 ..................................................48
Figure A.1 Adapted Prisma Flow Diagram .......................................................................83

xi
LIST OF SYMBOLS
β Standardized Coefficient
p Significance Value
F F Statistics

xii
LIST OF ABBREVIATIONS
ADHD .................................................................. Attention Deficit Hyperactivity Disorder
BA 44 ...................................................................................................... Brodmann Area 44
BA 45 ...................................................................................................... Brodmann Area 45
BOLD ........................................................................ Blood-Oxygenation Level Dependent
EEG ................................................................................................. Electroencephalography
fMRI ..................................................................... Functional Magnetic Resonance Imaging
KMO ..................................................................................................... Kaiser-Meyer-Olkin
LDT ....................................................................................................Lexical Decision Task
LH ...............................................................................................................Left Hemisphere
LORETA ..................................................... Low Resolution Electromagnetic Tomography
MRI ........................................................................................ Magnetic Resonance Imaging
PCA ..................................................................................... Principal Components Analysis
PDT .......................................................................................... Phonological Decision Task
PET ..................................................................................... Positron Emission Tomography
QEEG ......................................................................... Quantitative Electroencephalography
RH ............................................................................................................ Right Hemisphere
TBI ................................................................................................... Traumatic Brain Injury
VWFA .............................................................................................Visual Word Form Area
WJ III Ach..................................................... Woodcock Johnson III- Test of Achievement
WJ III Cog............................................ Woodcock Johnson III- Test of Cognitive Abilities

1
CHAPTER 1
INTRODUCTION
With current neuroimaging technology, such as Electroencephalography (EEG),
Functional Magnetic Resonance Imaging (fMRI), Positron Emission Tomography (PET),
along with other methods that provide improved spatial and temporal resolution to brain
imaging, it is possible for educational neuroscientists and literacy scholars to explore the
neural basis of reading. This allows us to explore the structures of the brain. EEG gauges
electrical activity, fMRI measures the BOLD (Blood-oxygenation level dependent)
signal, and PET measures glucose utilization. These methods provide us with information
about the neuronal activity associated with specific reading processes and their location.
The images of the brain provide increased understanding of the reading pathways and the
development of white matter tracts across the brain when children engage with reading
(Saygin et al., 2013). There have been several attempts to integrate neuroscience and
reading education (e.g., Berninger & Richards 2002; Hruby & Goswami, 2019), to
explore connectivity across regions of the brain, and neural networks. This research
allows educators to better understand the ways in which children learn to read. This
growing body of literature on brain and reading-related processes, provides insights into
neuroscience and reading education (e.g., Martin et al., 2015)
Brain regions associated with phonological analysis and recoding have been the
most substantial area of research within this field (Schlaggar & McCandliss, 2007).

2
Research has also shown the importance of word reading skills and subsequently the
relationship between phonological processing and word reading skills (McCandliss et al.,
2003). Beyond phonological processing and word reading, studies of connectivity across
areas of the brain are beginning to provide a more nuanced understanding of the reading
brain.
Reading is a complex and multidimensional process that engages cognitive,
social-cultural, and the aesthetic processes (Alexander & Jetton, 2000). Human feelings,
connections, and experiences are involved in reading texts (Alexander & Jetton, 2000).
For example, basic aspects of human cognition such as processes of expectation,
anticipation, and prediction are engaged when reading a suspenseful narrative (Lehne et
al., 2015). Interactions among these helps to develop the reader’s knowledge, strategic
processing, and motivation (Alexander & Fox, 2019). Although, complex and
interconnected processes are involved in reading, neuroimaging studies concerning
reading focus on discreet functions and connectivity across the brain. New research
findings cumulatively add to a growing knowledge of the reading brain.
Reading is one of the most vital cognitive skills that an individual can learn
during early childhood. Subsequently, the level of reading is associated with
socioeconomic factors and is a predictor of academic success or failure in the future
(Allington, 2001). Given the increased likelihood of comorbid deficits for those with
reading difficulties, it is crucial for educators and school psychologists to adequately and
efficiently identify children who may need early reading interventions. Despite recent
improvements to the procedures that have been put in place by school systems
3
surrounding the identification of students with specific learning disabilities (SLDs), there
is still much room for growth and improvement.
It is estimated that 5-15 % of students in the United States suffer from a form of
reading disability. The identification of learning disabilities (LDs) in children, guided by
U.S. federal and state legislation, is fraught with problems (Decker et al., 2012; Fletcher
et al., 2007). One of the methods of identification, the IQ-Discrepancy Model, also
referred to as the “wait-to-fail” approach is often deployed when children have already
fallen behind in a school subject area and must catch up to peers through years of
intervention. Response to Intervention (RTI) approach, on the contrary, was designed to
address this problem and improve early identification and obtain better results (Balu et
al., 2015). Additionally, despite the early intervention of the RTI method, the failure to
respond to an intervention does not provide sufficient diagnostic information in
identifying a disability. As such, the potential for supplementary and/or more reliable
methods to identify children with LDs within the school systems, including reading LDs,
exists and should therefore be pursued.
Improper diagnosis and intervention for children with specific learning disabilities
explains the relatively large gap in the neurocognitive literature around these topics.
Despite advancements in the use of neurological markers to identify those with and
without learning disabilities (Alahmadi, 2015), there has been no research investigating
the patterns of brain connectivity to empirically predict reading ability in children. The
current study aims to explore children’s basal neuro-electrophysiological activity to
determine if brain coherence at rest is associated with general reading skills. This
information will help to shed light on the underlying neurocognitive mechanisms

4
fundamental to reading ability and thus, guide future research on performance-based
reading assessment batteries as well as reading interventions for struggling children
Neuroimaging research has revealed the operation of multiple processes across
areas of the brain. Admittedly, neuroimaging research focuses on the study of brain
response times when exposed to stimuli and connectivity across specific areas of the
brain. As a result, neuroimaging investigates discreet functions within the process of
reading and does not provide an overview of the entire reading process. Nevertheless,
even with this limited focus, neuroimaging has revealed distributed and multiple
overlapping processes across multiple brain regions.
Educators across the world are increasingly becoming interested in findings from
neuroscience and how an enhanced understanding of connectivity across regions of the
brain can inform educational practices. This dissertation is an attempt to add to this
project by exploring how coherence across brain regions at rest might be associated with
standardized scores of letter-word identification, reading fluency, passage comprehension
and overall broad reading performance. This research adds to what researchers are
discovering regarding the reading network of the child and its subsequent development as
they learn to read. A review of literature on neuroscience and reading will provide a
detailed background for the dissertation study that follows.
LITERATURE REVIEW
The following section is a systematic review of the extant literature on the
neuroimaging studies of the reading process with focus on three main areas of
knowledge: (1) phonological and visual word form processing, (2) models of the reading
process, and (3) reading development.

5
1.1 ELIGIBILTY CRITERIA
For this dissertation, articles were selected with the help of keywords: reading,
neuroimaging, phonological, literacy, brain, EEG (electroencephalography), fMRI
(functional magnetic resonance imaging), phonemic perception, orthography, word
reading, and reading development in different combinations in subject, title, and keyword
fields. Studies that investigated phonological processing, word reading and their
intersection with neuroimaging were selected for the synthesis.
1.2 LITERATURE SEARCH
The process of identifying studies and literature for this dissertation was designed
to be inclusive of neuroscience, phonological processing and word reading. Using the
PRISMA flow guidelines (see Appendix A) set by Moher et al. (2009), a systematic
literature review was conducted across databases including ERIC, Ed Source,
PsychINFO, and PscyhArticles for years 1980 through 2020. These databases were used
because they specialize in education, psychology, and their intersection with
neuroscience research. Articles were selected from 1980 through 2020 because
educational neuroscience has evolved over these past four decades. Keywords in different
combinations in subject, title, and keyword fields included: reading, neuroimaging,
phonological, literacy, brain, EEG (electroencephalography), fMRI (functional magnetic
resonance imaging), phonemic perception, orthography, word reading, and reading
development. Each abstract was screened to align with the purpose of this dissertation.
Pertinent articles were read, and additional articles were located through bibliographic
branching. This led to inclusion of other research articles in the review to provide a more

6
complete picture of reading and neuroimaging. The final review yielded 52 appropriate
articles.
1.3 ANATOMY OF THE READING BRAIN
The literature on neuroimaging of reading has informed us about the different
brain regions associated with reading and how connectivity develops as children learn to
read. It has also informed us about the underlying sub-processes of reading. These
findings have led to models of the reading brain. Each of these areas are discussed in this
dissertation, with reference to figure 1.1, which illustrates pertinent anatomical regions in
the brain. Below the illustration, functions associated with these brain regions are also
listed (see table 1.1).
Figure 1.1 The Reading Brain

7
Table 1.1 Associated Regions of Interest to Reading and their Functions
Region of the Brain Function
Inferior Prefrontal Cortex Sentence Comprehension
Sensorimotor Regions Semantic Representations
Temporoparietal Cortex Phonological Analysis & Recoding
Occipitotemporal Region Visual Word Form Area
Visual Cortex Recognizing Print
Superior Temporal Gyrus Spoken Word Recognition
1.4 PHONOLOGICAL PROCESSING AND VISUAL WORD FORM PROCESSING
While researchers have identified regions of the brain involved during reading,
connectivity across the regions continues to be explored. One of the things that
researchers largely agree upon is that the temporoparietal cortex is an important region
for phonological processing and recoding (e.g., Fiez & Petersen, 1998; Pugh et al., 1996,
1997; Schlaggar & McCandliss, 2007; Turkeltaub et al., 2002). This process enables the
phonetic decoding of unknown words (Pugh et al., 1996, 1997; Schlaggar & McCandliss,
2007). Furthermore, a phonological network develops during early reading acquisition
and includes phonological, visual, oral, lexical, and semantic pathways (Yu, et al., 2018).
Readers draw upon their visual experiences to represent orthographic units with
the help of the left ventral occipitotemporal cortex, theorized as the “visual word form
area” or VWFA (Dehaene & Cohen, 2011; McCandliss et al., 2003). Through the
retrieval of orthographic whole-word representations (Ludersdorfer et al., 2015),
frequently encountered words are processed without the need for phonological processing
(Glezer et al., 2016). Functional specialization within this area emerges with early
reading acquisition (Pleisch et al., 2019). However, it is not determined if the VWFA is a

8
modality specific area or if there are overlapping areas that are recruited for reading
words (Price et al., 2003).
Understanding rapid and fluent reading is an important goal for reading educators
and neuroimaging researchers. Looking at processing speed, Klein et al. (2015) found a
fast-naming response to target words when the reader is first shown a pseudoword with
the same initial phoneme. This study suggests that in order to process the target word,
orthographic analysis was not necessary. Studies such as this have shown that words can
be rapidly recognized by readers without decoding and neuroscientists are beginning to
understand where and how the brain engages in this rapid processing. Balthasar et al.
(2011) indicated there might be an underlying route of access to word form knowledge.
Neuroanatomical models describe cortical networks for reading that facilitate
orthographic to phonological mapping and elicit word meaning from semantic memory
(McNorgan et al., 2015, Oberhuber et al., 2013). Other studies have reported data that is
best interpreted in terms of interactions between language processing and visual word
form processing (Twomey et al., 2011). This means that the visual word form area and
phonological processing are interconnected during reading. Other areas of the brain also
interact to provide meaning and experience to phonemic and visual subprocesses.
Phonological processing and visual word form processing are part of a reading
network. The reading network refers to linked areas in the brain that are responsive to
semantic, phonological, grapheme, and morpheme structures that map to language.
Becoming a skilled reader requires the gradual building of integrated neuronal pathways
of printed language processing which are in alignment with spoken language processing.

9
A study done by Preston et al. (2015) examined the print-speech coactivation implicated
in the reading network. The results indicated a left hemisphere reading network in
emergent readers that was predictive of later reading development. This indicates that as
children learn to read, they build connections across regions associated with visual and
phonemic processing. Learning to read builds connectivity across brain regions.
The meaning of words and prior experiences are used to recognize words in print.
Reading words and naming pictures involves the association of a visual stimuli with
phonological and semantic knowledge (Buchel et al., 1998). This involves the left interior
prefrontal cortex (Poldrack et al., 1999; Sandak et al., 2004) associated with accessing
meaning. Word processing has been found to be strongly associated with activations in
regions associated with semantic processing. (McNorgan et al., 2015). These studies
describe how the semantic aspect of reading is associated with other areas of the brain
described above and in Figure 1.1 To summarize, semantic processing is important for
readers to be able to comprehend the meaning of the text. Indicating that semantic
comprehension processes are required along with phonological and word decoding skills
in order to fully comprehend a text. This aligns with the connectionist model of reading
development where phonological and semantic processes interact with each other.
1.5 MODELS OF READING
Neuroscientists have proposed a dual-stream model of reading (Pugh et al., 1996;
Sandak et al., 2004). One is a dorsal stream that is critical for extracting relations between
orthography, phonological form, morphological and lexical-semantic dimensions of print.
Another is a ventral stream, a memory-based word form area supporting fluent word
identification (Pugh et al., 2001; Glezer et al., 2016). The dorsal route is involved in word

10
decoding (Fiez & Petersen, 1998; Jobard et al., 2003) and access to phonemes (Wu et al.,
2012), phonological decision-making (Rumsey et al., 1997) and phonological output
(Taylor et al., 2012). The ventral route is engaged with orthographic representations, how
words are represented by letter strings, and is finely tuned to read whole words (Glezer et
al., 2016). Further delineating this area, the insular cortex, an area with connectivity
across cortical and subcortical brain regions, is implicated for both lexical and sub-lexical
reading processes (Borowski, et al., 2006) further implicating the coordination of both
routes during reading. The activation in these areas, specifically phonological and lexical,
confirms the importance of the language network for spelling thus reinforcing the dual
route model of spelling (Norton et al., 2007). Hence the dorsal route with its focus on
phonological processing and word decoding and the ventral route with its focus on
orthographic processing and visual word-form recognition in reading whole words
functions in a coordinated manner in the development of the reading network.
Neuroscientists have studied areas that overlap in activation. Borowski, et al.
(2007) found the perceptual component of reading was unique with very little shared
processing, whereas the analytical component was unique but also involved shared
processing. Perceptual component of reading involves visuospatial information
processing, whereas the analytical component underlines comprehension and semantic
processing. The development of the reading network is shared by the Brocas area and
attention-related brain regions, a word-reading related left temporal lobe participating in
semantic processes, and a pseudoword related basal occipitotemporal region. These
subnetworks propose a functional model of reading where orthographic, phonological,
and semantic processes are recruited to access the most efficient form of reading.

11
In reading words and pseudowords, the processes and areas involved during silent
reading and reading aloud were found to overlap to a large extent (Hagoort et al., 1999).
In reading familiar words, Jobard, et al. (2011) found an orthographic-to-semantic
pathway for skilled readers, while lower skilled readers had greater involvement of
phonological regions. This means that skilled readers connect the spelling pattern in a
word with meaning whereas lower skilled readers rely on letter-sound correspondence.
This indicates that during frequent word reading some of these pathways may function in
an exclusive fashion depending on the proficiency of handling the written material.
However, some studies also show that the dual route model encompassing the dorsal
phonological and ventral orthographic does not hold for pre-readers. (Vanderauwera et
al., 2018). Indicating that the letter-sound correspondence is not yet developed in pre-
readers. These studies suggest there is inter-individual variability in how reading is
processed that may depend on the type of written material and the development of
reading skill.
1.6 READING DEVELOPMENT
Learning to read changes how the brain functions as the reading network builds.
Strong connections across brain regions develop that integrate spoken language with
written language. However, there are individual differences in brain integration among
readers such as the integration of sublexical phonological processing during visual word
recognition (Twomey et al., 2015). This means that there may be differences in readers
using parts of words to recognize words. Fischer-Baum et al. (2017) established
individual differences in word reading, with some participants drawing more on
phonology and some drawing more on semantics. For example, Simos et al. (2005) found

12
that kindergarten students with higher scores on a primary reading inventory evidenced
brain activation similar to older skilled readers who use more semantics or meaning-
based processes for the purpose of reading. Thus, integration of brain regions associated
with phonological, visual, and semantic processing is indicative of greater reading
proficiency.
Children begin to develop a reading network when they are exposed to print and
begin to read (Vanderauwera et al., 2018; Simos et al., 2005). Alcauter et al. (2017) Vas
six. However age-related differences in activation have been found. Young readers use
the left temporo-parietal circuit involved with phonology-based reading, whereas adults
use more whole-word recognition processes (Martin et al., 2015; Sela, et al., 2012;
Shaywitz, et al. 2007). As children develop as readers, they rely less on phonology and
begin to rely more on whole-word recognition in their meta-analysis of reading and
neuroimaging, Martin et al. (2105) show how, with advanced literacy in adults, there is
greater activation in the occipitotemporal cortex when compared to children, who show
significantly more activation in the left superior temporal gyrus, suggesting that for
emergent readers, grapheme-to-phoneme mapping is fundamental (Glezer et al., 2016).
Longitudinal studies contribute to our understanding of neural network development over
time (Horowitz-Kraus et al., 2015; Marosi et al., 1997) These studies show perceptible
increase in coherence across time periods, indicating a strong connection between
coherence in the brain and reading development.
Looking at the neuroimaging studies cited in this literature synthesis, a significant
amount of work has been done concerning phonological processing and word reading,
modelling reading, and reading development. First, readers activate multiple regions of

13
the brain to access the most efficient function for reading a particular text. When
phonological processing is required, such as when encountering an unknown word in an
unfamiliar context, readers activate phonological processing. When the word is familiar,
the visual word form area is activated. To summarize, phonological processing and visual
word form processing are both integral to the reading network which entails areas of
brain responsive to semantic, phonological, grapheme and morpheme structures. A
skilled reader gradually builds this neuronal network in order to integrate print-speech
processing. This has led to neuroimaging studies revealing the interconnections among
brain areas. Educators concerned with the process of learning to read can be informed by
this growing understanding of functional connectivity across different regions of the
brain.
Second, within the field of neuroscience, models have been developed,
questioned, revised, and expanded. Researchers continue to build on the dual-stream
model of reading: a dorsal stream that is critical for extracting relations between
orthography, phonological form, morphological, and lexical-semantic dimensions of
print, and a ventral stream of a memory-based word-form area supporting fluent word
identification (Pugh et al., 2001). This model has been expanded through various studies
to understand the sub-processes at work during reading. Additionally, interactive theories
suggest that transformations occur across areas of the brain and that experience with
language changes the connections between visual, phonological, and semantic
information, with transformations occurring across areas of the brain (Fisher-Baum, et
al., 2017). With increased studies, more nuanced models of the reading brain are
emerging.
14
Third, it has been determined that the reading network develops as children learn
to read. For emergent readers, phoneme-grapheme mapping is fundamental, whereas with
increasing experience with print, later readers use more whole word recognition. With
reading experience, multiple regions of the brain are accessed, depending on the task.
When phonological processing is needed, such as when encountering an unknown word
in an unfamiliar context, the reader will activate phonological processing. When the word
is familiar, the visual word form area is activated. These two processes are activated as
needed during the reading task. If the reader has greater connectivity, both processes are
utilized, and greater reading proficiency is observed. Therefore, educators are necessarily
concerned with providing educational experiences that build connections across regions
of the brain.
Neuroscience researchers have been able to collectively inform our understanding
of reading-related processes. Thus, we take up Hruby’s trifecta challenge (2012) that an
educational neuroscience requires: thorough attention to intellectual coherence; matching
expertise in both neuroscience and educational, research, theory, and practice; and
attention to “ethical issues, concerns, and obligations” (p. 3) related to the general public
and their children. The neuroscientific literature continues to advance our understanding
of reading processes in the brain; however, this literature must be viewed as on-going and
partial as we seek to understand the complex interactions that take place during reading.
Although much has been learned about phonological processing and word reading, it is
clear that these processes are interconnected with other processes that involve memory,
semantic processing, and experiences. Other processes such as sensory motor processing
and emotion have been recently studied but were beyond the focus of this dissertation.

15
These areas of study are at the forefront of neuroscience research in reading. Going
forward, it will be necessary to provide an account of the neuroscience research on
semantic processing, sensory motor processing and emotion for the benefit of reading
educators.
The audience for such research includes educators, neuropsychologists, school
psychologists, and clinical psychologists who deal with reading-related issues. Since
teachers are given the responsibility of educating young minds, it is imperative that they
too, have some working knowledge or understanding about how the brain functions as
they plan instructional interventions for reading (Berninger & Richards, 2002). Teachers’
access to brain research and their experiential knowledge could inform a better
understanding of the process of reading development and how the brain, in turn, is
changed by the capacity to read. Such collaboration would enable reading researchers to
participate in ongoing discussions regarding the implications of teaching reading based
on current neuro-scientific knowledge. As such, this synthesis and future literature on
neuroscience research on reading will lay a foundation to facilitate a dialogue among
reading theory, policy, classroom instruction, and brain research.
1.7 QEEG
Quantitative electroencephalography (qEEG) has an extensive history of being
used to assess underlying brain functions for various neuropsychological disorders. For
example, results from several studies have demonstrated that qEEG measures can
accurately discriminate between individuals who have experienced a Traumatic Brain
Injury (TBI) and those who have not. Thatcher et al. (1989) report that qEEG was able to
differentiate TBI patients from non-TBI patients with 90%-95% accuracy. Further studies

16
utilizing qEEG provide evidence to support its utility for classifying TBI severity with
96% accuracy (Thatcher et al., 2001a). Numerous studies have also utilized qEEG
measures to examine its relationship with measures of intelligence, several of them
reporting significant relationships between coherence and standardized intelligence
measures (Thatcher et al., 2005). Additional studies have further supported utilizing
qEEG for studying neuropsychological differences in individuals with Attention Deficit
Hyperactivity Disorder (ADHD), demonstrating its utility in this domain with several
decades’ worth of literature (Barry et al., 2009; Clarke et al., 1998, 2001; Janzen et al.,
1995; Satterfield et al., 1972).
Despite an extensive history of utilizing qEEG for studying various
neurocognitive phenomena, a relatively small base of literature exists outlining its utility
for examining children’s academic skills and abilities. While recent EEG studies have
begun to focus on children’s reading abilities and disorders (e.g., dyslexia) (Arns et al.,
2007; Lehongre et al., 2013; Rippon & Brunswick, 2000), very few studies examining the
cognitive mechanisms involved in specific reading skills exist.
While reading abilities have been studied for many years within the frame of an
educational context, neurocognitive research on reading abilities is a relatively recent
field of study (Ardila et al., 2016). Recent research literature exploring the utility of
qEEG as it relates to reading skill and ability is scarce, though mounting. Specifically,
this study aimed to evaluate the coherence levels in children with differing reading skill
scores while they performed a reading related task.
Coherence is a type of qEEG analysis often used when examining EEG data (John
et al., 1988; Thatcher et al., 2005a; Thatcher et al., 2001b, 1989). It provides a measure of

17
the phase angle consistency between two brain regions in a set of continuous EEG data
(Thatcher et al., 2005b). Essentially, coherence is a quantitative value representing a
denotation of which regions of the brain are oscillating at the same frequency
simultaneous to one another. Thus, examining the coherence among brain regions can
provide valuable information with regards to functional brain connectivity and cognitive
functioning (González-Garrido et al., 2018). In relation to this it might be important for
us to review the domain-specific model of language to further unpack the reading brain.
1.8 DOMAIN SPECIFIC MODELS
In order to understand functional connectivity in the brain in relation to reading, it
is important to understand the domain-specific model of language. Within the language
system of the brain, there are regions that are involved in reading sequences of words and
non-words that can be pronounced. Despite the fact that reading as a whole may summon
networks other than those associated with spoken language, there is enough evidence to
suggest that there are additional regions which may be activated during reading. Hence
along with the left fronto-temporal- parietal network engaged in reading and language
systems, there are also associated activations in the right hemisphere (Fedorenko, 2014).
This right hemisphere activation in the fronto-temporal region may also account for a
domain-specific language network to include broader language functions like lexicality,
syntax, semantics, and pragmatics despite semantics and pragmatics being classically
associated with cognitive functions (domain-general) that do not involve language
(Campbell & Tyler, 2018). In relation to this, the Brocas area located in the frontal lobe
of the left hemisphere is important for speech production, sensorimotor learning, and
language comprehension. It is made up of two areas: pars opercularis (Brodmann area 44)
18
and pars triangularis (Brodmann area 45). The anterior portion of the Brocas area is
associated with semantics or meaning of words and the posterior region is related to
phonology or the sounding of words. Hence Brocas area is critical to reading. Looking at
the structural architecture of the Brocas area, Fedorenko et al. (2012) found that it
contains both domain-specific (language) and domain-general subregions. This explains
the complex manifestations of the “Brocas aphasia” where several domain general
functions are compromised along with linguistic functions. This necessitates a deeper
dive into the functional organization of the Brocas area (Brodmann area 44 and 45) to
explore functional profiles like reading and other academic skills.
1.9 BRODMANN AREA 44 AND AREA 45 (BA 44 AND BA 45)
Utilizing fMRI, activation in the Broca’s area (BA 44 and BA 45) was observed
during the processing of visually presented words and pseudowords while performing a
phonological decision task (PDT) and a lexical decision task (LDT). These tasks tested
the use of grapheme to phoneme conversion and word recognition. Contrary to the PDT,
the LDT had longer reaction times to pseudowords over words. The researchers
demonstrated that the left BA 44 and BA 45 had a stronger activation during
pseudowords as opposed to words. A separate analysis of the PDT and LDT revealed that
BA 44 was activated during both the tasks, whereas BA 45 was activated only during
LDT. The results support the dual route model of reading with the left BA 44 being
implicated in the grapheme to phoneme conversion and the left BA 45 being explicitly
involved in lexical search. (Heim et al., 2005). Therefore, children with greater
connectivity circuits near BA 44 and BA 45, likely fair better in reading performance
than those that have less. Additionally, studies investigating the neural activations
19
underlying verbal fluency (Amunts et al., 2004), semantic processing (Bookheimer,
2002), lexicality: spelling to sound consistency (Fiez et al., 1999), auditory sentence
processing (Friederici, 2002), pseudoword reading (Herbster et al., 1997), and phonology
and orthography in word reading (Rumsey et al., 1997) implicate the Brodmann area 44
and 45 very heavily. The BA 45 is implicated in semantic aspects of language processing
whereas BA 44 is associated with speech production.
CURRENT STUDY
Children with greater connectivity circuits near BA 44 and BA 45, likely fair
better in reading performance than those that have less. The current study aims to utilize
qEEG to explore children’s reading performance by analyzing default brain activity. The
goal is to determine if the existence of brain networks, and the strength of coherence
within them, is associated with general and specific reading skills as measured through
subtests like letter-word identification, passage comprehension, and reading fluency.
Recent translational research has begun investigating the utility of neurophysiological
resting-state paradigms (Takamura & Hanakawa, 2017). The current study utilizes a
qEEG resting-state paradigm to explore children’s basal electrophysiological brain
activity to determine if coherence values among brain regions at rest are associated with
reading scores. Although task-based EEG and fMRI research on reading assessments
elucidates key brain areas actively involved in completing specific reading tasks, there
are several advantages to resting-state paradigms. For example, to uncover associations
between brain networks and reading performance. This gives us more “stable” data since
the epochs are longer; the resting-state research is more indicative of developmental
differences and how every-day/general brain activity predicts response to

20
stimuli/performance demands as opposed to ERP data. By gathering continuous sets of
EEG data from participants and extracting coherence values, the current study looks
specifically at BA 44 and BA 45 and its intrahemispheric connectivity with the rest of the
brain. Determining brain regions that are significantly coherent with BA 44 and BA 45
allows us to identify specific brain networks that can be likely linked to specific reading
(Ardila et al., 2016). We can then assign variables to each of these networks and
determine if the levels of coherence (connectivity) among them can be utilized to explore
associations with reading skills as measured by standardized reading composite scores of
letter-word identification, passage comprehension and reading fluency from the
Woodcock Johnson-III Test of Achievement (WJ III- Test of Ach).
By obtaining bio-signatures of specific sets of reading skills, such as the ones
outlined above, educational researchers can be better equipped to understand how
children learn to read. Identification of these additional factors implicated in reading
skills may enable a more comprehensive, integrated depiction of an individual student’s
learning trajectory leading to better reading instruction.
To summarize, neuroscience research has described specific brain areas, the
dorsal pathway, and the reading network that are involved in letter and word processing.
It has also highlighted the importance of the visual word form area and the role of reading
development on rapid word retrieval. Finally, it has shown that reading comprehension is
distributed across various brain regions through white matter connections. To understand
how these bio-signatures can help educators with a wider understanding of reading
research in relation to reading scores of children on standardized achievement tests like
Woodcock Johnson III-, I center the following questions:

21
RESEARCH QUESTIONS
1. How is resting-state EEG coherence across regions of the brain associated
with standardized letter-word identification scores from WJ-III, Test of Ach? This
information will provide educators with brain research related to letter-word reading
outcomes.
2. How is resting-state EEG coherence across regions of the brain associated
with standardized reading fluency scores from WJ-III, Test of Ach? This information
will provide educators with brain research related to fluency outcomes.
3. How is resting-state EEG coherence across regions of the brain associated
with standardized passage comprehension scores from WJ-III, Test of Ach? This
information will provide educators with brain research related to reading comprehension.
4. How is resting-state EEG coherence across regions of the brain associated
with standardized broad reading composite scores from WJ-III, Test of Ach? This
information will provide educators with brain research related broad reading
performance.

22
CHAPTER 2
METHODOLOGY
This study is based on archived data from a previous research study that
investigated cognitive profiles in children with math and learning disabilities. In
replicating previous research examining QEEG and academic performance, the current
study followed the analytical methods outlined by Anzalone et al. (2020). Reading and
Math subtests of the Woodcock Johnson III Test of Achievement and resting state qEEG
coherence data were collected. The participant selection criteria were based in part on the
Woodcock Johnson III Math achievement scores. (1) 30 children with math learning
difficulties (2) 30 typically developing children, (3) appropriate age (7-12 years), and (4)
score below the 25th percentile on the WJ-III Ach Math Calculation test and/or Math
Fluency test. Children were excluded from the study if they were deemed to have an
intellectual disability, as determined by their Broad Cognitive Ability score from the WJ-
III Cog falling below the score of 70. Descriptive statistics for the overall sample,
collapsed across both groups are include in Table 2.1.
Table 2.1 Demographic Characteristics
Participants
N 60
Gender (%)
Male 53.3
Female 46.7

23
Age (years)
Mean 9.58
SD 1.38
Ethnicity (%)
Caucasian – Non-hispanic 83.3
African American – Non- hispanic 8.3
Latino, Hispanic, Spanish Origin 1.7
Asian, South-East Asian 6.7
The children were also tested on composite reading measures including letter
word identification, passage comprehension, and reading fluency, from the WJ-III Ach
which did not have any separate inclusion or exclusion criteria.
Hence, data used in my study came from these 60 school- children with the goal
of looking at the full range of standardized reading scores. The recruitment of these
children was done through local advertisements and agencies in the Southeastern part of
United States. Specifically, a school for learning disabilities and tutoring program were
recruited as the primary data collection site. Inclusion criteria: all reading scores and
brain imaging data from the math study, there were no exclusions based on reading
scores.
Table 2.2. Sample Descriptive Statistics for WJ-III Ach Reading Standard Scores
Subtest M SD Min/Max
Letter-word Identification 100.54 16.95 61-135
Reading Fluency 101.54 21.18 44-148
Passage Comprehension 97.61 16.39 55-133
24
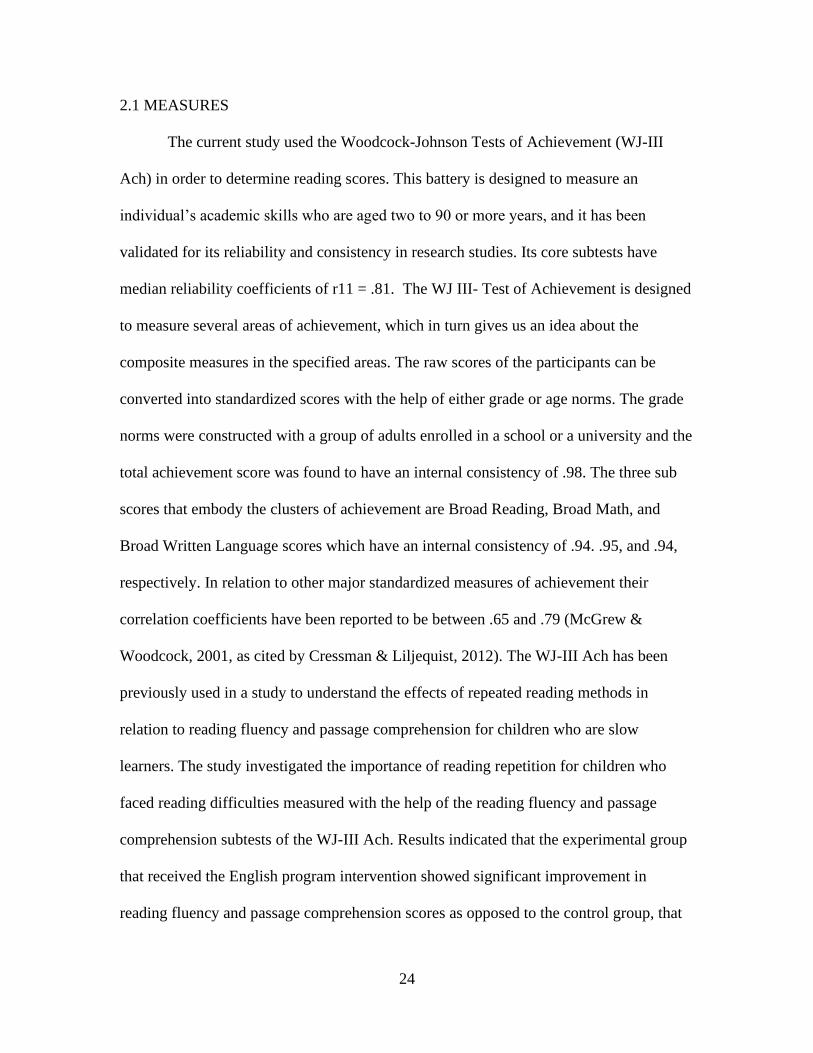
2.1 MEASURES
The current study used the Woodcock-Johnson Tests of Achievement (WJ-III
Ach) in order to determine reading scores. This battery is designed to measure an
individual’s academic skills who are aged two to 90 or more years, and it has been
validated for its reliability and consistency in research studies. Its core subtests have
median reliability coefficients of r11 = .81. The WJ III- Test of Achievement is designed
to measure several areas of achievement, which in turn gives us an idea about the
composite measures in the specified areas. The raw scores of the participants can be
converted into standardized scores with the help of either grade or age norms. The grade
norms were constructed with a group of adults enrolled in a school or a university and the
total achievement score was found to have an internal consistency of .98. The three sub
scores that embody the clusters of achievement are Broad Reading, Broad Math, and
Broad Written Language scores which have an internal consistency of .94. .95, and .94,
respectively. In relation to other major standardized measures of achievement their
correlation coefficients have been reported to be between .65 and .79 (McGrew &
Woodcock, 2001, as cited by Cressman & Liljequist, 2012). The WJ-III Ach has been
previously used in a study to understand the effects of repeated reading methods in
relation to reading fluency and passage comprehension for children who are slow
learners. The study investigated the importance of reading repetition for children who
faced reading difficulties measured with the help of the reading fluency and passage
comprehension subtests of the WJ-III Ach. Results indicated that the experimental group
that received the English program intervention showed significant improvement in
reading fluency and passage comprehension scores as opposed to the control group, that
25
did not receive the intervention. This validates the use of WJ-III Ach reading battery in
evaluation of reading outcomes for children. (Bendak, 2018).
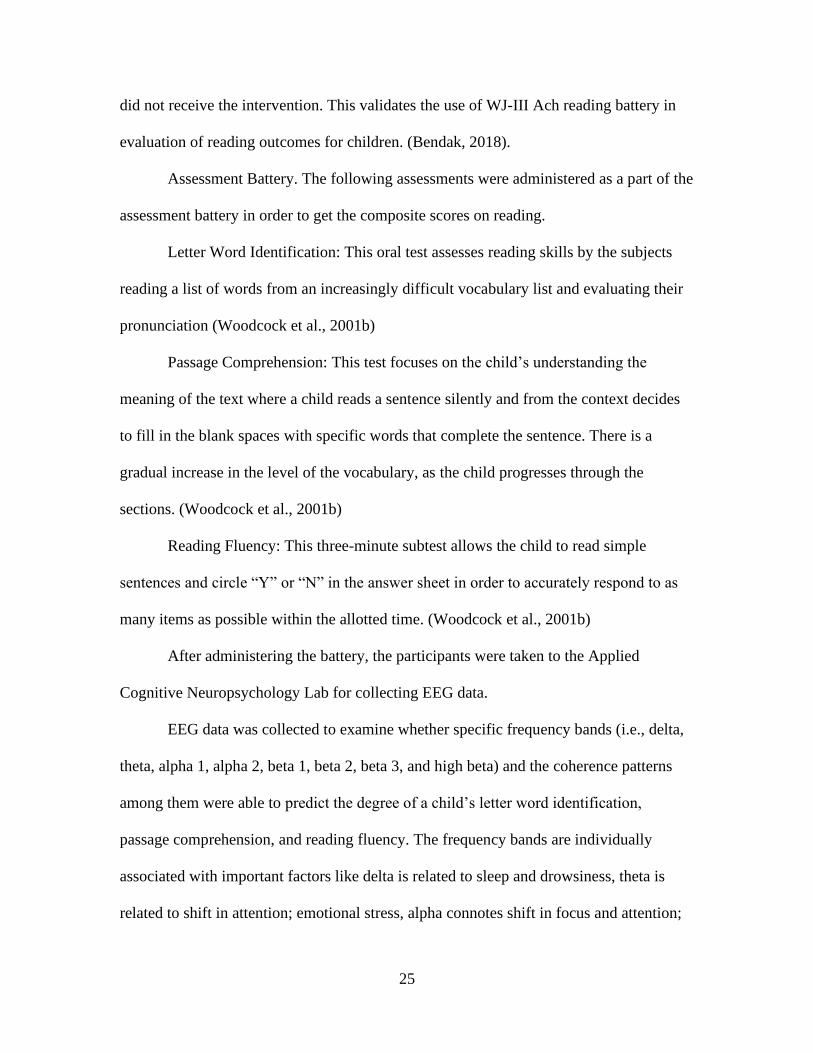
Assessment Battery. The following assessments were administered as a part of the
assessment battery in order to get the composite scores on reading.
Letter Word Identification: This oral test assesses reading skills by the subjects
reading a list of words from an increasingly difficult vocabulary list and evaluating their
pronunciation (Woodcock et al., 2001b)
Passage Comprehension: This test focuses on the child’s understanding the
meaning of the text where a child reads a sentence silently and from the context decides
to fill in the blank spaces with specific words that complete the sentence. There is a
gradual increase in the level of the vocabulary, as the child progresses through the
sections. (Woodcock et al., 2001b)
Reading Fluency: This three-minute subtest allows the child to read simple
sentences and circle “Y” or “N” in the answer sheet in order to accurately respond to as
many items as possible within the allotted time. (Woodcock et al., 2001b)
After administering the battery, the participants were taken to the Applied
Cognitive Neuropsychology Lab for collecting EEG data.
EEG data was collected to examine whether specific frequency bands (i.e., delta,
theta, alpha 1, alpha 2, beta 1, beta 2, beta 3, and high beta) and the coherence patterns
among them were able to predict the degree of a child’s letter word identification,
passage comprehension, and reading fluency. The frequency bands are individually
associated with important factors like delta is related to sleep and drowsiness, theta is
related to shift in attention; emotional stress, alpha connotes shift in focus and attention;

26
beta is related to problem solving and memory, and gamma indicates learning, cognition
and processing. EEG data was recorded from 19 channel electrodes distributed across the
scalp using the 10/20 standard placement methods, via electro-caps by Electro-cap
International (See Figure 2.1). The standard placement of each of the 19 electrodes are as
follows: FP1 and FP2 are electrodes placed over the prefrontal cortex, while F3, F4, F7,
and F8 are electrodes placed over the frontal lobe. Electrodes T3, T4, T5, and T6 are
placed over the temporal lobe, while the parietal lobe has electrodes P3 and P4. O1 and
O2 are placed over the occipital lobe. FZ, CZ, and PZ measure midline brain activity,
while C3 and C4 are placed between the temporal lobe to measure centro-temporal brain
activity. Finally, A1 and A2 within Figure 2.1 represent ground leads (i.e., ear clips)
Data were sampled at 1026 Hz using a BrainMaster Discovery 24E amplifier. This device
is used due to its FDA approval classification as well as its compatibility with the
Neuroguide program 6.6.4 (Thatcher, 2011). A 60Hz notch filter was used to remove
electrical interference/signal caused by electronics from the surrounding environment and
the bandwidth range was set to record frequencies between 1.0 and 30 Hz. The frequency
bands used in this study are defined as follows: delta (1.0 - 4.0 Hz), theta (4.0 - 8.0 Hz),
alpha 1 (8.0 -10.0 Hz), alpha 2 (10.0 - 12.0 Hz), beta 1 (12.0 - 15.0 Hz), beta 2 (15.0 -
18.0 Hz), beta 3 (18.0 - 25.0 Hz), and high-beta (25.0 - 30.0 Hz). Impedance values ear
reference electrodes were kept below 5KΩ, and all other electrode impedance values
were kept below 10KΩ for all subjects. The quality of connection of the electrodes to the
scalp was measured by the amount of electrical impedance found. Additionally, ear
references can be broadly used for recording the electrical activity at non-brain sites close
to the brain so that we can determine a general “baseline” of electrical activity in the area

27
that is not attributed to brain activity. Neuroguide 6.6.4 (Thatcher, 2011) was used for
removing EEG artifact in the data and to obtain normative values of qEEG spectral
coherence. MATLAB 2018a (MATLAB, 2018) was used for data transformation and
organization.
2.2 PROCEDURES
Data used in the current study was derived from a prior research study aimed at
examining the relationships between brain function, math performance and anxiety. Prior
to conducting the study, approval to perform the research procedures was granted from
the University of South Carolina’s institutional review board. Participants were provided
child assent and parental consent forms and signatures were obtained. Preliminary
measures of reading skills, mathematical skills and cognitive abilities were obtained from
participants who agreed to partake in the study. Specifically, the WJ-III Ach and WJ-III
Cog measures were administered. Data from participants who met the study eligibility
criteria were retained and EEG data were recorded.
EEG recordings were obtained by fitting the participants with their appropriately
sized Electro-Cap and ground leads. The recordings were collected over three-minute
intervals while the participants were awake, at rest, with their eyes closed. All data used
for the current study was collected over the course of one to two study sessions. This
method of collecting resting-state data was used due to the advantages it offers for young
participants, specifically, three minutes is a relatively short amount of time for a child to
remain still and calm, but still allows for the adequate collection of qEEG data for
coherence analyses. Furthermore, having participants close their eyes does not
significantly impact brain activity in brain regions unrelated to visual processing, and
28
having eyes closed during an EEG recording provides a method to reduce common EEG
artifact associated with eye muscle movements (Barry et al., 2007). Following data
collection procedures, participant data was de-identified (i.e., participants’ names were
replaced with study ID numbers) to protect their confidentiality.
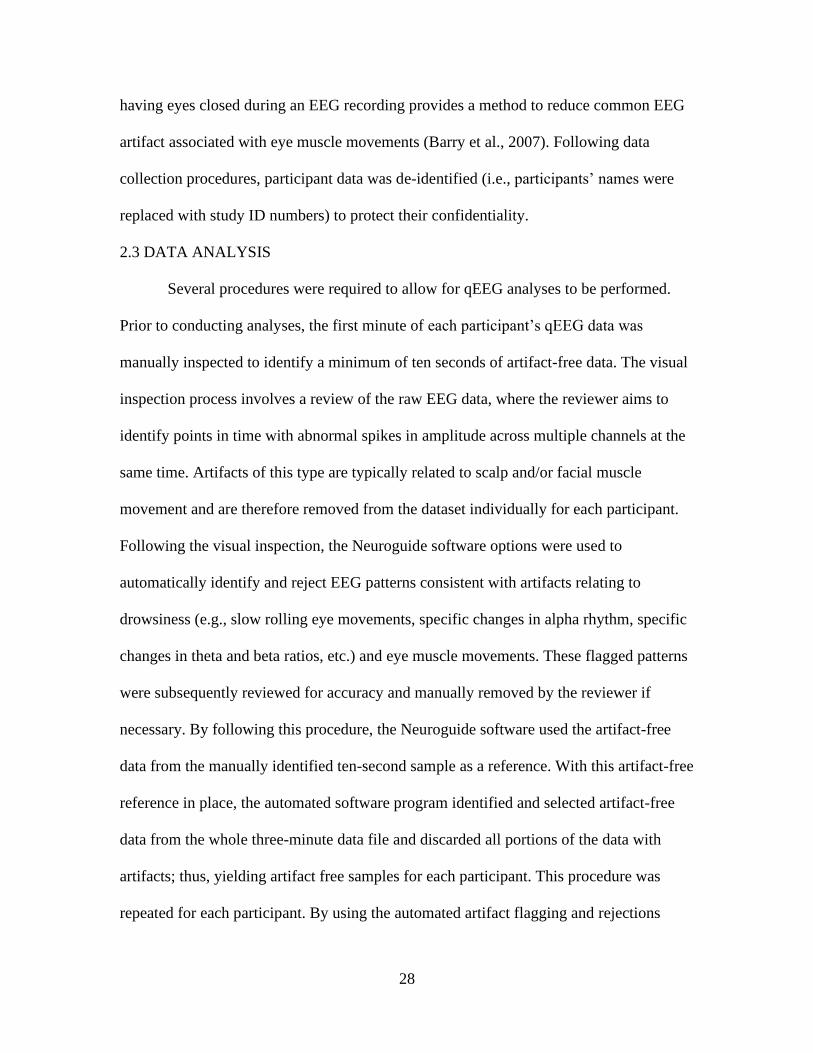
2.3 DATA ANALYSIS
Several procedures were required to allow for qEEG analyses to be performed.
Prior to conducting analyses, the first minute of each participant’s qEEG data was
manually inspected to identify a minimum of ten seconds of artifact-free data. The visual
inspection process involves a review of the raw EEG data, where the reviewer aims to
identify points in time with abnormal spikes in amplitude across multiple channels at the
same time. Artifacts of this type are typically related to scalp and/or facial muscle
movement and are therefore removed from the dataset individually for each participant.
Following the visual inspection, the Neuroguide software options were used to
automatically identify and reject EEG patterns consistent with artifacts relating to
drowsiness (e.g., slow rolling eye movements, specific changes in alpha rhythm, specific
changes in theta and beta ratios, etc.) and eye muscle movements. These flagged patterns
were subsequently reviewed for accuracy and manually removed by the reviewer if
necessary. By following this procedure, the Neuroguide software used the artifact-free
data from the manually identified ten-second sample as a reference. With this artifact-free
reference in place, the automated software program identified and selected artifact-free
data from the whole three-minute data file and discarded all portions of the data with
artifacts; thus, yielding artifact free samples for each participant. This procedure was
repeated for each participant. By using the automated artifact flagging and rejections

29
programs housed within the software several unique advantages are offered compared to
other methods. These methods are reliant upon objective quantitative values within each
participant’s dataset, as such, this more objective method of data cleaning removes the
potential for confounding inconsistencies when rejecting EEG artifact for each
participant.
Coherence measures between electrodes were obtained through qEEG
Neuroguide automated processes. The Neuroguide software contains a database with
information from 625 individuals, covering the age range two months to 82.6 years
(Johnstone & Gunkelman, 2003), pp. 42-43). By sourcing this database, Neuroguide
yields reports, which provide coherence values in raw Z-score units. Utilizing
standardized coherence values, discrepancies in coherence due to age-
related/developmental differences can be minimized. A subsequent automated procedure
utilizing Low Resolution Electromagnetic Tomography (LORETA) was performed in
Neuroguide to convert the data into a format that will produce standardized coherence
values between each of the 52 Brodamnn areas (BA) in either hemisphere.
LORETA is one of the most extensively used algorithms for localizing the source
of EEG signal detected on the scalp (Grech et al., 2008). By running the LORETA
program on the EEG dataset from this study, 3-dimensional statistical maps were
generated to model the distribution of brain coherence values. LORETA attributes
electrode activity to specific BAs by plotting the points on a standardized MRI atlas, it
has demonstrated its ability to provide accurate estimations of activity in subcortical
structures with better temporal resolution than can be provided by PET or fMRI (Pascual-
Marqui et al., 1994). This study utilized the LORETA program to convert the obtained

30
values of coherence between scalp electrodes into coherence values between each of the
52 BAs in each hemisphere. Ardila et al. (2016) proposed a neurological model based on
fMRI findings that suggests that BA 44 and BA 45 are heavily implicated in reading
ability. By obtaining models of EEG activity based on a Magnetic Resonance Imaging
(MRI) atlas, the current study used the findings by Ardila et al. (2016) to provide a
framework from which the subsequent analyses were predicated.
Following Ardila et al. (2016) report that BA 44 and BA 45 are crucial for reading
ability, MATLAB 2018a (Mathworks, Inc., 2018) was utilized to extract the coherence
data between BA 44, BA 45, and all other BAs from the full dataset. This data was then
exported to Microsoft Excel and IBM SPSS (version 24; IBM SPSS Statistics for
Windows, 2017) for final analyses.
Using IBM SPSS (IBM SPSS Statistics for Windows, 2017), coherence values
were collapsed across all participants for each BA. Principle component analyses (PCA)
with varimax rotation was applied individually to coherence values across each frequency
band of interest (delta, theta, alpha 1, alpha 2, beta 1, beta 2, beta 3, and high beta) for
BA 44, and BA 45 in the left hemisphere then separately for each frequency for BA 44,
and BA 45 in the right hemisphere to the rest of their respective hemispheres. PCA was
applied in order to reduce the number of EEG coherence variables and efficiently extract
the essential features from it, thus facilitating a more accurate interpretation of the
coherence properties between brain regions in either hemisphere. PCA is a traditional
method that has been used in EEG analysis due to the high number of variables it
produces and has been used previously to achieve similar analytic goals (Vigário et al.,
2000). Only components whose Kaiser-Meyer-Olkin (KMO) measure of sampling

31
adequacy was above the recommended value (KMO = .60) ((Dziuban & Shirkey, 1974),
and had eigenvalues greater than 1.0 (Gorsuch, 1983; Stevens, 1996), and passed the
scree test (Bro & Smilde, 2014) were considered for ensuing analyses.
Once the PCA results were obtained for BA 44 and BA 45, across various
frequencies in both hemispheres, bivariate Pearson’s correlation coefficients were
computed to quantify the correlation between these EEG coherence parameters and the
standardized letter-word identification, reading fluency, passage comprehension and the
broad reading composite scores. In a regression analysis we predict scores on one
variable from the scores on a second variable. The variable we are predicting is called a
criterion variable and, in this case, it is the individual scores on the tests. The variable
upon which we base our prediction is called a predictor variable and, in this case, it is the
QEEG coherence value of the individual participants. When there is only one predictor
variable the prediction method is called a simple linear regression and when there is more
than one predictor variable it is called a multiple linear regression. This study uses both
the methods to predict models for the three reading subtest scores and broad reading
performance scores. After the construction of the multiple regression model there are 3
key descriptive statistics that we would consider: β is the standardized coefficient, p is the
significance value, and F is the F statistics. F is a statistical value that sees if the factors I
am considering in the model make the model a good fit or not to explain the
phenomenon. The QEEG coherence components that were significantly correlated with
the three subtests (p <.05) were considered in subsequent regression analyses to assess
their association with the reading subtest score separately. Lastly, each of the significant
coherence components were used in a multiple regression model with broad reading and

32
broad math composite scores to determine if observed coherence components were
specifically associated with reading, or academic ability more generally (i.e., discriminant
validity).
Figure 2.1 10/20 Electrode Placement

33
CHAPTER 3
RESULTS
The present study sought to explore qEEG connectivity across regions of the brain
in school-aged children in relation to their reading performance on the WJ III- Ach, a
norm-referenced achievement test. The major reason for undertaking this study was to
investigate whether the coherence patterns at rest in the brain are associated with
children’s reading scores. QEEG measures of coherence can provide us with bio-
signatures that might be exclusively associated with a child’s reading scores.
The findings can be summarized using the following major pointers. First, there
were activations in frontotemporal lobe, occipital lobe, temporo-parietal lobe, and
occipitotemporal lobe, and these activations were significantly correlated with each other
(see figure 1.1). This was an expected outcome since prior neuroimaging research on
activations in these areas have been associated with reading. Second, the derived qEEG
coherence regions across five coherence components were associated with letter-word
identification, reading fluency, and passage comprehension subtests of the WJ-III- Ach
(see table 3.6). Third, the derived qEEG coherence regions across the five components
were associated with broad reading composite scores (see table 3.5. Finally, the derived
coherence components of interest to reading are not associated with broad math
composite scores, hence indicate domain specific activation (see Table 3.7). This ruled
out the possibility of shared activation for regions of the brain associated with Reading
and Math. Indicating that the derived components associated with reading hypothetically,

34
show a linear relationship with the reading scores and satisfy a broad Reading score
regression model but not the broad Math score model.
This chapter presents the principal components analysis, then the descriptive
statistics from the Woodcock-Johnson Reading Achievement Test. This is followed by
the bivariate Pearson's correlation analysis, the linear multiple regression analysis used in
understanding whether the five derived coherence components are associated with
individual reading subtest scores and broad reading composite scores. Finally,
discriminate validity related to Woodcock-Johnson Math Achievement results will be
presented.
In order to analyze the dataset, first I reduced the entire dataset from thousands of
variables to 128 variables without compromising on the information contained in the
original dataset. For doing this I conducted 32 Principal Component Analyses (PCA)
with the entire dataset. 16 of those PCA's were for Brodmann area 44 with eight in each
hemisphere representing the eight frequency bands of interest within that region. The
other 16 PCA’s were conducted on the Brodmann area 45 with eight in each hemisphere
representing the eight frequency bands of interest within that region. Once these 32
PCA's were done, each of them yielded 4 coherence components which could be of
interest to reading primarily based on the fact that they were extracted from Brodmann
area 44 and 45 which, from research, we are aware, is implicated in the reading process.
These four components from each of the PCA models explained more than 60% of the
variance in the data indicating that 60% of the attributes of the variables could be
correlated to reading. These components with their percentage of variance are an
intermediate product to reduce the data and arrive at the final coherence components that

35
could be of importance to reading. However, since the neuroimaging data was not
collected during the reading task, this is primarily an assumption of the model that they
are related to reading. Having said that, we do know that this process reduces the
dimensionality of the dataset without intrinsically changing the nature and the efficacy of
the data. Hence, it still becomes a true representation of the original dataset and avoids
loss of information as much as possible. To summarize, the principal component analysis
is another representation of the original dataset- a dimension-reduced version. Since I am
reducing the dimension of the dataset, I am bound to lose some information. The loss of
information can be quantified by the explanation of the variance in my dataset. The
original dataset explains 100% of the variance but since I reduced the dimension of the
dataset, it explains less than 100% of the variance, but still enough to consistently reflect
the true data.
Once I had a more manageable dataset, I could individually put these 128
coherence components in a bivariate Pearson’s correlation model with the three
individual reading subtest scores and see which of these components are correlated to the
reading subtest scores. The results of the Pearson’s correlation revealed five different
coherence components that were correlated to at least two of the three reading subtest
scores. Now, these components could be attributed to being reading components since
they satisfy the Pearson’s correlation model due to their association with reading scores.
These five components are then put together in a linear multiple regression model to see
if they are associated with the individual subtests and the broad reading composite scores.
Through this regression analysis we can infer if there is enough variance in these models
to be associated with broad reading performance in children. These components are then

36
used again to see if they are associated with broad math performance scores from the
same dataset, to confirm the idea of discriminant validity. This information helps us in
understanding if the five extracted components from the whole dataset are specifically
associated with reading or are associated with other general academic skills like math
performance.
Descriptive statistics for all participants’ scores on the WJ-III Ach reading
subtests including means, standard deviations, minimum scores, and maximum scores
have already been reported in Table 2.2. Examination of the descriptive statistics
indicates that the current study included a sample of participants whose reading
achievement scores are generally representative of the range of scores observed in the
sample. In case of letter word identification, the range of scores varied from a minimum
of 61 to a maximum of 135; the reading fluency scores varied from a minimum of 44 to a
maximum of 148; and the passage comprehension scores varied from a minimum of 55 to
a maximum of 133 (see table 2.2).
3.1 PRINCIPAL COMPONENTS ANALYSIS
A Principal Components Analysis (PCA) was conducted to reduce the number of
items into components that represent the data. Measures of sampling adequacy revealed
no issues with the factorization of the correlation matrix. Components with eigenvalues
greater than 1.0, that passed the scree test, and had a Kaiser-Meyer-Olkin measure
(KMO) value greater that .60 were extracted separately for each frequency bands in both
brain hemispheres. The scree plot identified a 4-8 component solution for the PCA’s. On
further examination, these three parameters were tested, but I selected a four-component
solution, based on interpretability and reliability (see table 3.1 and 3.2). Varimax rotation

37
was chosen because it aids interpretation when the components are to be used as
dependent variables (Tabachnick & Fidell, 2001). Complex loading items (i.e., those that
loaded on more than one component) and items that did not load >.40 on any of the
components were deleted. The remaining items again underwent PCA, and items with
low or complex loadings were deleted. Table 3.1 and 3.2 lists all components that were
extracted form Brodmann Area 44 and 45 meeting these criteria for each wavelength by
hemisphere with the percent of variance explained by the Eigenvalue of that component.
3.2.1 ASSOCIATIONS WITH READING PERFORMANCE
Brodmann area 44 and 45 anatomically constitute the Broca’s area. A
neuromorphometric analysis of the Broca’s area suggests that there is a clear anatomical
separation between BA 44 and BA 45 (Amunts et al., 1999; Brodmann, 1909). Years of
FMRI research has indicated that the two areas are indeed functionally separable.
Brodmann area 44 has been usually found to be activated during syntactic tasks (e.g.,
Friederici et al., 2000a, Friederici et al., 2000b) whereas Brodmann area 45 has been
found to be involved in semantic processing (Friederici et al., 2000b). The reasons for
extracting components from this region entail a direct correlation to reading skills.
However, since this EEG data were collected during rest and not while performing a
reading task, we cannot essentially attribute all the correlated components to reading.
Having said that, using the method of statistical analysis, we can create a model, whereby
we can explore, if the first four extracted components, from this region can generally
explain more than 60% of the variance in the data set. Implying, that these four variables
(principal components of the PCA’s) possibly constitute 60% of the reading-related
functions.

38
Functional Magnetic Resonance Imaging (fMRI) research on Broca’s area has
already shown that left Brodmann area 44 and 45 have strong activations during
pseudoword reading as opposed to words and BA 44 is activated during phonological and
lexical tasks whereas BA 45 is only activated during lexical tasks. Subsequently, this
finding supports the dual route model theory of reading with the left BA 44 being
involved in the grapheme to phoneme manipulation whereas the left BA 45 being
exclusively associated with lexicality (Heim et al., 2005). Overall, this supports the idea
that children with greater connectivity circuits across BA 44 and 45 would perform better
in reading than those who have lesser connectivity.
3.2.2 BRODMANN AREA 44 EXTRACTED COMPONENTS
In the right hemisphere, several components that included BA 44 were identified
in each frequency band. Within the alpha 1 band, the first four components were
extracted based on the criteria above. Initial Eigenvalues for these four components
indicated that they explained 65%, 13%, 5%, and 4% of the variance, respectively.
Within the alpha 2 band, the first four components were extracted. Initial Eigenvalues for
these four components indicated that they explained 50%, 21%, 9%, and 5% of the
variance, respectively. The beta 1 band also had four components extracted. The
eigenvalues for these components signified that they explained 22%, 20%, 12%, and 10%
of the variance respectively. The beta 2 band had an additional four components extracted
based on the criteria outlined above. These components’ initial Eigenvalues explained
29%, 20%, 12%, and 9% of the variance, respectively. Within beta 3 band, four
components were extracted; their initial Eigenvalues explained 36%, 24%, 8%, and 7%
of the variance respectively. In the high-beta frequency band, four components were

39
extracted. The initial Eigenvalues for these four components explained 37%, 23%, 6%,
and 5% of the variance, respectively. Within the Theta band four components were
extracted. Their initial Eigenvalues explained 24%, 22%, 13%, and 10% of the variance
respectively. Delta was the final frequency band examined in the right hemisphere; four
components were extracted. They explained 39%, 16%, 9%, and 6% of the variance,
respectively.
The left hemisphere analyses also identified several components that included BA
44 in each frequency band. Within the alpha 1 band, the first four components were
extracted based on the criteria outlined above. Eigenvalues for these four components
indicated that they explained 55%, 17%, 9%, and 5% of the variance, respectively.
Within the alpha 2 band, the first four components were extracted. Eigenvalues for these
four components indicated that they explained 51%, 21%, 9%, and 6% of the variance,
respectively. The beta 1 band had four components extracted. The eigenvalues for these
components signified that they explained 31%, 23%, 15%, and 12% of the variance,
respectively. The beta 2 band had a total of four components extracted. These
components explained 28%, 25% 11%, and 10% of the variance, respectively. Within the
beta 3 band, four components were extracted; they explained 38%, 21%, 9%, and 6% of
the variance, respectively. In the high-beta frequency band, four components were
extracted. These four components explained 32%, 24%, 9%, and 8% of the variance,
respectively. The theta frequency band yielded an additional four components. These
components explained 31%, 22%, 14%, and 9% of the variance, respectively. Lastly
within the delta band, four components were also extracted. They explained 51%, 11%,
7%, and 7% of the variance.
40
3.2.3 BRODMANN AREA 45 EXTRACTED COMPONENTS
In the right hemisphere, several components that included BA 45 were identified
in each frequency band. Within the alpha 1 band, the first four components were
extracted based on the criteria above. Initial Eigenvalues for these four components
indicated that they explained 62%, 15%, 6%, and 4% of the variance, respectively.
Within the alpha 2 band, the first four components were extracted. Initial Eigenvalues for
these four components indicated that they explained 49%, 21%, 9%, and 5% of the
variance, respectively. The beta 1 band also had four components extracted. The
eigenvalues for these components signified that they explained 32%, 18%, 11%, and 8%
of the variance respectively. The beta 2 band had an additional four components extracted
based on the criteria outlined above. These components’ initial Eigenvalues explained
36%, 20%, 11%, and 7% of the variance, respectively. Within beta 3 band, four
components were extracted; their initial Eigenvalues explained 33%, 26%, 12%, and 7%
of the variance respectively. In the high-beta frequency band, four components were
extracted. The initial Eigenvalues for these four components explained 36%, 24%, 7%,
and 6% of the variance, respectively. Within the Theta band four components were
extracted. Their initial Eigenvalues explained 29%, 22%, 14%, and 7% of the variance
respectively. Delta was the final frequency band examined in the right hemisphere; four
components were extracted. They explained 41%, 15%, 9%, and 6% of the variance,
respectively.
The left hemisphere analyses also identified several components that included BA
45 in each frequency band. Within the alpha 1 band, the first four components were
extracted based on the criteria outlined above. Eigenvalues for these four components

41
indicated that they explained 52%, 19%, 8%, and 5% of the variance, respectively.
Within the alpha 2 band, the first four components were extracted. Eigenvalues for these
four components indicated that they explained 51%, 21%, 8%, and 6% of the variance,
respectively. The beta 1 band had four components extracted. The eigenvalues for these
components signified that they explained 28%, 22%, 12%, and 10% of the variance,
respectively. The beta 2 band had a total of four components extracted. These
components explained 30%, 25% 13%, and 7% of the variance, respectively. Within the
beta 3 band, four components were extracted; they explained 42%, 21%, 11%, and 6% of
the variance, respectively. In the high-beta frequency band, four components were
extracted. These four components explained 37%, 17%, 10%, and 5% of the variance,
respectively. The theta frequency band yielded an additional four components. These
components explained 29%, 20%, 12%, and 10% of the variance, respectively. Lastly
within the delta band, four components were also extracted. They explained 59%, 8%,
7%, and 5% of the variance.
Table 3.1 Extracted components and Eigenvalue variance explained for Brodmann Area
44
Left Right
Wavelength
Variance
Explained Wavelength
Variance
Explained
Alpha 1 Alpha 1
Component 1 55% Component 1 65%
Component 2 17% Component 2 13%
Component 3
Component 4
9%
5%
Component 3
Component 4
5%
4%
Alpha 2 Alpha 2
Component 1 51% Component 1 50%
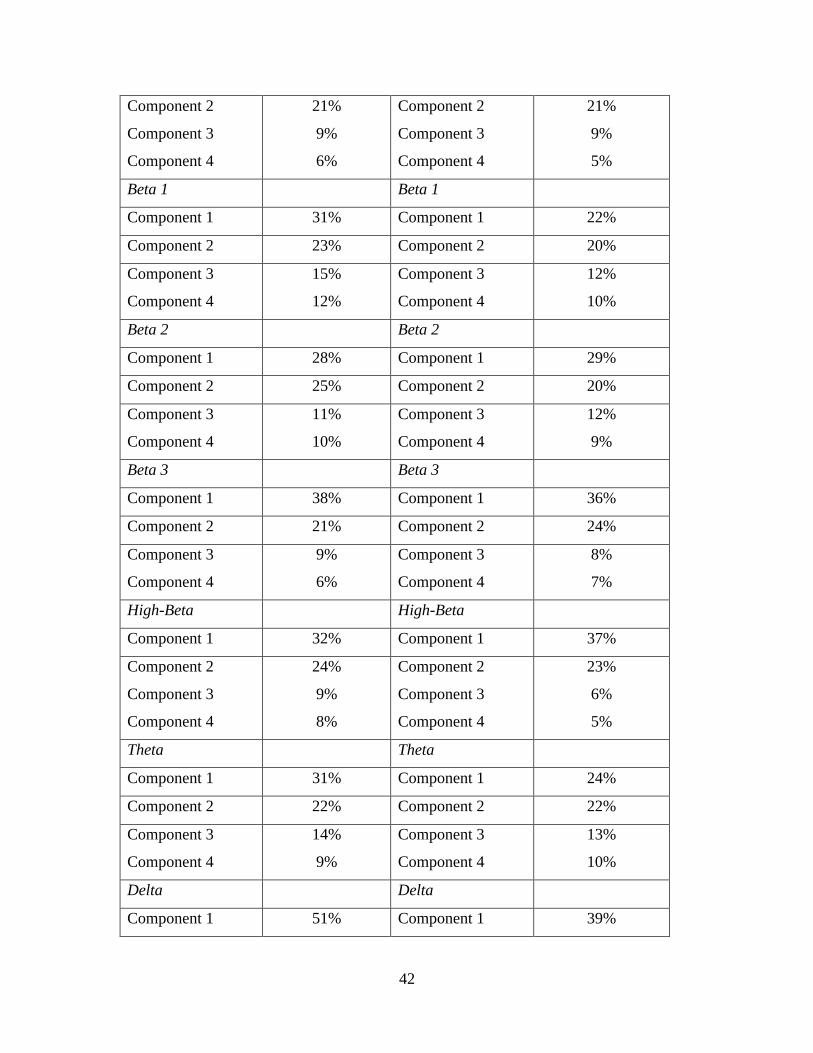
42
Component 2
Component 3
Component 4
21%
9%
6%
Component 2
Component 3
Component 4
21%
9%
5%
Beta 1 Beta 1
Component 1 31% Component 1 22%
Component 2 23% Component 2 20%
Component 3
Component 4
15%
12%
Component 3
Component 4
12%
10%
Beta 2 Beta 2
Component 1 28% Component 1 29%
Component 2 25% Component 2 20%
Component 3
Component 4
11%
10%
Component 3
Component 4
12%
9%
Beta 3 Beta 3
Component 1 38% Component 1 36%
Component 2 21% Component 2 24%
Component 3
Component 4
9%
6%
Component 3
Component 4
8%
7%
High-Beta High-Beta
Component 1 32% Component 1 37%
Component 2
Component 3
Component 4
24%
9%
8%
Component 2
Component 3
Component 4
23%
6%
5%
Theta Theta
Component 1 31% Component 1 24%
Component 2 22% Component 2 22%
Component 3
Component 4
14%
9%
Component 3
Component 4
13%
10%
Delta Delta
Component 1 51% Component 1 39%

43
Component 2
Component 3
Component 4
11%
7%
7%
Component 2
Component 3
Component 4
16%
9%
6%
Table 3.2 Extracted components and Eigenvalue variance explained for Brodmann Area
45
Left Right
Wavelength
Variance
Explained Wavelength
Variance
Explained
Alpha 1 Alpha 1
Component 1 52% Component 1 62%
Component 2 19% Component 2 15%
Component 3
Component 4
8%
5%
Component 3
Component 4
6%
4%
Alpha 2 Alpha 2
Component 1 51% Component 1 49%
Component 2
Component 3
Component 4
21%
8%
6%
Component 2
Component 3
Component 4
21%
9%
5%
Beta 1 Beta 1
Component 1 28% Component 1 32%
Component 2 22% Component 2 18%
Component 3
Component 4
12%
10%
Component 3
Component 4
11%
8%
Beta 2 Beta 2
Component 1 30% Component 1 36%
Component 2 25% Component 2 20%
Component 3
Component 4
13%
7%
Component 3
Component 4
11%
7%
Beta 3 Beta 3

44
Component 1 42% Component 1 33%
Component 2 21% Component 2 26%
Component 3
Component 4
11%
6%
Component 3
Component 4
12%
7%
High-Beta High-Beta
Component 1 37% Component 1 36%
Component 2
Component 3
Component 4
17%
10%
5%
Component 2
Component 3
Component 4
24%
7%
6%
Theta Theta
Component 1 29% Component 1 29%
Component 2 20% Component 2 22%
Component 3
Component 4
12%
10%
Component 3
Component 4
14%
7%
Delta Delta
Component 1 59% Component 1 41%
Component 2
Component 3
Component 4
8%
7%
5%
Component 2
Component 3
Component 4
15%
9%
6%
3.3 PEARSONS CORRELATION
Pearson’s correlations were used to examine the linear relationships between the
extracted EEG components (Table 3.1 and 3.2) and their correlations with WJ-III Ach
reading scores. The results of the analyses and indicates that there was a total of five
reading coherence components that were significantly correlated with at least two of the
three reading achievement standard scores; there were a total of 12 positive and
significant correlations between the five extracted components and the three WJ-III
reading scores (see table 3.3 and 3.4). The aim for this analysis was to identify significant

45
correlations for subsequent regression analyses. Table 3.3 and 3.4 depict correlations
between the identified coherence components and each of the WJ III-Ach reading
subtests in BA 44 and BA 45, respectively.
For BA 44, in the right hemisphere (RH) there were significant positive
correlations (p<.05) between two components (one component in theta and one
component in beta 2) and all three WJ-III reading achievement standard scores.
Component number two in the theta band had significant correlations with two reading
subtests (Letter-word Identification r (54) =0.340, p < .05, Reading Fluency r (58)
=0.305, p < .05) and was not correlated to Passage Comprehension. Component number
three in the beta 2 band had significant correlations with all the three reading subtests
(Letter-word Identification r (54) = -0.273, p < .05 and Reading Fluency r (54) = -0.325,
p < .05, and Passage Comprehension r (54) = -0.325, p < .05)
In the left hemisphere (LH), there were significant positive correlations (p<.05
and p<.01) among one additional component (in the delta band) and at least two of the
three WJ-III reading achievement standard scores. Component number two in the delta
band had significant correlations with the Reading Fluency and Passage Comprehension
subtests, but not Letter-word Identification (Reading Fluency r (54) = 0.271, p < .05 and
Passage Comprehension r (58) =0.356, p < .01).
Table 3.3 Significant Pearson’s Correlations between PCA components reading tests in
BA 44.
Letter-word
Identification
Reading
Fluency
Passage
Comprehension
BA 44, Delta, LH, Component
2
.258 (.060) .271 (.047) * .356 (.008) **
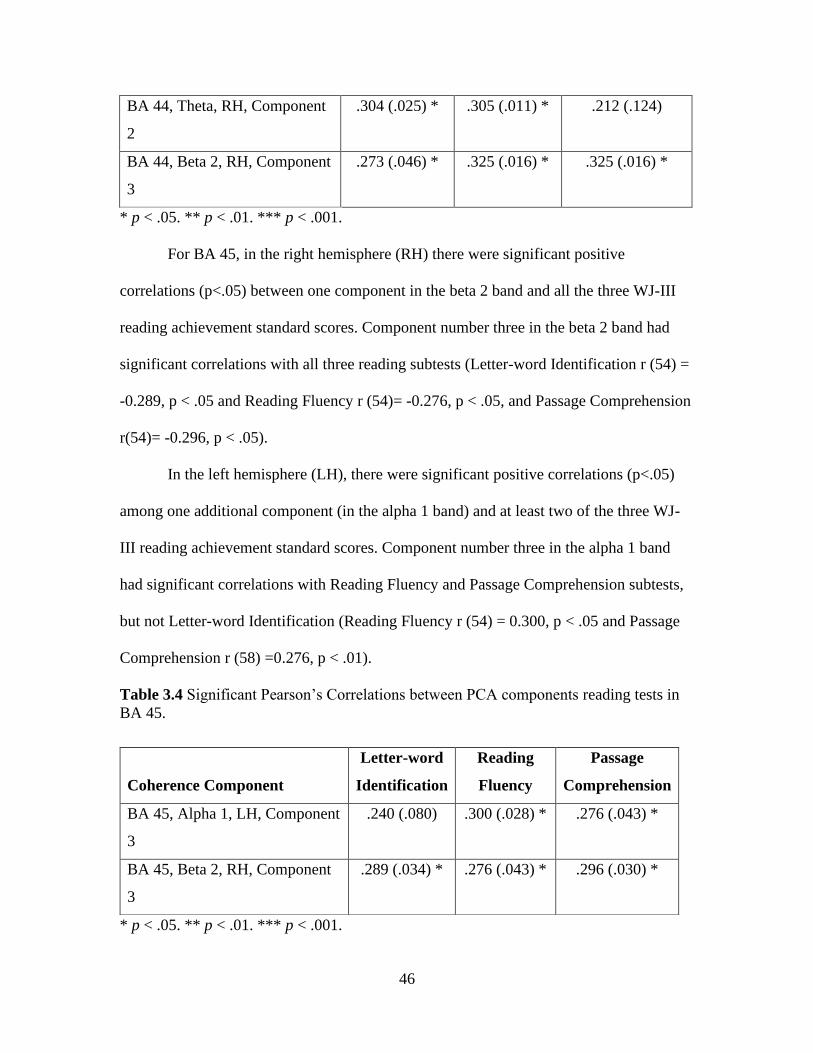
46
BA 44, Theta, RH, Component
2
.304 (.025) * .305 (.011) * .212 (.124)
BA 44, Beta 2, RH, Component
3
.273 (.046) * .325 (.016) * .325 (.016) *
* p < .05. ** p < .01. *** p < .001.
For BA 45, in the right hemisphere (RH) there were significant positive
correlations (p<.05) between one component in the beta 2 band and all the three WJ-III
reading achievement standard scores. Component number three in the beta 2 band had
significant correlations with all three reading subtests (Letter-word Identification r (54) =
-0.289, p < .05 and Reading Fluency r (54)= -0.276, p < .05, and Passage Comprehension
r(54)= -0.296, p < .05).
In the left hemisphere (LH), there were significant positive correlations (p<.05)
among one additional component (in the alpha 1 band) and at least two of the three WJ-
III reading achievement standard scores. Component number three in the alpha 1 band
had significant correlations with Reading Fluency and Passage Comprehension subtests,
but not Letter-word Identification (Reading Fluency r (54) = 0.300, p < .05 and Passage
Comprehension r (58) =0.276, p < .01).
Table 3.4 Significant Pearson’s Correlations between PCA components reading tests in
BA 45.
* p < .05. ** p < .01. *** p < .001.
Coherence Component
Letter-word
Identification
Reading
Fluency
Passage
Comprehension
BA 45, Alpha 1, LH, Component
3
.240 (.080) .300 (.028) * .276 (.043) *
BA 45, Beta 2, RH, Component
3
.289 (.034) * .276 (.043) * .296 (.030) *
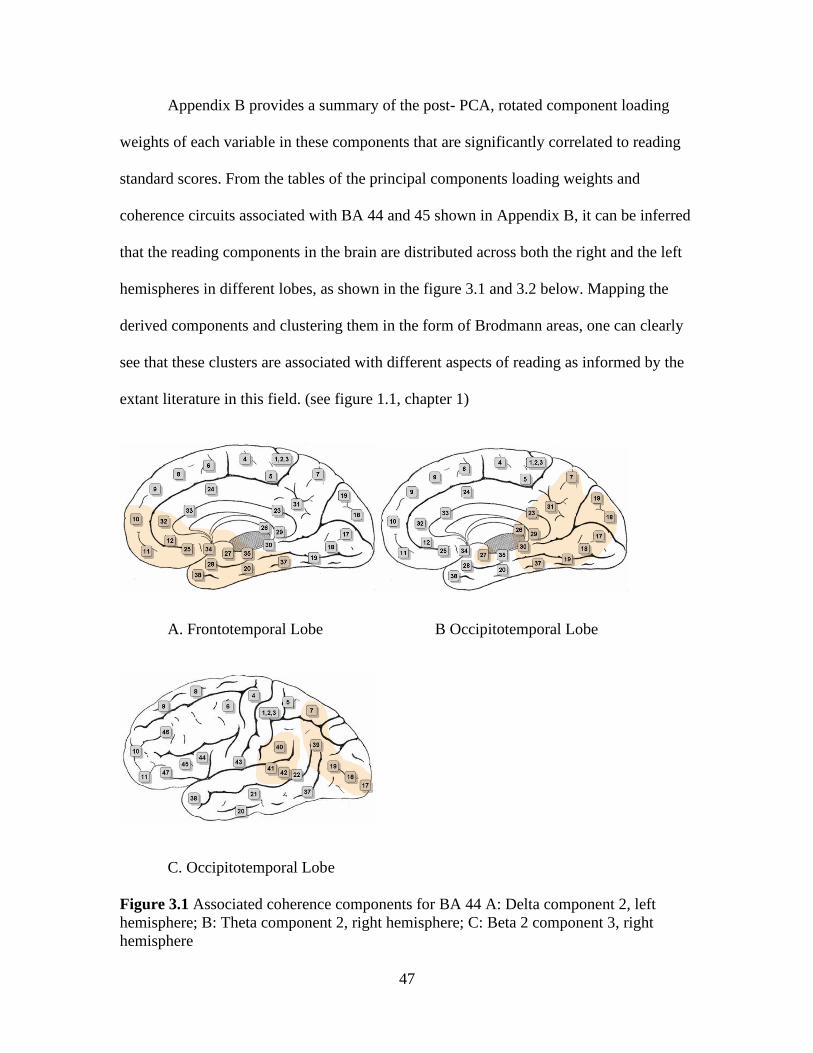
47
Appendix B provides a summary of the post- PCA, rotated component loading
weights of each variable in these components that are significantly correlated to reading
standard scores. From the tables of the principal components loading weights and
coherence circuits associated with BA 44 and 45 shown in Appendix B, it can be inferred
that the reading components in the brain are distributed across both the right and the left
hemispheres in different lobes, as shown in the figure 3.1 and 3.2 below. Mapping the
derived components and clustering them in the form of Brodmann areas, one can clearly
see that these clusters are associated with different aspects of reading as informed by the
extant literature in this field. (see figure 1.1, chapter 1)
A. Frontotemporal Lobe B Occipitotemporal Lobe
C. Occipitotemporal Lobe
Figure 3.1 Associated coherence components for BA 44 A: Delta component 2, left
hemisphere; B: Theta component 2, right hemisphere; C: Beta 2 component 3, right
hemisphere

48
A. Temporoparietal Lobe B. Occipital Lobe
Figure 3.2 Associated coherence components for BA 45 A: Alpha 1 component 3, left
hemisphere; B: Beta 2 component 3, right hemisphere.
3.4 MULTIPLE REGRESSION
A multiple regression model was constructed with the help of the five identified
reading components to ascertain if they were associated with broad reading composite
scores. The model explains 26% of the variance and is significantly associated with the
Broad Reading WJ-ACH score, which is a composite of all the three reading subtests, F
(5, 54) = 3.306, p = .01, R2 = 0.26 (see Table 3.5). The Variance inflation factors (VIFs)
for three variables are less than 2 and for the other two variables they are equal to 5. This
suggests that three of the five variables are not collinear and the other two are moderately
collinear suggesting overall low multicollinearity within the model (Berninger &
Richards Knock & Lyn, 2012). Low multicollinearity indicates that the five independent
variables (components extracted) used in the regression model are not correlated to one
another and are fairly independent (VIF<2). This assumes that the model is a good fit and
interpretation of the results is accurate. If the independent variables are correlated with
one another, it can cause problems with the model fit and lead to erroneous interpretation
of results.

49
In order to understand the association of these five broad reading components
with individual reading skills, three other multiple regression models were derived (see
Table 3.6). In case of the letter-word identification subtest a model including all five
components significantly associated with Letter-word Identification standardized scores.
The model explains 23% of the variance, F (5, 54) = 2.781, p < .05, R2 = 0.23. For the
Reading Fluency subtest, a multiple linear regression model including the five
components significantly associated with the Reading Fluency standardized scores and
explains 27% of the variance, F (5, 54) =3.525, p < .01, R2 = 0.27. Lastly, for the Passage
Comprehension subtest, a multiple linear regression model including the five components
significantly associated with Passage Comprehension standardized scores explaining 24%
of the variance, F (5, 54) =3.084, p < .05, R2 = 0.24. The Variance inflation factors (VIFs)
for three variables are less than 2 and for the other two variables they are equal to 5. This
suggests that three of the five variables are not collinear and the other two are moderately
collinear suggesting overall low multicollinearity within the model (Knock & Lyn, 2012).
Table 3.5 Multiple linear regression model using coherence components to see their
association with Broad Reading composite score
.
β F t p
Broad Reading Model ** 3.306 =.01
Delta, LH, Component 2 .245 1.647 .106
Theta, RH, Component 2 .223 1.403 .167
Beta 2, RH, Component 3
Alpha 1, LH, Component 3
-.115
.246
-0.388
1.862
.700
.049*
Beta 2, RH, Component 3 .266 0.932 .356
* p < .05. ** p < .01

50
In the table (3.5) above β is the standardized coefficient, p is the significance
value, and F is the F statistics. From the table its apparent that an increased (positive)
delta (LH), theta (RH), alpha 1(LH), beta 2(RH) and a reduced (negative) beta 2 (RH)
coherence has a direct association with the broad reading composite scores of the
children. Specifically, a higher alpha 1 component in the Left hemisphere is implicated in
the broad reading composite scores of children.
Table 3.6 Multiple linear regression models using coherence components to see their
association with reading subtests.
β F t p
Letter-word Identification Model * 2.781 < .05
Delta, LH, Component 2 .256 1.690 .097
Theta, RH, Component 2 .283 1.745 .087
Beta 2, RH, Component 3 -.245 -0.805 .425
Alpha 1, LH, Component 3
Beta 2, RH, Component 3
.187
.326
1.382
1.116
.173
.270
Reading Fluency Model ** 3.525 < .01
Delta, LH, Component 2 .191 1.294 .202
Theta, RH, Component 2* .327 2.077 .043*
Beta 2, RH, Component 3 .079 0.266 .791
Alpha 1, LH, Component 3
Beta 2, RH, Component 3
.254
.009
1.927
0.031
.060
.975
Passage Comprehension Model * 3.084 < .05
Delta, LH, Component 2 .293 1.956 .056
Theta, RH, Component 2 .130 0.809 .422
Beta 2, RH, Component 3 -.039 -0.131 .897
Alpha 1, LH, Component 3
Beta 2, RH, Component 3
.193
.239
1.442
0.829
.156
.411
* p < .05. ** p < .01.

51
In the table (3.6) above β is the standardized coefficient, p is the significance
value, and F is the F statistics. For the Letter-word identification subtest, it can be
observed that an increased (positive) delta (LH), theta (RH), alpha 1(LH), beta 2(RH) and
a reduced (negative) beta 2 (RH) coherence has a direct association with the letter -word
identification scores of the children. For the Reading Fluency subtest, it can be observed
that an increased (positive) delta (LH), theta (RH), alpha 1(LH), beta 2(RH) and a
reduced (negative) beta 2 (RH) coherence has a direct association with the reading
fluency scores of the children. Specifically, a higher theta component in the Right
hemisphere is implicated in the reading fluency scores of children. For the Passage
Comprehension subtest, it can be observed that an increased (positive) delta (LH), theta
(RH), alpha 1(LH), beta 2(RH) and a reduced (negative) beta 2 (RH) coherence has a
direct association with the passage comprehension scores of the children.
3.5 DISCRIMINANT VALIDITY
Thatcher et al., (2005) indicate in their research that coherence is directly related
to IQ and general abilities hence it is incumbent upon us to validate the association with
the five resulting components for broad math composite scores as well. This would
clarify if these identified coherence circuits were specific to reading performance or
general academic performance (including math). All the five derived components were
examined to determine their correlations with the broad math performance using cluster
scores provided by the WJ-III Ach.
Results indicate that none of the five components are associated with the broad
math composite scores. None of the components are correlated to the broad math
performance (see Table 3.7). This suggests that the brain components including

52
Brodmann Area 44 and 45 are specific to reading and not broad math performance or
general academic performance. This indicates the presence of domain specific
components and regions in the brain exclusively related to reading performance.
In order to further solidify a region specific (BA 44 and BA 45) hypothesis for the
reading components a multiple regression model was examined. The resulting model
barely explains 11% of the variance and is not associated with broad math composite
scores, F (5, 54) =1.193, p >.05, R2 = 0.11, indicating domain specificity (for just
reading).
This also further reinforces the claim, that BA 44 and 45, which is generally
known as the Broca’s area in the brain is primarily associated with language production
and comprehension which are essential for reading. The connections of Broca’s area and
the lobes across the brain also indicate that there are several other regions of the brain
that might be implicated in the reading process. These regions include the frontotemporal
lobe, occipital lobe, temporo-parietal lobe, and the occipitotemporal lobe.
Table 3.7 Significant Pearson’s Correlations between reading coherence components and
Broad Math scores
Coherence Component Broad Math
Delta, LH, Component 2 .170 (.219)
Theta, RH, Component 2 .239 (.082)
Beta 2, RH, Component 3 .235 (.087)
Alpha 1, LH, Component 3
Beta 2, RH, Component 3
.157 (.257)
.207 (.132)
* p < .05. ** p < .01.

53
CHAPTER 4
DISCUSSION
Currently research examining neurocognitive underpinnings of brain functions
that are implicated in reading performance in children is an emerging area. This is
important because educators are increasingly using neuroscientific findings to understand
the distributed nature of the reading process. Findings from the dissertation indicate that
the Brocas area is in sync with the frontotemporal lobe, occipitotemporal lobe,
temporoparietal lobe and the occipital lobe. This means that the Brodmann areas 44 and
45 in the Brocas region and the derived Brodmann areas (highlighted in figure 3.1 and
3.2) in the four lobes are oscillating with the same frequency underlining functioning
connectivity among these regions of the brain. Looking at the structure and organization
of this connectivity, it is evident that it is spread out across all the four lobes of the brain
as suggested in the results section. All these different regions of the brain have different
functions, like orthography, phonology, semantic, and embodied and reading is an
orchestration of all those processes. Hence, we can say that the development of the
reading network is not built through reliance on one process but involves multiple
processes across brain regions adding to educators understanding the reading brain. To
develop this argument, I will first describe how coherence measures can be used to
determine functional connectivity in the brain. Next, I will explore how these measures
relate to reading scores. Finally, I will describe how the relationship of coherence and

54
reading scores supports a domain specific model of reading. This discussion will be
followed by limitations and implications of the study.
QEEG measures of coherence can provide us bio-signatures associated with areas
of the brain that contribute to the reading process and by extension reflect in children’s
reading scores. Hence, educators can use this information to understand that reading is a
multi-dimensional process with several regions of the brain in coherence with each other.
That is, there is functional connectivity across areas within the brain. Functional
connectivity basically connotes the cross-temporal correlation of activity measured in
different parts of the brain (Honey et al., 2009). Coherence is one among several other
metrics used for deriving functional brain connectivity in EEG (Decker et al., 2017).
Coherence provides information about the functional connectivity between the structures
lying beneath the electrode pairs. These electrodes are flat metal physical sensors placed
on the scalp, used to measure electrical activity resulting from the interactions between
neurons. Coherence compares the similarity in the power spectra and is usually
calculated after transforming from the time domain to the frequency domain with the
assumption that brain regions which show greater similarity in activation are functionally
connected (Bowyer, 2016). The current study theoretically includes the derived
coherence regions that would be of interest to reading.
From this theoretical perspective the information about the regions of the brain
involved in the reading process and children’s reading scores from standardized
assessments could also be used to understand reading difficulty in children. Armed with
this foundational knowledge of reading-related qEEG coherence, both educators and
school psychologists could provide better instructional interventions and assessments

55
taking into account how the brain processes reading. Adding on to the theoretical
understanding of how a child’s brain performs reading tasks, examination of neuro-
electrophysiological activity correlated with reading performance could help educators
understand that reading is a dynamic process, distributed across several regions of the
brain and not to be seen in isolation (Compton-Lilly et al., 2020). Understanding the
underlying neural processes is a critical step towards addressing the need for improved
reading assessment and intervention practices. The current study also helps to address
this need by providing the foundations for basic research in the future in relation to the
neurocognitive processes that are implicated in children’s broad reading performance
(Wu et al., 2008).
Research has already indicated that that BA 44 and 45, which constitutes the
Broca’s region are heavily implicated in phonological and semantic processing
(Friederici et al., 2000a; Friederici et al., 2000b). The current study adds to this
knowledge by exploring associations between children’s reading scores and
intrahemispheric brain connectivity levels with BA 44 and 45. Results of the study
clearly show that there are a total of five significant coherence networks (3 in the right
hemisphere and 2 in the left hemisphere) in the brain that might be associated with
children’s broad reading performance as determined by the standardized WJ-III Ach
reading test scores (see figure 3.1 and 3.2). Findings from this dissertation highlight that
the occipitotemporal and occipital lobe in the right hemisphere of the brain are in
coherence with the Brocas area (Brodmann area 44 and 45) (see figure 3.1 and 3.2).
Despite, classically language network being left dominant, activations found in the right

56
hemisphere debunk an exclusive left-lateralized reading network. This signals the
distributed nature of the reading process across both hemispheres.
This necessitates looking at the Woodcock Johnson III- Test of Achievement
reading battery in order to understand how the aforementioned coherence measures relate
to the scores of the children on the three subtests included in this study.
The three core reading subtests included in the current study were: Letter-word
identification, reading fluency, and passage comprehension. Letter-word identification
assesses reading skills by the subjects reading a list of words from an increasingly
difficult vocabulary list and evaluating their pronunciation. Passage comprehension
focuses on the child’s understanding the meaning of the text where a child reads a
sentence silently and from the context decides to fill in the blank spaces with specific
words that complete the sentence. There is a gradual increase in the level of the
vocabulary, as the child progresses through the sections. Reading fluency subtest allows
the child to read simple sentences and circle “Y” or “N” in the answer sheet in order to
accurately respond to as many items as possible within the allotted time.
There are three coherence networks in the BA 44 that are significantly associated
with at least two out of three reading subtest scores. The coherence network in the theta
frequency band (4-8 Hz) in the right hemisphere significantly associated with the
standardized scores for letter-word identification and reading fluency and is functionally
connected with occipitotemporal lobe.
This validates the idea that the occipitotemporal lobe, also known as the “visual
word form area” is implicated in rapid word-form processing without the need for
decoding (Glezer et al., 2016; Klein et al., 2015; Ludersdorfer et al., 2015) (see figure

57
3.1). Additionally, the coherence network in the beta 2 frequency band in the right
hemisphere significantly associated with standardized scores across all the three reading
subtests including letter-word identification, reading fluency, and passage comprehension
and also has functional associations with the occipitotemporal lobe. Within the left
hemisphere, the delta frequency band (1-4 Hz) significantly associated with the
standardized scores for reading fluency and passage comprehension, with a stronger
correlation with the passage comprehension reading scores and functional connectivity
across the frontotemporal lobe.
The frontotemporal region is associated with sentence comprehension and spoken
word recognition. In a study done by Sood and Sereno (2016) assessing the overlapping
regions in the brain for activation during reading comprehension and visual, auditory, and
somatosensory brain mapping, we observe that the frontal cortex and the superior
temporal cortex are heavily implicated. Recent research has also indicated that these
classical language areas (frontotemporal region and parietal cortex), that were erstwhile
considered to be beyond the scope of the occipital lobe (boundaries of vision), are
involved in reading as proven through retinotopic mapping (Hagler & Sereno, 2006;
Hagler et al., 2007; Kastner et al., 2007; Huk et al., 2002; Schluppeck et al., 2005; Sereno
& Huang, 2006; Huang and Sereno, 2013;). Results from this study indicate that there
was activation in specific frontal regions like the left inferior frontal gyrus and
dorsolateral prefrontal cortex. These regions are classically associated with attention,
which is required for reading processes and comprehension, indicating that attention is a
cortex-wide dynamic activity and is not dissociable from sustained reading practices
(Çukur et al., 2013, Peelen & Kastner, 2014).

58
Hence my study adds on to the existing literature and makes a stronger case for
reading being distributed across the four lobes of the brain and the frontotemporal region
being implicated in reading comprehension on account of attentional processing (see
figure 3.1 and 3.2).
There are two coherence networks in BA 45 that are significantly associated with
at least two out of three reading subtest scores. The coherence network in the beta 2
frequency band in the right hemisphere is significantly associated with the standardized
scores across all three reading subtests including letter-word identification, reading
fluency, and passage comprehension and is functionally connected with occipital lobe.
Subsequently, the coherence network in the alpha 1 frequency band (8-10 Hz) is
significantly associated with standardized scores for reading fluency and passage
comprehension with functionally connectivity across the temporoparietal lobe.
To summarize, these results indicate that BA 44 and 45 are functionally
associated with frontotemporal, occipitotemporal, temporoparietal, and occipital lobe
which are spread across the entire brain. A region-specific functional association cannot
explain the associated connectivity across the whole brain. Hence, in the right hemisphere
an increased theta and beta 2 coherence between BA 44 and the occipitotemporal lobe
and an increased beta 2 coherence between BA 45 and the occipital lobe are associated
with better broad reading performance scores in children. Broad reading composite scores
is the total score across all the three reading subtests and was measured by adding up the
individual subtest scores and averaging the sum. Similarly, in the left hemisphere an
increased delta coherence between BA 44 and the frontotemporal lobe and an increased

59
alpha 1 coherence between BA 45 and temporoparietal lobe are associated with better
broad reading performance scores in children.
To further the investigation of reading scores and associated brain activity,
models including these broad reading coherence networks and standardized reading
subtest scores were examined. Results reveal three statistically significant regression
models, one for each of the reading subtests. Letter-word identification, reading fluency,
and passage comprehension scores are significantly associated with a brain coherence
model composed of the following component variables: 1) BA 44 in the right hemisphere
having an increased theta and beta 2 coherence with the right occipitotemporal lobe; 2)
BA 44 in the left hemisphere having an increased delta coherence with the left
frontotemporal lobe; 3) BA 45 in the right hemisphere having an increased beta 2
coherence with the occipital lobe; 4) BA 45 in the left hemisphere having an increased
alpha 1 coherence with the temporoparietal lobe. A similar study on memory
improvement and QEEG changes in relation to a reading task with EEG biofeedback
therapy revealed the importance of having increased alpha, beta 1, and beta 2 coherence.
The experimental group performed above the normative reference for reading and
auditory memory tasks and showed significantly higher levels of alpha, beta 1, and beta 2
coherence with EEG biofeedback therapy (Thornton & Carmody, 2013).
The study shows that resting-state QEEG coherence in the theta, delta, beta 2,
and alpha 1 frequency bands for BA 44 and 45, across both hemispheres, has a direct
association with children’s reading performance on the WJ-III Test of Ach. reading tests.
These results suggest that there is a linear relationship between the QEEG coherence
parameters in the specified frequency bands and children’s reading scores. Indicating that
60
the higher the levels of connectivity across the brain (coherence), specifically in the theta,
delta, beta2, and alpha 1 band, the higher the scores on reading subtests. The field of
reading has been testing children with these subtests for a long time, hence it is
imperative that we understand the correlation between these tests and actual brain
connectivity. This not only validates the distributed reading network model but also
validates that educators have been focusing on the valid reading assessments in order to
measure reading performance in children. This finding is in line with the National
Reading Panel that centered five important aspects to reading: phonics, phonemic
awareness, vocabulary, reading comprehension, and fluency. As educational research on
reading keeps growing, this QEEG coherence study shows us that there is a strong
positive correlation between types of reading components that educators rely on during
assessment and what is actually happening in the brain. Some of the reading assessments
that are not represented in my study, should also be explored in future studies to get a
complete picture of the reading process. For instance, in addition to phonology-based
reading and reading comprehension, embodied processes are also crucial to reading. This
involves multimodal integration of linguistic and nonlinguistic knowledge, specifically
during meaning construction (Compton-Lilly et al., 2020). Research has shown that
reading natural sentences elicits brain activity within a neural network that is similar to
activation due to experiential and nonlinguistic knowledge (Anderson et al., 2019) as
opposed to reading pseudowords (Desai et al., 2016). Drawing from this literature it is
evident that embodied processes are an emerging area within the field of neuroimaging
studies of reading which further reinforces the idea of the distributed nature of the
reading process in the brain. Subsequently, exploring issues of executive functions like
61
cognitive control, working memory, and inhibition in relation to the reading process will
be imperative (Catwright, 2015).
Notably, the reading components that were discovered in the study were not
associated with math achievement scores from the same dataset. These findings provide a
rationale for the domain specific and domain general hypothesis that surrounds the
neuroscientific literature on learning domains and disabilities. From the research on
learning disabilities and deficits (stroke and lesion studies), we know that components
related to deficits can be classified as domain-general, indicating that individuals with
any type of learning disability can have underactive network connectivity in specified
areas. However, some networks may represent specific deficits only present in
individuals with a specific type of disability (i.e., math, reading, writing) (see Lutz Jäncke
et al., 2019).
This study is indicative of a domain specific model of brain activity underlying
reading performance exclusively indicating that areas of the brain including Brodmann
Area 44 and 45 are specific to reading and not broad math performance or general
academic performance. This indicates the presence of domain specific components and
regions in the brain exclusively related to reading performance. Consequently, the claim
that the Brocas area (BA 44 and BA 45) are majorly associated with language
comprehension and production which are necessary for reading is reinforced. Further, the
associated areas of the brain that are oscillating with the same frequency, indicating
functional connectivity across these regions (the frontotemporal lobe, occipital lobe,
temporo-parietal lobe, and the occipitotemporal lobe) might also be implicated in the
reading process.

62
Future studies should compare identified connectivity networks for both reading
and mathematics performance to determine whether these networks are representative of
specific or general academic abilities. This is because, the data from the study looked at
both math and reading subtests and my research specifically looked at reading. This could
also provide more information on the domain-specific or general hypothesis in relation to
math and reading to clarify the regions of the brain that are exclusively associated with
these learning domains or share co-activation across these domains.
4.1 LIMITATIONS
One of the major limitations of the present study can be explained by the
exploratory nature of the analysis and the use of statistical modeling. On account of a
relatively small sample size of participants, several measures were undertaken to reduce
the number of variables in the dataset. As a result of this data-reduction procedure, two
major consequences arise. First, performing Principal Components Analysis (PCA) to
combine variables with redundancy complicates the results. By combining multiple
coherence variables into one variable, the spatial resolution of the anatomical structures
of the brain involved in the coherence networks were sacrificed. Also, the interpretability
of the brain regions represented by the coherence variables were compromised and
limited only to the general lobes of the brain and not distinct brain structures or the
Brodmann Areas underlying those structures. Second, the consequence of reducing the
total number of variables for examining their correlation to specific reading skillsets can
neither be explained or validated with the five coherence components that were extracted
for the analysis. This is because, only those coherence variables (reading components)

63
were considered in the PCA and the multiple linear regression, that had significant
correlations with at least two of the three reading subtests.
The subtests were used to create a statistical model; the data at rest cannot give us
a complete idea of the specific skill sets like letter word identification, reading fluency,
and passage comprehension since I selected reading components primarily based on
correlations with at least two out of three subtests. I left out the correlations that were just
significant with one test since that could be just a matter of chance. Unless I did multiple
comparison correction (which was not possible due to the low sample size), I cannot use
all the correlations. The large number of correlation tests run, and the relatively small
sample size introduced the issue of random false positive results due to the high
likelihood family-wise type 1 errors. To minimize the chances of Type I error across such
a large number of tests, we required a coherence component to correlate with at least two
out of the three reading subtests to meet criteria for inclusion in the subsequent regression
analyses. These criteria assumed it is unlikely that a component would correlate with two
(or all three) reading subtests by chance and enabled us to focus on brain activity related
to broad, rather than specific, reading skills. Thus, despite not correcting for multiple
comparisons in a traditional fashion (e.g., Bonferroni correction), this strategy does
account for and effectively reduce the occurrence of random false positive results.
Consequently, I ended up using only those correlations that were significant with
at least two out of the three subtests. And hence it can be safely assumed that the
interpretations of the results are limited to the neurocognitive underpinnings of broad
reading performance only and not specific reading skillsets. With a larger sample size,
PCA may not be necessary since the large sample would not necessitate the reduction of

64
variables, thus allowing researchers to examine coherence variables individually rather
than in clusters of components. Though beyond the scope of the current study,
eliminating PCA from the methods used would allow for the examination of variables
that are related to specific reading skills rather than broad reading performance.
Furthermore, a large sample would allow additional analyses to examine differences
between high achieving and low achieving reading students.
Another significant limitation of the study entails that the coherence difference
across the participants were not evaluated. Examining differences among high and low
reading performance could yield valuable results as to the desired levels of brain activity
and coherence networks associated with reading processes. However, this was beyond the
scope of the present study due to the presence of a relatively large number of coherence
(EEG) variables obtained from a rather small sample size of participants.
Moreover, due to the inclusion of a large number of variables involved in the
PCA, the current study only examined intrahemispheric coherence and did not take into
consideration interhemispheric coherence. This was done in order to reduce the total
number of variables to be considered after the PCA’s. This might be seen as a major
limitation of the study since interhemispheric alpha coherence has been found to be
higher even for children with dyslexia in relation to their reading performance (Ben-
Soussan et al., 2014). Consequently, there are likely additional components that could
increase our current understanding of the electro-neurophysiological activity associated
with reading performance in children that need to be taken into consideration while
exploring reading.
65
Finally, the interpretation of the result is dependent upon the assumption that a
qEEG coherence network at rest correlating with a reading score is indicative of a
network that is directly involved in performance of that reading task. In reality, the five
different coherence networks identified in the current study represent the baseline
electrophysiological activity at rest. Resting-state brain activity does not imply that they
become active during the performance of the reading tasks. Despite this limitation, these
networks are associated with reading scores and broad reading performance and lend
credence to the distributed nature of the reading process. Hence, they have some utility
for understanding broad reading performance, although, the interpretations warrant
caution until further research can validate these findings.
4.2 IMPLICATIONS
Resting-state EEG implementation and analysis can provide us with a deeper
understanding of how brain development is associated with reading. With a nuanced
evaluation of the degree of brain synchronicity between specific regions of the brain at
rest, we can explore how these measures relate to broad reading performance. My study
adds to the foundational knowledge and research methodology upon which, future studies
examining the neurocognitive processes involved in general academic performance can
build.
There is a dearth of research combining functional neurocognitive data and
academic achievement scores in children. Consequently, gaining a firm understanding of
reading performance and processes at the biological level is paramount. Additionally,
there is a huge drive towards exploring the neurocognitive underpinnings of educational
assessments among educators and school psychologists. Rigorous research and awareness

66
are needed to better understand reading assessment, identification, and intervention
processes. Subsequently, educators also need to understand the distributed nature of the
reading process and how several areas of the brain are functionally connected. The
individual reading subtests only provide us with a partial view of the reading process and
focusing solely on the results from a subtest could often lead to a very reductive
assessment of all the possibilities that a child brings to a text during reading. As the child
navigates this complex process of reading his/her brain gradually builds a reading
network. The development of this reading network is not linear indicating that we cannot
focus on the results of subtests from either phonics or semantics and design curriculum.
This is because phonological processing is a lower order reading skill, while reading
comprehension is a higher order reading skill, and the brain adapts to them, depending
upon the requirement for a given task (Patael et al., 2018). Admittedly phonological
processing plays a vital role in the early years of reading development, but gradually with
the development of the reading network semantic processes also become active
(Compton-Lilly et al., 2020). Hence, there needs to be a more inclusive approach to
assessing children’s reading performance by considering both these factors along with
other precipitating factors like prior experiences, sensory motor processing, and social
interaction, and embodiment. Thus, there is a need to develop instructional interventions
and assessments keeping in mind this complexity of the reading process.
The current study looked at 60 school aged children 7-12 years of age. The linear
relationship found between QEEG coherence (baseline brain connectivity) and the
reading scores of children indicates the gradual development of a reading network across
this age group of children. The development of reading network is also associated with

67
the idea of some children using phonology-based decoding while others use
comprehension-based reading. Prior research indicates that the reading network can be
synchronized in a child as early as six years (Alcauter et al., 2017), and additionally, age-
related differences can also account for activation in different regions of the brain (Sela et
al., 2012). Consequently, it might be easier to understand why younger children might
use the temporoparietal connectivity found in the study while navigating phonology-
based reading, while the older readers might use the occipitotemporal connectivity found
in the study in order to perform whole-word recognition and semantic analysis. This is in
accordance with the findings from research which show a potential correlation between
increase in brain coherence and reading development across time periods (Horowitz-
Kraus et al., 2015).
The future of reading research and neuroscience is fraught with complexities that
need to be unpacked. The association between education and neuroscience could lead the
way for better instruction and interventions and simultaneously translate into better
teaching and learning methodologies in school settings.
4.3 FUTURE DIRECTIONS
Linking neuroscience with literacy instruction can help reading theorists and
educators draw connections between neuroimaging research and the theories and
practices used in education settings. Neuroscientists have described a language network,
made up of different regions located in separate parts of the brain, with information
transferred between them (Friederici, & Gierhan, 2013). Consequently, as the reader
encounters letter patterns and words, semantic activation occurs along with phonemic
processing and word recognition. (Sandak et al., 2004). Additionally, Yu et al. (2018)

68
identified an anatomical overlap between semantic and phonological subnetworks within
the language network. Research also states that at the word, sentence, or discourse levels,
semantic processes involve integrated brain areas that are differentially activated
depending upon the difficulty and abstractness of a text (Binder, Desai et al., 2009).
Finally, neuroscience reading research additionally explores embodied and social factors
in reading (Desai, Binder, Conant, & Seidenberg, 2010; Noble et al., 2006).
From this, it is exceedingly clear that educational neuroscience needs education
scholars to facilitate a dialogue among reading theory, policy, and brain research. The
most sophisticated and impressive attempts to bridge neuroscience and education have
been in relation to reading processes. However, there is a need to incorporate the voice of
reading researchers engaged with the instructional aspect of this interdisciplinary
confluence. The scholars and educators with an interest in teaching reading would benefit
from a thoughtful and thorough understandings of not only these various processes but
also knowledge about how these processes work together.
Neuroscientists and educators, caution against simplistic and reductive
extrapolations of correlations from brain-based imaging studies of reading, since many of
the results are not replicated, and the images of the brain (which are mostly an averaged
difference between the comparison condition and the target condition, hence subject to
variation) do not tell us whether the differences are neurological/genetic/environmental or
instructional (Hruby & Goswami, 2019). Hence, despite the promise of biomarkers in
understanding instructional difficulties and future development with the help of early
interventions and behavioral assessments (Beddington et al., 2008), neuroscientists warn
against false positives in clinical assessments, premature tracking, and the subsequent

69
selection of subprocesses for intensive remediation of struggling readers (Hruby and
Goswami, 2019).
Reading neuroscience has reached a point where it can provide valuable
information for educators. Researchers have been able to collectively inform our
understanding of reading-related processes. The neuroscientific literature continues to
advance our understanding of reading processes in the brain; however, this literature must
be viewed as on-going and partial as research continues to understand the complex
interactions that take place during reading. The neuroscientific models of reading are still
being developed and seem to be focusing on the interaction among areas of the brain with
individual differences in activation depending upon the reader, the task, and the text. It
would be important to keep abreast of the development of these newer models of reading.
The purpose of this dissertation was to take up Hruby’s trifecta challenge (2012)
that an educational neuroscience requires (1) thorough attention to intellectual coherence,
(2) matching expertise in both neuroscience and educational, research, theory, and
practice, and (3) attention to “ethical issues, concerns, and obligations” (p. 3) related to
the general public and their children. The audience for such research includes educators,
neuropsychologists, school psychologists, and clinical psychologists who deal with
reading-related issues. Since teachers are given the responsibility of educating young
minds, it is imperative that they have a working knowledge or understanding about how
the brain functions as they plan reading instruction. Teachers’ access to brain research
and their experiential knowledge could inform a better understanding of how the brain
influences the process of reading development and how the brain, in turn, is changed by
the capacity to read. Such collaborations could enable reading researchers to participate
70
in ongoing discussions regarding the implications of teaching reading based on current
neuroscientific knowledge.
Educators and neuroscientists are both invested in a better future for children.
With integrated approaches, sharing knowledge, and a more open dialogue, I believe both
can come to a consensus about what is best for the child. For the future I sincerely hope
there are collaborations and grants for studies that will drive advancement in education
and neuroscience in order to create a “thinktank” of faculty members for addressing
interdisciplinary research across existing departments. Continuing this line of research
and instead of focusing just on literacy, expanding it to create possibilities of newer
research tracks for addressing pressing issues in science education, math education,
social, cognitive, and affective skills.
Additionally, if we want to know, what parts of our brain (neural networks)
develop/ are activated as we become better at science/reading/math/history/social and
cognitive skills? We could follow a group of children longitudinally who received an
intervention as opposed to a group of peers who did not, and then compare and see which
one of the groups had a better conceptual understanding of the subject areas or concepts;
we will be able to substantiate our claims about which mode of instruction is better for
children with the neuroimaging data. This would encourage collaborations across a
diverse community of research groups, schools, and children and strengthen
interdisciplinary research for the department of learning sciences and assessment
academic group.
Increasingly as educators and neuroscientists start engaging with each other
educational neuroscience lab focused on the aforementioned areas and neuroimaging

71
could be established. Establishing labs in conjunction with the educational outcomes,
learning sciences, and assessment groups will help develop research-in-practice programs
where teaching and learning in education and neuroscience research could complement
each other leading to dynamic and applied work in the field. While work at the
intersection of neuroscience and education continues to develop, what exists cannot be
easily translated into practice. Therefore, I hope to inspire educators and neuroscientists
to work collaboratively mapping new veins of research that prioritize children’s needs
and translate basic scientific research into better educational outcomes for children.

72
REFERENCES
Alahmadi, N. (2015). Classifying children with learning disabilities on the basis of
resting state EEG measures using a linear discriminant analysis. Zeitschrift Für
Neuropsychologie.
Alcauter, S., Garcia-Mondragon, L., Garcia-Tabuenca, Z., Moreno, Martha.B., Oritz, J.
J., & Barrios, F. A. (2017). Resting state functional connectivity of the anterior
striatum and prefrontal cortex predicts reading performance in school-age
children. Brain and Language, 174, 94-102.
Alexander, P. A., & Fox, E. (2019). Reading research and practice over the decades: A
historical analysis. In D.E. Alvermann, N.J. Unrau, M. Sailors, & R.B. Ruddell
(Eds.) Theoretical Models and Processes of Literacy. New York: Routledge.
Alexander, P. A., & Jetton, T. L. (2000). Learning from text: A multidimensional and
developmental perspective. In M. L. Kamil, P. B. Mosenthal, P. D. Pearson, & R.
Barr (Eds.), Handbook of reading research: Vol. III (pp. 285-310). Mahwah, NJ:
Erlbaum.
Allington, R. L. (2001). What really matters for struggling readers: Designing research-
based interventions. New York: Longmans.
Amunts, K., Weiss, P. H., Mohlberg, H., Pieperhoff, P., Eickhoff, S., Gurd, J. M.,
Marshall, J. C., Shah, N. J., Fink, G. R., & Zilles, K. (2004). Analysis of neural
mechanisms underlying verbal fluency in cytoarchitectonically defined
stereotaxic space—The roles of Brodmann areas 44 and 45. NeuroImage, 22(1),
42.
Anderson, A. J., Binder, J. R., Fernandino, L., Humphries, C. J., Conant, L. L., Raizada,
R. D. S., Feng Lin, & Lalor, E. C. (2019). An Integrated Neural Decoder of
Linguistic and Experiential Meaning. Journal of Neuroscience, 39(45), 8969–
8987.
Anzalone, C., Luedke, J. C., Green, J. J., & Decker, S. L. (2020). QEEG coherence
patterns related to mathematics ability in children. Applied neuropsychology.
Child, 1–11. Advance online publication.
Ardila, A., Bernal, B., & Rosselli, M. (2016). Why Broca's Area Damage Does Not
Result in Classical Broca's Aphasia. Frontiers in human neuroscience, 10, 249.

73
Arns, M., Peters, S., Breteler, R., & Verhoeven, L. (2007). Different brain activation
patterns in dyslexic children: Evidence from EEG power and coherence patterns
for the double-deficit theory of dyslexia. Journal of Integrative Neuroscience,
6(01), 175–190.
Balthasar, A. J. R., Huber, W., & Weis, S. (2011). A supramodal brain substrate of word
form processing — An fMRI study on homonym finding with auditory and visual
input. Brain Research, 1410, 48–63.
Balu, R., Zhu, P., Doolittle, F., Schiller, E., Jenkins, J., & Gersten, R. (2015). Evaluation
of Response to Intervention Practices for Elementary School Reading. NCEE
2016-4000. National Center for Education Evaluation and Regional Assistance.
Barry, R. J., Clarke, A. R., Johnstone, S. J., McCarthy, R., & Selikowitz, M. (2009).
Electroencephalogram θ/β Ratio and Arousal in Attention-Deficit/Hyperactivity
Disorder: Evidence of Independent Processes. Biological Psychiatry, 66(4), 398–
401.
Beddington, J., Cooper, C. L., Field, J., Goswami, U., Huppert, F. A., Jenkins, R., Jones,
H. S., Kirkwood, T. B., Sahakian, B. J., & Thomas, S. M. (2008). The mental
wealth of nations. Nature, 455(7216), 1057–1060.
Bendak, L. (2018). Effects of Applying Repeated Readings Method on Reading Fluency
and Passage Comprehension of Slow Learners. Middle East Journal of Family
Medicine, 16(1), 232–237
Ben-Soussan, T. D., Avirame, K., Glicksohn, J., Goldstein, A., Harpaz, Y., & Ben-
Shachar, M. (2014). Changes in cerebellar activity and inter-hemispheric
coherence accompany improved reading performance following Quadrato Motor
Training. Frontiers in Systems Neuroscience, 8, 81.
Berninger, V. W., & Richards, T. L. (2002). Brain literacy for educators and
psychologists. San Diego, CA, US: Academic Press.
Binder, J. R., Desai, R. H., Graves, W. W., & Conant, L. L. (2009). Where is the
semantic system? A critical review and meta-analysis of 120 functional
neuroimaging studies. Cerebral Cortex, 19(12), 2767-2796.
Bookheimer, S. (2002). FUNCTIONAL MRI OF LANGUAGE: New Approaches to
Understanding the Cortical Organization of Semantic Processing. Annual Review
of Neuroscience, 25(1), 151-188.
Borowski, R., Cummine, J., Owen, W. J., Friesen, C. K., Shih, F., & Sarty, G. E. (2006).
FMRI of ventral and dorsal processing streams in basic reading processes: Insular
sensitivity to phonology. Brain Topography, 18(4), 233–239.

74
Borowski, R., Esopenko, C., Cummine, J., & Sarty, G. E. (2007). Neural representations
of visual words and objects: A functional MRI study on the modularity of reading
and object processing. Brain Topography, 20(2), 89–96.
Bowyer, S. M. (2016). Coherence a measure of the brain networks: Past and present.
Neuropsychiatric Electrophysiology, 2(1), 1.
Bro, R., & Smilde, A. K. (2014). Principal component analysis. Analytical Methods, 6(9),
2812–2831
Büchel, C., Price, C., & Friston, K. (1998). A multimodal language region in the ventral
visual pathway. Nature, 394(6690), 274-277.
Campbell, K. L., & Tyler, L. K. (2018). Language-related domain-specific and domain-
general systems in the human brain. Current Opinion in Behavioral Sciences, 21,
132–137.
Cartwright, K. B. (2015). “Executive function and reading comprehension: The critical
role of cognitive flexibility”. In S. R. Parris & K. Headley (Eds.), Comprehension
instruction: Research-based best practices (3rd ed., pp. 56–71). New York:
Guilford
Clarke, A. R., Barry, R. J., McCarthy, R., & Selikowitz, M. (1998). EEG analysis in
attention-deficit/hyperactivity disorder: A comparative study of two subtypes.
Psychiatry Research, 81(1), 19–29.
Clarke, A. R., Barry, R. J., McCarthy, R., & Selikowitz, M. (2001). EEG-defined
subtypes of children with attention-deficit/hyperactivity disorder. Clinical
Neurophysiology, 112(11), 2098–2105.
Compton‐Lilly, C.F., Mitra, A., Guay, M., & Spence, L.K. (2020). A Confluence of
Complexity: Intersections Among Reading Theory, Neuroscience, and
Observations of Young Readers. Reading Research Quarterly, 55(S1), S185–
S195.
Cressman, M. N., & Liljequist, L. (2014). The effect of grade norms in college students:
Using the woodcock–johnson III tests of achievement. Journal of Learning
Disabilities, 47(3), 271–278.
Çukur, T., Nishimoto, S., Huth, A. G., & Gallant, J. L. (2013). Attention during natural
vision warps semantic representation across the human brain. Nature
Neuroscience 16, 763– 770.
Decker, S. L., Englund, J., & Albritton, K. (2012). Integrating multi‐tiered measurement
outcomes for special education eligibility with sequential decision‐making
methodology. Psychology in the Schools, 49 (4), 368–384.
Decker, S. L., Fillmore, P., Roberts, A.M. (2017). Coherence: The measurement and
application of brain connectivity. NeuroRegulation, 4(1), 3-13.

75
Dehaene, S., & Cohen, L. (2011). The unique role of the visual word form area in
reading. Trends in Cognitive Sciences, 15, 254– 262.
Desai, R. H., Binder, J. R., Conant, L. L., & Seidenberg, M. S. (2010). Activation of
sensory–motor areas in sentence comprehension. Cerebral Cortex, 20(2), 468–
478.
Desai, R. H., Choi, W., Lai, V. T., & Henderson, J. M. (2016). Toward semantics in the
wild: Activation to manipulable nouns in naturalistic reading. The Journal of
Neuroscience, 36(14), 4050–4055.
Dziuban, C. D., & Shirkey, E. C. (1974). When is a correlation matrix appropriate for
factor analysis? Some decision rules. Psychological Bulletin, 81(6), 358
Fedorenko, E. (2014). The role of domain-general cognitive control in language
comprehension. Frontiers in Psychology, 5.
Fedorenko, E., Duncan, J., & Kanwisher, N. (2012). Language-Selective and Domain-
General Regions Lie Side by Side within Broca’s Area. Current Biology, 22(21),
2059–2062.
Fiez, J. A., & Petersen, S. E. (1998). Neuroimaging studies of word reading. Proceedings
of the National Academy of Sciences, 95, 914– 921.
Fiez, J.A., Balota, D.A., Raichle, M.E., & Petersen, S.E. (1999). Effects of lexicality,
frequency, and spelling-to-sound consistency on the functional anatomy of
reading. Neuron, 24, 205-218.
Fischer-Baum, S., Bruggemann, D., Gallego, I. F., Li, D. S. P., & Tamez, E. R. (2017).
Decoding levels of representation in reading: A representational similarity
approach. Cortex: A Journal Devoted to the Study of the Nervous System and
Behavior, 90, 88–102.
Fletcher, J. M., Stuebing, K. K., Barth, A. E., Denton, C. A., Cirino, P. T., Francis, D. J.,
& Vaughn, S. (2011). Cognitive correlates of inadequate response to reading
intervention. School Psychology Review, 40 (1), 3–22.
Friederici A. D., Meyer M., von Cramon D. Y. (2000a). Auditory language
comprehension: an event-related fMRI study on the processing of syntactic and
lexical information. Brain and Language. 75, 289–300.
Friederici A. D., Opitz B., von Cramon D. Y. (2000b). Segregating semantic and
syntactic aspects of processing in the human brain: an fMRI investigation of
different word types. Cerebral Cortex 10, 698–705.
Friederici, A. D. (2002). Towards a neural basis of auditory sentence processing. Trends
in Cognitive Sciences, 6(2), 78-84.

76
Friederici, A. D., & Gierhan, S. M. (2013). The language network. Current opinion in
neurobiology, 23(2), 250–254.
Glezer, L. S., Eden, G., Jiang, X., Luetje, M., Napoliello, E., Kim, J., & Riesenhuber, M.
(2016). Uncovering phonological and orthographic selectivity across the reading
network using fMRI-RA. NeuroImage, 138, 248–256.
González-Garrido, A. A., Gómez-Velázquez, F. R., Salido-Ruiz, R. A., Espinoza-Valdez,
A., Vélez-Pérez, H., Romo-Vazquez, R., … Berumen, G. (2018). The analysis of
EEG coherence reflects middle childhood differences in mathematical
achievement. Brain and Cognition, 124, 57–63.
Gorsuch, R. L. (1990). Common factor analysis versus component analysis: Some well
and little known facts. Multivariate Behavioral Research, 25(1), 33–39.
Grech, R., Cassar, T., Muscat, J., Camilleri, K. P., Fabri, S. G., Zervakis, M., …
Vanrumste, B. (2008). Review on solving the inverse problem in EEG source
analysis. Journal of Neuroengineering and Rehabilitation, 5(1), 25.
Hagler, D. J., & Sereno, M. I. (2006). Spatial maps in frontal and prefrontal cortex.
Neuroimage 29, 567– 577.
Hagler, D. J., Riecke, L., & Sereno, M. I. (2007). Parietal and superior frontal
visuospatial maps activated by pointing and saccades. NeuroImage 35, 1562–
1577.
Hagoort, P., & Brown, C. (1999). The Neurocognition of Language. Oxford: Oxford
University Press.
Heim, S., Alter, K., Ischebeck, A. K., Amunts, K., Eickhoff, S. B., Mohlberg, H., Zilles,
K., von Cramon, D. Y., & Friederici, A. D. (2005). The role of the left
Brodmann’s areas 44 and 45 in reading words and pseudowords. Cognitive Brain
Research, 25(3), 982–993.
Herbster, A.N., Mintun, M.A., Nebes, R.D., & Becker, J.T. (1997). Regional cerebral
blood flow during word and nonword reading. Human Brain Mapping 5, 84-92.
Honey, C. J., Sporns, O., Cammoun, L., Gigandet, X., Thiran, J. P., Meuli, R., &
Hagmann, P. (2009). Predicting human resting-state functional connectivity from
structural connectivity. Proceedings of the National Academy of Sciences, 106(6),
2035–2040.
Horowitz-Kraus, T., Toro-Serey, C., & DiFrancesco, M. (2015). Increased resting-state
functional connectivity in the cingulo-opercular cognitive-control network after
intervention in children with reading difficulties. PLoS ONE, 10(7), 1-21.
Hruby, G. G. (2012). Three requirements for justifying an educational
neuroscience. British Journal of Educational Psychology 82, 1–23.

77
Hruby, G.G., & Goswami, U. (2019). Educational neuroscience for reading educators. In
D.E. Alvermann, N.J. Unrau, M. Sailors, & R.B. Ruddell (Eds.) Theoretical
Models and Processes of Literacy. New York: Routledge.
Huang, R‐S., & Sereno, M. I. (2013). Bottom‐up retinotopic organization supports top‐
down mental imagery. Open Neuroimaging Journal 7, 58– 67.
Huk, A. C., Dougherty, R. F., & Heeger, D. J. (2002). Retinotopy and functional
subdivision of human areas MT and MST. Journal of Neuroscience 22, 7195–
7205.
IBM SPSS Statistics for Windows. (2017). Armonk, NY: IBM Corp: IBM Corp.
Jäncke, Lutz, Saka, M. Y., Badawood, O., & Alhamadi, N. (2019). Resting-state
electroencephalogram in learning-disabled children: Power and connectivity
analyses. NeuroReport, 30(2), 95–101.
Janzen, T., Graap, K., Stephanson, S., Marshall, W., & Fitzsimmons, G. (1995).
Differences in baseline EEG measures for ADD and normally achieving
preadolescent males. Biofeedback and Self-Regulation, 20(1), 65–82.
Jobard, G., Crivello, F. & Tzourio-Magoyer, N. (2003). Evaluation of the dual route
theory of reading: A metanalysis of 35 neuroimaging studies. Neuroimage, 20 (2),
693– 712.
Jobard, G., Vigneau, M., Simon, G., & Tzourio-Mazoyer, N. (2011). The weight of skill:
Interindividual variability of reading related brain activation patterns in fluent
readers. Journal of Neurolinguistics, 24(1), 113–132.
John, E. R., Prichep, L., Fridman, J., & Easton, P. (1988). Neurometrics: Computer-
assisted differential diagnosis of brain dysfunctions. Science, 239(4836), 162–
169.
Johnstone, J., & Gunkelman, J. (2003). Use of databases in QEEG evaluation. Journal of
Neurotherapy, 7(3–4), 31–52.
Kastner, S., DeSimone, K., Konen, C. S., Szczepanski, S. M., Weiner, K. S., &
Schneider, K. A. (2007). Topographic maps in human frontal cortex revealed in
memory‐guided saccade and spatial working‐memory tasks. Journal of
Neurophysiology 97, 3494– 3507.
Klein, M., Grainger, J., Wheat, K. L., Millman, R. E., Simpson, M. I. G., Hansen, P. C.,
& Cornelissen, P. L. (2015). Early activity in Broca’s area during reading reflects
fast access to articulatory codes from print. Cerebral Cortex, 25(7), 1715–1723.
Kock, N., & Lynn, G. (2012). Lateral Collinearity and Misleading Results in Variance-
Based SEM: An Illustration and Recommendations. Econometrics: Multiple
Equation Models eJournal.

78
Lehne, M., Engel, P., Rohrmeier, M., Menninghaus, W., Jacobs, A.M., & Koelsch, S.
(2015). Reading a suspenseful literary text activates brain areas related to social
cognition and predictive inference. PLoS ONE, 10(5), 1–18.
Lehongre, K., Morillon, B., Giraud, A.-L., & Ramus, F. (2013). Impaired auditory
sampling in dyslexia: Further evidence from combined fMRI and EEG. Frontiers
in Human Neuroscience, 7, 454.
Ludersdorfer, P., Kronbichler, M., & Wimmer, H. (2015). Accessing orthographic
representations from speech: The role of left ventral occipitotemporal cortex in
spelling. Human Brain Mapping, 36(4), 1393–1406.
Marosi, E., Harmony, T., Reyes, A., Bernal, J., Fernandez, T., Guerrero, V., Rodriguez,
M., Silva, J., Yanez, G., & Rodriguez, H. (1997). A follow-up study of EEG
coherences in children with different pedagogical evaluations. International
Journal of Psychophysiology, 25, 227-235.
Martin, A., Schurz, M., Kronbichler, M., & Richlan, F. (2015). Reading in the brain of
children and adults: a meta-analysis of 40 functional magnetic resonance imaging
studies. Human Brain Mapping, 36, 1963– 1981.
MATLAB (Version 2018a). (2018). Natick, Massachusetts, United States: The
MathWorks, Inc.
McCandliss, B. D., Cohen, L., & Dehaene, S. (2003). The visual word form area:
expertise for reading in the fusiform gyrus. Trends in Cognitive Sciences, 7, 293–
299.
McNorgan, C., Chabal, S., O’Young, D., Lukic, S., & Booth, J. R. (2015). Task
dependent lexicality effects support interactive models of reading: A meta-
analytic neuroimaging review. Neuropsychologia, 67, 148–158.
Moher D, Liberati A, Tetzlaff J, Altman DG, The PRISMA Group (2009). Preferred
Reporting Items for Systematic Reviews and MetaAnalyses: The PRISMA
Statement. PLoS Med 6(7): e1000097.
Noble, K. G., Farah, M. J., & McCandliss, B. D. (2006). Socioeconomic background
modulates cognition-achievement relationships in reading. Cognitive
development, 21(3), 349–368.
Norton, E. S., Kovelman, I., & Petitto, L.-A. (2007). Are there separate neural systems
for spelling? New insights into the role of rules and memory in spelling from
functional magnetic resonance imaging. Mind, Brain, and Education, 1(1), 48–59.
Oberhuber, M., Jones, Ō. P., Hope, T. M. H., Prejawa, S., Seghier, M. L., Green, D. W.,
& Price, C. J. (2013). Functionally distinct contributions of the anterior and
posterior putamen during sublexical and lexical reading. Frontiers in Human
Neuroscience, 7, 1-10.

79
Pascual-Marqui, R. D., Michel, C. M., & Lehmann, D. (1994). Low resolution
electromagnetic tomography: A new method for localizing electrical activity in
the brain. International Journal of Psychophysiology, 18(1), 49–65.
Patael, S. Z., Farris, E. A., Black, J. M., Hancock, R., Gabrieli, J., Cutting, L. E., &
Hoeft, F. (2018). Brain basis of cognitive resilience: Prefrontal cortex predicts
better reading comprehension in relation to decoding. PloS ONE, 13(6),
e0198791.
Peelen, M. V., & Kastner, S. (2014). Attention in the real world: Toward understanding
its neural basis. Trends in Cognitive Science 18, 242– 250.
Pleisch, G., Karipidis, I. I., Brauchli, C., Rothlisberger, M., Hofstetter, C., Stampfli, P.,
Walitza, S., & Brem, S. (2019). Emerging neural specialization of the ventral
occipitotemporal cortex to characters through phonological association learning in
preschool children. NeuroImage 189, 813-831.
Preston, J. L., Molfese, P. J., Frost, S. J., Mencl, W. E., Fulbright, R. K., Hoeft, F., Landi,
N., Shankweiler, D., & Pugh, K. R. (2016). Print-speech convergence predicts
future reading outcomes in early readers. Psychological Science, 27(1), 75–84.
Price, C. J., Winterburn, D., Giraud, A. L., Moore, C. J., & Noppeney, U. (2003).
Cortical localisation of the visual and auditory word form areas: A
reconsideration of the evidence. Brain and Language, 86(2), 272–286.
Pugh, K., Shaywitz, B., Shaywitz, S., Constable, T., Skudlarski, P., Fulbright, R., Bronen,
R., Shankweiler, D., Katz, L., Fletcher, J., & Gore, J. (1996). Cerebral
organization of component processes of reading. Brain, 119, 1221-1238.
Pugh, K.R., Mencl, W.E., Jenner, A.R., Katz, L., Frost, S.J., Lee, J.R., Shaywitz, S.E., &
Shaywitz, B.A. (2001). Neurobiological studies of reading and reading disability.
Journal of Communication Disorders, 34(6), 479-92.
Pugh, R, K., Shaywitz, B., Shaywitz, S., Shankweiler, D., Katz, L., Fletcher, J.,
Skudlarski, P., Fulbright, R., Constable, T., Bronen, R., Lacadie, C., & Gore, J.
(1997). Predicting reading performance from neuroimaging profiles: The cerebral
basis of phonological effects in printed work identification. Journal of
Experimental Psychology: Human Perception and Performance, 23, 299-318.
Rippon, G., & Brunswick, N. (2000). Trait and state EEG indices of information
processing in developmental dyslexia. International Journal of Psychophysiology,
36(3), 251–265.
Rumsey, J. M., Horwitz, B., Donohue, B. C., Nace, K., Maisog, J. M., & Andreason, P.
(1997). Phonological and orthographic components of word recognition: A PET-
rCBF study. Brain, 120(5), 739–759.

80
Sandak, R., Mencl, W. E., Frost, S. J., & Pugh, K. R. (2004): The neurobiological basis
of skilled and impaired reading: Recent findings and new directions. Scientific
Studies of Reading, 8, 273– 292.
Satterfield, J. H., Cantwell, D. P., Lesser, L. I., & PODOSIN, R. L. (1972). Physiological
studies of the hyperkinetic child: I. American Journal of Psychiatry, 128(11),
1418–1424.
Saygin, Z. M., Norton, E. S., Osher, D. E., Beach, S. D., Cyr, A. B., Ozernov-Palchik, O.,
Yendiki, A., Fischl, B., Gaab, N., & Gabrieli, J. D. E. (2013). Tracking the Roots
of Reading Ability: White Matter Volume and Integrity Correlate with
Phonological Awareness in Prereading and Early-Reading Kindergarten Children.
Journal of Neuroscience, 33(33), 13251–13258.
Schlaggar, B. L., & McCandliss, B. D. (2007). Development of neural systems for
reading. Annual Review of Neuroscience, 30, 475–503.
Schluppeck, D., Glimcher, P., & Heeger, D. J. (2005). Topographic organization for
delayed saccades in human posterior parietal cortex. Journal of Neurophysiology
94, 1372– 1384.
Sela, I., Izzetoglu, M., Izzetoglu, K., & Onaral, B. (2014). A functional near-infrared
spectroscopy study of lexical decision task supports the dual route model and the
phonological deficit theory of dyslexia. Journal of Learning Disabilities, 47(3),
279–288.
Sereno, M. I., & Huang, R‐S. (2006). A human parietal face area contains aligned head‐
centered visual and tactile maps. Nature Neuroscience 9, 1337– 1343.
Shaywitz, B. A., Skudlarski, P., Holahan, J. M., Marchione, K. E., Constable, R. T.,
Fulbright, R. K., Zelterman, D., Lacadie, C., & Shaywitz, S. E. (2007). Age-
related changes in reading systems of dyslexic children. Annals of Neurology, 61,
363–370.
Simos, P. G., Fletcher, J. M., Sarkari, S., Billingsley, R. L., Francis, D. J., Castillo, E. M.,
Pataraia, E., Denton, C., & Papanicolaou, A. C. (2005). Early development of
neurophysiological processes involved in normal reading and reading disability:
A magnetic source imaging study. Neuropsychology, 19(6), 787–798.
Sood, M.R., & Sereno, M. (2016). Areas activated during naturalistic reading
comprehension overlap topological visual, auditory, and somatomotor maps.
Human Brain Mapping, 37, 2784 - 2810.
Tabachnick, B. G., & Fidell, L. S. (2001). Using multivariate statistics (4th ed.).
Needham Heights, MA: Allyn and Bacon.

81
Takamura, T., & Hanakawa, T. (2017). Clinical utility of resting-state functional
connectivity magnetic resonance imaging for mood and cognitive disorders.
Journal of Neural Transmission, 124(7), 821–839.
Thatcher, R. W. (2011). Neuropsychiatry and quantitative EEG in the 21st Century.
Neuropsychiatry, 1(5), 495–514.
Thatcher, R. W., North, D. M., Curtin, R. T., Walker, R. A., Biver, C. J., Gomez, J. F., &
Salazar, A. M. (2001a). An EEG severity index of traumatic brain injury. The
Journal of Neuropsychiatry and Clinical Neurosciences, 13(1), 77–87.
Thatcher, R. W., North, D. M., Curtin, R. T., Walker, R. A., Biver, C. J., Gomez, J. F., &
Salazar, A. M. (2001b). An EEG severity index of traumatic brain injury. The
Journal of Neuropsychiatry and Clinical Neurosciences, 13(1), 77–87.
Thatcher, R. W., North, D., & Biver, C. (2005a). EEG and intelligence: Relations
between EEG coherence, EEG phase delay and power. Clinical Neurophysiology,
116(9), 2129–2141.
Thatcher, R. W., Walker, R., Gerson, I., & Geisler, F. (1989). EEG discriminant analyses
of mild head trauma. Electroencephalography and Clinical Neurophysiology,
73(2), 94–106
Thornton, K. E., & Carmody, D. P. (2013). The Relation Between Memory Improvement
and QEEG Changes in Three Clinical Groups as a Result of EEG Biofeedback
Treatment. Journal of Neurotherapy, 17(2), 116–131.
Turkeltaub, P. E., Eden, G. F., Jones, K. M., & Zeffiro, T. A. (2002). Meta-analysis of the
functional neuroanatomy of single word reading: method and validation.
Neuroimage, 16, 765–780.
Twomey, T., Duncan, K. J. K., Price, C. J., & Devlin, J. T. (2011). Top-down modulation
of ventral occipito-temporal responses during visual word recognition.
NeuroImage, 55(3), 1242–1251.
Twomey, T., Waters, D., Price, C. J., Kherif, F., Woll, B., & MacSweeney, M. (2015).
Identification of the regions involved in phonological assembly using a novel
paradigm. Brain and Language, 150, 45–53.
Vanderauwera, J., De Vos, A., Forkel, S. J., Catani, M., Wouters, J., Vandermosten, M.,
& Ghesquière, P. (2018). Neural organization of ventral white matter tracts
parallels the initial steps of reading development: A DTI tractography study.
Brain and Language, 183, 32–40.
Vigário, R., Sarela, J., Jousmiki, V., Hamalainen, M., & Oja, E. (2000). Independent
component approach to the analysis of EEG and MEG recordings. IEEE
Transactions on Biomedical Engineering, 47(5), 589–593.

82
Wood, F. B., Hill, D. F., Meyer, M. S., & Flowers, D. L. (2005). Predictive Assessment
of Reading. Annals of Dyslexia, 55(2), 193–216.
Woodcock, R. W., McGrew, K. S., & Mather, N. (2001b). Woodcock-Johnson III Tests of
Achievement. Itasca, IL: Riverside Publishing.
Wu, J., Wang, B., Yan, T., Li, X., Bao, X., & Guo, Q. (2012). Different roles of the
posterior inferior frontal gyrus in Chinese character form judgment differences
between literate and illiterate individuals. Brain Research, 1431, 69–76.
Wu, W., West, S. G., & Hughes, J. N. (2008). Short-term effects of grade retention on the
growth rate of Woodcock–Johnson III broad math and reading scores. Journal of
School Psychology, 46(1), 85–105.
Yu, X., Raney, T., Perdue, M. V., Zuk, J., Ozernov, P. O., Becker, B. L. C., Raschle, N.
M., & Gaab, N. (2018). Emergence of the neural network underlying
phonological processing from the prereading to the emergent reading stage: A
longitudinal study. Human Brain Mapping, 39(5), 2047–2063.

83
APPENDIX A
ADAPTED PRISMA FLOW DIAGRAM
s
Figure A.1 Adapted Prisma Flow Diagram
Records identified through
database searching
(n =152)
Scr
een
ing
In
clu
ded
E
ligib
ilit
y
Iden
tifi
cati
on
Additional records identified
through other sources
(n = 0)
Records after duplicates removed
(n =141)
Records screened
(n = 141)
Records excluded
(n = 63)
Articles on reading
disability/disorder
were excluded.
Full-text articles
assessed for eligibility
(n =78)
Further close
reviewing of the 78
articles led to the
addition of book
chapters and articles
from references.
n=18
(n =10)
Studies included in
qualitative synthesis
(n =96)

84
APPENDIX B
PRINCIPAL COMPONENT ANALYSIS LOADING WEIGHTS
Table B.1 Rotated Delta component # 2 matrix in the left hemisphere (BA 44)
Brodmann Area 44-Delta (LH)
Principal Component 2
Loading Weights
Brodmann Area 36L-44L_Delta .910
Brodmann Area 44L-AmyL Delta .898
Brodmann Area 28L-44L Delta .888
Brodmann Area 34L-44L_Delta .874
Brodmann Area 44L-HipL_Delta .864
Brodmann Area 21L-44L Delta .810
Brodmann Area 20L-44L_Delta .800
Brodmann Area 35L-44L_Delta .777
Brodmann Area 13L-44L Delta .753
Brodmann Area 38L-44L_Delta .749
Brodmann Area 27L-44L_Delta .652
Brodmann Area 4L-44L_Delta .484
Brodmann Area 44L-47L Delta .425
Brodmann Area 24L-44L_Delta .524
Brodmann Area 25L-44L_Delta .559
Brodmann Area 11L-44L_Delta .529
Brodmann Area 32L-44L Delta .444
Brodmann Area 10L-44L_Delta .518
Brodmann Area 37L-44L_Delta .412
Brodmann Area 30L-44L_Delta .443

85
Table B.2 Rotated Theta component # 2 matrix in the right hemisphere (BA 44)
Brodmann Area 44-Theta (RH)
Principal Component 2
Loading Weights
Brodmann Area _27R-44R_Theta .577
Brodmann Area _31R-44R_Theta .938
Brodmann Area_23R-44R_Theta .933
Brodmann Area_17R-44R_Theta .931
Brodmann Area_30R-44R_Theta .923
Brodmann Area_19R-44R_Theta .872
Brodmann Area_39R-44R_Theta .839
Brodmann Area_7R-44R_Theta .730
Brodmann Area _18R-44R_Theta .707
Brodmann Area _37R-44R_Theta .680
Table B.3 Rotated Beta 2 component # 3 matrix in the right hemisphere (BA 44)
Brodmann Area 44-Beta 2 (RH)
Principal Component 3
Loading Weights
Brodmann Area _39R-44R_Beta2 .574
Brodmann Area _31R-44R_Beta2 .936
Brodmann Area _23R-44R_Beta2 .921
Brodmann Area 17R-44R_Beta2 .910
Brodmann Area _30R-44R_Beta2 .908
Brodmann Area _7R-45R_Beta2 .640
Brodmann Area _19R-44R_Beta2 .606
Brodmann Area _27R-44R_Beta2 .440

86
Table B.4 Rotated Alpha 1 component # 3 matrix in the left hemisphere (BA 45)
Brodmann Area 45-Alpha 1(LH)
Principal Component 3
Loading Weights
Brodmann Area _40L-45L_Alpha1 .841
Brodmann Area _41L-45L_Alpha1 .787
Brodmann Area _1L-45L_Alpha1 .784
Brodmann Area _43L-45L_Alpha1 .771
Brodmann Area 42L-45L_Alpha1 .760
Brodmann Area _29L-45L_Alpha1 .734
Brodmann Area _22L-45L_Alpha1 .720
Brodmann Area _3L-45L_Alpha1 .667
Brodmann Area _2L-45L_Alpha1 .649
Table B.5 Rotated Beta 2 component # 3 matrix in the left hemisphere (BA 45)
Brodmann Area 45-Beta 2 (RH)
Principal Component 3
Loading Weights
Brodmann Area_23R-45R_Beta2 .912
Brodmann Area_17R-45R_Beta2 .906
Brodmann Area_39R-45R_Beta2 .764
Brodmann Area_19R-45R_Beta2 .761
Brodmann Area_7R-45R_Beta2 .717
Brodmann Area_18R-45R_Beta2 .604