novel designs for improving the performance of hollow ...vuir.vu.edu.au/25289/1/2-novel designs for...
TRANSCRIPT

1
Novel designs for improving the performance of hollow fiber membrane
distillation modules
Xing Yang1,2
, Rong Wang*,1,2
, Anthony G. Fane1,2
1. School of Civil and Environmental Engineering, Nanyang Technological
University, Singapore 639798
2. Singapore Membrane Technology Centre, Nanyang Technological University,
Singapore 639798
*Corresponding author at: School of Civil and Environmental Engineering,
Nanyang Technological University, 639798 Singapore,
Singapore. Tel.: +65 6790 5327; fax: +65 6791 0676.
E-mail address: [email protected] (R. Wang).

2
Abstract
Five types of novel hollow fiber module configurations with structured-straight fibers,
curly fibers, central-tubing for feeding, spacer-wrapped and spacer-knitted fibers, have
been designed and constructed for the Direct Contact Membrane Distillation (DCMD)
process. Their module performances were evaluated based on permeation flux experiments,
fluid dynamics studies, and tracer-response tests for flow distribution as well as process
heat transfer analysis.
The novel designs showed flux enhancement from 53% to 92% compared to the
conventional module, and the spacer-knitted module had the best performance. The fluxes
of all the modified configurations, except the structured-straight module, were independent
of the feed flow velocity, and the modules with undulating membrane surfaces (curly and
spacer-knitted fibers) were able to achieve more than 300% flux improvement in the
laminar flow regime. The improved performance was attributed to the improved fiber
geometries or arrangements that can provide effective boundary layer surface renewal and
more uniform flow distribution, confirmed by the sodium chloride tracer response
measurements. The heat transfer analysis underscores the advantage of the module with
curly fibers with the least temperature polarization effect (temperature polarization
coefficient =0.81−0.65 at 303 333KmT ), which is favorable for enhancing permeation
flux.
Keywords: hollow fibers, module design, temperature polarization, membrane distillation

3
I. Introduction
Membrane distillation (MD) is a process for water treatment that is driven by a
temperature gradient across a microporous hydrophobic membrane between a hot feed
solution and a cold permeate. It involves both mass- and heat-transfer processes: the
evaporation of the water molecules at the hot interface, the transport of water vapor across
the porous partition (the membrane) and the condensation of water vapor at the cold interface
[1]. MD is a promising technique for water desalination because of several advantages: low
sensitivity to salt concentration and theoretically 100% salt rejection; feasibility to utilize
low-grade heat and renewable energy (e.g., waste heat or solar power); low vulnerability to
membrane fouling and good performance under mild operating conditions as compared to
conventional, multi-stage distillation or reverse osmosis (RO) [2, 3]. Direct contact
membrane distillation (DCMD) is the most studied and simplest mode among the various
MD processes because no external condenser is required as compared to vacuum membrane
distillation (VMD) and sweep gas membrane distillation (SGMD) [2, 4-6].
Despite many attractive characteristics and many lab-scale studies, MD has not been
widely implemented in industry [3, 7]. Major challenges impeding its application include the
following: developing appropriate MD membranes to avoid pore wetting; increasing the
permeation rates; assessing the energy consumption; and mitigating flow maldistribution
and/or poor hydrodynamics and severe temperature polarization (TP) that compromise
module performance [2]. In recent years a surge of studies have focused on membrane
development [8-12] and energy analysis [7, 13-16]. However, there has not been a

4
comprehensive investigation of MD module design. Yet the potential benefits of improved
module design indicate that a more intensive effort is needed in this area.
Thus far most of the work on hydrodynamic improvement in MD studies has focused
on flat sheet membrane modules that have small membrane areas and thus are limited to
laboratory research [5, 17-20]. In industry, hollow fiber-based membrane modules are
preferable due to their larger membrane area per unit volume and reduced vulnerability to
TP [1]. Although it has been often stated that poorly-designed hollow fiber modules will
result in reduced productivity, increased energy consumption and shortened membrane
lifespan [21], there are limited studies on improving fluid dynamics and designing hollow
fiber modules for MD applications in the open literature [3, 22-25]. It is well-recognized that
by incorporating proper flow alteration aids or modifying fiber geometries to create
secondary flows or eddies (such as novel fiber configurations or turbulence promoters, e.g.
spacers or baffles), the permeation flux can be enhanced and TP can be mitigated. An early
exploration on hollow fiber module design by Schneider et al. [25] in 1988 investigated the
effects of module size and modified fiber geometries on the transmembrane flux of the
DCMD process. It showed that larger modules could achieve uniform flow more easily than
smaller ones and certain capillary arrangements (twisted and braided geometries) could lead
to much higher fluxes than those with straight woven fabric designs. In 2008 Teoh et al. [24]
studied different hollow fiber configurations in the DCMD process and found that the
introduction of baffles could increase the feed-side heat-transfer coefficients leading to
20−28% flux enhancement. In addition, they also explored the concepts of wavy geometries

5
(twisted and braided) of hollow fibers that were able to achieve as high as a 36% flux
enhancement compared to the unaltered conventional modules. Recently, Yang et al. [12]
described strategies to improve PVDF-based module performance in the DCMD process that
included the investigations on the module size, packing density and critical fiber length
combined with heat-transfer analysis. Although the existence of simultaneous concentration
polarization (CP) and TP will lead to the reduction of mass and heat transfer driving forces,
it is well-established that the effect of CP in the DCMD system is negligible in comparison
to that of TP [26, 27]. Therefore, the quantification of the TP effect, which is used to assess
the thermal efficiency, is essential for the implementation of an MD system [1, 8, 26]. Yet,
none of the above-mentioned MD module studies have addressed associated conductive
heat loss or the mitigation of TP by altering the fiber geometries or introducing turbulence
aids.
In spite of the absence of comprehensive module design work for MD applications,
numerous prior studies have been done for general gas-liquid/ liquid-liquid contactors with
focuses on the introduction of turbulence promoters (baffles/spacers/channel designs) or
special housing configurations as well as on various aspects related to packing density, flow
uniformity and shell-side hydrodynamics [21, 28-33]. These studies concluded that
non-ideal flow distribution in a module will lead to less active membrane area, insufficient
mixing and local loss of driving force, and hence low heat- or mass-transfer efficiencies. A
recent review by Yang et al. [21] summarized the most practical membrane module design
concepts and dynamic shear-inducing techniques to enhance liquid separation by hollow

6
fiber modules. Unfortunately, very few of these design concepts have been adapted to MD
applications.
Moreover, no report was found to correlate the flow distribution with MD process
enhancement. In the DCMD process employing shell-side feed, the occurrence of
significant channeling, bypassing, or dead zones can greatly reduce the local driving force
and decrease the module performance. Hence, the detection of the flow distribution at the
shell-side is important for module design. There are two main methods for characterizing
the flow distribution: the experimental approach (tracer response technique) and
mathematical modeling [22, 31, 34]. The tracer technique is widely applied for the
characterization of the flow distribution and the degree of mixing in membrane bioreactors
as well as for the visualization of the shell-side flow distribution in randomly packed
membrane contactors [31, 35, 36]. It provides the residence-time distribution (RTD) for the
fluid in a closed vessel [37]. However, no comprehensive RTD study has been done to
evaluate MD module performance.
Therefore, this study attempts to develop novel hollow fiber module designs that can
improve hydrodynamics and thus the MD module performance. The following issues will
be addressed: (1) novel hollow fiber module design; (2) performance evaluation of various
designs based on flux enhancement; (3) hydrodynamic studies of modified modules; (3)
applications of tracer-response measurement for module flow distribution; (4) heat-transfer
analysis to quantify the TP effect and conductive heat loss of different design

7
configurations.
2. Experimental
2.1 Hollow fiber module fabrication & assembly procedure
Polyvinylidene fluoride (PVDF) hollow fiber membranes developed by a commercial
supplier were used to fabricate lab-scale MD modules. The fibers were potted into the
housings that are made by transparent Acrylic material, which is provided by local supplier
Acefund Pte Ltd., to facilitate direct observation of the flow conditions around the fiber
bundles. Various module configurations were assembled in different ways with similar
specifications (Table 1): inner diameter 19 mm and effective length 450 mm; packing
density of 30%; and membrane area of 0.1−0.11 m2. In this study a randomly packed
module, which contained 51 randomly packed fibers, was fabricated and used as the
conventional module benchmark. The fabrication procedure can be found in our previous
work [12]. In the module fabrication process, care must be taken to avoid damaging the
membrane surface and no metal parts were inserted.
Five novel designs were compared. First, a special module with structured-straight
fibers was fabricated by weaving all fibers into a fabric sheet that was subsequently rolled
up and packed into the housing (Fig. 1a). This structured array is anticipated to avoid the
clustering of hollow fibers and could possibly lead to more uniform flow distribution in the
shell-side.

8
The second module contains curly fibers (Fig. 1b). To create a curly fiber geometry, an
appropriate temperature and heat-treatment duration as well as a certain winding angle of
the curl were selected. The fibers were first rolled up around stainless steel rods (diameter
1.6 mm) with a winding angle of 60° and then placed in an oven at 60°C for 1hr until the
curly shape was permanently established. This configuration is expected to create an
undulating membrane surface that will help to change the flow geometry which might lead
to enhanced hydrodynamics and surface renewal under laminar flow conditions. To
characterize this configuration the major design variable is the winding angle.
To create transverse flow and more uniform fiber arrangement in a module, a central
tube was inserted and surrounded by the woven fabric sheet in the third design; the feed
inlet and outlet were still located at the shell-side via two drawtubes mounted on the central
tube (see Fig. 1c). The gaps between the drawtubes and the feed entrance or exit on the
housing were sealed using epoxy (Araldite®
) ; in this case the feed would mostly flow
through the holes on the central tube and the permeate would flow through the fiber lumen.
Caution must be taken when designing the interval and number of holes on the central tube,
because it is related to the uniformity of the flow distribution through the holes and the
degree of transverse flow pattern. To investigate the potential variations of this
configuration, the design of the central tube can be varied by adjusting the shapes of the
flow distributing holes and the intervals between holes. In addition, the tube size,
wall-thickness, size/shape of the holes and interval between the holes should be
appropriately chosen.

9
The fourth design with spacer-wrapped fibers is shown in Fig. 1d. Here the woven
fabric sheet was wrapped by spacers (with mesh size 1.6 mm) and rolled up. This is
expected to create transverse flow across the membrane surface by evenly allocating layers
of spacers between layers of fibers. However, it is possible that the inappropriate allocation
of spacers or a tightly packed pattern might lead to liquid stagnation that instead would
adversely affect the hydrodynamics.
In the fifth novel design that fibers were knitted into the mesh of the spacer (refer to
the spacer-knitted module in Fig. 1e) to facilitate a meandering fluid flow. The
inappropriate allocation of spacers or over-packed pattern can also lead to adverse effects
on the hydrodynamics due to the liquid stagnation between the mesh and fibers as observed
with the spacer-wrapped fibers.
2.2 Module performance evaluation and heat transfer analysis
To evaluate the module performance for various configurations, the following
experiments were carried out: (i) attainable flux experiments in which the feed temperature
was varied while holding the permeate temperature and other operating conditions constant;
(ii) fluid dynamics experiments in which the recirculating feed or permeate velocity was
varied while holding the other operating conditions constant. All the experiments were
conducted using the DCMD system. The experimental setup is shown in our previous work
[12]. Both the feed and permeate solutions were cycled through the hollow fiber module in

10
countercurrent mode. For the performance tests using synthetic seawater (3.5 wt% sodium
chloride solution), the operating details can be found in the literature [12].
Deionized (DI) water was also used in the experiments to investigate the TP effect
associated with the heat transfer analysis while excluding the CP effect. Both hot and cold
DI water streams were circulated countercurrently through the shell and lumen sides. On
the shell side the hot water was heated to between 308 K343 K and circulated by a
peristaltic pump (15.6 L·min-1
). On the lumen side the cold permeate was cooled by a
circulating bath (between 298 K328 K) and cycled by another peristaltic pump (0.1-2.1
L·min-1
). Two conductivity meters were installed to assess the water quality in the feed and
permeate sides, respectively. The product was collected in an overflow tank placed on a
balance (±0.1 g). The fluid dynamics experiments were performed with careful control of
the temperature difference (<10 K) between the hot feed and cold permeate.
2.3 Tracer response protocol
The tracer-response studies were conducted using the same DCMD set-up to
investigate the shell-side flow distribution in these modules. A schematic showing a module
with the location of tracer injection and effluent concentration monitors is depicted in Fig. 2.
At room temperature DI water was pumped into the shell-side of the modules as the feed
stream (blank background solution) and a pulse input of sodium chloride solution was
injected at the feed inlet. The tracer response signal was measured at the exit of the effluent
stream. Since the salt rejection of this PVDF-based hollow fiber membrane is 100% [12],

11
no leakage of the tracer was detected on the lumen side. The amount of tracer used was 1
mL with a concentration of 1 mol·L-1
. The resulting concentration of tracer at different
times was monitored by a conductivity meter (±0.1 µs·cm-1
) installed at the exit of the
effluent. The signals were monitored and recorded via a data-acquisition system. To
determine the relationship between the concentration of sodium chloride solution and
corresponding conductivity, samples of known concentrations were tested to obtain
conductivity values using an external conductivity bridge.
In this experiment the proper selection and use of the tracer are essential to get correct
E(t) curves that represent the age distribution of all components in the effluent stream. A
physical, nonreactive and unabsorbable chemical must be used as a tracer. A sodium
chloride solution meets these criteria and was therefore chosen in this study. The
concentration and dosage of the tracer solution also affect the results, and many attempts
were made to determine the appropriate concentration and dosage to detect the shell-side
flow distribution in the modules. In addition, the pumping speed had to be carefully chosen
due to the relatively small size of the test modules. The feed solution (pure water) was
pumped at 2.1−2.4 L·min-1
into the shell-side until the effluent had no recorded tracer. To
obtain reproducible and comparable results, the tracer tests for each module were repeated
8−10 times under constant operating conditions.
2.4 Error assessment
All the above-mentioned experiments were repeated and showed reproducible results.

12
The results for the water-flux fluctuation were within ±5% (illustrated as error bars in the
figures). The conductivity meters had accuracies of ±0.1 ms·cm-1
(feed side) and ±0.1
µs·cm-1
(permeate side), respectively. Two modules for each configuration were fabricated
by following the same procedures and measured repeatedly under the same operating
conditions. The temperature and flow rate variations were strictly controlled within ±0.4°C
and ±0.2 L·min-1
, respectively. These would also result in less flux fluctuation.
3. Theoretical basis for data analysis
3.1 Temperature polarization coefficient and heat loss analysis
This study focuses on the application of an experimental approach to quantify the TP
effect and acquire the temperature polarization coefficient (TPC). The following modeling
considerations (assumptions) are applied:
(a) Theoretically, the vapor flux N can be expressed in terms of the transmembrane
temperature difference when it is less than 10°C and pure water is used as feed [1]:
= T f m p mm
dPN C T T
dT (1)
where C is the mass-transfer coefficient, mT is the membrane temperature, fmT and
pmT are the membrane surface temperatures on the feed and the permeate sides, respectively.
By assuming the temperature polarization effect is similar on both sides of the membrane,
mT can be estimated by ( fT + pT )/2.
(b) The Clausius-Clapeyron equation is applicable to determine the vapor pressure
gradient dP/dT across the membrane when assumption 1) is satisfied. Hence,
13
2T Tm m
dP P M
dT RT
(2)
where (J۰kg-1
) is the latent heat-of-vaporization, M is the molecular weight of water, R is
the gas constant (8.314 J۰K-1
), and P is obtained from the Antoine equation [38].
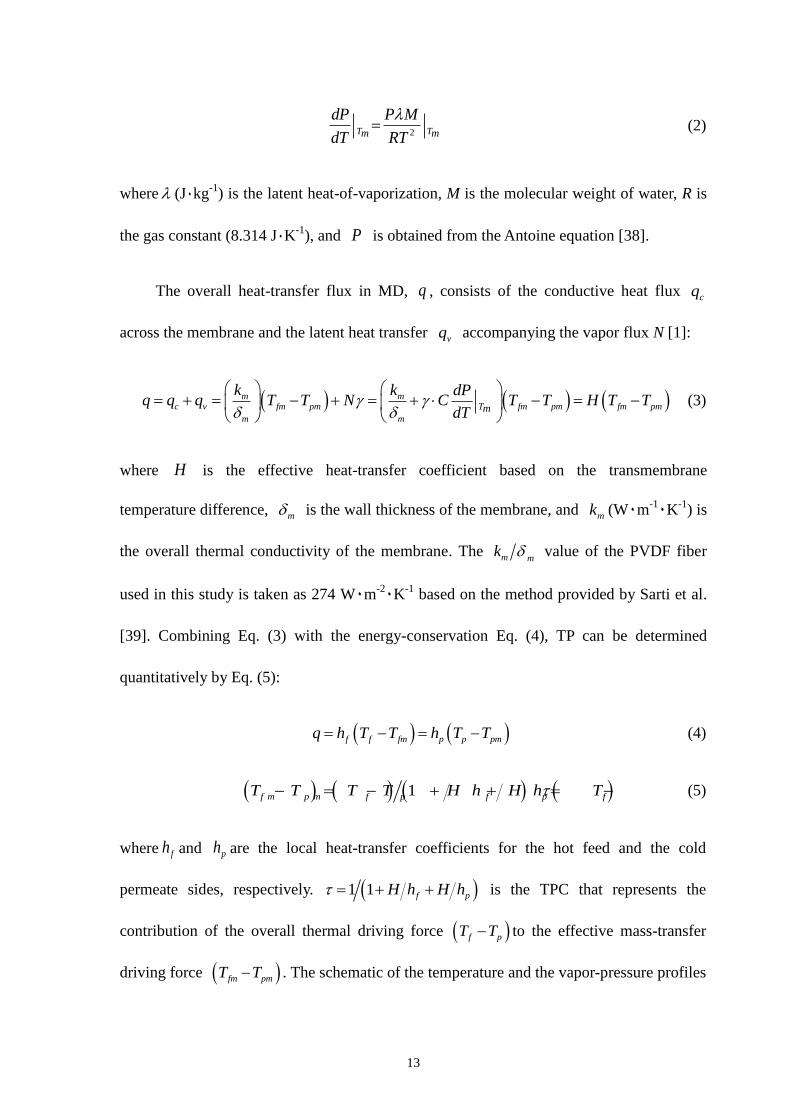
The overall heat-transfer flux in MD, q , consists of the conductive heat flux cq
across the membrane and the latent heat transfer vq accompanying the vapor flux N [1]:
m mc v fm pm T fm pm fm pm
m mm
k k dPq q q T T N C T T H T T
dT
(3)
where H is the effective heat-transfer coefficient based on the transmembrane
temperature difference, m is the wall thickness of the membrane, and mk (W۰m-1۰K
-1) is
the overall thermal conductivity of the membrane. The m mk value of the PVDF fiber
used in this study is taken as 274 W۰m-2۰K
-1 based on the method provided by Sarti et al.
[39]. Combining Eq. (3) with the energy-conservation Eq. (4), TP can be determined
quantitatively by Eq. (5):
f f fm p p pmq h T T h T T (4)
1f m p m f p f p f pT T T T H h H h T T (5)
where fh and ph are the local heat-transfer coefficients for the hot feed and the cold
permeate sides, respectively. 1 1 f pH h H h is the TPC that represents the
contribution of the overall thermal driving force f pT T to the effective mass-transfer
driving force fm pmT T . The schematic of the temperature and the vapor-pressure profiles

14
in the MD process is given in Fig. 3. Combining Eqs. (3) and (5) yields the following:
1 1 11 m mkT
N dP dT C h h
(6)
where 1 1 1f ph h h is the overall boundary layer heat-transfer coefficient and
f pT T T . Therefore, with the measurable quantitiesm m
k , fT , pT and N as well
as the predetermined values of dP dT from Eq (2), the only unknown parameters h and
C can be calculated from the intercept and the slope by plotting T
N
versus
1
dP dT as
explained by Schofield et al. [1].
3.2 Residence-time distribution (RTD)
This current study will use the sodium chloride tracer-response technique [37] for
investigating the flow distribution on the shell-side of novel hollow fiber configurations. An
example of an initial tracer concentration c (mol۰m-3
) and its corresponding temporal
values in the effluent stream known as C(t) curve for pulse injection is shown in Fig. 4. The
RTD function E(t) (s-1
) can be used to further interpret the residence-time results [37]:
0
( )( )
( )
C tE t
C t dt
(7)
where the denominator represents the dosage of the tracer injected at the feed entrance; it is
also the area under the C(t) curve.
In the RTD approach many metrics can be used to evaluate the results. One of the

15
main parameters is the mean residence time (tm, s) that can be calculated based on the E(t)
curve:
0( )mt tE t dt
(8)
The theoretical (plug flow) residence time t (s), which is also as known as hydraulic
residence time, is equal to the actual vessel volume V divided by the fluid flow rate 0Q . In
a hollow fiber MD module the difference between t and mt shows the degree of mixing
in the vessel [37], i.e., a larger deviation might indicate a longer contact time and hence
more effective heat transferred across the membrane. However, the uniformity of the flow
distribution is also crucial in the vessel design. Thus, another important parameter is used
to represent the spread of the RTD curve − the variance 2 ; a larger value indicates a
wider spread, or more deviation from the uniform flow pattern [37].
22
0( )mt t E t dt
(9)
In order to obtain comparable results for vessels of different size and mean residence
time, the normalized E(t) function and dimensionless form of variance are more commonly
used:
( ) ( )mE t E t (10)
2
22
201
m
E dt
(11)
By applying the above RTD theory with the experimentally measured parameters (e.g., the
tracer entrance concentration C0 and dosage of tracer injected) and a responding

16
concentration curve C(t) that can be obtained from the assessment of tracer concentration in
the effluent stream, the RTD function curve E(t) can be determined based on Eq. (7). Thus,
the mean residence time tm and variance 2 (as well as the dimensionless variance) can be
calculated based on Eqs. (8) to (11), respectively.
4. Results and discussion
4.1 Membrane properties
As mentioned previously, a newly-developed PVDF hollow fiber membrane was
characterized and tested in the current study; its properties are given in Table 1. It can be
seen that this highly porous PVDF fiber showed reasonably large contact angles for water,
high liquid-entry pressure for water (LEPw), good mechanical strength, small maximum
pore size and a narrow pore-size distribution. More information on the methodologies for
membrane characterization can be found in our previous work [12].
4.2 Attainable flux (feed-temperature tests)
Fig. 5 plots the permeation flux as a function of feed temperature for six module
configurations. All five modified modules show improved performance over the
conventional randomly packed module. The greatest enhancement is achieved by the
modules with spacer-knitted and curly fibers for which the flux is increased more than 90%
at Tf =313 K and 70% at Tf =333 K, respectively. The modules with curly fibers and
spacer-wrapped fibers show similar performance, while those with central tubing and
straight fibers are slightly lower, but still show significant improvement over the randomly

17
packed module. Teoh et al. [24] reported that the maximum flux enhancement achieved in
modules with spacers/baffles or wavy geometries was only from 20 to 36% at feed
temperature Tf =348 K. In comparison, the 70 to 90% improvement under milder operating
temperature in this study is encouraging, and may be due to more appropriate choice of
flow rates.
The enhancement of permeation flux in the modified modules would be due to the
improved hydrodynamic conditions achieved by the modified shell-side flow channels in
the novel configurations. Hence, it is anticipated that the heat and mass transfer would
increase and the TP effect would decrease in a well-designed module when compared to the
conventional randomly packed configuration. The discussion in the following sections
addresses these points. In addition, another important factor that could affect the heat- and
mass-transfer processes is fluid channeling or bypassing (shell-side) that was characterized
using the tracer-response technique and will be discussed later.
4.3 Fluid dynamics
Experiments were performed to study the effects of the recirculating flow velocities
(characterized as Reynolds number, Re, of the feed and permeate) on the fluxes in different
membrane modules. Fig. 6 shows the permeation flux as a function of the Ref of the feed
flow for six different modules. Four of these novel designs show relatively stable fluxes in
the range of 10 to 12 kg·m-2
·h-1
from extremely low Ref (laminar condition, e.g., fRe 500 )
to turbulent conditions ( fRe >2000 ). This represents a significant improvement over the

18
conventional randomly packed module as well as the structured-straight module, whose
flux initially was rather low and increased with increasing fRe until turbulent flow
occurred. It is well understood that the steady flux across the Re range indicates a shift to the
heat and mass transfer being controlled by the membrane and/or the lumen-side boundary
layer. Normally, a higher recirculating velocity (i.e., higher mixing intensity) can help to
reduce the thickness of the boundary layer adjacent to membrane surface and maximize the
driving force between the feed and permeate sides [14, 40, 41], which is favorable for the
mitigation of concentration and temperature polarizations. However, increased pumping
energy is required to provide a higher velocity. From this study it can be seen that a much
lower velocity can be chosen by employing novel configurations to reach the steady flux.
Hence, there is no need to increase the flow rate.
From Fig. 6 it can also be observed that when compared with the randomly packed
module, a one to three-fold flux enhancement could be obtained even at an extremely low
flow velocity in four modified configurations. The highest flux enhancement (>300 %) was
achieved by the modules with undulating membrane surface (spacer-knitted and curly
fibers) under a low operating flow rate range. This might be due to a more even flow
distribution in the modified module that improves the fluid dynamics. This finding will be
corroborated by conducting residence-time distribution (RTD) tests in the later section (4.4).
For example, the module with spacer-knitted fibers would facilitate a meandering fluid flow,
thereby achieving a well-mixed condition. Moreover, secondary flows might be induced
simultaneously to achieve more efficient heat and mass transfer.

19
Experiments were also conducted to investigate the effect of the lumen-side resistance
by varying the recirculating permeate flow velocity ( pRe ). Fig. 7 plots the permeation flux
as a function of the permeate-side flow rate for six module configurations with Ref =1901.3.
A similar response to the increase of the permeate flow rate as the randomly packed module
presented was observed for the five modified modules. Our previous work [12] indicated
that the heat-transfer process could be enhanced by increasing the velocity to minimize the
thermal boundary layer on the permeate side; i.e., when the temperature at the membrane
surface approaches the temperature in the bulk permeate, the driving force for vapor
transport through the membrane can be maximized. Moreover, an early onset of the steady
state was observed at Rep<200. The possible reason may be due to the increased transverse
vapor flux that helped break down the laminar boundary layer, thus greatly enhancing the
mixing on the membrane surface and facilitating the heat transfer at the permeate side. In
addition, the four modified configurations show 28 to 39% flux enhancement compared to
that of the with structured-straight module and a more significant improvement (110 to
127%) over the conventional randomly packed module after reaching a steady state
(attainable fluxes). This is probably due to the enhanced heat transfer at the feed sides of
those improved geometries, leading to a higher transmembrane vapor flux and
consequently more efficient heat transfer at the permeate side.
4.4 Residence-time distribution (RTD) tests
In the RTD tests, when the sodium chloride solution was injected into the module at the

20
feed inlet, it took time to travel through the whole system before reaching and being
detected by the conductivity analyzer located at the feed outlet. The theoretical residence
time, based on a plug flow vessel of the same actual volume (Vhousing-Vfibers), was calculated
to be approximately 7.2 seconds from the injection point to the detector with a flowrate of
2.1−2.4 L۰min-1
and a connecting tubing length of approximately 500 mm. The tracer
responses for different modules are shown in Fig. 8, which plots the concentration of the
tracer in the effluent stream as a function of time. To view the experimentally determined
C(t) curves more clearly, Fig. 8 depicts only the first 20 seconds of each module test. The
solid lines and dots represent the experimental data, while the dashed lines are the Gaussian
distribution curves (normalized distribution) that have symmetric shapes to simplify the
probability prediction. For further comparison the average values of mean residence time tm
and the dimensionless variance σθ for each module are summarized in Table 2.
It can be seen from Fig. 8 that the curves of the randomly packed and
structured-straight modules have double peaks that imply the existence of parallel flow
paths or channeling in the modules [37]. Also, the relatively early peaks accompanied the
occurrence of long tails on the right of the curves, implying that these two modules could
be subjected to stagnant backwaters (local dead zone effects). The summary in Table 2
shows that their RTD curves have relatively wider dispersions (0.263 & 0.115) than the
other modules.
Several researchers [35, 37, 42, 43] have stated that the variance is an important metric

21
to evaluate the flow distribution. A smaller variance indicates a narrower RTD curve
dispersion and a more ideal flow pattern. For example, the last three modules (Fig. 8) with
curly, spacer-knitted and spacer-wrapped fibers show similar C(t) curves with a relatively
spiked and asymmetric shape that indicate a reasonably uniform flow distribution, which is
consistent with their small variances (lower than 10%, Table 2) indicating narrow curves.
Although these three modules have relatively larger mean residence times tm, which
deviates from the plug flow behavior, they showed higher fluxes and enhanced
performance in hydrodynamic investigations when compared to the other configurations.
This may be due to their more complicated flow paths caused by the modified geometries
that promote more even flow distribution and induce secondary flows to greatly enhance
the mass/heat transfer between the hot feed and cold permeate. In addition, a direct
comparison of the variance is illustrated in the histogram in Fig. 9 that shows a plot of
dimensionless variance for the various module configurations. Interestingly, the overall
RTD results correlate with the module performance.
4.5 Temperature-Polarization coefficient (TPC) and heat-loss assessment
A series of pure water tests were performed in the laminar flow regime to determine
the corresponding heat-transfer coefficients and TPC for the various module configurations.
The unknown parameters h and C were obtained based on the known operating
parameters and membrane properties by plotting T
N
vs.
1
dP dT, as shown in Fig. 10.
Based on these plots, the heat transfer coefficient h was found to be from 943

22
W۰m-2۰K
-1 for the module with randomly packed fibers to 2300 W۰m
-2۰K
-1 at =333KmT
for the module with curly fibers, which is consistent with its performance evaluation results.
Also, the TPC and ratio of the conductive heat loss to the overall heat flux cq q for each
configuration are shown in Figs. 11 & 12 as functions of the membrane temperature mT ,
respectively. It can be seen that both the TPC and cq q decrease with increasing
membrane temperature mT . The TPC decreases because the higher fluxes generated by the
higher vapor pressure gradient of dP dT [(Eq. (2)] result in an increase in the effective
membrane heat transfer coefficient H [(Eq. (3)]. Comparing the various designs (Fig. 11)
the module with curly fibers shows the least temperature polarization under the same
operating conditions (e.g., TPC 0.8 at =303KmT and 0.65 at 333K ), followed by the
module with central tubing and spacer-knitted fibers; while the modules with
structured-straight and randomly packed fibers display higher vulnerability to the
temperature-polarization effect. This again underscores the enhanced driving force and
improved performance by the module with curly fibers. However, it is noted that the
module with spacer-knitted module has a slightly lower TPC. This may be due to the more
complicated layout and insertion of spacers leading to possibly lower thermal efficiency.
Overall, compared to the TPC range (0.4−0.7) achieved by a typical MD system with
satisfactory module performance [8], the current results are encouraging.
The ratio of the conductive heat loss to total heat flux, cq q , also decreases with
increasing membrane temperature (Fig. 12), because cq has linear relationship with the
temperature difference fm pmT T while the evaporation heat eq shows an exponentially

23
increasing trend [Eq. (3)]. Interestingly, the module with curly fibers loses a larger portion
of heat to conduction (e.g., 55% at =30 CmT
and 23% at 333 K), which is explained by
a higher TPC and hence higher transmembrane temperature differences (driving force).
Therefore, a trade-off exists between the TPC and the ratio of conductive heat loss to the
total heat flux for module performance. However, it has been widely reported that the ratio
of conductive heat loss to overall heat flux across the membrane is from 20% to 50% in a
typical MD unit [8]. Thus, the conductive heat-loss levels of the best performing modules
are still acceptable for the range of operating temperatures studied here. For example, the
module with curly fibers had a TPC 0.65 and 23%cq q at 333KmT .
Based on the above results, a summary is given in Table 3 to provide an overall
comparison for all configurations. In general, the modules with undulating membrane
surface (e.g., curly and spacer-knitted fibers) show advantages by achieving higher vapor
permeability and mitigating TP effect with reasonably lower energy losses; this is mainly
due to the enhanced shell-side hydrodynamics induced by altered fiber geometries and
relatively uniform shell-side flow distribution.
5. Conclusions
In this study, five types of novel hollow fiber module configurations were designed and
constructed for the DCMD process. Their module performances were evaluated based on
permeation flux experiments, fluid dynamics investigation, and tracer-response tests as well
as process heat-transfer analysis.

24
Experiments reveal that the novel module designs are able to enhance permeation flux
up to 90% as compared to the conventional module, and the modules with curly and
spacer-knitted fibers had the best performance.
The fluid dynamic studies show that the performance of all modified configurations
except the structured-straight module are independent to the feed flow velocity, and the
modified fiber geometries with undulating membrane surface can achieve up to
three-fold flux enhancement in the laminar flow regime.
The sodium chloride tracer response technique is able to reveal the shell-side flow
pattern and distribution for various designs. Improved fiber geometries or
arrangements can provide a better flow distribution , thus much lower pumping energy
cost and higher thermal efficiency could be accomplished.
The heat transfer analysis underscores the advantage of the modules with undulating
membrane surface for mitigating TP. Although a trade-off exists between the TPC and
conductive heat loss, all modified modules showed acceptable heat loss within the
range of operating temperatures.
Acknowledgments
The authors thank the Singapore Environment and Water Industry Council for funding the
Singapore Membrane Technology Centre (SMTC) where this study was performed.
Support from Siemens Water Technology is also gratefully acknowledged. Also, special

25
thanks go to Professor William B. Krantz for his help in writing this paper.

26
Nomenclature
A Effective membrane area, m2
C Mass-transfer coefficient or membrane-distillation coefficient,
kg·m-2
·h-1
·kPa-1
C(t) Temporal tracer concentration at the effluent, mol۰m-3
0c
Pulse injection tracer concentration at the feed entrance, mol۰m-3
od Outer diameter of the hollow fiber, mm
sd Housing diameter of the module, mm
tE Tensile modulus, MPa
H Effective heat-transfer coefficient based on the temperature difference
across the entire membrane, W۰m-2۰K
-1
h Overall heat-transfer coefficient
1 1
f ph h , W۰m
-2۰K
-1
fh Feed-side local heat-transfer coefficient, W۰m-2۰K
-1
ph Permeate-side local heat-transfer coefficient, W۰m-2۰K
-1
mk Thermal conductivity of membrane, W۰m-1۰K
-1
L Effective fiber length, mm
M
Molecular weight of water, g۰mol-1
m Total amount of tracer, mol
n Number f fibers
N Vapor flux, kg·m-2
·h-1

27
P Vapor pressure of the bulk streams, kPa
q Total heat flux, W۰m-2
cq Conductive heat loss through the membrane, W۰m-2
vq Latent heat flux, W۰m-2
fQ Feed flow rate, L min-1
pQ Permeate flow rate, L min-1
0Q Influent flow rate in tracer study, m3۰s
-1
R
Gas constant, 8.314 J۰K-1
Re
Reynolds number, hd
maxr Maximum pore size, μm
meanr Mean pore size, μm
fT Bulk temperature of the feed, K
fmT Temperature at the membrane surface on the feed side, K
mT Membrane temperature, K
pT Bulk temperature of the permeate, K
pmT Temperature at the membrane surface on the permeate side, K
T Bulk temperature difference, K
t
Time, s
tm Mean residence time, s
t Theoretical residence time of the vessel 0V Q , s
V Volume of the vessel, m3

28
fv Recirculated feed velocity, m·s−1
pv Recirculated permeate velocity, m·s−1
Greek letters
Membrane porosity, %
Module packing density, %
Temperature-polarization coefficient (TPC)
2 Variance, s2
2
Dimensionless variance
Dimensionless time
b Strain at fiber breakage, %
m Membrane thickness, μm
latent heat-of-vaporization, J۰kg-1
ρ Density of water, kg۰m-3
μ Viscosity of water, Pa۰s
Subscripts
f Feed
p Permeate

29
References
[1] R. W. Schofield, A. G. Fane and C. J. Fell, Heat and mass transfer in membrane
distillation, J. Membr. Sci., (33) (1987) 299-313
[2] K. W. Lawson and D. R. Lloyd, Membrane distillation, J. Membr. Sci., 124 (1) (1997)
1-25
[3] M. S. El-Bourawi, Z. Ding, R. Ma and M. Khayet, A framework for better
understanding membrane distillation separation process, J. Membr. Sci., 285 (1-2) (2006)
4-29
[4] M. Khayet, P. Godino and J. I. Mengual, Theory and experiments on sweeping gas
membrane distillation, J. Membr. Sci., 165 (2000) 261
[5] J. Phattaranawik, R. Jiraratananon and A. G. Fane, Heat transport and membrane
distillation coefficients in direct contact membrane distillation, J. Membr. Sci., 212 (2003)
177-193
[6] M. Khayet, M.P. Godino and J. I. Mengual, Thermal boundary layers in sweeping gas
membrane distillation processes, AIChE J, 48 (7) (2002) 1488-1497
[7] H. Susanto, Towards practical implementations of membrane distillation, Chem. Eng.
Process., 50 (2011) 139-150
[8] M. Khayet, Membranes and theoretical modeling of membrane distillation: a review,
Adv. Colloid Interface Sci., 164(1-2) (2011) 56-88
[9] A. Chanachai, K. Meksup and R. Jiraratananon, Coating of hydrophobic hollow fiber
PVDF membrane with chitosan for protection against wetting and flavor loss in osmotic
distillation process, Sep. Purif. Technol., 72 (2) (2010) 217-224
[10] M. Su, M. M. Teoh, K. Y. Wang, J. Su and T.-S. Chung, Effect of inner-layer thermal
conductivity on flux enhancement of dual-layer hollow fiber membranes in direct contact
membrane distillation, J. Membr. Sci., 364 (1-2) (2010) 278-289
[11] J. Zhang, J.-D. Li, M. Duke, Z. Xie and S. Gray, Performance of asymmetric hollow
fibre membranes in membrane distillation under various configurations and vacuum
enhancement, J. Membr. Sci., 362 (1-2) (2010) 517-528
[12] X. Yang, R. Wang, L. Shi, A. G. Fane and M. Debowski, Performance improvement of
PVDF hollow fiber-based membrane distillation process, J. Membr. Sci., 369 (1-2) (2011)
437-447

30
[13] M. Gander, B. Jefferson and S. Judd, Aerobic MBRs for domestic wastewater
treatment: a review with cost considerations, Sep. Purif. Technol., 18 (2) (2000) 119
[14] M. Khayet, M.P. Godino and J.I. Mengual, Possibility of nuclear desalination through
various membrane distillation configurations: a comparative study, International Journal of
Nuclear Desalination, 1 (1) (2003) 30-46
[15] A. Zhu, P. D. Christofides and Y. Cohen, Minimization of energy consumption for a
two-pass membrane desalination: effect of energy recovery, membrane rejection and
retentate recycling, J. Membr. Sci., 339 (1-2) (2009) 126-137
[16] C. Cabassud and D. Wirth, Membrane distillation for water desalination: how to chose
an appropriate membrane?, Desalination, 157 (1-3) (2003) 307-314
[17] L. Martínez-Díez, M. I. Vázquez-González and F. J. Florido-Díaz, Study of membrane
distillation using channel spacers, J. Membr. Sci., 144 (1-2) (1998) 45-56
[18] M. N. Chernyshov, G. W. Meindersma and A. B. d. Haan, Comparison of spacers for
temperature polarization reduction in air gap membrane distillation, Desalination, 183
(2005) 363
[19] L. Martínez-Díez and J. M. Rodríguez-Maroto, Characterization of membrane
distillation modules and analysis of mass flux enhancement by channel spacers, J. Membr.
Sci., 274 (2006) 123-137
[20] J. Phattaranawik and R. Jiraratananon, Direct contact membrane distillation: effect of
mass transfer on heat transfer, J. Membr. Sci., 188 (2001) 137
[21] X. Yang, R. Wang, A. G. Fane, Chuyang Y.Tang and I. G. Wenten, Membrane module
design and dynamic shear-induced techniques to enhance liquid separation by hollow fiber
modules: a review, Sep. Purif. Technol., submitted (2010,August)
[22] Z. Ding, L. Liu and R. Ma, Study on the effect of flow maldistribution on the
performance of the hollow fiber modules used in membrane distillation, J. Membr. Sci.,
215 (2003) 11-23
[23] L. Cheng, P. Wu and J. Chen, Modeling and optimization of hollow fiber DCMD
module for desalination, J. Membr. Sci., (318) (2008) 154–166
[24] M. M. Teoh, S. Bonyadi and T.-S. Chung, Investigation of different hollow fiber
module designs for flux enhancement in the membrane distillation process, J. Membr. Sci.,
311 (1-2) (2008) 371-379
[25] R. Schneider, W. Hölz, R. Wollbeck and S. Ripperger, Membranes and modules for
transmembrane distillation, J. Membr. Sci., 39 (1) (1988) 25-42

31
[26] M. Khayet, M. P. Godino and J. I. Mengual, Study of Asymmetric Polarization in
Direct Contact Membrane Distillation, Sep. Sci. Technol., 39 (1) (2005) 125-147
[27] L. Martinez-Diez and M. I. Vazquez-Gonzalez, Temperature and concentration
polarization in membrane distillation of aqueous salt solutions, J. Membr. Sci., 156 (1999)
265-273
[28] I. Noda, D. G. Brown-West and C. C. Gryte, Effect of flow maldistribution on hollow
fibre dialysis-experimental studies, J. Membr. Sci., 5 (1979) 209
[29] R. Prasad and K. K. Sirkar, Dispersion-free solvent extraction with microporous
hollow-fiber modules, AIChE J., 34 (2) (1988) 177
[30] M. J. Costello, A. G. Fane, P. A. Hogan and R. W. Schofield, The effect of shell side
hydrodynamics on the performance of axial flowhollowfibre modules, J. Membr. Sci., 80
(1993) 1-11
[31] J. Lemanski and G. G. Lipscomb, Effect of shell-side flows on hollow fiber membrane
device performance, AIChE J., 41 (1995) 2322-2326
[32] J. Wu and V. Chen, Shell-side mass transfer performance of randomly packed hollow
fiber modules, J. Membr. Sci., 172 (2000) 59
[33] J. Zheng, Y. Xu and Z. K. Xu, Flow distribution in a randomly packed hollow fiber
membrane module, J. Membr. Sci., 211 (2003) 263-269
[34] Y. Wang, F. Chen, Y. Wang, G. Luo and Y. Dai, Effect of random packing on
shell-side flow and mass transfer in hollow fiber module described by normal distribution
function, J. Membr. Sci., 216 (2003) 81-93
[35] T. J. Rector, J. L. Garland and S. O. Starr, Dispersion characteristics of a rotating
hollow fiber membrane bioreactor: effects of module packing density and rotational
frequency, J. Membr. Sci., 278 (2006) 144-150
[36] Y. Wang, Sanly, M. Brannock and G. Leslie, Diagnosis of membrane bioreactor
performance through residence time distribution measurements - a preliminary study,
Desalination, 236 (2009) 120-126
[37]O. Levenspiel, Chemical Reaction Engineering, Third Edition, John Wiley & Sons, Inc,
1999
[38] T.K. Sherwood, R.L. Pigford and C. R. Wilke, Mass Transfer, McGraw-Hill, New
York, 1975
[39] G. C. Sarti, C. Gostoli and S. Matulli, Low energy cost desalination processes using
hydrophobic membranes, Desalination, 56 (1985) 277-286

32
[40] F. A. Banat and J. Simandl, Theoretical and experimental study in membrane
distillation, Desalination, 95 (1994) 39-52
[41] S. Bouguccha, R. Chouilkh and M. Dhahbi, Numerical study of the coupled heat and
mass transfer in membrane distillation, Desalination, 152 (2002) 245
[42] V. Dindore, A. Cents, D. Brilman and G. Versteeg, Shell-side dispersion coefficients in
a rectangular cross-flow hollow fibre membranre module, Chem. Eng. Res. Des., 83 (A3)
(2005) 317-325
[43] M. W. D. Brannock, Y. Wang and G. Leslie, Evaluation of full-scale membrane
bioreactor mixing performance and the effect of membrane configuration, J. Membr. Sci.,
350 (1-2) (2010) 101-108

33
List of Figures:
Fig. 1. Novel module design and fabrication: (a) Structured-straight module; (b) Curly-fiber
module; (c) Central-tubing module; (d) Spacer-wrapped module; (e) Spacer-knitted module
Fig. 2. Schematic of tracer-response experiment
Fig. 3. Temperature and pressure profiles in MD
Fig. 4. The tracer-response concentration at different exit times for pulse tracer injection
flowing through a vessel filled with liquid (no chemical reaction or adsorption occurred)
Fig. 5. Effect of feed temperature on the permeation flux for various hollow fiber module
configurations [Qf =3 L۰min
-1
(vf =0.33m۰s
-1
), Qp =0.4 L۰min
-1
(vp =0.08m۰s
-1
), Tp =298K,
Tf =323K]
Fig. 6. Effect of recirculated feed velocity on permeation flux (3.5%NaCl solution as feed
vf =0.08~0.47 m٠s
-1
vp=0.08 m٠s
-1
, Tp =298K, T
f =323K)

34
Fig. 7. Effects of recirculated permeate velocity for various hollow fiber module
configurations [3.5% NaCl solution as feed Qf =4 L٠min-1
(vf =0.33 m٠s-1
), Qp =0.1-2.1
L٠min-1
(vp <0.5 m٠s-1
), Tp =298K, Tf =323K]
Fig. 8. RTD concentration C(t) response curves for various configurations in tracer tests
(Background solution: pure water; tracer: sodium chloride solution, 1mol/L; amount: 1mL;
Qf =2.5 L٠min-1
, Tf=298 K)
Fig. 9. Comparison of variance for various module configurations (Background solution:
pure water; tracer: sodium chloride solution, 1mol/L; amount: 1mL; Qf =2.5 L٠min-1
,
Tf=298 K)
Fig. 10. Relationship between T
N
vs.
1
dP dT [Qf =4 L۰min
-1(Ref=1800), Qp =0.8
L۰min-1
(Rep=180), Tm=303~333K]
Fig. 11. Comparison of the TP effect for various module configurations in pure water tests
[Qf =4 L۰min-1
(Ref=1800), Qp =0.8 L۰min-1
(Rep=180), Tm=303~333K]

35
Fig. 12. Heat-loss assessment for various module configurations in pure water tests [Qf =4
L۰min-1
(Ref=1800), Q
p =0.8 L۰min
-1
(Rep=180), T
m=303~333K]

36
List of Tables
Table 1 Module specifications and membrane properties
Table 2 Overall RTD results for various configurations
Table 3 Overall comparison for various configurations