a novel technique for improving hardware trojan detection
TRANSCRIPT

A Novel Technique for Improving Hardware Trojan Detection and
Reducing Trojan Activation Time
Hassan Salmani and Mohammad Tehranipoor
ECE Department
University of Connecticut
{salmani h,tehrani}@engr.uconn.edu
Jim Plusquellic
ECE Department
University of New Mexico
Abstract— Fabless semiconductor industry and governmentagencies have raised serious concerns about tampering withinserting hardware Trojans in IC supply chain in recent years.Most of the recently proposed Trojan detection methods arebased on Trojan activation to observe either a faulty outputor measureable abnormality on side-channel signals. Time toactivate a hardware Trojan circuit is a major concern from theauthentication standpoint. This paper analyzes time to generatea transition in functional Trojans. Transition is modeled bygeometric distribution and the number of clock cycles required togenerate a transition is estimated. Furthermore, a dummy scanflip-flop insertion procedure is proposed aiming at decreasingtransition generation time. The procedure increases transitionprobabilities of nets beyond a specific threshold. The relationbetween circuit topology, authentication time, and the thresholdis carefully studied. The simulation results on s38417 benchmarkcircuit demonstrate that, with a negligible area overhead, ourproposed method can significantly increase Trojan activity andreduce Trojan activation time.Index Terms — Security, Hardware Trojan, Trojan Detection,Trojan Activation Time, Dummy Flip-Flop Insertion
I. INTRODUCTION
Outsourcing design and fabrication process has become a
trend in Integrated Circuit (IC) market due to economical
profit, with limiting the control of customer over IC supply
chain. Motivated adversary takes advantage of such restriction
to tamper IC supply chain by maliciously implanting extra
logic as hardware Trojan circuitry into an IC [1]. Consequently
serious concerns rise about security and trustworthiness of
electronic systems. An attacker can change a design netlist or
subvert the fabrication process by manipulating design mask,
without affecting the main functionality of the design [2].
Hardware Trojan detection is an extremely challenging
problem and traditional structural and functional tests cannot
effectively address it. Trojan circuits have stealthy nature and
are triggered in rare conditions. Trojans are designed such
that they are silent most of their life time and may have very
small size relative to their host design, with featuring limited
contribution into design characteristics. These suggest that
they most likely connect to nets with low controllability and/or
observability [3][4][5]. It is expected that Trojan inputs are
supplied by nets with low transition probabilities to lessen its
impact on circuit side-channel signals such as power and delay.
Automatic Test Pattern Generation (ATPG) methods used in
manufacturing test for detecting defects do so by operating on
the netlist of the Trojan-free circuit. Therefore, existing ATPG
algorithms cannot target Trojan directly [3].
Trojan detection makes efficient pattern generation nec-
essary to disclose Trojan impact on design characteristics
beyond process and environmental variations. Trojan detection
methods using transient power analysis [6][7][8][9] require
patterns that increase Trojan activity whereas keep circuit
activity low to magnify Trojan contribution into the circuit
power consumption. Methods that are based on delay analysis
[10] [11] require patterns that generate transition on nets that
supply Trojan inputs to reveal wiring and input gate resis-
tance and capacitance impact of Trojan on the circuit delay
characteristic. From authentication standpoint, it is critical to
(i) analyze time to generate a transition at Trojan input and in
Trojan circuit and (ii) reduce authentication time.
In this paper, we develop a methodology to increase the
probability of generating a transition in functional Trojan cir-
cuits and to analyze the transition generation time. Transition
probability is modeled using Geometric Distribution [12] and
is used to estimate number of clock cycles required to generate
a transition on a net. An efficient dummy flip-flop insertion
procedure is proposed to remove rare triggering condition of
Trojans. The procedure identifies nets with transition probabil-
ity less than a specific transition probability and inserts dummy
flip-flops such that the transition probabilities of all nets in
design are greater than the specific transition probability. It
should be noted that dummy flip-flops are inserted in a way
that will not change the functionality and timing of design.
The effectiveness of dummy flip-flop insertion is examined
by evaluating different transition probability thresholds for
various Trojan circuits. The relation between authentication
time, the number of required transitions in Trojan circuit,
and tester clock is studied. These parameters would help
determine the transition probability threshold of a design. The
transition probability threshold, in turn, provides an estimation
of area overhead induced by inserted dummy flip-flops. Our
simulation results show significant improvement in Trojan
detection and reduction in Trojan activation time.
The paper is organized as following: Section II describes
prior work on Trojan detection. Analyzing Trojan activation
time is presented is Section III. The proposed dummy flip-
flop insertion procedure is presented in Section IV. Transition
probability threshold analysis and simulation results are pre-
sented in Sections V and VI. Finally the concluding remarks
are presented in Section VII.
1

II. PRIOR WORK
In [4], the authors present a sustained vector technique. A
vector is applied to circuit and for several clock cycles (up
to 25) primary inputs are kept unchanged. In this way all
transitions in the circuit would be attributed to state bits and it
is expected that activities converge to a specific portion of the
circuit after some clock cycles. By applying the next vector
another portion of the circuit will be targeted.
Authors in [8] present a method to generate a power
fingerprint of genuine ICs considering various types of noise
in the circuit. Random patterns are applied to IC-Under-
Authentication (IUA) to generate a measurable difference
between the power profiles of the genuine IC and IUA.
The proposed method in [9] is based on analyzing local
IDDT current measured from power ports on the target chip.
A calibration process is performed for each IUA before actual
measurement to alleviate process variations impact. Trojan-
inserted designs are distinguished using outlier analysis. In
[13], a multiple supply transient current integration method
is presented to detect hardware Trojans in IUA. The current
is measured locally from various power pads or controlled
collapse chip connections (C4s) on the die. Random patterns
are applied to increase the switching in the circuit in a test-
per-clock fashion [14].
A randomization based probabilistic approach to detect
Trojans is presented in [15]. The authors show that it is
possible to construct a unique probabilistic signature for each
circuit by applying input patterns with specific probability.
The output of IUA after applying each pattern is compared
with that of golden circuit. In case of any difference, Trojan
infection is reported. Otherwise, after applying a set of Nvectors if the IUA and golden circuit give the same output,
using statistical reasoning, it is reported that the IUA is Trojan-
free with a confidence interval.
Gate-level characteristics can be used to detect hardware
Trojans [16][17]. Delay and power characteristics of each gate
of a design subjected to process variation can be individually
extracted. Linear programming is used to solve a system
of equations created using non-destructive measurements of
power and delays. Any extra power consumption or excessive
delay caused by Trojan may manifest in measurement error or
new characteristics for circuit’s gates.
A comprehensive taxonomy of Trojans in integrated circuits
is presented in [3]. Trojans are classified based on physical,activation, and action characteristics. The physical char-
acteristic studies type, size, distribution, and structure of
a Trojan. In terms of type, Trojan can be functional or
parametric. Functional Trojans are realized through adding
or deleting of transistors or gates, while parametric ones are
realized through modification of physical geometry of design
to sabotage reliability. The number of gates or transistors
which are added or deleted defines Trojan size. Distributionrefers to the locations of Trojan components in physical layout.
They can be tight (i.e. placed close to each other) or loose (i.e.
dispersed across the layout.) Trojan insertion can affect chip
dimension, delay characteristic and power profile of a circuit.
Trojan activation characteristics refer to criteria that cause
Trojan to activate and carry out its disruptive function. The
types of disruptive behavior introduced by Trojan determines
Trojan action characteristics. For more details on Trojan
taxonomy, reader is referred to [3]. In this work, we focus
on functional Trojans and targeting parametric Trojans will be
part of our future work.
III. TROJAN ACTIVATION TIME ANALYSIS
Since there is no information about Trojan circuit in terms
of size, type, or location, from authentication standpoint, it is
crucial to analyze Trojan activation time (partially or fully).
In this paper, full activation of Trojan refers to patterns that
activate Trojan so that it impacts the circuit output and causes
malfunction. However, partial activation refers to generating
one or more transitions inside Trojan circuit so that it improves
the effectiveness of transient power-based methods [8][9][13].
In general, a functional Trojan consists of two parts: Trigger
and Payload [18]. The Trigger circuit is mostly inactive by
nature with no Payload effect. Under certain rare conditions
or events, the Trojan is activated (triggered) and then Payload
injects an error to the circuit. Generating transition in Trojan
circuit depends on its implementation. Switching at the first
level gates of Trojan circuit depends on its preceding cells.
The next levels of Trojan circuit are similar to the first level;
therefore, in the following, we focus on generating switching
in one Trojan gate at the first level of a Trojan circuit to carry
out our detailed analysis. However, the results in Section VI
will be presented for the entire Trojan circuit.
In general, the transitions in a circuit are induced by
transitions in scan cells and primary inputs [20]. We define
a Trojan cone as logic circuit connecting to the inputs of a
Trojan gate. Note that, in this section, we present one Trojan
gate for our analysis; however, a Trojan may contain more
than one gate. Also, note that we do not assume the location
of Trojan is known to us. The procedure developed in this
work is independent of location and size of hardware Trojan
in integrated circuits. Trojan cone can determine the required
time to generate transition in a Trojan gate. The number of
gates, gate types and the structure of Trojan cone can define
time to generate transition in the Trojan gate as well. Figure
1 shows two example Trojan cones. Trojans are named as
Trojan 1 and Trojan 2. Trojan 1 contains three gates in two
levels while Trojan 2 contains seven gates in three levels. Tg1
in Trojan1 is connected to the cone shown in Figure 1(a)
and Tg3 is connected to the cone in Figure 1(b). Other gates
in the two Trojans are assumed to be connected to other parts
of the circuit.
In Figure 1(a), Trojan cone consists of 17 gates in 11 levels.
Trojan cone contains all gates in original circuit impacting a
Trojan gate and the Trojan gate itself (here Tg1). Simulation
results show that after applying 1000 random test vectors in
test-per-clock fashion, there are 67 transitions at Tg1 output.
In Figure 1(b), Trojan cone consists of 7 gates in 2 levels.
The simulation results show that there are 421 transitions at
Tg3 output after applying the same number of test vectors, i.e.
2

Fig. 1. Two Trojan cone examples: (a) Trojans 1 and (b) Trojan 2
1000. Since random vectors are applied to the above circuits,
the results can be slightly different from one random vector set
to another. As seen from the results, the number of transitions
in the two Trojan gates varies significantly. This is mainly due
to the difference in Trojan cone structure, number of levels,
and number of inputs (scan flip-flops and primary inputs) and
Trojan gate type.
Probability can represent characteristics of a circuit since
it considers gates functionality and interconnections among
them. The probability of switching at a node in the circuit
provides a good estimation of the time to generate switching
on the node. Trojan cone determines switching probability at
the Trojan gate output, e.g. Tg1. Suppose the probabilities
of having ‘1’ and ‘0’ at Trojan output are P1 and P0,
respectively, the probability of switching from 0 to 1 or 1 to 0
at the output of a Trojan gate will be PtTgi = P1 × P0,
where Tgi is the ith gate at the first level of a Trojan.
For example, with assumption of applying random patterns
through inputs, with probability of 1/2, the probability of
generating a transition at the output of Trojan gate Tg3 (PtTg3)
is 0.25 as shown in Figure 2. The circuit shown in this figure
is the same as one depicted in Figure 1(b).
To obtain transition probability, a transition (i.e. success)
can be modeled using Geometric Distribution (GD) [12]. The
Geometric Distribution is a discrete distribution for n =0, 1, 2, · · · with the probability function p(n) = P × (1−P )n.
The probability function states that after n clock cycles, finally
in the (n + 1)th clock cycle, there will be a transition, i.e.
(n + 1)th trial is the first success. The average number of
experiments is (P−1 − 1) which indicates the number of
required clock cycles, on average, to generate a transition.
Fig. 2. Transition probability for a target cone.
Fig. 3. Comparing mathematical and simulation results.
For the Trojan gate shown in Figure 2, the calculation based
on Geometric Distribution shows that on average three clock
cycles are required to generate a transition at the Trojan gate
(Tg3) output. This is demonstrated by our simulation results
since, on average, in each 2.37 clock cycles a transition was
generated after applying 1000 test vectors. Note that the 1000
random test vectors are generated with the probability of 1/2
for ‘0’ and ‘1’.
Figure 3 presents two new Trojan cones and compares the
average clock cycles per transition using GD (i.e. probability
analysis) and simulation. Figure 3(a) shows that the simulation
result of applying 1000 random patterns is very close to that
of GD. Trojan cone in Figure 3 consists only of AND gates
such that the probability of generating ‘1’ at Trojan gate Tgj
output is much less than that of ‘0’ therefore, there is a
3

TABLE I
S298 AND S344 BENCHMARKS CHARACTERISTICS.
Benchmark # of in-puts
# of flip-flops
the total numberof inputs and flip-flops
the numberof gates
s298 3 14 17 68
s344 9 15 24 71
small transition probability for Tgj . Any transition to ‘1’ will
most likely follow immediately by a transition to ‘0’ since
Trojan cone mostly provides ‘0’ at the output of Tgj gate.
The simulation results by applying 1000 test vectors show that
each 250 clock cycles there is one transition at Trojan output
and probability analysis shows that every 255.6 clock cycles,
one transition can be generated at the output of Tgj gate.
Beside the interconnection among gates (i.e. circuit topol-
ogy), transition probabilities of nets depend on the number of
inputs and flip-flops of Trojan cone. Primary inputs and flip-
flops can determine a net’s depth which is the minimum dis-
tance of the net from either a primary input or a flip-flop. Such
dependency is examined on two ISCAS’89 benchmarks (s298
and s344). Table I shows the benchmarks’ characteristics. The
benchmarks have roughly the same number of gates; however,
their number of inputs and flip-flops are different. Primary
inputs and flip-flops provide immediate access to internal parts
of a circuit, and thus increase transition probabilities of nets.
Figure 4 compares the transition probabilities frequency of the
benchmarks.
Figure 4 shows that s344 benchmark, having more number
of inputs and flip-flops, has more number of nets with high
transition probability. Further, simulation results of applying
random vectors in 1000 clock cycles report 56560 transitions
in s344 while 44600 in s298. Therefore, enhancing accessi-
bility to internal parts of circuit by inserting dummy flip-flops
can be an effective way to increase transition probability of
nets.
It is seen from both analyses (GD and simulation) that
as P0 or P1 of a net becomes too large or too small,
the transition probability reduces significantly. Therefore, to
increase transition probability of a net, it would be preferred
to ensure that P0 and P1 values are close. The maximum
transition probability of a net can be Pt = 0.25 and it happens
when P0 = P1 = 1/2. Given a cone structure and various
gate types used in the cone, making the transition probability
Fig. 4. Transition probability frequency in s298 and s344 benchmarks.
Fig. 5. The number of required clock cycles versus transition probabilitybased on geometric distribution.
values (Pt) closer to each other would seem impractical but
by improving controllability by inserting dummy flip-flops,
we would be able to increase transition probability for both
0 → 1 and 1 → 0 transitions. This is validate by the analysis
performed using Geometric Distribution as shown in Figure
5. As seen, as the transition probability decreases, the number
of clock cycles to generate transition increases exponentially.
IV. DUMMY SCAN FLIP-FLOP INSERTION
When the probabilities for ‘1’ and ‘0’ of nets on a path
in a cone becomes unidirectional, i.e. P1 ≫ P0 or P0 ≫P1 similar to the example shown in Figure 3(b), transition
probability of the nets (Pti = Pi0 × Pi1) rapidly decreases.
To ensure transition probabilities are greater than a specific
threshold (PTH ), dummy flip-flops can be inserted so as to
close probabilities of ‘1’ and ‘0’ nets. Note that in this paper
both terms “dummy flip-flop” and “dummy scan flip-flop”
refer to the increased controllability (transition probability) in
a circuit.
Figure 6 shows the structure of dummy scan flip-flop (dSFF)
in addition to an extra gate (AND or OR). If probability of
‘0’ on target net Neti, Pi0, is less than its probability of ‘1’,
Pi1, an AND gate is placed after scan flip-flop and net Netirestitched through the AND gate to increase Pi0, as depicted
in Figure 6(a). However, if Pi1 is less than Pi0, an OR gate
is being used to increase Pi1, as in Figure 6(b). In this work,
dSFF-AND and dSFF-OR represent dummy scan flip-flops
with AND and OR gates, respectively. Accompanying a net
having low transition probability with a dSFF would increase
the net’s and following nets’ transition probabilities. When
Fig. 6. The dummy flip-flop structures when (a) Pi0 ≪ Pi1 and (b) Pi0 ≫Pi1.4

Test Enable (TE pin) is active, the output of scan flip-flop is
supplied by Scan Input (SI pin). The inserted dummy scan
flip-flop has no impact on the functionality of the circuit. In
normal functional mode, the output of scan flip-flop is supplied
by either ‘0’ or ‘1’ depending on the gate type at the output
of scan flip-flop to avoid changing the functionality of Neti.The probabilities of ‘1’ and ‘0’ at the output of scan flip-
flop are 1/2. Thus, by supplying internal nets with nets having
equal ‘1’ and ‘0’ probabilities, the ‘1’ and ‘0’ probabilities on
target nets can become closer and their respective transition
probabilities can be increased. Assume that Pi0 of Neti is
much greater than its Pi1, where
Pi0 =K
Nand Pi1 = 1 −
K
N
where K and N are cardinal values. The denominators of
probabilities would be the number of clock cycles in an
experiment and their numerators are the number of desired
value. Pi0 approaches to 1 (i.e. K ≈ N ) when it is assumed
Pi0 ≫ Pi1. By inserting proposed dummy flip-flop as in
Figure 6(b), new probabilities are
P ′
i0 =K
2N, and P ′
i1 = 1 −K
2N
As a result, P ′
i0 will be smaller than Pi0 and P ′
i1 will be
greater than Pi1. Thus, after dummy flip-flop insertion, the
transition probability of the target net and its following nets
would be greater as
P ′
i0 × P ′
i1 > Pi0 × Pi1
K
2N× (1 −
K
2N) >
K
N× (1 −
K
N)
2N − K > 4(N − K)
which is true because K ≈ N and N > K .
Using same analysis, it can be proven that by inserting
AND gate when Pi0 of a net is much lower than its Pi1,
the transition probability of the net can be increased. In this
case, mathematical analysis shows that inserting a dSFF-OR
on upper input net of Tgi gate in Figure 3, as depicted in Figure
7, reduces the number of clock cycles per transition from
255.6 to 30 on average at the output of Tgj gate. Furthermore,
simulation results also closely confirm 33.4 clock cycles per
transition.
A. Removing Rare Triggering Conditions
An able adversary would ensure that Trojans are activated
only under very rare conditions. It could be a rare circuit state,
certain temperature or noise, etc. This is necessary to avoid
Trojan detection accidentally using structural or functional
patterns. As an example, for functional Trojans [3], a Trojan
can have q ≫ 1 trigger inputs which can be nets with (i)
very low transition probabilities and (ii) rare combinations.
When the transition probability of Neti is very low, either
Pi0 is much greater than Pi1 or vice versa, as discussed in
Section III. With q number of trigger inputs, the probability
of generating a specific trigger vector is
Ptrigger−vector =
q∏
i=1
Pi (1)
where
Pi =
{
Pi0 for trigger input Neti to be 0
Pi1 for trigger input Neti to be 1.
It is expected that Ptrigger−vector to be very low if Pi0 or
Pi1 is low. By inserting dummy scan flip-flop, the transition
probability of nets would increase since Pi0 and Pi1 values
become closer. As a result, Ptrigger−vector also increases
and the trigger vector will not be a rare event anymore.
By increasing the transition probability of nets with low
transition rate, we will eliminate hard-to-activate sites in a
design. This would result in increasing the probability of
switching in Trojan circuit. If fully activated, Trojan’s output
can impact design functionality and it will be detected. In case
of increasing switching in the Trojan, called partial activation
in this paper, the Trojan can be detected much easier using
transient power or charge-based analysis methods [8][9][13].
This method eliminates the need to focus on rare conditions
as proposed in [18][19].
For example, Table II shows probability of two nets in
s38417 benchmark before and after dummy scan flip-flop
insertion. Assuming that Trojan needs trigger vector {01}on Net1 and Net2, as seen in the table, the probability
of the trigger vector would be Ptrigger−vector = PNet10 ×PNet21=4.079e-06 in the original circuit without dummy flip-
flop. However, the probability increases to 0.094 after dummy
flip-flop insertion.
B. Dummy Scan Flip-Flop Insertion Procedure
Figure 8 shows the proposed dSFF insertion procedure. Nets
with transition probabilities greater than determined transition
probability threshold (PTH) and close to nets with transition
probabilities lower than PTH are good candidates for dSFF
insertion since each of them can impact several low transition
nets at their fanout cone at once.
Fig. 7. Increasing transition probability by inserting dSFF-OR.5

TABLE II
PROBABILITY OF TWO NETS IN S38417 BENCHMARK BEFORE AND AFTER DSFF INSERTION.
Before dSFF insertion After dSFF insertionP0 P1 PNet10 × PNet21 P0 P1 PNet10 × PNet21
Net 1 0.999995317077 4.6e-06 4.079e-06 0.989 0.011 0.094Net 2 0.999959170737 4.08e-06 0.905 0.095
01: Set PTH (The desired threshold).02: CurrentDesign = SetDesign (the original circuit).03: NetsProbability = NetsTransitionProbability (CurrentDesign).04: HighTransitionNets = Nets (1, PTH , NetsProbability).05: Set Order “Increasing”.06: SortedHighTransitionNets = Sort (HighTransition, Order).07: LowTransitionNets = Nets (PTH , 0, NetsProbability).08: NumberofLowTransitionNetsBefore = Fequency (LowTransitionNets).09: TargetNet = Pop (SortedHighTransitionNets).10: Insert (dSFF, CurrentDesign, TargetNet).11: UpdatedDesign = SetDesign (CurrentDesign).12: NetsProbability = NetsTransitionProbability (UpdatedDesign).13: LowTransitionNets = Nets (PTH , 0, NetsProbability).14: NumberofLowTransitionNetsAfter = Fequency (LowTransitionNets).15: If (NumberofLowTransitionNetsAfter < NumberofLowTransitionNetsBefore ) Then {16: CurrentDesign = SetDesign (UpdatedDesign).17: }18: If (NumberofLowTransitionNetsAfter > 0) Then {19: NumberofLowTransitionNetsBefore = NumberofLowTransitionNetsAfter;20: Go To Line 09;21: } Else { Return CurrentDesign.}
The description of functions :Set Var1 Var2: Sets the value of variable/constant Var2 to Var1.SetDesign (Design): Returns the Design variable.NetsTransitionProbability (Design): Obtains Design variable and return the transition probability
of each net of Design.Nets (High, Low, Nets): Obtains an upper limit through High variable, a lower limit through Low variable, and
a list of nets through Nets. Returns any net with transition probability between High and Low variables.Sort (Nets, Order): Obtains a set of Nets and put them in order based on Order variable which can have two
values: Increasing, and DecreasingFrequency (Nets): Returns the number of NetsPop (Nets): Removes the net at the top of NetsInsert (dSFF, Design, Net): Inserts a dSFF in Design and restitches Net through dSFF.
Fig. 8. dSFF insertion procedure.
After setting PTH and original design as CurrentDesign(Lines 1-2), the procedure will calculate transition probability
of all nets in the design (Line 3). Nets are then divided into
two groups: (1) nets with transition probability higher than
PTH , and (2) nets with transition probability lower than PTH .
Nets in the first group obtained in Line 4 are then sorted and
permanently stored in SortedHighTransitionNets (Line 6).
In the following, in Lines 7 and 8, nets with
transition probability less than PTH are identified and
stored as LowTransitionNets and their number as
NumberofLowTransitionNetsBefore. The procedure,
in Line 9, removes the net with the lowest/highest
transition probability, depending upon Order, from
SortedHighTransitionNets. The removed net is restitched
through dSFF in Line 10. Transition probability of nets after
dSFF insertion is again calculated and the number of low
transition nets is obtained. If the value is less than the number
of low transition nets before dSFF insertion, the inserted dSFF
is kept otherwise the dSFF would be ignored since no gain
was obtained. In the following, if there is still any net with
transition probability less than PTH , the procedure continues
until there would not be neither any net with low transition
probability nor any nets in SortedHighTranstionNets.
We acknowledge that inserting dummy scan flip-flop in-
creases the delay of paths and can impact design performance.
Note that it is unlikely that adversary uses nets on critical paths
as input since it can impact the path delay due to the increased
capacitance and can be easily detected using path delay fault
test patterns. Using the above procedure, we avoid inserting
dummy flip-flops on critical paths by eliminating nets on the
critical paths from HighTransitionNets.
V. TRANSITION PROBABILITY THRESHOLD ANALYSIS
Inserting dummy flip-flops to increase transition probability
of nets would increase circuit area. The area overhead mainly
depends on transition probability threshold (PTH ). By setting a
PTH , our proposed procedure ensures that all nets in the circuit
have transition probability greater or equal to this threshold.
PTH would impact both area overhead (i.e. the number of
6

Fig. 9. Probability threshold versus authentication time and the number oftransitions.
dSFFs) and transition generation time in hardware Trojan
gates. In general, setting smaller PTH would result in smaller
number of dSFFs but would require more time, on average, to
generate switching in Trojan gates. On the other hand, setting
larger PTH would require more number of dSFFs but reduces
the transition generation time in hardware Trojan gates.
To set PTH , there are several parameters that should be
considered. They can be grouped into two main categories
namely authentication and circuit parameters. Authentication
parameters are of authentication characteristics and consist of
two sub-parameters: 1) authentication time of each integrated
circuit, TAu, and 2) the clock period of tester, TTester. Circuit
parameters represent circuit characteristics and consist of three
sub-parameters: 1) the number of required transitions in Trojan
circuit, NTr, 2) the average number of clock cycles per
transition which can be modeled using Geometric Distribution,
and 3) circuit activity, Cactivity . Note that NTr is an important
parameter when using transient power analysis methods for
detecting hardware Trojans since it indicates the contribution
of Trojans into the total circuit power consumption. The larger
the NTr, the easier the detection of a Trojan would be.
Equation (2) shows how authentication and circuit parame-
ters are related:
TAu ∝NTr × TTester × (P−1
TH − 1)
Cactivity
(2)
TAu is a user-defined parameter that depends on time-to-
market and criticality of the application in which the circuit
will be used. The equation is based on the time-to-generate
a specific number of transitions in a Trojan gate. From
Geometric Distribution analysis, on average, (P−1
TH − 1) clock
cycles are required for each transition on nets whose transition
probabilities are PTH . It is assumed that the inputs of Trojans
are nets with transition probabilities of PTH in the Equation to
consider the worst authentication case. TAu is also subjected
to Cactivity reversely.
Equation (2) shows that there is a direct relation between
TAu, NTr and TTester :
1) Requiring the more number of transitions at Trojan
implies the longer authentication time.
Fig. 10. Transition probability frequency in s641 and s5378 benchmarks.
TABLE III
S641 AND S5378 BENCHMARKS CHARACTERISTICS.
Benchmark # of inputs # of flip-flops
the number of compo-nents
s5378 35 176 823
s641 35 19 127
2) Clock period of tester (TTester) determines how fast
authentication patterns can be applied to IUA. Applying
patterns with higher frequency decreases TAu.
PTH determines transition probability threshold of design
and using Geometric distribution increasing PTH would de-
crease TAu. For a specific design with Cactivity of “unit” and
assuming TTester = 4×10⁻³ second, Figure 9 shows that for
a target authentication time, PTH increases by the number of
required transitions at Trojan output; therefore, area overhead
increases. Further, PTH decreases at any specific number of
transitions by increasing authentication time. The minimum
PTH is obtained when the number of transitions is minimum
and authentication time is maximum.
Circuit activity (Cactivity) is a function of transition occur-
rence frequency of circuit which is defined as
0.25∑
Pt=0
(fPt × Pt ×
0.25∑
Pt′=Pt
(fPt′ × Pt′)) (3)
where Pt and Pt′ is transition probability and fPt and fPt′
represents the number of nets with transition probability of Ptin the entire circuit. Equation (3) represents circuit character-
istics by importing the influence of nets with higher transition
probabilities on nets with lower transition probabilities. Circuit
activity parameter is studied for s5378 and s641 benchmarks
by inserting a NAND gate Trojan. Trojan inputs in the two
benchmarks have roughly the same transition probabilities
(Pt = 0.015). Table III shows the benchmarks’ characteristics
and Figure 10 presents their transition probability frequency.
Although both circuits have the same number of inputs, but
s5378 is larger with more number of components, consisting
of gates and flip-flops. Transition occurrence frequencies of
s5378 and s641 benchmarks are 578.84 and 124.92, respec-
tively. It is expected that s5378 with higher Cactivity generates
more number of transitions in the Trojan. Considering PTH =
7
10e − 05, simulation results show that there is one transition
in each 29.8 clock cycles at the output of Trojan in s5378
whereas 132.0 clock cycles in s641, on average.
TAu depends on NTr and circuit characteristics in terms of
Cactivity and PTH . NTr determines the number of required
transitions to distinguish between Trojan-inserted and Trojan-
free circuits. Circuits with higher Cactivity may increase
Trojan activation and reduce TAu. Furthermore, PTH provides
and estimation of maximum TAu by implying the rarest Trojan
input vector application.
VI. SIMULATION RESULTS
We apply our dummy flip-flop insertion procedure to s38417
benchmark which contains 1564 flip-flops and 4933 gates.
Four different transition probability thresholds are examined
in this work (PTH=10e-05, 10e-04, 10e-03, and 10e-2). The
amount of area overhead (number of dSFFs) to ensure all nets
have transition probabilities higher than PTH is evaluated.
Further, four combinational comparator Trojan circuits, pre-
sented in Figure 11, are inserted into the benchmark circuit.
Assuming that PTH=10e-05, transition probabilities of nets
are calculated and nets are divided into three groups: (1) Low
Transition (LT) nets whose transition probabilities are less than
10e-05, (2) Medium Transition (MT) nets whose transition
probabilities are between 10e-05 and 5x10e-05, and (3) High
Transition (HT) probability nets whose transition probabilities
are greater than 5x10e-05. Similar categorization is used for
the other PTHs used in this paper. To simulate the worst cases
of Trojan activation, nets of the first and second categories are
selected to be connected to the Trojans.
Each Trojan circuit consists of two parts: Trigger and
Payload. As in Figure 11, the Payload inputs come from
Trigger output and data input which is part of the original
circuit. The comparators look for rare combinations of Trojan
inputs based on their ‘1’ and ‘0’ probabilities. Payload gates
are selected based on Trojan outputs’ dominant values. Dash
lines above Trojans in the figure represent the connection in
the original circuit which is assumed to be restitched through
Trojan’s Payload by adversary.
The simulation results show the number of transitions in
the entire circuit and specifically transitions of LT and MT
nets. The total number of transitions at Trojan inputs and in
Trojan circuit, and the number of transitions on Trigger output
that can potentially cause functional failure are reported. Then,
it is studied how much dSFFs can magnify Trojan impact
based on Trojan to Circuit Activity (TCA) factor which is
the ratio of the number of transitions in Trojan circuit (NTr)
to the entire design. Additionally, the number of transitions
on Payload output is also obtained and we will investigate the
difference between payload output and its data input to further
analyze the number of erroneous logic values injected into the
circuit.
When the value of Trigger output is dormant (i.e. ‘1’ for
AND/NAND Payloads and ‘0’ for OR/NOR Payloads), the
Payload output is the same as Payload’s data input; otherwise,
the Payload output depends on values of both Trigger output
and data input. If both are the same, then the output will be
similar to the both inputs. However, a different Payload input
combination assuming the Trigger is active would mean that
the Payload output is due to Trigger input. This is called full
activation of Trojan since the Payload output change (POC)
can cause functional failure.
The POC rate depends on transition rate of Trigger output
and Payload data input. It is expected when both Payload
inputs have low transition probability the POC rate to be
unpredictable (small or large). For example, if Payload is an
AND gate and data input and Trigger output have high ‘1’
probability, low POC rate is expected. On the other hand, if
one of the Payload inputs has higher transition probability
than the other, larger POC rate is expected. If Trigger output
is active for many clock cycles, a large Payload output change
is expected.
The proposed method can help Trojan detection in two
ways:
1. Transient Power Analysis : By increasing the number
of transitions in Trojan circuits, the proposed method
can help improve the previously proposed power-based
methods [5][6][9][11]. In this case, the vectors are
applied in a test-per-clock (TPC) fashion since no obser-
vation is made by the flip-flops. In fact, the power pads
and C4s are the observation points since transient current
is being measured. Suppose Nsff is the number of scan
flip-flops and Nvec tpc is the number of vectors, the total
number of clock cycles Ntotalcycle = Nvec + Nsff − 1.
When Nvec ≫ Nsff , the total number of clock cycles
equals the number of test vectors Ntotal cycle tpc =Nvec.
2. Full Activation : By increasing the probability of full
activation of a Trojan (making the data input to be dif-
ferent from Payload output) the probability of observing
an incorrect response to the applied vectors would also
increase. In this case, the test vectors are applied in a
test-per-scan fashion since the response of a test vector
pair must be captured and scanned-out. The test vectors
are applied similar to launch-off-shift method used for
delay testing except that there is no requirement on at-
speed scan enable signal. The second vector is only 1-
bit shifted version of the first vector (i.e. initialization
vector). If Nsff is the number of scan flip-flops and
Nvec tps is the number of vectors, the total number of
clock cycles Ntotal cycle tps = (Nsff + 1) · Nvec tps.
A. Without Dummy Flip-Flop
Simulations are run for Nvec tpc = Nvec tps = 144 test
vectors. Table IV shows the design transitions statistics and
the contribution of Trojans into the original circuit, i.e. before
dSFF insertion. Column 2 shows the number of transitions in
the entire circuit including Trojans. In the next two columns,
transition count for LT and MT nets are reported. These
numbers can represent activity of nets which are more prob-
able to constitute Trojans’ inputs to make Trojan activations
rare. The fifth column presents the number of transitions at
8

Fig. 11. Trojan circuits.
TABLE IV
TROJANS ACTIVITY ANALYSIS BEFORE DSFF INSERTION.
Trojan Total number ofTransitions
# of Transi-tions on LTnets
# of Transi-tions on MTnets
# of Transitionsat Trojan inputs
# of Transitionsinside Trojan cir-cuit
# of Transitionsat Trojan output
NTr TCA POC
Trojan 1 310418 7 105 4 NAa 0 0 0.0E+00 0
Trojan 2 310429 7 105 16 11 0 11 3.54E-05 0
Trojan 3 310443 7 105 35 25 0 25 8.05E-05 0
Trojan 4 310470 7 105 89 51 0 51 1.64E-04 0
aNot Applicable
TABLE V
TROJANS ACTIVITY ANALYSIS AFTER DSFF INSERTION WITH PTH = 10e − 5.
Trojan Total number ofTransitions
# of Transi-tions on LTnets
# of Transi-tions on MTnets
# of Transitionsat Trojan inputs
# of Transitionsinside Trojan cir-cuit
# of Transitionsat Trojan output
NTr TCA POC
Trojan 1 318257 57 144 37 NA 1 1 3.13E-06 0
Trojan 2 318284 57 144 64 14 0 14 4.39E-05 0
Trojan 3 318299 57 144 97 28 0 28 8.79E-05 0
Trojan 4 318365 57 144 163 95 0 95 2.98E-04 0
Trojan inputs, implying attempts to activate Trojans subjected
to various input combinations. Columns 6 and 7 show the
number of transitions inside and at the output of Trojans,
respectively. The total number of transitions in Trojans (NTr),
the sum of transitions inside and at the output of Trojans,
is reported in Column 8. Trojan contribution into the entire
circuit is evaluated by TCA factor and presented in Column
9. The last column (POC) indicates the number of Trojan full
activations which results in functional error inside the host
design.
Table IV shows that before dSFF insertion none of the
Trojans is fully activated. The results indicate larger Trojans
9

TABLE VI
TROJANS ACTIVITY ANALYSIS AFTER DSFF INSERTION WITH PTH = 10e − 4.
Trojan Total number ofTransitions
# of Transi-tions on LTnets
# of Transi-tions on MTnets
# of Transitionsat Trojan inputs
# of Transitionsinside Trojan cir-cuit
# of Transitionsat Trojan output
NTr TCA POC
Trojan 1 327293 149 399 69 NA 18 18 5.49E-05 14
Trojan 2 327322 149 399 148 73 7 80 2.44E-04 9
Trojan 3 327357 149 399 190 116 0 116 3.54E-04 6
Trojan 4 327436 149 399 361 195 0 195 5.95E-04 0
TABLE VII
TROJANS ACTIVITY ANALYSIS AFTER DSFF INSERTION WITH PTH = 10e − 3.
Trojan Total number ofTransitions
# of Transi-tions on LTnets
# of Transi-tions on MTnets
# of Transitionsat Trojan inputs
# of Transitionsinside Trojan cir-cuit
# of Transitionsat Trojan output
NTr TCA POC
Trojan 1 235378 46 243 30 NA 11 11 4.67E-05 3
Trojan 2 235394 46 243 42 38 1 39 1.65E-04 0
Trojan 3 235418 46 243 96 62 0 62 2.63E-04 0
Trojan 4 235523 46 243 186 167 0 167 7.09E-04 0
contribute more into the entire design activity, i.e. larger
NTr, and thus have greater TCA, more attributed to internal
Transitions.
B. PTH = 10e-05
There are four nets in s38417 benchmark with transition
probability less than 10e-05. Using our procedure, 4 dSFFs
are needed to increase transition probabilities of these nets
beyond 10e-05. The 4 dSFFs make an area overhead about
0.2%. Table V shows circuit activity decreases slightly while
Trojans activity increase. Although none of the Trojans is fully
activated, there is increase in Trojans’ TCA in proportion to
their size. Furthermore, activity of LT and MT nets increases
and is manifested in increasing Trojans’ activity. In the fol-
lowing, PTH is increased to 10e-04 and corresponding results
are presented in Table VI.
C. PTH = 10e-04
The dSFF insertion procedure identifies 28 nets with tran-
sition probability less than 10e-04. In this case, 16 dSFFs
are inserted to ensure these nets have transition probability
greater than PTH , incurring 0.8% area overhead. The results in
Table VI show LT and MT nets are more active by increasing
PTH relative to the previous cases. In addition, Trojans of
smaller size are fully activated and cause functional errors in
the host design several times, and larger Trojans bring forth
more internal transitions. Consequently, there is high activity
in Trojan circuits and significant increase in Trojans’ TCA.
To verify that continuously increasing PTH increases Trojans
contribution, PTH is increased to 10e-03 and
D. PTH = 10e-03
Increasing transition probability of nets beyond 10e-03
requires 60 dSFFs and imposes 3.0% overhead. The results
in Table VII, contrary to what was expected, show decrease
in both circuit and Trojans activity. LT and MT nets are less
active relative to PTH = 10e-04, and as a result Trojans get
less activated. Even the total number of transitions in the entire
design decreases. As an exception the TCA factor of Trojan 4
is increased although it gets less active due to relatively more
decrease in the total number of transitions in the entire design.
More detail analysis in the following shows that increasing
transition probability of nets beyond a specific threshold does
not necessarily increase the number of transitions in the entire
design.
Any circuit consists of primary gates mainly NAND and
NOR gates, and any other complex gate and module can be
made using these primary gates. Transition at the output of a
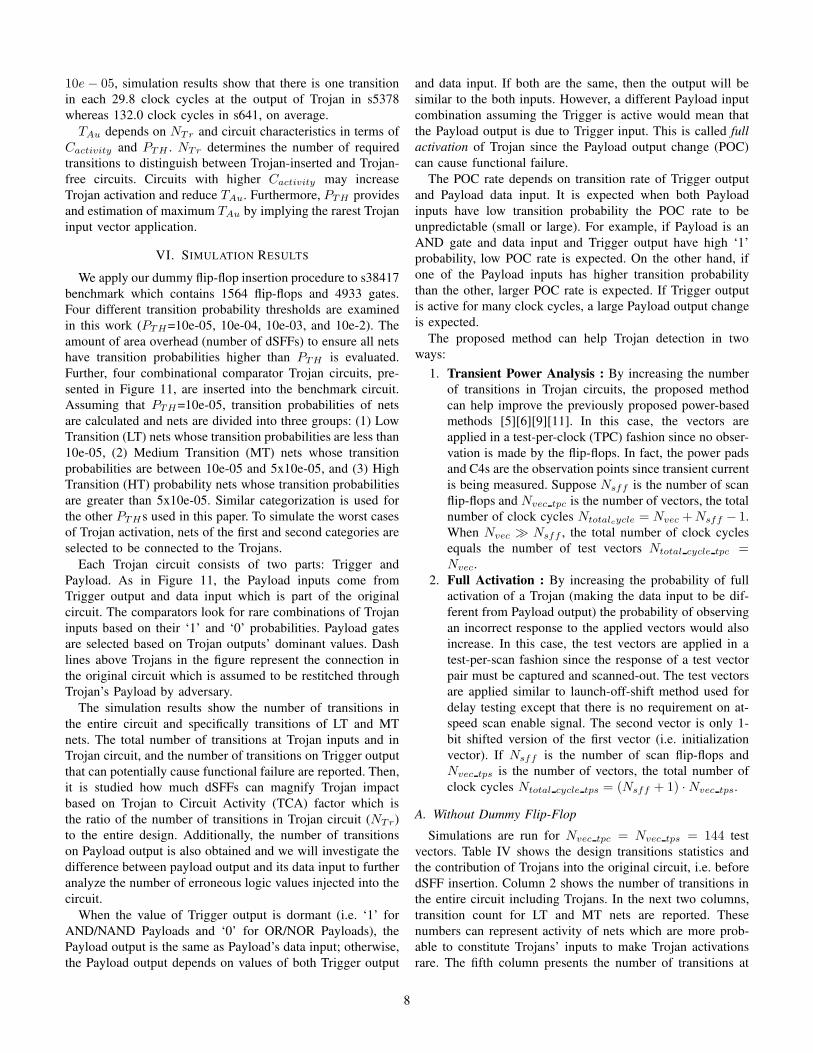
gate is a function of transition on its inputs. Figure 12 shows
transition probability at the output of 2-input NAND and 2-
input NOR gates based on transition probability of their inputs.
The maximum transition probability of a net is 0.25 and is
obtained when probabilities of 1 and 0 of the net are equal to
1/2. However, Figure 12 indicates that maximum transition
probability at the output of the gates are when transition
probability of one of its input is high and that of the other
input is low. This trend can be seen in both NAND and NOR
gates. Further, Figure 12 indicates when transition probabilities
of inputs are both 0.25 (the maximum value), the transition
probabilities at gates’ outputs are 0.1875 in the both gates.
In sum, increasing PTH to increase transition probability of
individual nets may not necessarily increase the number of
transitions in the entire design. To confirm this fact PTH is
increased to 10e-02 and results are presented in Table VIII.
E. PTH = 10e-02
Incurring 5.2% area overhead, 100 dSFFs are required to
have transition probability of all nets greater than 10e-02. As
it was expected the total number of transitions in the entire
design decreases more and the number of transition inside and
at the output of Trojan circuits is less than the results with
PTH = 10e-04. However, since the number of transitions in
the entire design is roughly half of corresponding values with
PTH = 10e-04 there is increase in Trojans’ TCA with PTH =
10e-02.
10
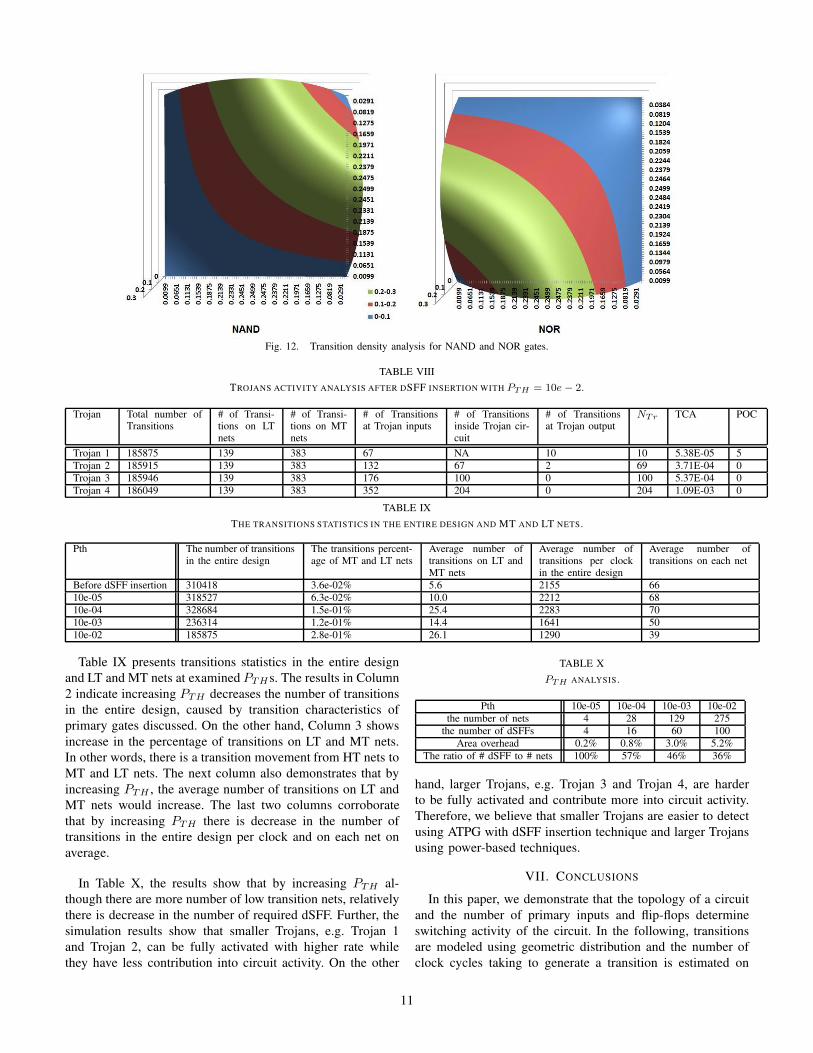
Fig. 12. Transition density analysis for NAND and NOR gates.
TABLE VIII
TROJANS ACTIVITY ANALYSIS AFTER DSFF INSERTION WITH PTH = 10e − 2.
Trojan Total number ofTransitions
# of Transi-tions on LTnets
# of Transi-tions on MTnets
# of Transitionsat Trojan inputs
# of Transitionsinside Trojan cir-cuit
# of Transitionsat Trojan output
NTr TCA POC
Trojan 1 185875 139 383 67 NA 10 10 5.38E-05 5
Trojan 2 185915 139 383 132 67 2 69 3.71E-04 0
Trojan 3 185946 139 383 176 100 0 100 5.37E-04 0
Trojan 4 186049 139 383 352 204 0 204 1.09E-03 0
TABLE IX
THE TRANSITIONS STATISTICS IN THE ENTIRE DESIGN AND MT AND LT NETS.
Pth The number of transitionsin the entire design
The transitions percent-age of MT and LT nets
Average number oftransitions on LT andMT nets
Average number oftransitions per clockin the entire design
Average number oftransitions on each net
Before dSFF insertion 310418 3.6e-02% 5.6 2155 66
10e-05 318527 6.3e-02% 10.0 2212 68
10e-04 328684 1.5e-01% 25.4 2283 70
10e-03 236314 1.2e-01% 14.4 1641 50
10e-02 185875 2.8e-01% 26.1 1290 39
Table IX presents transitions statistics in the entire design
and LT and MT nets at examined PTHs. The results in Column
2 indicate increasing PTH decreases the number of transitions
in the entire design, caused by transition characteristics of
primary gates discussed. On the other hand, Column 3 shows
increase in the percentage of transitions on LT and MT nets.
In other words, there is a transition movement from HT nets to
MT and LT nets. The next column also demonstrates that by
increasing PTH , the average number of transitions on LT and
MT nets would increase. The last two columns corroborate
that by increasing PTH there is decrease in the number of
transitions in the entire design per clock and on each net on
average.
In Table X, the results show that by increasing PTH al-
though there are more number of low transition nets, relatively
there is decrease in the number of required dSFF. Further, the
simulation results show that smaller Trojans, e.g. Trojan 1
and Trojan 2, can be fully activated with higher rate while
they have less contribution into circuit activity. On the other
TABLE X
PTH ANALYSIS.
Pth 10e-05 10e-04 10e-03 10e-02
the number of nets 4 28 129 275
the number of dSFFs 4 16 60 100
Area overhead 0.2% 0.8% 3.0% 5.2%
The ratio of # dSFF to # nets 100% 57% 46% 36%
hand, larger Trojans, e.g. Trojan 3 and Trojan 4, are harder
to be fully activated and contribute more into circuit activity.
Therefore, we believe that smaller Trojans are easier to detect
using ATPG with dSFF insertion technique and larger Trojans
using power-based techniques.
VII. CONCLUSIONS
In this paper, we demonstrate that the topology of a circuit
and the number of primary inputs and flip-flops determine
switching activity of the circuit. In the following, transitions
are modeled using geometric distribution and the number of
clock cycles taking to generate a transition is estimated on
11

average. Furthermore, it is shown that inserting dummy scan
flip-flop can reduce transition generating time. This realization
leads to develop a dummy flip-flop insertion procedure aiming
at augmenting transition probabilities of nets in a design, and
increasing activity of hardware Trojans in Integrated Circuits.
The simulation results for s38417 benchmark demonstrate that
it is possible to significantly increase switching activity in
Trojan circuits. Smaller Trojans may be fully activated and
cause functional failures. Larger Trojans more contribute into
side-channel signals and are detected as abnormality.
VIII. ACKNOWLEDGEMENTS
The work of Hassan Salmani and Mohammad Tehranipoor
was supported in part by the National Science Foundation
Grant CNS-0716535. The work of Jim Plusquellic was sup-
ported in part by NSF grant CNS-0716559.
REFERENCES
[1] U.S.D. Of Defense. “Defense science board task force on high perfor-mance microchip supply,” http://www.acq.osd.mil/dsb/reports/2005-02-HPMS Report Final.pdf
[2] S. Adee “The Hunt for the Kill Switch,”http://www.spectrum.ieee.org/print/6171
[3] X. Wang, M. Tehranipoor and J. Plusquellic, “Detecting maliciousinclusions in secure hardware: Challenges and solutions,” in Proc. ofthe IEEE International Workshop on Hardware-Oriented Security and
Trust(HOST 2008), pp. 15-19, 2008.
[4] M. Banga and M. S. Hsiao, “A Novel Sustained Vector Technique for theDetection of Hardware Trojans,” in Proc. of the International Conference
on VLSI Design, pp. 327-332, 2009.
[5] R. S. Chakraborty and S. Bhunia, “Security Against Hardware TrojanThrough a Novel Application of Design Obfuscation,” in Proc. of theInternational Conference on Computer-aided Design(ICCAD09), 2009.
[6] M. Banga and M. S. Hsiao, “A region based approach for the identifica-tion of hardware trojans,” in Proc. of the IEEE International Workshop
on Hardware-Oriented Security and Trust (HOST08), pp. 40-47, June2008.
[7] M. Banga, M. Chandrasekar, L. Fang, and M. S. Hsiao, “Guided testgeneration for isolation and detection of embedded trojans in ICs,” inProc. of the in Proceedings of the IEEE/ACM Great Lakes Symposiumon VLSI, pp. 363-366, April 2008.
[8] D. Agrawal, S. Baktir, D. Karakoyunlu, P. Rohatgi and B. Sunar,“Trojan Detection using IC Fingerprinting,” in Proc. of the Symposiumon Security and Privacy, pp. 296-310, 2007.
[9] R. Rad, X. Wang, J. Plusquellic and M. Tehranipoor, “Power Sup-ply Signal Calibration Techniques for Improving Detection Resolutionto Hardware Trojans,” in Proc. of the International Conference onComputer-Aided Design (ICCAD08), pp. 632-639, 2008.
[10] J. Li and J. Lach, “At-speed delay characterization for IC authenticationand Trojan Horse detection,” in Proc. of the IEEE International Work-
shop on Hardware-Oriented Security and Trust(HOST 2008), pp. 8-14,2008.
[11] Y. Jin and Y. Makris, “Hardware Trojan detection using path delayfingerprint,” in Proc. of the IEEE International Workshop on Hardware-
Oriented Security and Trust(HOST 2008), pp. 51-57, 2008.[12] D. D. Wackerly, W. Mendenhall III and R. L. Scheaffer, “Mathematical
Statistics with Application, 7th edition” Thomson Learning, Inc., 2008.
[13] X. Wang, H. Salmani, M. Tehranipoor and J. Plusquellic, “HardwareTrojan Detection and Isolation Using Current Integration and LocalizedCurrent Analysis,” in Proc. of the International Symposium on Fault and
Defect Tolerance in VLSI Systems (DFT08), pp. 87-95, 2008.
[14] M. Bushnell and V. Agrawal, “Essentials of Electronics Testing,” KluwerPublishers, 2000.
[15] S. Jha and S. K. Jha, “Randomization Based Probabilistic Approach toDetect Trojan Circuits,” in Proc. of the IEEE High Assurance Systems
Engineering Symposium(HASE08), pp. 117-124, 2008.
[16] M. Potkonjak, A. Nahapetian, M. Nelson, T. Massey, “Hardware TrojanHorse Detection Using Gate-Level Characterization,” in Proc. of theIEEE International Design Automation Conference (DAC), 2009
[17] Y. Alkabani, F. Koushanfar, “Consistency-Based Characterization forIC Trojan Detection,” in Proc. of the International Conference on
Computer-Aided Design (ICCAD09), 2009.[18] F. Wolff, C. Papachristou, S. Bhunia and R.S. Chakraborty, “Towards
Trojan-Free Trusted ICs: Problem Analysis and Detection Scheme,” inProc. of the Design, Automation and Test in Europe(DATE ’08), pp.1362-1365, 2008.
[19] R. S. Chakraborty, F. Wolff, S. Paul, C. Papachristou and S. Bhunia,“MERO: A Statistical Approach for Hardware Trojan Detection,” inProc. of the Workshop on Cryptographic Hardware and Embedded
Systems (CHES), 2009.[20] R. Sankaralingam, R. R. Oruganti and N. A. Touba, “Static Compaction
Techniques to Control Scan Vector Power Dissipation,” in Proc. of theIEEE VLSI Test Symposium (VTS’00), pp. 35-40, 2000.
12