not for release, publication or distribution in the united ... · highlights q1 2013 successful...
TRANSCRIPT
Evonik. Power to create. Q1 2013 Earnings Conference Call
Klaus Engel, Chief Executive Officer Wolfgang Colberg, Chief Financial Officer May 8th, 2013
Not for release, publication or distribution in the United States, Australia, Canada or Japan

Disclaimer
Page 2 May 8, 2013 | Evonik Q1 2013 Earnings Conference Call
These materials may not be published, distributed or transmitted in the United States, Canada, Australia or Japan. These materials do not constitute an offer of securities for sale or a solicitation of an offer to purchase securities (the “Shares”) of Evonik Industries AG (the “Company”) in the United States, Germany or any other jurisdiction. The Shares of the Company may not be offered or sold in the United States absent registration or an exemption from registration under the U.S. Securities Act of 1933, as amended (the “Securities Act”). The Shares of the Company have not been, and will not be, registered under the Securities Act.
This publication constitutes neither an offer to sell nor a solicitation to buy securities of Evonik Industries AG. The company has published the prospectus approved by the Bundesanstalt für Finanzdienstleistungsaufsicht (BaFin) afor the admission to trading on the regulated market segment (Prime Standard) of the Frankfurt Stock Exchange (Frankfurter Wertpapierbörse) and on the regulated market of the Luxembourg Stock Exchange (Bourse de Luxembourg) on its website at www.evonik.de. A public offer of securities of the Company has not been made.
In the United Kingdom, this document is only being distributed to and is only directed at persons who (i) are investment professionals falling within Article 19(5) of the Financial Services and Markets Act 2000 (Financial Promotion) Order 2005 (as amended) (the “Order”) or (ii) are persons falling within Article 49(2)(a) to (d) of the Order (high net worth companies, unincorporated associations, etc.) (all such persons together being referred to as “Relevant Persons”). This document is directed only at Relevant Persons and must not be acted on or relied on by persons who are not Relevant Persons. Any investment or investment activity to which this document relates is available only to Relevant Persons and will be engaged in only with Relevant Persons.
NOT FOR DISTRIBUTION OR RELEASE, DIRECTLY OR INDIRECTLY, IN OR INTO THE UNITED STATES, CANADA, AUSTRALIA OR JAPAN OR ANY OTHER JURISDICTION IN WHICH THE DISTRIBUTION OR RELEASE WOULD BE UNLAWFUL. OTHER RESTRICTIONS ARE APPLICABLE.

Highlights Q1 2013 Successful public listing of Evonik shares
Page 3
Financials & Outlook
Real Estate divestment
• Ongoing challenging economic environment • Slight organic sales decline of -2% (€3,263 m) • Adj. EBITDA -10% against strong comparables (€589 m) • Outlook for FY 2013 confirmed
• Clear route to divest majority of real estate activities in 2013 • Step plan leading to an Evonik stake in Vivawest of ~8% • Full divestment of remaining stake in the mid term
Stock exchange listing
• Further 2.3% of shares successfully placed in advance of the listing, resulting in 14.5% free float1
• Trading commenced on April 25th, 2013 in the Prime Standard of Frankfurt stock exchange and in Luxembourg
Prior year figures restated for IAS 19 and Real Estate (disc. op.)
1 Including full exercise of greenshoe
May 8, 2013 | Evonik Q1 2013 Earnings Conference Call

Page 4
Table of contents
1 Evonik - A leading global specialty chemicals company
2 Evonik 2016 – Growth. Efficiency. Values.
3 Financial performance Q1 2013
May 8, 2013 | Evonik Q1 2013 Earnings Conference Call

Page 5
Evonik: Investment highlights A leading global specialty chemicals company
Well-balanced portfolio in respect to products, end markets and regions with leading market positions 2
High barriers to entry: close and long-term customer relationships, market-oriented innovation and integrated technology platforms 3
Favourable megatrends support growth across all segments 1
Proven track record of active portfolio management and value creation 4
May 8, 2013 | Evonik Q1 2013 Earnings Conference Call

Page 6
Specialty Chemicals
Non-core assets
Consumer, Health and Nutrition
Resource Efficiency
Specialty Materials
Real Estate
Energy
100% stake in Vivawest GmbH 50% stake in THS GmbH
49% stake in Steag GmbH
Deconsolidation expected in 2013
Three specialty chemicals segments Focused on global megatrends
Put-call arrangement in place for full divestment latest 2017
Growing emerging market wealth
Aging population Sales: €4,204 m Adj. EBITDA margin: 25.1%
Sales: €3,131 m Adj. EBITDA margin: 21.2%
Sales: €4,843 m Adj. EBITDA margin: 17.6%
Renewable energies Environmentally
friendly solutions
Mobility and urbanization
Substitution of conventional materials
Driven by m
egatrends Efficient support functions Services (e.g. Site Services, Evonik Business Services) Corporate Center
Figures relate to full year 2012; restated for IAS 19 May 8, 2013 | Evonik Q1 2013 Earnings Conference Call
Figures relate to full year 2012

Page 7
A well-balanced specialty chemicals portfolio across activities, end markets and regions
1 2012; not including Services, Real Estate and Corporate/Other 2 Based on specialty chemicals segments’ 2012 sales to end markets as per Evonik’s internal management system 3 Consolidated Group sales 2012 (incl. Real Estate)
End market split2
Home, lifestyle & personal care
Automotive, transportation & machinery
Feed, food & beverages
Plastics & rubber
Coatings, paints & printing
Construction
Metals, mining, oil & gas
3%
Pharma & healthcare
Other
Electronics & telecom.
Sales by Business Units1
17%
12%
Sales by region3
Germany
Other European Countries
Central and South America
North America
Asia- Pacific
Middle East, Africa
2%
31%
25%
18%
6% 18%
14%
5%
16% 10%
11%
7%
12%
4% 18%
25%
Consumer Specialties
Advanced Intermediates
Coatings & Additives
Inorganic Materials
18% Health
& Nutrition
14%
14%
Performance Polymers
May 8, 2013 | Evonik Q1 2013 Earnings Conference Call

Close customer relationships Example: Oil Additives
Page 8
• Close customer collaboration for innovative products and joint developments
• Long-standing relationships and active co-operations in many projects with globally operating lubricant blenders, e.g. TOTAL, and OEM’s like the Chinese construction equipment manufacturer SANY
• High value-added solutions for customers
• Dedicated key account and service teams for superior technical services
Oil Additives
Delivering products tailored to customers’ needs
• Viscosity modifiers (formulation components, base fluids, tailored products) improve friction, wear and flow performance of hydraulic fluids and other oil-based products
• Focused on the global growth megatrend resource efficiency by delivering solutions to customers that help to save energy, e.g. DYNAVIS® reduces fuel consumption by up to 30%
May 8, 2013 | Evonik Q1 2013 Earnings Conference Call

High barriers to entry Example: Methionine
Page 9
Cost efficiency Global production set up
Process technology Value added services
All Evonik plants are world scale
High process yields and optimized, integrated operations
Continuous process improvements
Backward integration into key intermediates and raw materials
Long-standing experience and excellent know-how to handle complex production set-up
Superior product in terms of biological value and ease of handling
Global sales force with direct customer access and excellent market intelligence
Extensive feed analysis and formulation support
Production sites in Mobile (US), Antwerp and Wesseling (EU)
Singapore plant under construction to complete global footprint
Global supply chain with quick response times
Mobile
Singapore (2014)
Wesseling Antwerp
May 8, 2013 | Evonik Q1 2013 Earnings Conference Call

Page 10
Table of contents
1 Evonik - A leading global specialty chemicals company
2 Evonik 2016 – Growth. Efficiency. Values.
3 Financial performance Q1 2013
May 8, 2013 | Evonik Q1 2013 Earnings Conference Call
Page 11
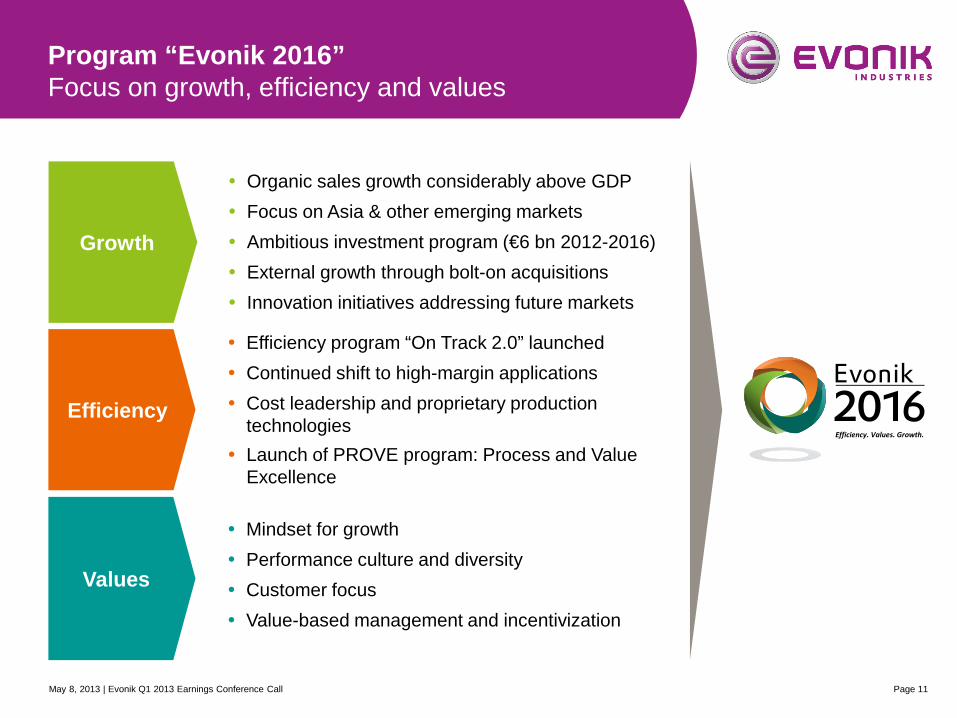
Program “Evonik 2016” Focus on growth, efficiency and values
Mindset for growth Performance culture and diversity Customer focus Value-based management and incentivization
Values
Efficiency
Efficiency program “On Track 2.0” launched Continued shift to high-margin applications Cost leadership and proprietary production
technologies Launch of PROVE program: Process and Value
Excellence
Efficiency. Values. Growth.
Growth
Organic sales growth considerably above GDP Focus on Asia & other emerging markets Ambitious investment program (€6 bn 2012-2016) External growth through bolt-on acquisitions Innovation initiatives addressing future markets
May 8, 2013 | Evonik Q1 2013 Earnings Conference Call

Page 12
Evonik 2016: “Growth” Ambitious investment program
Intended ~€6 bn investment program (2012-2016) Major projects
Maintenance & small
investments
Growth projects
Capex
~€6bn
~€4bn
~€2bn
Segment Product area Location Capex Expected start-up
Consumer, Health & Nutrition
Amino acids: DL-methionine Singapore >€500 m H2 2014
Consumer, Health & Nutrition
Personal & home care ingredients
China and Brazil
2013 / 2014
Consumer, Health & Nutrition
Amino acids: L-lysine
Brazil and Russia >€100 m 2014 /
2015
Resource Efficiency Silica Globally until end of
2014
Resource Efficiency
Isophorone and isophorone diamine China >€100 m Q1 2014
Specialty Materials C4 chain Germany and Belgium >€250 m 2015
Specialty Materials H2O2 for HPPO China >€130 m end 2013 or 2014
1 Growth investments defined as investments above €2.5 m into growth projects
2 Small investments defined as investments below €2. 5m focused on growth or efficiency improvements (also includes maintenance and regulatory compliance investments)
1
2
May 8, 2013 | Evonik Q1 2013 Earnings Conference Call

Page 13
Evonik 2016: „Efficiency“ On Track 2.0 initiated
Expected savings (in € million)
• Successful launch of On Track 2.0 as a program for continuous efficiency improvement
• Target: sustained annual savings of about €500 million from year-end 2016
• Cost savings of approximately €140 million achieved in 2012
• Specific measures already defined for about 50 percent of target savings volume
2013E 2012A
~140
Total 2016E 2014E 2015E
~500
OPEX Procurement Site Services Business Services Other
May 8, 2013 | Evonik Q1 2013 Earnings Conference Call

Page 14
Table of contents
1 Evonik - A leading global specialty chemicals company
2 Evonik 2016 – Growth. Efficiency. Values.
3 Financial performance Q1 2013
May 8, 2013 | Evonik Q1 2013 Earnings Conference Call

Financials highlights Q1 2013 Moderate start into the year, outlook confirmed
Page 15
In a still challenging economic environment, sales of €3,263 m organically only slightly below strong prior-year quarter (-2%)
Volumes stable at Group level; prices also stable across majority of businesses, while declining for some important products
Adjusted EBITDA of €589 m (-10.2%) and Adjusted EPS of €0.63 (-7.3%) below strong prior year level with partly very high price levels
Adjusted EBITDA margin of 18.1% still on attractive level
Net financial debt of €1.1 bn remains moderate
Outlook for FY 2013 confirmed
Prior year figures restated for IAS 19 and Real Estate (disc. op.) May 8, 2013 | Evonik Q1 2013 Earnings Conference Call

Income statement (1/2) Sales organically only slightly below prior year
Page 16
• Real Estate as discontinued operations as of Q1 2013 (prior year restated)
• Sales -4.2%, thereof: • Volumes: 0%; Prices: -2% • FX: 0%; Other (incl. M&A): -2%
• Adjustments: • 2013: mainly put-call arrangement
STEAG and IAS 19 adjustments • 2012: mainly impairments in
Resource Efficiency segment (PV industry)
• Accounting effects related to FX
hedging with negative earnings impact (in Corporate/Other segment)
Continuing operations
Prior year figures restated for IAS 19 and Real Estate (disc. op.)
May 8, 2013 | Evonik Q1 2013 Earnings Conference Call
in € million Q1 2012 Q1 2013 ∆ in %
Sales 3,407 3,263 -4.2
Income before financial result and income taxes 428 396
Results from investments recognized at equity 12 13
Other financial income 0 6
EBIT 440 415 -5.9
Adjustments 69 30
Adj. EBIT 509 445 -12.6
Adj. depreciation and amortization 147 144
Adj. EBITDA 656 589 -10.2
Adjusted EBITDA margin 19.3% 18.1% -1.2pp

Income statement (2/2) Lower net interest expense and income taxes
Page 17
• Net interest expense: • Decrease driven by lower
interest rates for pensions and higher income as a result of the transfers made to the CTA
• Adjusted tax rate: • Low adj. tax rate of 23.2% due
to taxes relating to other periods
May 8, 2013 | Evonik Q1 2013 Earnings Conference Call
in € million Q1 2012 Q1 2013 ∆ in %
Adj. EBIT 509 445 -12.6
Net interest expense -80 -66
Adj. income before income taxes 429 379
Adj. income tax -115 -88
Adj. income after taxes 314 291
Non-controlling interests (adj.) 3 3
Adj. net income 317 294 -7.3
Adj. earnings per share 0.68 0.63 -7.3
Continuing operations
Prior year figures restated for IAS 19 and Real Estate (disc. op.)

Page 18
Consumer, Health & Nutrition Demand for superabsorbents on high level
Sales (in € m)
Adj. EBITDA (in € m) / Adj. EBITDA margin (in %)
• Strong sales performance of Consumer Specialties, driven by higher volumes and stable prices
• Baby Care with strong performance, benefitting from additional volume demand in the market; raw material price increases not yet fully passed on during Q1 2013
• Good demand and growth perspective for oil field chemicals
• In Health & Nutrition selling prices of feed amino acids Lysine and Methionine lower in comparison to the exceptional levels of Q1 2012
• Methionine volumes also impacted by current food quality crisis in China; market development in other regions remained robust
-2%
CS
HN
Q1 13
1,035
553
482
Q4 12
1,039
491
548
Q3 12
1,079
522
557
Q2 12
1,031
529
502
Q1 12
1,055
514
541
274229
280259287
-5%
Q1 13 Q4 12 Q3 12 Q2 12 Q1 12
Volume +2% Price -4% FX +1% Other +/-0%
27.2% 25.1% 25.9% 22.0% 26.5%
Prior year figures restated for IAS 19 May 8, 2013 | Evonik Q1 2013 Earnings Conference Call
Page 19
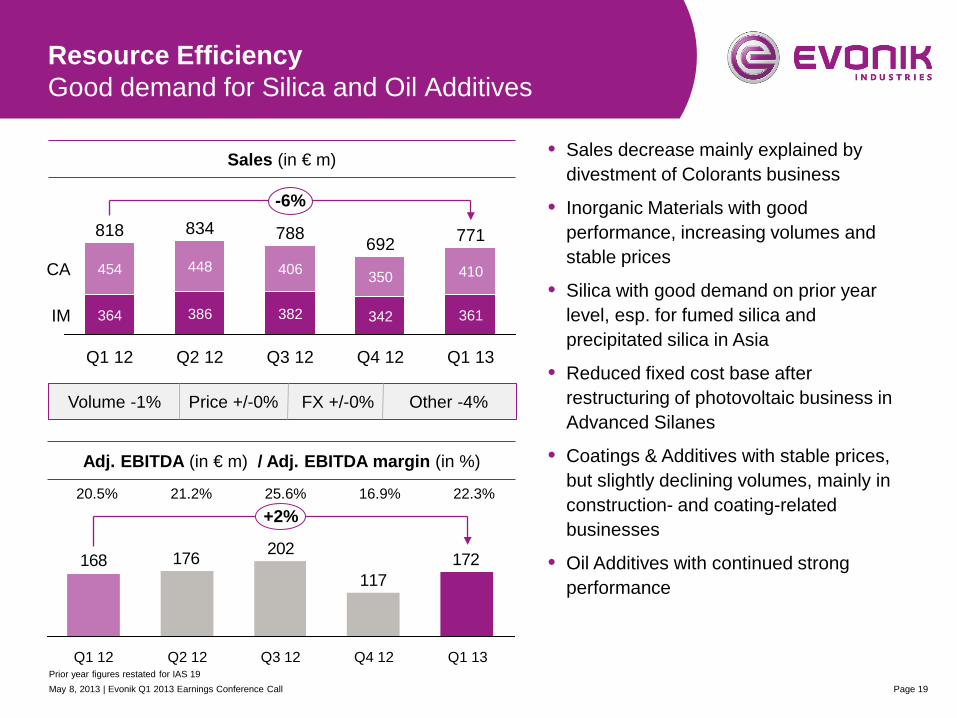
Resource Efficiency Good demand for Silica and Oil Additives
Sales (in € m)
Adj. EBITDA (in € m) / Adj. EBITDA margin (in %)
• Sales decrease mainly explained by divestment of Colorants business
• Inorganic Materials with good performance, increasing volumes and stable prices
• Silica with good demand on prior year level, esp. for fumed silica and precipitated silica in Asia
• Reduced fixed cost base after restructuring of photovoltaic business in Advanced Silanes
• Coatings & Additives with stable prices, but slightly declining volumes, mainly in construction- and coating-related businesses
• Oil Additives with continued strong performance
-6%
IM
CA
Q1 13
771
361
410
Q4 12
692
342
350
Q3 12
788
382
406
Q2 12
834
386
448
Q1 12
818
364
454
172117
202176168
+2%
Q1 13 Q4 12 Q3 12 Q2 12 Q1 12
20.5% 21.2% 25.6% 16.9% 22.3%
May 8, 2013 | Evonik Q1 2013 Earnings Conference Call
Volume -1% Price +/-0% FX +/-0% Other -4%
Prior year figures restated for IAS 19

Page 20
Specialty Materials Stable volumes, partly weaker prices
Sales (in € m)
Adj. EBITDA (in € m) / Adj. EBITDA margin (in %)
• Specialty Materials’ sales impacted by a smaller divestment (cyanuric chloride business in China) and the ramp up of the CDT plant in Marl as well as lower pricing for some products
• CDT plant back in operation, product pipeline currently being filled
• MMA and PMMA facing softer demand, esp. in Asia and Southern Europe, and high raw material prices
• Volume growth in C4 products, good demand mainly for MTBE
• Lower prices for butadiene, remaining below the very high levels of Q1 2012
-5%
PP
AI
Q1 13
1,170
443
727
Q4 12
1,123
401
722
Q3 12
1,217
427
790
Q2 12
1,269
472
797
Q1 12
1,234
474
760
182174222241215
Q1 12
-15%
Q1 13 Q4 12 Q3 12 Q2 12
17.4% 19.0% 18.2% 15.5% 15.6%
May 8, 2013 | Evonik Q1 2013 Earnings Conference Call
Volume +/-0% Price -3% FX +/-0% Other -2%
Prior year figures restated for IAS 19

Services and Corporate / Other
Page 21
236256
Q1 2013 Q1 2012
Services Corporate / Other / Consolidation
5453
Q1 2013 Q1 2012
• External sales declined by -8%, mainly due to permanent plant shut down of an external customer of Site Services at the chemical site in Marl (Germany)
5144
Q1 2013 Q1 2012
-93-67
Q1 2013 Q1 2012
• Adj. EBITDA (yoy) negatively impacted by accounting effects from FX hedging
May 8, 2013 | Evonik Q1 2013 Earnings Conference Call
(External) Sales (€ m) Adjusted EBITDA (€ m) Sales (€ m) Adjusted EBITDA (€ m)
Prior year figures restated for IAS 19

~€6 bn capex program underway Capex increased by 14% in Q1 2013
• Investments in Asia-Pacific up by approximately +130% due to major progress with the projects in methionine (Singapore), isophorone (Shanghai) and H2O2 for HPPO (Jilin, China)
• Capex expected to increase progressively during 2013 to €1.5 bn for full year
Page 22
Capex by regions Q1 2013 (in %) Capex (in € million)
6%
35%
13%
Middle East and Africa
1%
Central and South America
Asia- Pacific
North America
Other European countries
10%
Germany 35%
183161
Q1 2013
+14%
Q1 2012
May 8, 2013 | Evonik Q1 2013 Earnings Conference Call

Page 23
Cash flow statement Only temporary NWC build-up
Continuing operations
Prior year figures restated for IAS 19 and Real Estate (disc. op.)
• D&A in Q1 2012 impacted by impairments in Resource Efficiency (PV industry)
• Cash outflow for NWC partly related to preparatory inventory buildup for upcoming plant revisions in Q2 2013
• Positive cash flow from investing activities
• due to sale of securities
• despite of increasing cash outflows for investment
in € million Q1 2012 Q1 2013 Income before financial result and income taxes 428 396
Depreciation and amortization 217 144
∆ Net working capital -226 -312
Outflows from income taxes -79 -81
Other 24 45
Cash flow from operating activities 364 192
Cash flow from investing activities, thereof: -233 147
Cash outflows for investment in intangible assets, pp&e and shareholdings -167 -221
Cash inflows/outflows relating to securities, deposits and loans -67 362
Cash flow from financing activities, thereof: 15 -503
Dividend payments - -429
May 8, 2013 | Evonik Q1 2013 Earnings Conference Call

Page 24
Net financial debt Effect from dividend payment offset by discontinued Real Estate net financial debt
Net financial debt
March 31, 20133
-1,137
Other
-7
NFD discontinued operations
+491
Dividend
-429
Cash outflow for investing
activities1
-221
CF from operating activities
+192
Net financial debt
Dec. 31, 2012
-1.163
+26
Development of net financial debt (in € million)
1 Cash outflow for investment in intangible assets, property, plant and equipment and shareholdings 2 Total leverage defined as (Net Financial Debt + Funded Status) / Adjusted EBITDA LTM
3 Excluding Real Estate (as discontinued operations as of March 11, 2013)
Total leverage2 2.1x
Total leverage2 2.3x
May 8, 2013 | Evonik Q1 2013 Earnings Conference Call

Page 25
2019
1,200
1,000
800
600
400
200
0 2020 2016 2018 2017 2015 2014 2013
Bonds
Other debt instruments
• New €500 m bond with a tenor of 7 years and a coupon of 1.875% issued on April 8th, 2013
• 7 year tenor leads to improvement of the average life of financial debt
• Proceeds to partly refinance €1,093 m Evonik Degussa GmbH bond due in December
• Undrawn credit facilities of €1.7 bn
• Moody’s rating upgrade in March 2013 to Baa2 with a positive outlook
Substantial improvement in maturity profile New €500 m bond with 7 year tenor
Debt maturity profile as of March 31, 2012 (in € million)1
1 Continuing operations; including a €500 m 7-year bond issued on April 8th, 2013
May 8, 2013 | Evonik Q1 2013 Earnings Conference Call

Real Estate divestment (1/2) Evonik to remain with only ~8% stake in combined entity of Vivawest and THS
Page 26
Current Structure Target Structure Sep. 30, 2013
Evonik CTA (pension funding)
30% ~27% ~25% ~10% 100% 50%
50%
~8%
VTG VTG
Combined entity of Vivawest & THS
Note: Transaction dependent on completion of due diligence, approval of purchasers’ statutory bodies and merger control
May 8, 2013 | Evonik Q1 2013 Earnings Conference Call
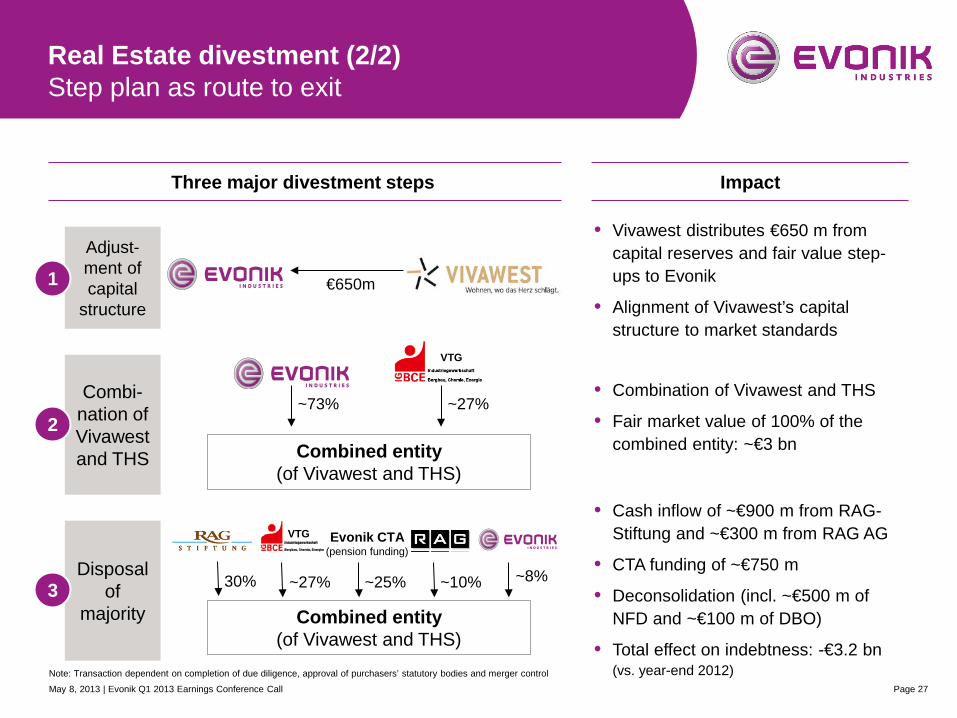
Page 27
Three major divestment steps Impact
• Vivawest distributes €650 m from capital reserves and fair value step-ups to Evonik
• Alignment of Vivawest’s capital structure to market standards
€650m
Adjust-ment of capital
structure
1
Combi-nation of Vivawest and THS
2 Combined entity
(of Vivawest and THS)
~73% ~27%
VTG
Disposal of
majority 3
Combined entity (of Vivawest and THS)
30% ~27%
VTG
~25% ~10% ~8%
• Combination of Vivawest and THS
• Fair market value of 100% of the combined entity: ~€3 bn
• Cash inflow of ~€900 m from RAG- Stiftung and ~€300 m from RAG AG
• CTA funding of ~€750 m
• Deconsolidation (incl. ~€500 m of NFD and ~€100 m of DBO)
• Total effect on indebtness: -€3.2 bn (vs. year-end 2012)
Evonik CTA (pension funding)
Note: Transaction dependent on completion of due diligence, approval of purchasers’ statutory bodies and merger control
Real Estate divestment (2/2) Step plan as route to exit
May 8, 2013 | Evonik Q1 2013 Earnings Conference Call

Page 28
Outlook for 2013 Outlook confirmed, but uncertainties about global economy persist
Outlook for Evonik in 2013 (continuing operations1)
Economic environment
• Global economic conditions to remain very challenging
• Economy expected to pick up perceptibly in the second half of the year
• Still considerable uncertainty, especially in connection with the sovereign debt crisis in Europe and the economic development of China
Outlook
• Economic upturn anticipated in the second half of the year
• Higher sales in 2013 anticipated, while operating results should be in line with the very good level achieved in 2012
• New production capacities and higher selling prices in key product areas to have a positive impact
1 Outlook based on continuing operations, i.e. excl. real estate activities in 2012 and 2013
May 8, 2013 | Evonik Q1 2013 Earnings Conference Call


Page 30
Consumer, Health & Nutrition Segment overview
Key financials (€m)
Sales split by Evonik’s end markets (2012)1 Sales split by region (2012)
Consumer Specialties
49%
Health & Nutrition
51%
Adj. EBITDA and margin (%)
1 Company estimates on the basis of information on Evonik’s customers and the further use of Evonik’s products by its customers Adjusted EBITDA 2012 restated for IAS 19 effects
2012
4,204
2011
4,081
2010
3,677
2009
3,004
2008
3,022 985807
602
2012
1,055
2011
1,049
2010 2009 2008
19.9
Sales
26.9 26.8 25.7 25.1
40%10%
Others
12% Pharma & Healthcare
Feed, food & beverages
38%
Home, Lifestyle & Personal Care
13%
26%
10%
Middle East, Africa
4% Central
& South America
Asia-Pacific 18%
North America
Other European Countries 29%
Germany
May 8, 2013 | Evonik Q1 2013 Earnings Conference Call

Consumer, Health & Nutrition Selected Business Lines
Page 31
Business Lines Major products and solutions Key industry segments
Comfort & Insulation
• Additives for manufacture of polyurethane foams for e.g. • insulation products • furniture • packaging
• Home • Construction • Automotive • Energy
Baby Care • Superabsorbent polymers as key
components in diapers and other hygiene products
• Personal care
Methionine & Bioproducts
• Essential amino acids for animal feed • DL-methionine (MetAMINO®) • L-lysine (Biolys®)
• Animal nutrition
Health Care
• Active pharmaceutical ingredients and functional pharmaceutical excipients for • drug delivery systems • functional drug coatings
• Pharmaceuticals • Medical devices
May 8, 2013 | Evonik Q1 2013 Earnings Conference Call

Page 32
Resource Efficiency Segment overview
Key financials (€m)
Sales split by Evonik’s end markets (2012)1
Consumer Specialties
49%
Health & Nutrition
51%
Adj. EBITDA and margin (%)
1 Company estimates on the basis of information on Evonik’s customers and the further use of Evonik’s products by its customers Adjusted EBITDA 2012 restated for IAS 19 effects
2012
3,131
2011
4,045
2010
4,195
2009
3,181
2008
3,828
663765746
463558
2012 2011 2010 2009 2008
Sales
14.6 17.8 18.9 21.2 14.6
Sales split by region (2012)
34%
10%
6%
4%
10%
Home, Lifestyle & Personal Care
Electronics & Telecommunication
6%
Plastics & Rubber 9%
Construction Coatings, Paints and Printing
17%
Automotive, Transportation & Machinery Pharma & Healthcare
Others Environment & Utilities
4% 20%
17%
Germany Middle East, Africa
2%
Central & South America
3%
Asia-Pacific 27%
North America
Other European Countries
31%
May 8, 2013 | Evonik Q1 2013 Earnings Conference Call
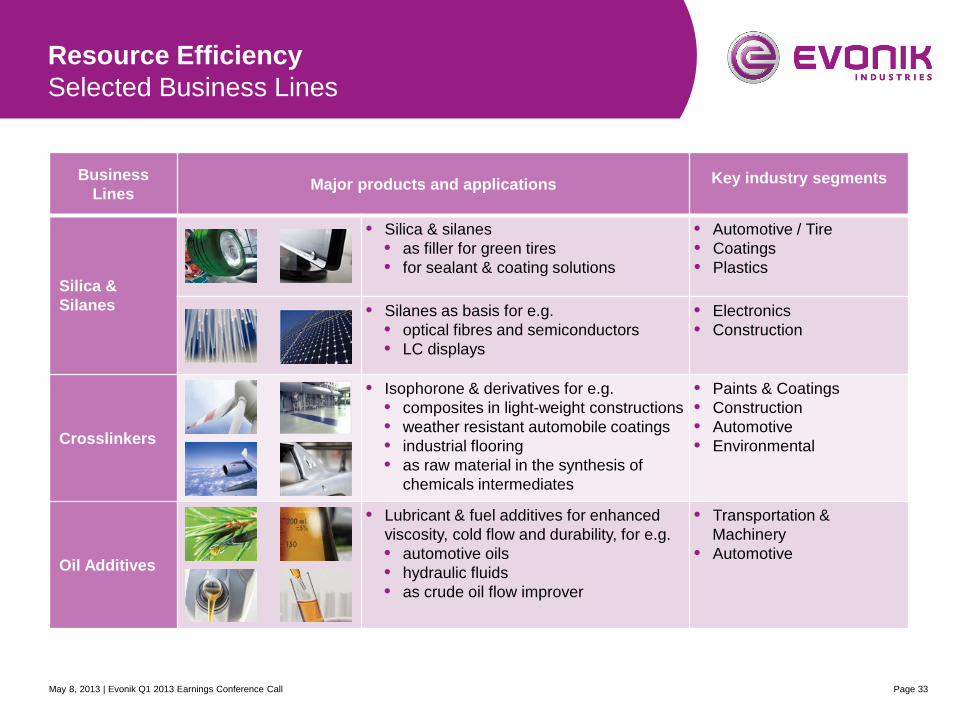
Resource Efficiency Selected Business Lines
Page 33
Business Lines Major products and applications Key industry segments
Silica & Silanes
• Silica & silanes • as filler for green tires • for sealant & coating solutions
• Automotive / Tire • Coatings • Plastics
• Silanes as basis for e.g. • optical fibres and semiconductors • LC displays
• Electronics • Construction
Crosslinkers
• Isophorone & derivatives for e.g. • composites in light-weight constructions • weather resistant automobile coatings • industrial flooring • as raw material in the synthesis of
chemicals intermediates
• Paints & Coatings • Construction • Automotive • Environmental
Oil Additives
• Lubricant & fuel additives for enhanced viscosity, cold flow and durability, for e.g. • automotive oils • hydraulic fluids • as crude oil flow improver
• Transportation & Machinery
• Automotive
May 8, 2013 | Evonik Q1 2013 Earnings Conference Call

Page 34
Specialty Materials Segment overview
Key financials (€m)
Sales split by Evonik’s end markets (2012)1
Consumer Specialties
49%
Health & Nutrition
51%
Adj. EBITDA and margin (%)
2012
4,843
2011
4,880
2010
4,117
2009
3,125
2008
4,229 853907
626
311472
2012 2011 2010 2009 2008
Sales
10.0 15.2 18.6 17.6 11.2
Sales split by region (2012)
4%
7%
18%
6%
17%
Others
7% Electronics & Telecommunication
5% Pulp, Paper and Packaging Home, Lifestyle & Personal Care
6%
Metals, Mining, Oil, Gas
Coatings, Paints and Printing
General Industry
11%
Plastics & Rubber
Construction 18%
Automotive, Transportation & Machinery
4%22%
16%
Middle East, Africa
2%
Central & South America
Asia-Pacific/Asia 16%
North America
Other European Countries
40%
Germany
1 Company estimates on the basis of information on Evonik’s customers and the further use of Evonik’s products by its customers Adjusted EBITDA 2012 restated for IAS 19 effects
May 8, 2013 | Evonik Q1 2013 Earnings Conference Call

Specialty Materials Selected Business Lines
Page 35
Business Lines Major products and applications Key industry segments
Acrylic Monomers & Polymers
• Acrylic monomers (MMA) as functional additives mainly in resins and coatings or as raw material for polymers
• Acrylic polymers (PMMA) as • light-weight construction material for
diverse uses • or as sheets, films, composites and
membranes
• Coatings • Plastics • Construction • Automotive • Electronics
High Performance Polymers
• High performance polyamides (e.g. PA12) as resistible light-weight structural, functional and design components
• Polyether ether ketone (PEEK)
• Automotive • Plastics • Home • Environmental
Performance Intermediates
• Butadiene • MTBE • 1-butene as co-monomers for
polyethylene • Plasticisers / alcohols (INA; DINP)
• Plastics and rubber • Automotive • Construction
Active Oxygens
• Hydrogen peroxide (H2O2) • for bleaching and oxidising • for manufacture of propylene oxide
(HPPO process)
• Pulp & paper industry • Textile industry • Environmental
May 8, 2013 | Evonik Q1 2013 Earnings Conference Call

Page 36
Raw material split
Petrochemicals c.25%
Machinery & equipment
c.20%
Energy (incl. Natural gas)
c.15%
• Total procurement volume: ~ €9.1 bn • Petrochemical feedstock
~ 25 percent of total procurement volume (particularly steam cracker products and their derivatives)
Other ~40%
(technical equipment,
energy, services)
Raw materials
~60%
Petrochemicals c.25%
Machinery & equipment
c.17%
Logistics & packaging
c.8%
Energy (incl. natural gas) c.15%
Synthetic organic
chemicals c.17%
Other c.12%
Raw materials &
semi-finished products
Oleo-chemicals c.6%
Supply split by product group (2012)
May 8, 2013 | Evonik Q1 2013 Earnings Conference Call

Page 37
1st Quarterin € million 2012 2013
Income before financial result and income taxes 428 396 Results from investments recognized at equity 12 13 Other financial income 0 6EBIT 440 415 Adjustments 69 30Adjusted EBIT 509 445 Net interest expense -80 -66Adjusted income before income taxes 429 379 Adjusted income taxes -115 -88Adjusted income after taxes 314 291 Adjusted non-controlling interests 3 3Adjusted net income 317 294Adjusted earnings per share 0.68 0.63
Adjusted net income bridge
Continuing operations
May 8, 2013 | Evonik Q1 2013 Earnings Conference Call
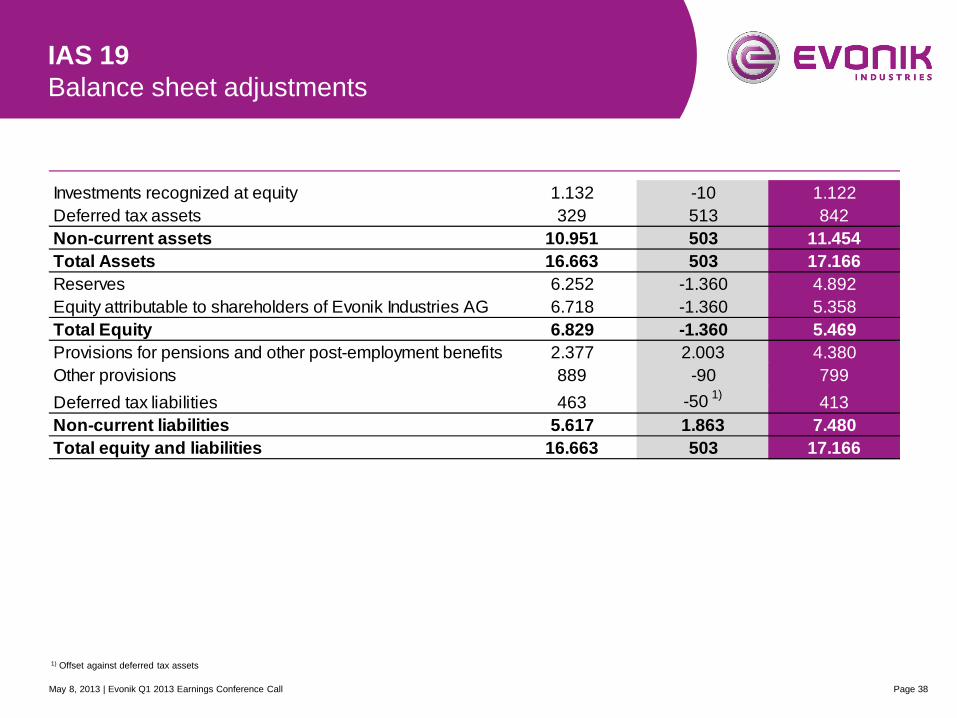
Page 38
IAS 19 Balance sheet adjustments
Investments recognized at equity 1.132 -10 1.122Deferred tax assets 329 513 842Non-current assets 10.951 503 11.454Total Assets 16.663 503 17.166Reserves 6.252 -1.360 4.892Equity attributable to shareholders of Evonik Industries AG 6.718 -1.360 5.358Total Equity 6.829 -1.360 5.469Provisions for pensions and other post-employment benefits 2.377 2.003 4.380Other provisions 889 -90 799Deferred tax liabilities 463 -50 1) 413Non-current liabilities 5.617 1.863 7.480Total equity and liabilities 16.663 503 17.166
May 8, 2013 | Evonik Q1 2013 Earnings Conference Call
1) Offset against deferred tax assets

Page 39
Real Estate divestment and IAS 19 changes Income after tax bridge
in € millionFY 2012
(reported)Restatement
IAS 19
Real EstateDisc.
operationsFY 2012 (restated)
Sales 13,629 0 -239 13,390Adjusted EBITDA 2,589 22 -201 2,410Depreciation and amortization (adjusted) 636 0 -45 591Adjusted EBIT 1,953 22 -156 1,819Adjustments 16 -22 -3 -9EBIT 1,969 0 -159 1,810Net interest expense -357 1 34 -322Income before income taxes, continuing operations 1,612 1 -125 1,488Income taxes, continuing operation -460 0 7 -453Income after taxes, continuing operations 1,152 1 -118 1,035Income after taxes, discontinued operations 15 0 118 133Income after taxes 1,167 1 0 1,168thereof attributable to non-controlling interests -3 0 0 -3Shareholders of EVONIK Industries AG (net income) 1,164 1 0 1,165
Shareholders of EVONIK Industries AG (net income) 1,164 1,165Adjustments -16 9Taxes on adjustments 9 2Adjustments attributable to non-controlling interests 13 13Income from discontinued operations -15 -133Adjusted net income 1,155 1,056Adjusted earnings per share 2.48 2.27
May 8, 2013 | Evonik Q1 2013 Earnings Conference Call

Page 40
Reconciliation of Net Financial Debt
in € million FY2011 FY2012 Source
Non-current financial liabilities 2.657 1.397Balance sheet 2.745 1.464Liabilities from derivatives -88 -67 Annual Report 2012, Note 7.12
Current financial liabilities 249 1.437Balance sheet 402 1.483Liabilities from derivatives -153 -46 Annual Report 2012, Note 7.12
Financial debt 2.906 2.834Cash and cash equivalents 1.409 741Current securities 649 928 Annual Report 2012, Note 7.5Other current financial assets 5 2Financial assets 2.063 1.671
Net financial debt 843 1.163
Reconciliation of net financial debt
May 8, 2013 | Evonik Q1 2013 Earnings Conference Call

Page 41
• Q2 reporting: August 1st, 2013
• Q3 reporting: November 4th, 2013
Conference participations Roadshows
Next reporting dates Capital market day
Upcoming IR events
• May 14-15th, 2013: Deutsche Bank German, Swiss & Austria Conference, Frankfurt
• May 14th, 2013: Bayern LB Fixed Income Conference, Munich
• June 19-20th, 2013: Commerzbank German Corporate Day (Fixed Income), London
• June 27th, 2013: MainFirst Chemicals One-on-One Forum, Frankfurt
• June 17th, 2013: London
• June 6th/7th, 2013: Milano/Lugano
May 8, 2013 | Evonik Q1 2013 Earnings Conference Call
• Evonik Capital Market Day: September 3rd, Essen
Please find an updated schedule on our IR website (“Events & Presentations“)

Page 42
Evonik Investor Relations Team Contact
Tim Lange Head of Investor Relations
+49 201 177 3150 [email protected]
Petra Boden Team Assistant
+49 201 177 3146 [email protected]
Hannelore Gantzer Investor Relations Manager
+49 201 177 3678 [email protected]
Natascha Chromik Junior IR Manager
+49 201 177 3147 [email protected]
Christoph Rump Investor Relations Manager
+49 201 177 3149 [email protected]
Xin Ming Yu Junior IR Manager
+49 201 177 3153 [email protected]
May 8, 2013 | Evonik Q1 2013 Earnings Conference Call