evonik power to create....evonik power to create. november 2017 investor factbook portfolio...
TRANSCRIPT
1
Evonik
Power to create.
November 2017
Investor Factbook
Portfolio
Innovation Culture
Profitable
Growth

2
Table of contents
1. Evonik Industries
Company overview
Group strategy
Acquisitions of Air Products specialty additives business & Huber Silica
2. Segments
3. Financials & outlook
4. Evonik share & Investor Relations

3
A strong basis in Specialty Chemicals
1. Sales with top 1-3 market position by sales, production volume or capacity (depending on available data)
Leading market
positions in
80% of our businesses1
Almost 90% of direct sales
via
marketing & sales force
of ~2,000 employees
Leading and
proprietary technology
platforms in
25 countries
on
5 continents
Highly qualified
workforceas key factor for a
successful and
sustainable business
development
Qualified employees
Market leadership
Customerproximity
Technologyleadership
Unique brand recognition
(selected product brands)

4
Three segments with differentiated management
Nutrition
& Care
Resource
Efficiency
Performance
Materials
Growth Efficiency
€4,316 m €1,006 m / 23.3% €4,473 m €977 m / 21.8%
Sales
€3,245 m
Adj. EBITDA / Margin
€371 m / 11.4%
Sales Adj. EBITDA / MarginSales Adj. EBITDA / Margin
Sales
€12,732 m
Adj. EBITDA
€2,165 m
Margin
17.0%
ROCE
14.0%
2016 Financials
5
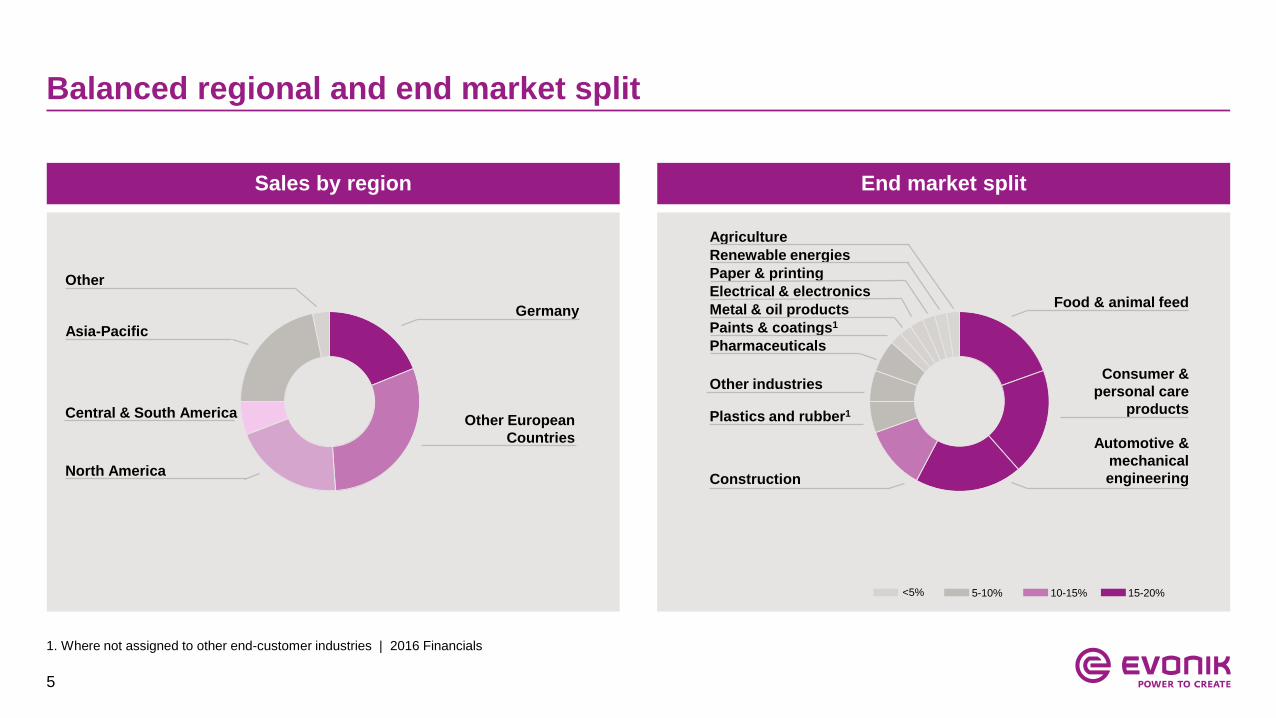
Balanced regional and end market split
End market split
Plastics and rubber1
Food & animal feed
Consumer &
personal care
products
Construction
Automotive &
mechanical
engineering
Other industries
Pharmaceuticals
Paints & coatings1
Metal & oil products
Renewable energies
Paper & printing
Electrical & electronics
Agriculture
<5% 5-10% 10-15% 15-20%
Sales by region
Germany
Other European
Countries
North America
Central & South America
Asia-Pacific
Other
1. Where not assigned to other end-customer industries | 2016 Financials
6
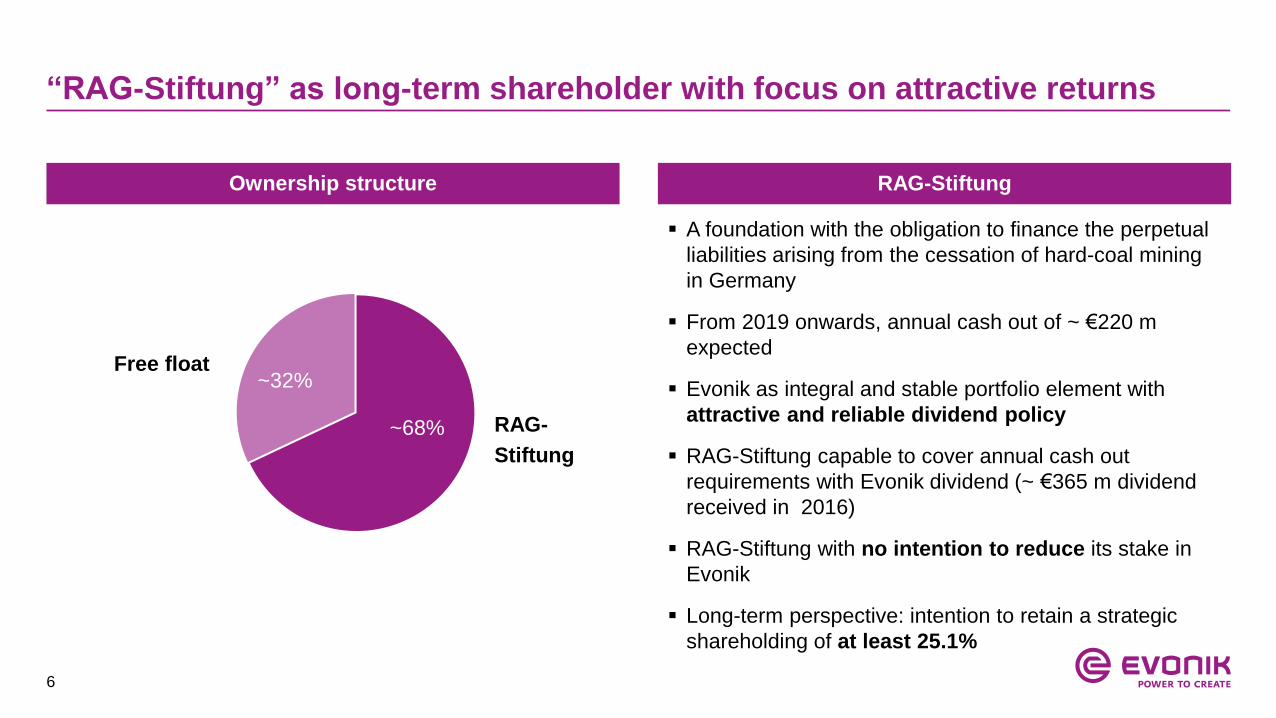
“RAG-Stiftung” as long-term shareholder with focus on attractive returns
~32%
~68% RAG-
Stiftung
Free float
Ownership structure RAG-Stiftung
A foundation with the obligation to finance the perpetual
liabilities arising from the cessation of hard-coal mining
in Germany
From 2019 onwards, annual cash out of ~ €220 m
expected
Evonik as integral and stable portfolio element with
attractive and reliable dividend policy
RAG-Stiftung capable to cover annual cash out
requirements with Evonik dividend (~ €365 m dividend
received in 2016)
RAG-Stiftung with no intention to reduce its stake in
Evonik
Long-term perspective: intention to retain a strategic
shareholding of at least 25.1%

7
Reliable and attractive dividend policy
2008 2009 20112010 20132012 20152014
1.15
+8% CAGR
2016
1.15
Sustainable dividend growth over the last
years: 8% CAGR between 2008 and 2016
Dividend for 2016 on attractive 2015 level
despite lower adjusted net income
Attractive dividend yield ~ 4%
Reliable dividend policy targeting:
dividend continuity
a payout ratio of ~40% of adjusted
net income
Dividend (in €) for FY
Payout ratio 48% 58%

8
More than 150 years of experience in the chemicals industry (1/2)
1880
Stockhausen
1907
Roehm & Haas
1938
Chemische
Werke Huels
Foundation of Evonik‘s
original companiesTake overs by Huels
Merger of Degussa
and Huels
1999
Degussa-Huels
2001
Degussa
Merger of Degussa-
Huels and SKW
Take over of Gold-
schmidt by SKW
1873
Degussa
1999
SKW Trostberg
1980s
Chemische
Werke Huels
1908
SKW Trostberg
1847
Th. Goldschmidt
9
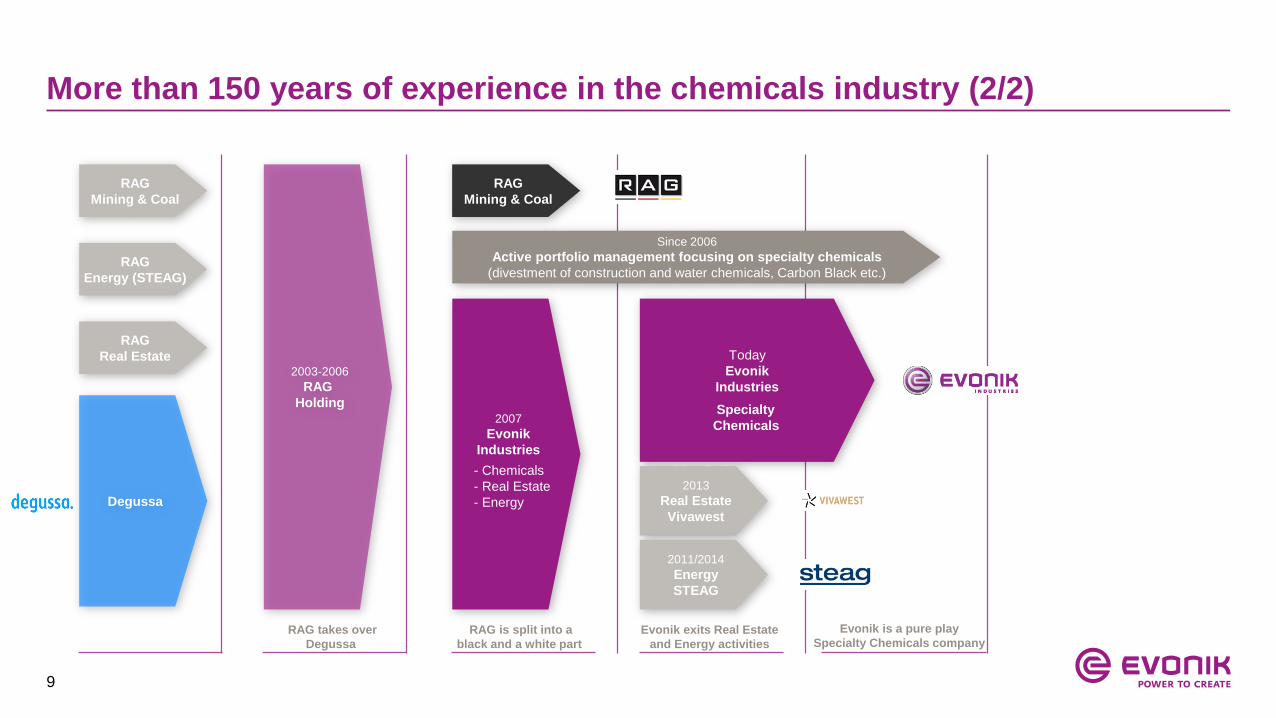
More than 150 years of experience in the chemicals industry (2/2)
2003-2006
RAG
Holding
RAG
Mining & Coal
RAG
Energy (STEAG)
RAG
Real Estate
Degussa
RAG takes over
Degussa
2007
Evonik
Industries
RAG is split into a
black and a white part
RAG
Mining & Coal
Evonik exits Real Estate
and Energy activities
Evonik is a pure play
Specialty Chemicals company
Today
Evonik
Industries
Since 2006
Active portfolio management focusing on specialty chemicals
(divestment of construction and water chemicals, Carbon Black etc.)
- Chemicals
- Real Estate
- Energy
Specialty
Chemicals
- Chemicals
- Real Estate
- Energy
2013
Real Estate
Vivawest
2011/2014
Energy
STEAG
10
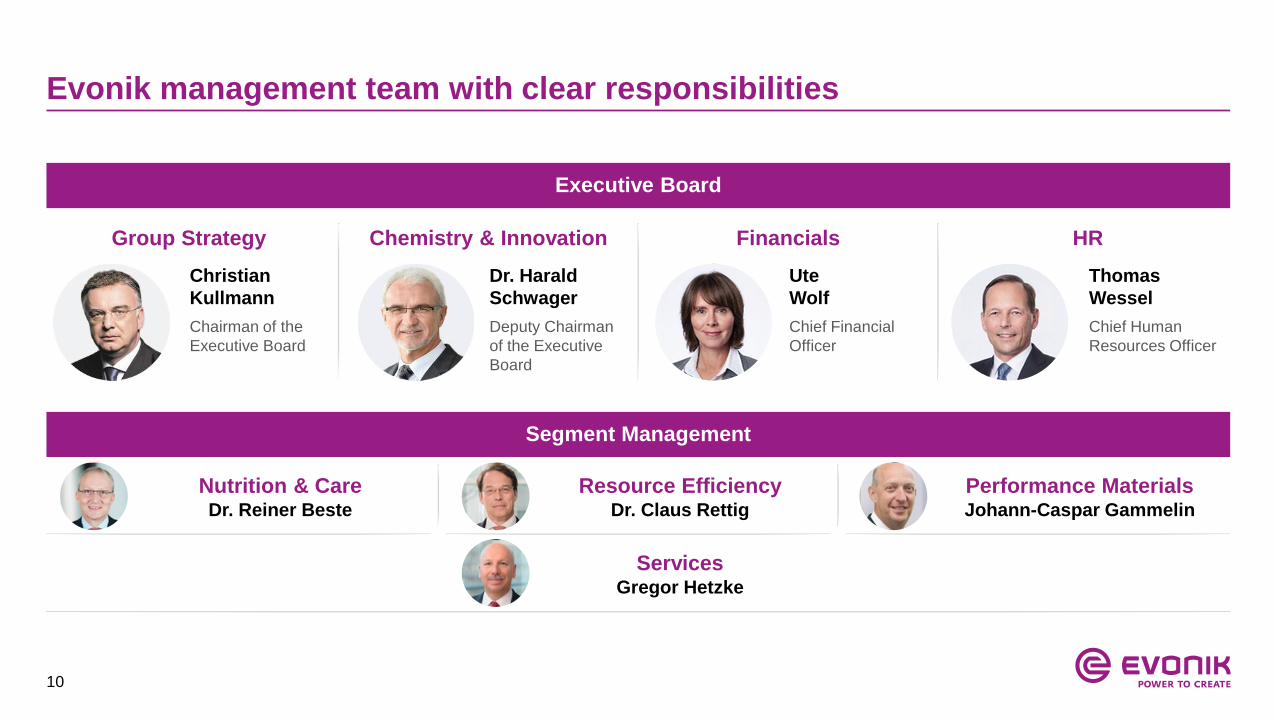
Evonik management team with clear responsibilities
Segment Management
Executive Board
Group Strategy
Christian
Kullmann
Chairman of the
Executive Board
Financials
Ute
Wolf
Chief Financial
Officer
HR
Thomas
Wessel
Chief Human
Resources Officer
Chemistry & Innovation
Dr. Harald
Schwager
Deputy Chairman
of the Executive
Board
Nutrition & CareDr. Reiner Beste
Resource EfficiencyDr. Claus Rettig
Performance MaterialsJohann-Caspar Gammelin
ServicesGregor Hetzke

11
Management compensation
To be paid in cash for each financial year on a monthly basisFixed salary
~1/3
To be paid out in cash annually
Pay-out calculated on the basis of the achievement of certain, primarily value creation focused KPIs (e.g. ROCE, adj. net income, adj. EBITDA) and accident performance
Factor of between 0.8 and 1.2 to take into account the achievement of further individual targets
Bonus capped at 200% of initial targetBonus
~1/3
Granted LTI target amount is calculated in virtual shares (4-year lock-up)
Value of LTI to mirror the development of Evonik’sshare price (incl. dividends)
Amount payable is determined by two performance elements
Absolute performance: Real price of the Evonik share
Relative performance against external index benchmark (MSCI Chemicals)
Bonus capped at 300% of initial amount
To be paid out in cash after lock-up period
Long-term incentive plan
~1/3
12
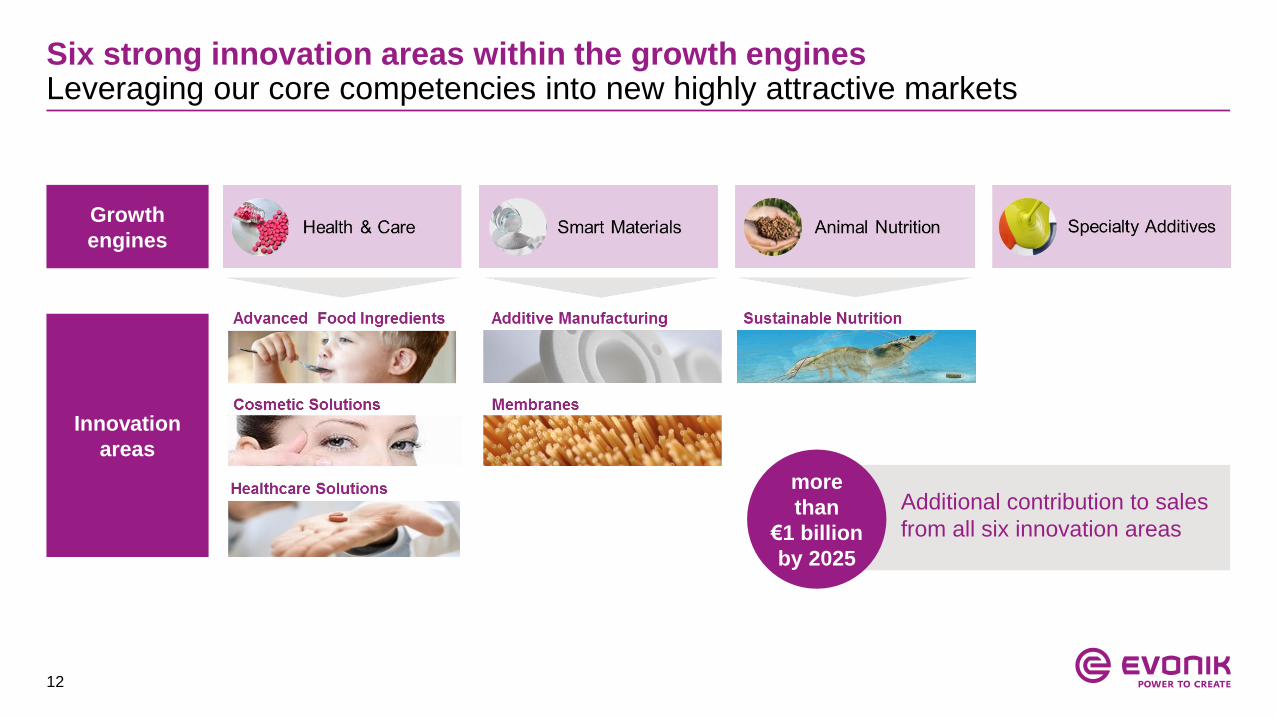
Six strong innovation areas within the growth enginesLeveraging our core competencies into new highly attractive markets
Additional contribution to sales
from all six innovation areas
more
than
€1 billion
by 2025
Growth
engines
Innovation
areas
13
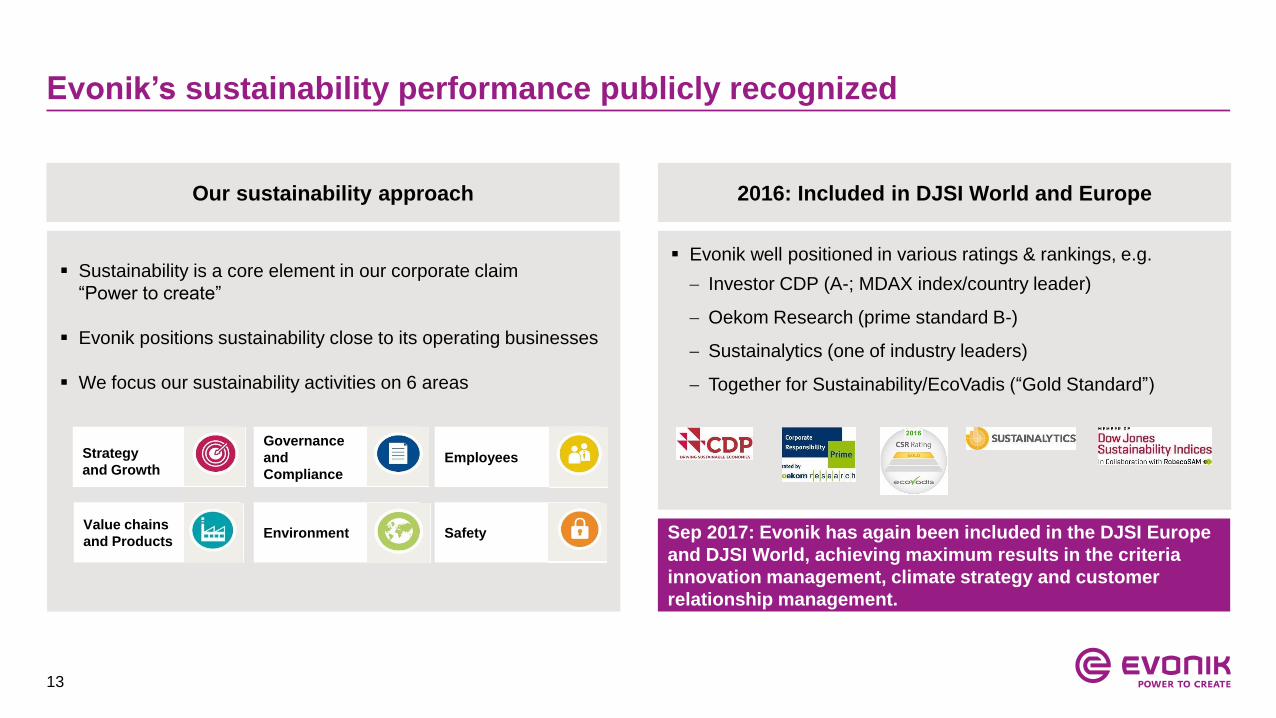
Evonik’s sustainability performance publicly recognized
Our sustainability approach 2016: Included in DJSI World and Europe
Evonik well positioned in various ratings & rankings, e.g.
Investor CDP (A-; MDAX index/country leader)
Oekom Research (prime standard B-)
Sustainalytics (one of industry leaders)
Together for Sustainability/EcoVadis (“Gold Standard”)
Sustainability is a core element in our corporate claim
“Power to create”
Evonik positions sustainability close to its operating businesses
We focus our sustainability activities on 6 areas
Strategy
and Growth
Governance
and
Compliance
Employees
Value chains
and ProductsEnvironment Safety Sep 2017: Evonik has again been included in the DJSI Europe
and DJSI World, achieving maximum results in the criteria
innovation management, climate strategy and customer
relationship management.
14
Table of contents
1. Evonik Industries
Company overview
Group strategy
Acquisitions of Air Products specialty additives business & Huber Silica
2. Segments
3. Financials & outlook
4. Evonik share & Investor Relations

15
Significant progress achieved over last 3 years
2017 …201620152014
Acquisitions
EfficiencyGrowth
Differentiated
management of segments
New Corporate
structure
2017 onwardsFurther balancing of
Evonik’s portfolio and
financial profile

16
Building a best-in-class
specialty chemicals company
17
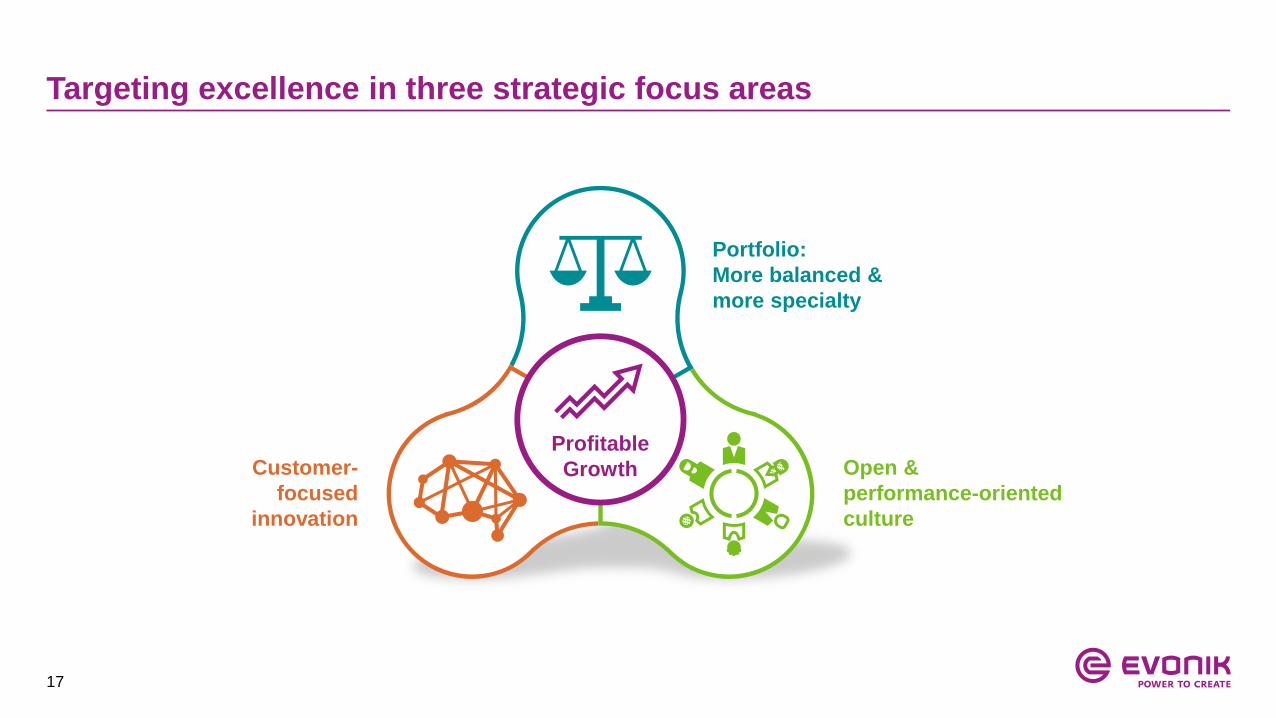
Targeting excellence in three strategic focus areas
Portfolio:
More balanced &
more specialty
Customer-
focused
innovation
Open &
performance-oriented
culture
Profitable
Growth

18
Portfolio strategy: „More balanced – more specialty“
Focus on businesses with specialty chemicals characteristics
High customer proximityMission-critical solutions
enabling value-based pricing
Low cyclicality;
low raw material dependency
Customer-specific products
and servicesAbove-
average
growth and
margins
19
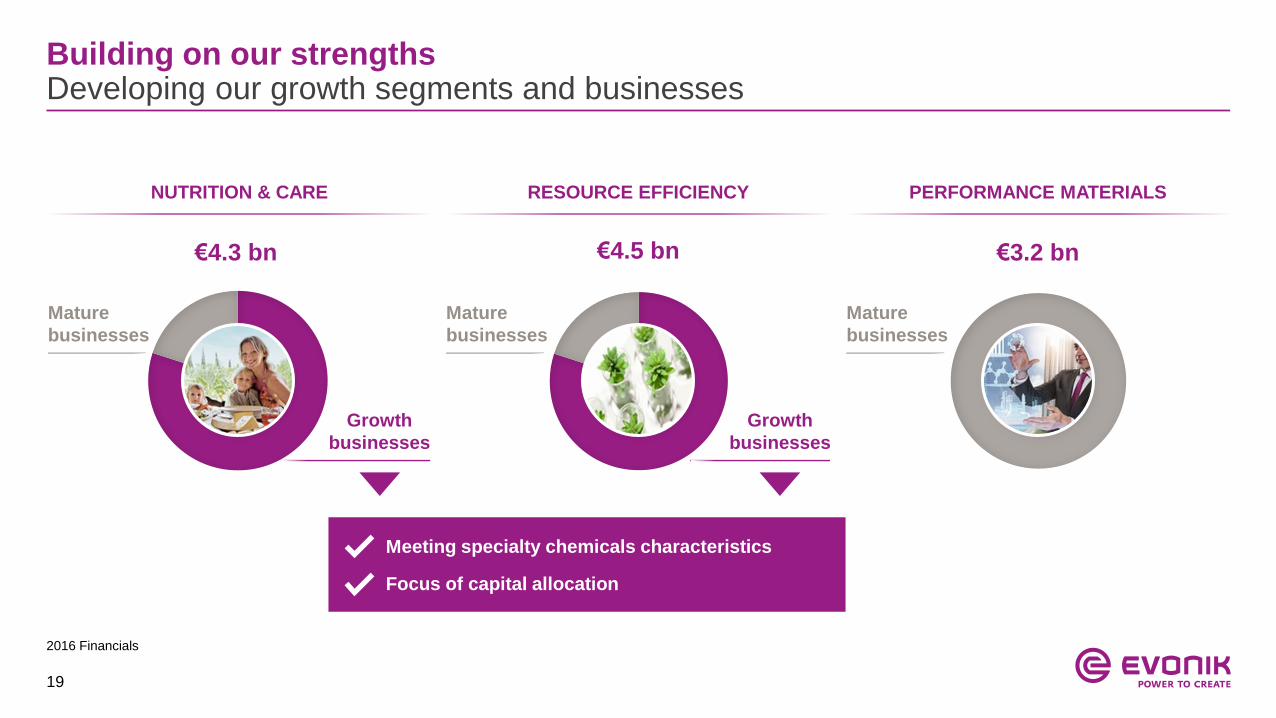
Building on our strengthsDeveloping our growth segments and businesses
NUTRITION & CARE RESOURCE EFFICIENCY PERFORMANCE MATERIALS
€4.3 bn €4.5 bn €3.2 bn
Meeting specialty chemicals characteristics
Focus of capital allocation
Growth
businesses
Growth
businesses
Mature
businesses
Mature
businesses
Mature
businesses
2016 Financials

20
Smart MaterialsHealth & Care
Strategic growth focusFour growth engines as drivers for profitable & balanced growth
Four
growth
engines
NUTRITION & CARE RESOURCE EFFICIENCY
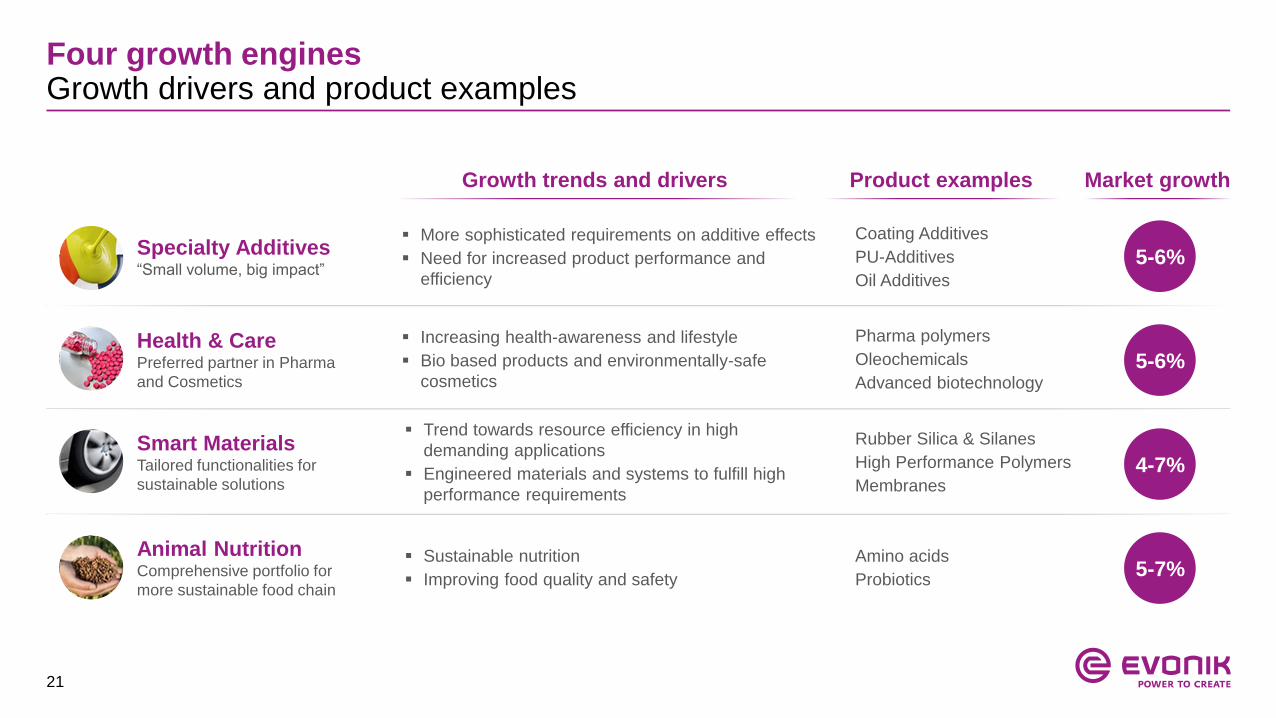
Animal Nutrition
Specialty Additives
21
Four growth enginesGrowth drivers and product examples
Health & CarePreferred partner in Pharma
and Cosmetics
Smart MaterialsTailored functionalities for
sustainable solutions
Animal NutritionComprehensive portfolio for
more sustainable food chain
Specialty Additives“Small volume, big impact”
Growth trends and drivers Market growth
5-7%
5-6%
5-6%
4-7%
More sophisticated requirements on additive effects
Need for increased product performance and
efficiency
Increasing health-awareness and lifestyle
Bio based products and environmentally-safe
cosmetics
Trend towards resource efficiency in high
demanding applications
Engineered materials and systems to fulfill high
performance requirements
Sustainable nutrition
Improving food quality and safety
Product examples
Coating Additives
PU-Additives
Oil Additives
Pharma polymers
Oleochemicals
Advanced biotechnology
Rubber Silica & Silanes
High Performance Polymers
Membranes
Amino acids
Probiotics
22
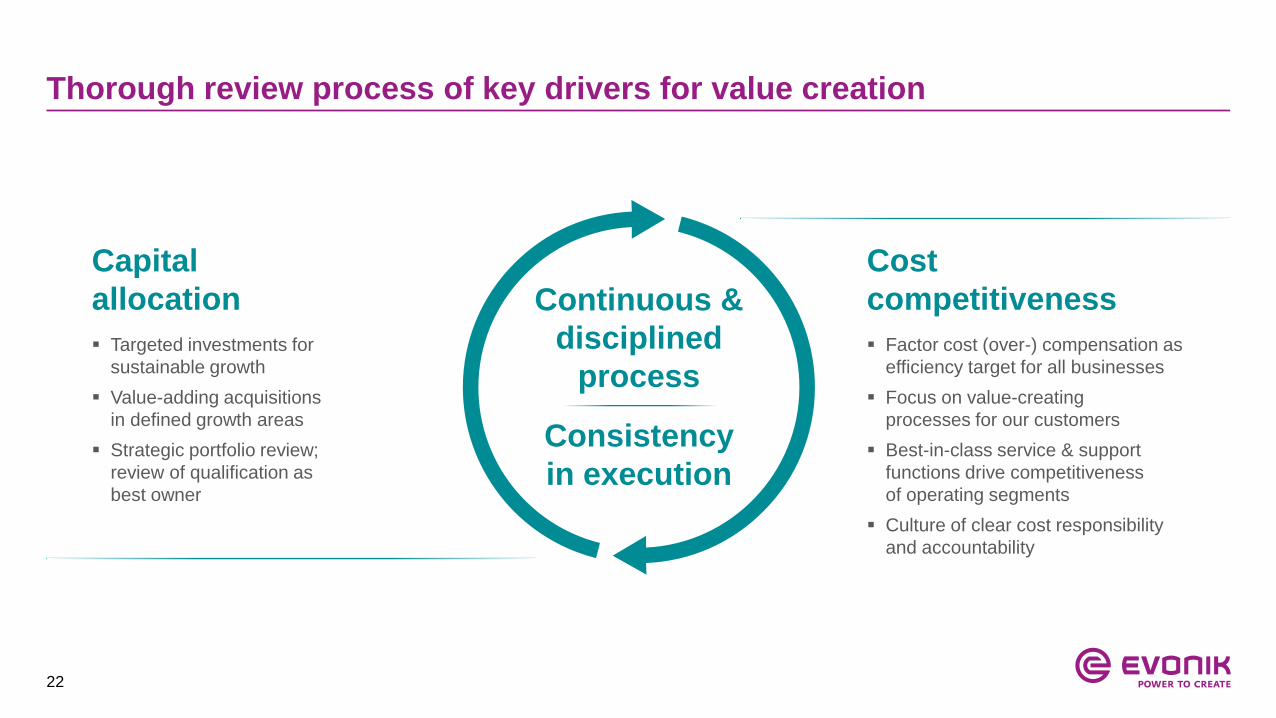
Thorough review process of key drivers for value creation
Capital
allocation
Targeted investments for
sustainable growth
Value-adding acquisitions
in defined growth areas
Strategic portfolio review;
review of qualification as
best owner
Cost
competitiveness
Factor cost (over-) compensation as
efficiency target for all businesses
Focus on value-creating
processes for our customers
Best-in-class service & support
functions drive competitiveness
of operating segments
Culture of clear cost responsibility
and accountability
Continuous &
disciplined
process
Consistency
in execution
23
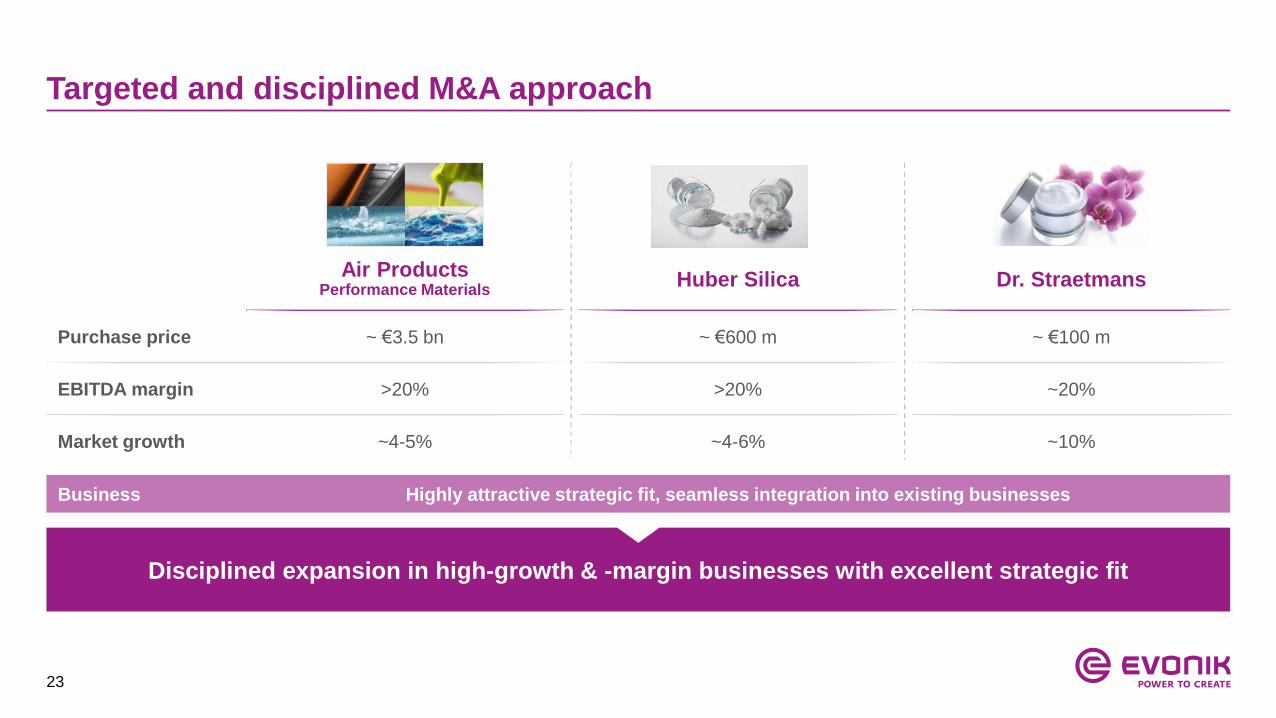
Targeted and disciplined M&A approach
Air ProductsPerformance Materials
Huber Silica Dr. Straetmans
Business Highly attractive strategic fit, seamless integration into existing businesses
Purchase price ~ €3.5 bn ~ €600 m ~ €100 m
EBITDA margin >20% >20% ~20%
Market growth ~4-5% ~4-6% ~10%
Disciplined expansion in high-growth & -margin businesses with excellent strategic fit

24
Implementation schedule for acquisition synergiesRamp-up on track for Air Products specialty additives and Huber silica acquisitions
Implementation schedule
0
10
20
30
40
50
60
70
80
90
100
110
20212016 2020201920182017
(in € m)
One-time
integration
costs1
Annual
synergies
Total
~ €85 m p.a. (USD100 m)
APD: ~ €68 m p.a. (USD80 m)
Huber: ~ €17 m p.a. (USD20 m)
~ €105 m p.a.
APD: ~ €75 m p.a.
Huber: ~ €30 m p.a.
Annual synergies One-time costs
1. Excluding transaction-related costs | Currency translation based on current EUR/USD rate of 1.18
25
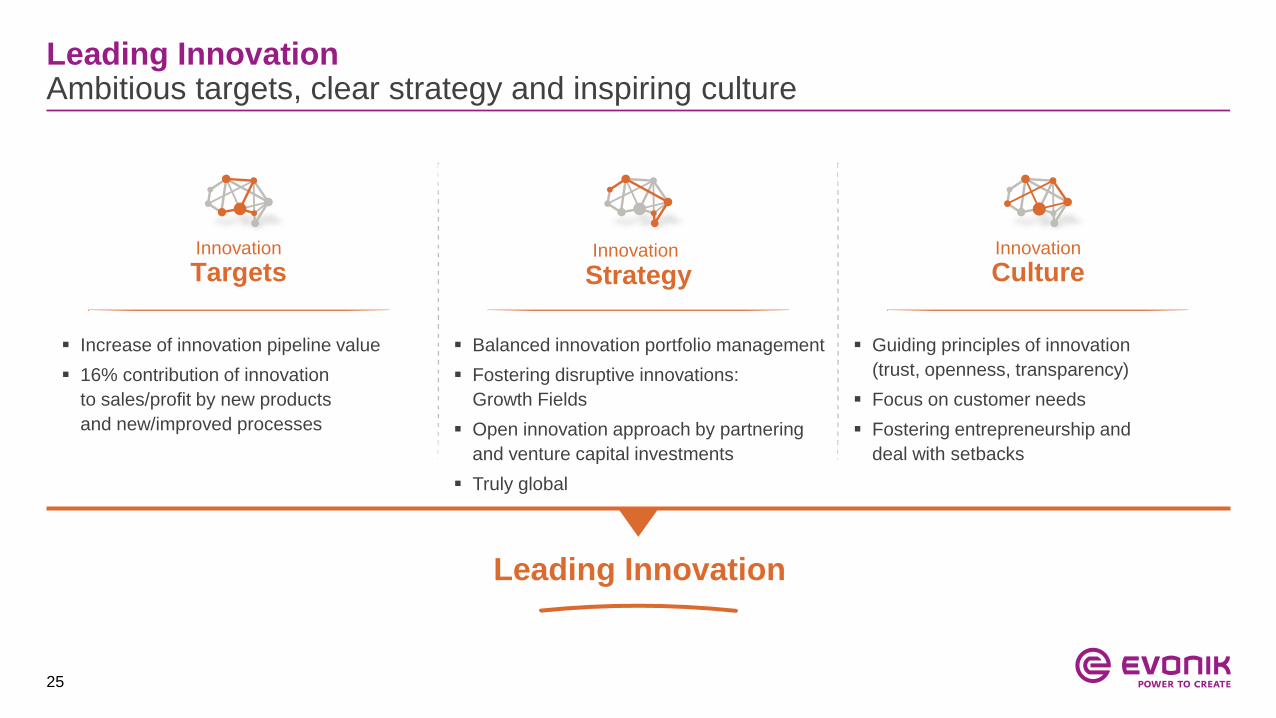
Leading InnovationAmbitious targets, clear strategy and inspiring culture
Increase of innovation pipeline value
16% contribution of innovation
to sales/profit by new products
and new/improved processes
Balanced innovation portfolio management
Fostering disruptive innovations:
Growth Fields
Open innovation approach by partnering
and venture capital investments
Truly global
Guiding principles of innovation
(trust, openness, transparency)
Focus on customer needs
Fostering entrepreneurship and
deal with setbacks
Leading Innovation
Innovation
CultureInnovation
TargetsInnovation
Strategy
26
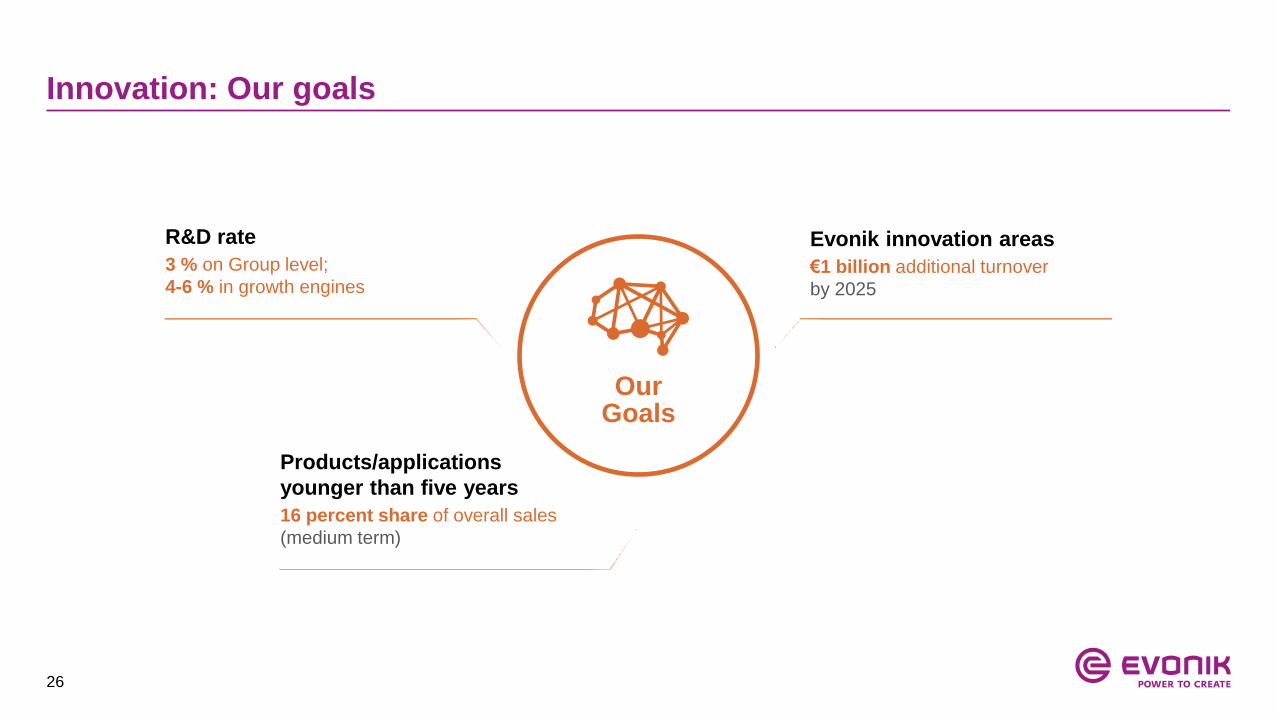
Innovation: Our goals
R&D rate
3 % on Group level;
4-6 % in growth engines
Evonik innovation areas
€1 billion additional turnover
by 2025
Products/applications
younger than five years
16 percent share of overall sales
(medium term)
Our Goals

27
Corporate culture drives performance
Best-in-class team
We build on openness, trust and respect
We assign responsibility and demand
accountability
We reward performance
We continuously work on developing an
international mindset as part of our
diversity strategy
We grow our own leaders
Business focus
We take action and initiate change
We reward measured risk taking
We promise and deliver – with conviction,
clarity and consistency
We excel our customers’ expectations
We compete to win Corporate
Culture
28
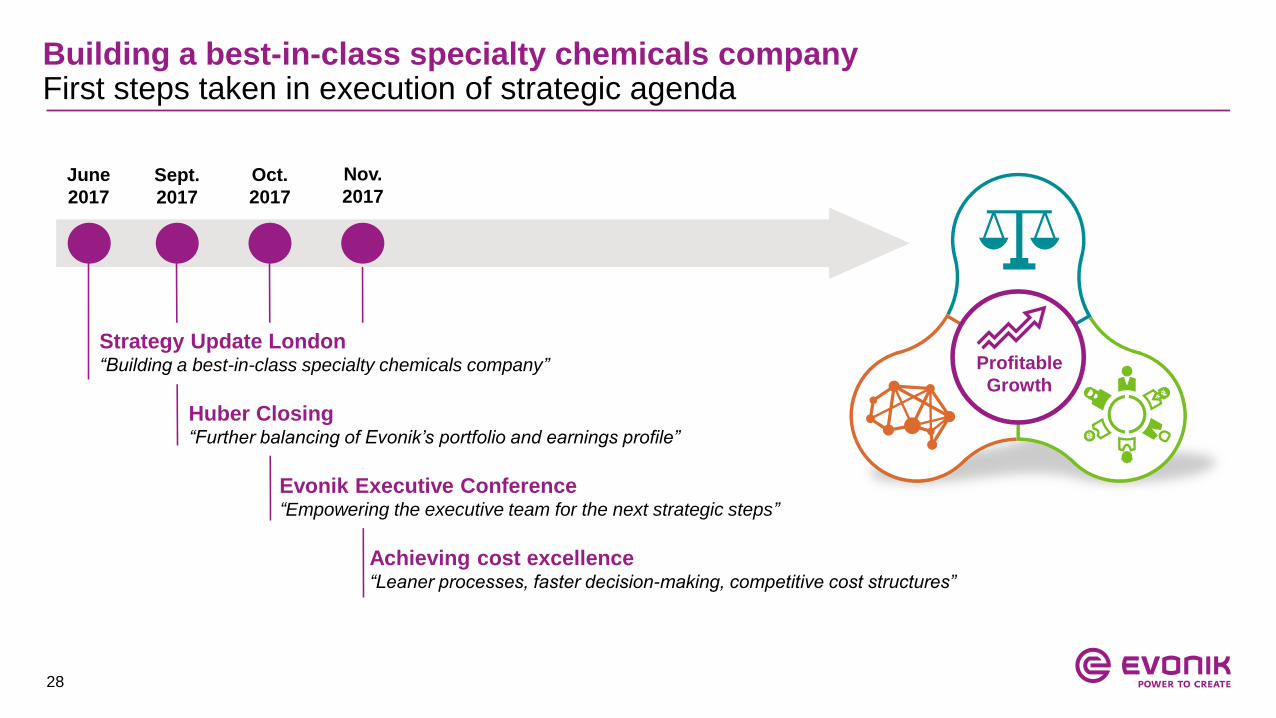
Building a best-in-class specialty chemicals companyFirst steps taken in execution of strategic agenda
Profitable
Growth
Evonik Executive Conference “Empowering the executive team for the next strategic steps”
Achieving cost excellence“Leaner processes, faster decision-making, competitive cost structures”
June
2017
Sept.
2017
Oct.
2017
Nov.
2017
Huber Closing“Further balancing of Evonik’s portfolio and earnings profile”
Strategy Update London“Building a best-in-class specialty chemicals company”
29
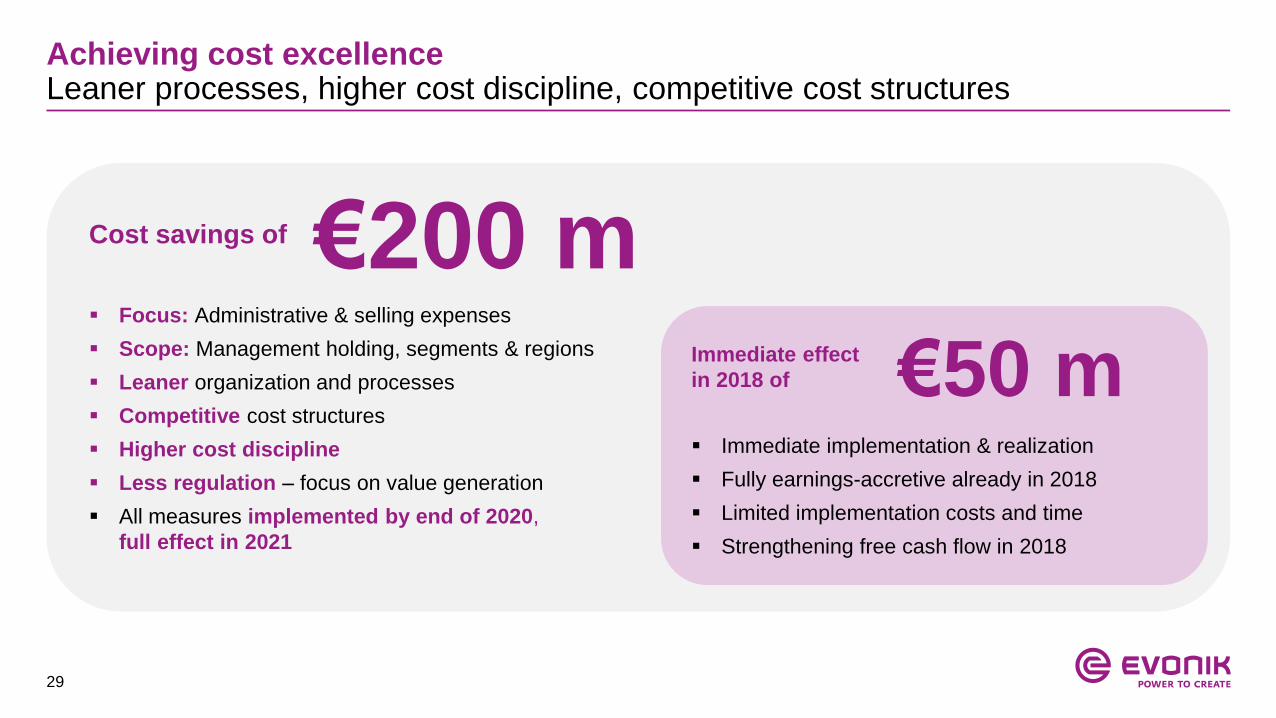
Achieving cost excellenceLeaner processes, higher cost discipline, competitive cost structures
Focus: Administrative & selling expenses
Scope: Management holding, segments & regions
Leaner organization and processes
Competitive cost structures
Higher cost discipline
Less regulation – focus on value generation
All measures implemented by end of 2020,
full effect in 2021
Immediate effect
in 2018 of
€200 mCost savings of
€50 m Immediate implementation & realization
Fully earnings-accretive already in 2018
Limited implementation costs and time
Strengthening free cash flow in 2018

30
Strategic agenda reflected in ambitious financial targetsStructurally lifting EBITDA margin and driving balanced growth
Historic margin range (in %) Targets going forward (over the cycle)
2010 2011 2012 2013 2014 2015 2016
18.3
19.018.5
15.7
14.6
18.2
17.0
ROCE above cost of capital
Sustainable FCF generation
Reliable and sustainably growing dividend
Solid investment grade rating
18-20%Structurally lift EBITDA margin
into sustainably higher range of
16-18%GDP+Above-average volume growth

31
Consistently executing our strategic agenda Levers for structural uplift in profitability and growth
Cost
excellence
Innovation
Portfolio
Management
Synergy
realization
by (year)
Realization of synergies from Air Products
and J.M. Huber acquisitions
Leaner processes, higher cost discipline,
competitive cost structures
Leverage additional growth from six innovation
growth fields with above-average profitability
Portfolio strategy: more balanced and more specialty
Impact
€85 m
EBITDA1
€200 m
EBITDA
€1 bn
additional
SALES
Strategic lever
2020/
2021
2021
(full impact)
2025
18-20%EBITDA margin
GDP+volume growth
1. Total synergies of ~$100 m; currency translation based on current EUR/USD rate of 1.18

32
Table of contents
1. Evonik Industries
Company overview
Group strategy
Acquisitions of Air Products specialty additives business & Huber Silica
2. Segments
3. Financials & outlook
4. Evonik share & Investor Relations

33
APD Performance Materials1 provides an excellent fit with Evonik
1. APD Performance Materials is the Specialty & Coating Additives business of Air Products’ Materials Technologies Segment
Creating a global
leader in Specialty &
Coating Additives
Leading market
positions in
performance-critical
additives
Strengthening of
growth segments
Nutrition & Care and
Resource Efficiency
Excellent fit of all
acquired businesses
with Evonik’s growth
segments
Combining
complementary
chemistry,
manufacturing
processes and
formulation know-how
Customer- and
solution-oriented
businesses with
complementary
innovation pipeline
Expanding global
footprint
Strengthening
presence in North
America and Asia
High margin and
resilient business with
low capital intensity
and strong cash
generation
High synergy potential
due to exceptional
business and regional
complementarity
Specialty product
portfolio
Customer and
innovation focus
Truly
global footprint
Enhanced financial
performanceLeadership position
34
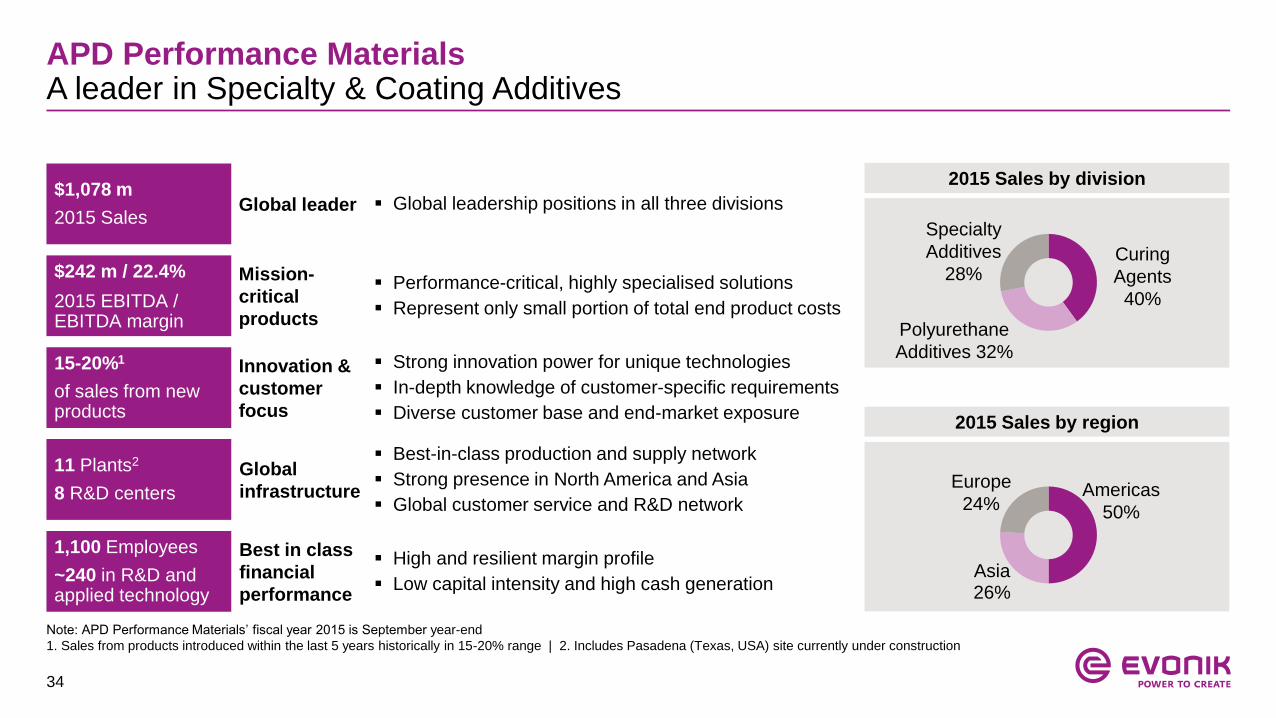
APD Performance MaterialsA leader in Specialty & Coating Additives
Note: APD Performance Materials’ fiscal year 2015 is September year-end
1. Sales from products introduced within the last 5 years historically in 15-20% range | 2. Includes Pasadena (Texas, USA) site currently under construction
Specialty
Additives
28%
Global leader
Mission-
critical
products
Innovation &
customer
focus
Global
infrastructure
Best in class
financial
performance
$1,078 m
2015 Sales
$242 m / 22.4%
2015 EBITDA / EBITDA margin
11 Plants2
8 R&D centers
1,100 Employees
~240 in R&D and applied technology
15-20%1
of sales from new products
Polyurethane
Additives 32%
Curing
Agents
40%
Americas
50%
Europe
24%
2015 Sales by division
Best-in-class production and supply network
Strong presence in North America and Asia
Global customer service and R&D network
Global leadership positions in all three divisions
Performance-critical, highly specialised solutions
Represent only small portion of total end product costs
Strong innovation power for unique technologies
In-depth knowledge of customer-specific requirements
Diverse customer base and end-market exposure
High and resilient margin profile
Low capital intensity and high cash generation
2015 Sales by region
Asia26%

35
Complementary regional setup leading to balanced geographic footprint
2015 Evonik Additives1 Sales Pro-Forma 2015 Additives Sales2015 APD Perf. Materials2 Sales
Close geographic
proximity of manufacturing
sites for seamless
integration
Balancing global footprint
with increased presence in
North America
Strong presence in every
region matching the global
set-up of customers
Close customer
relationships driving
global growth via cross-
selling opportunities
Europe
26%
24%Europe
50% Americas
Asia 25%
32%Americas
43% Europe
Asia24%
26%Americas
50%
Asia
1. Relates to affected Evonik Specialty & Coating Additives business lines
2. APD Performance Materials’ sales calendarised to December year-end and translated at EUR/USD FX rate of 1.11 as of average 2015
36
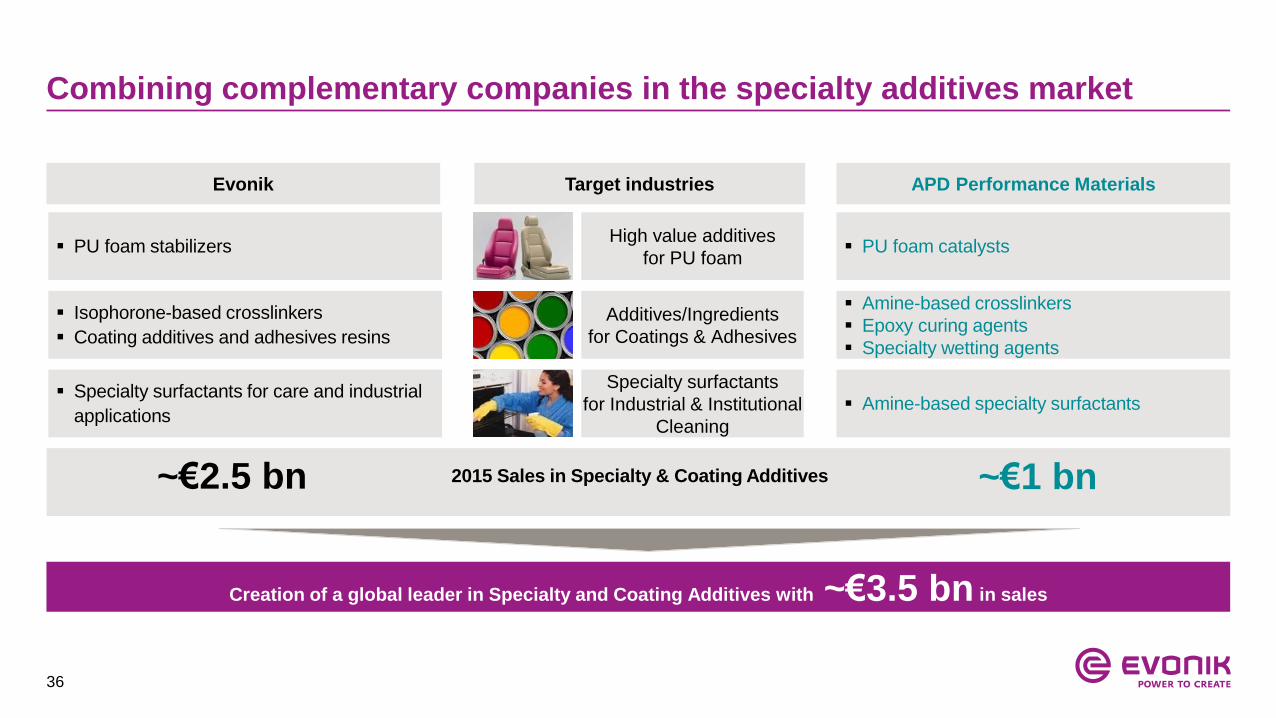
Combining complementary companies in the specialty additives market
High value additives
for PU foam PU foam stabilizers PU foam catalysts
Additives/Ingredients
for Coatings & Adhesives
Isophorone-based crosslinkers
Coating additives and adhesives resins
Amine-based crosslinkers
Epoxy curing agents
Specialty wetting agents
~€2.5 bn ~€1 bn2015 Sales in Specialty & Coating Additives
Creation of a global leader in Specialty and Coating Additives with ~€3.5 bn in sales
Evonik APD Performance MaterialsTarget industries
Specialty surfactants
for Industrial & Institutional
Cleaning
Specialty surfactants for care and industrial
applications Amine-based specialty surfactants

37
Excellent strategic and operational fit leading to significant synergies
Complementary product portfolioExcellent strategic fit
Cost synergies
Synergies
Expected
sustainable level
Procurement
savings
Production
optimization
Overhead
efficiencies
~$60 m
Revenue synergies
Broader
product and
application
portfolio
Leveraging
each other’s
customer base
~$20 m
Total annual synergies of ~$80 m1
Strong supply chains and
manufacturing base
1. Based on current assumptions and market conditions; ramp-up period of 3-4 years with cumulative implementation costs of ~$80 m
38
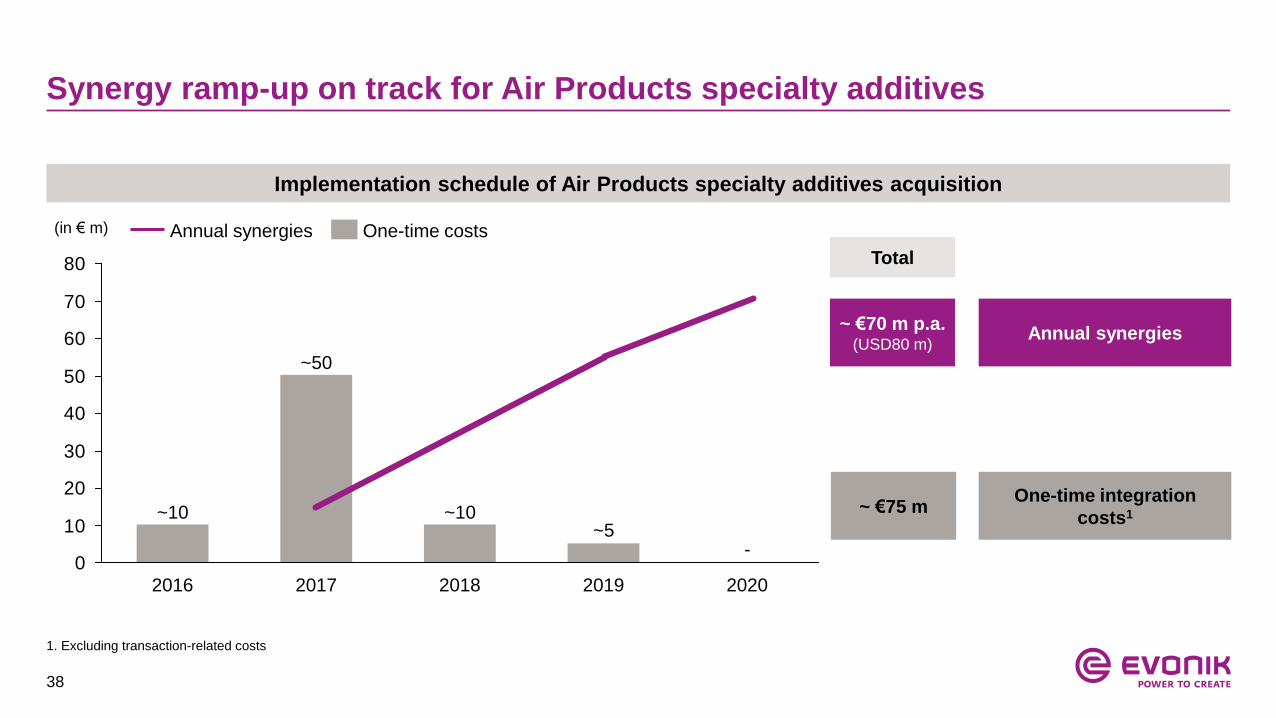
Synergy ramp-up on track for Air Products specialty additives
Implementation schedule of Air Products specialty additives acquisition
0
10
20
30
40
50
60
70
80
-
20202019
~5
2018
~10
2017
~50
2016
~10
(in € m)
One-time integration
costs1
Annual synergies
Total
~ €70 m p.a.(USD80 m)
~ €75 m
One-time costsAnnual synergies
1. Excluding transaction-related costs
39
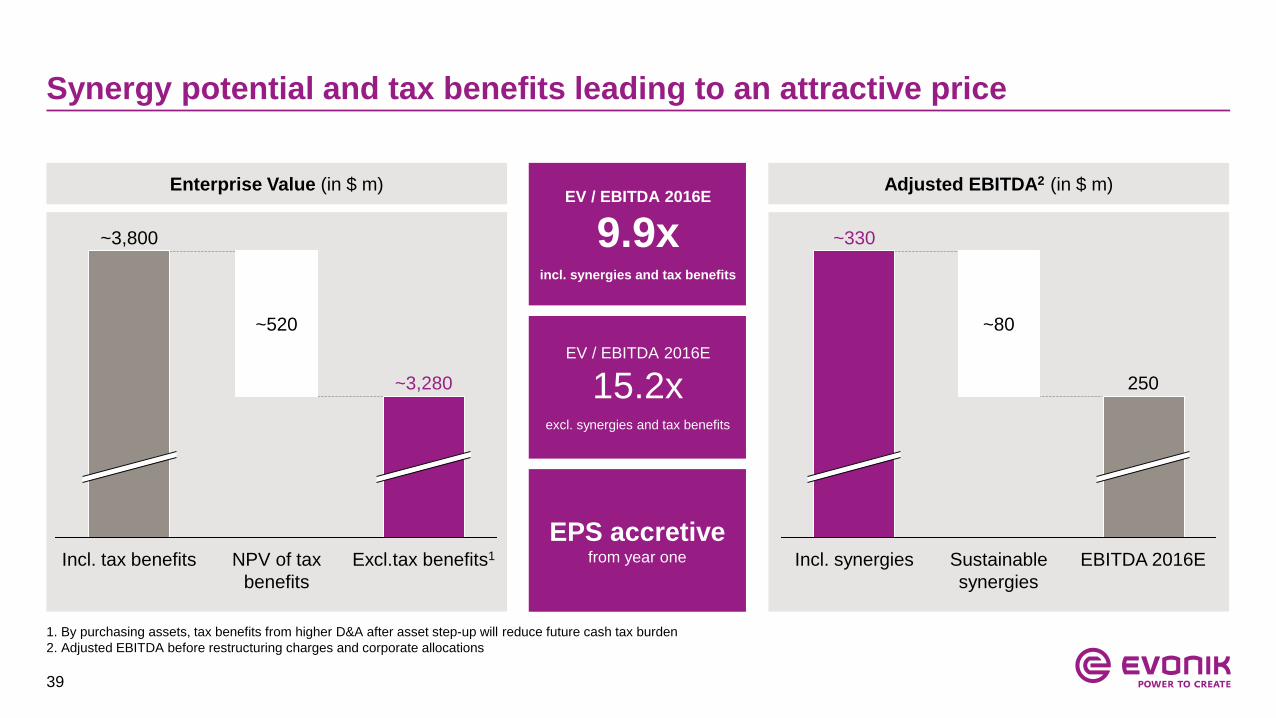
Synergy potential and tax benefits leading to an attractive price
EV / EBITDA 2016E
9.9xincl. synergies and tax benefits
EV / EBITDA 2016E
15.2xexcl. synergies and tax benefits
EPS accretive from year oneExcl.tax benefits1
~3,280
NPV of tax
benefits
~520
Incl. tax benefits
~3,800
EBITDA 2016E
250
Sustainable
synergies
~80
Incl. synergies
~330
1. By purchasing assets, tax benefits from higher D&A after asset step-up will reduce future cash tax burden
2. Adjusted EBITDA before restructuring charges and corporate allocations
Enterprise Value (in $ m) Adjusted EBITDA2 (in $ m)
40
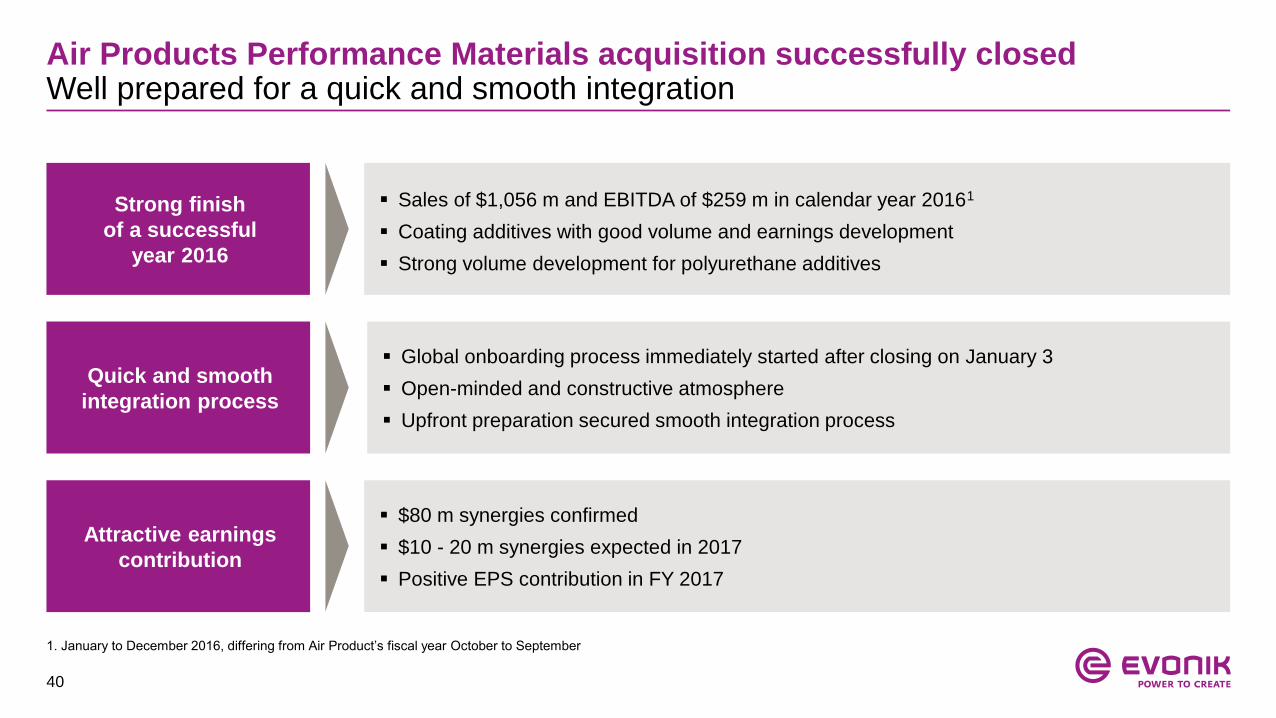
Air Products Performance Materials acquisition successfully closedWell prepared for a quick and smooth integration
Sales of $1,056 m and EBITDA of $259 m in calendar year 20161
Coating additives with good volume and earnings development
Strong volume development for polyurethane additives
Strong finish
of a successful
year 2016
Global onboarding process immediately started after closing on January 3
Open-minded and constructive atmosphere
Upfront preparation secured smooth integration process
Quick and smooth
integration process
$80 m synergies confirmed
$10 - 20 m synergies expected in 2017
Positive EPS contribution in FY 2017
Attractive earnings
contribution
1. January to December 2016, differing from Air Product’s fiscal year October to September

41
Strengthening of growth businesses Nutrition & Care and Resource Efficiency
Substantial synergy potential and tax benefits
Fully aligned with M&A strategy
Enhanced rating profile after announcement
Excellent fit with Evonik’s existing businesses
Creating a global leader in Specialty and Coating Additives
Key takeaways

42
Huber SilicaA profitable and resilient player in Silica
J.M. Huber Corporation
Huber Silica is part of US-based company
J.M. Huber Corporation
Family-owned, founded in 1883
Headquarter in Edison, New Jersey
Sales 2016E:
close to
$300 m
EBITDA 2016E:
$60 m
EBIT 2016E:
$44 m
Huber Silica business
Technology- and solution-driven business with
long-term customer relationships
Headcounts: 697 globally
6 plants with global footprint in all key regions
(U.S., Europe, India, China)
4 R&D centers in all key regions EBITDA margin: >20%

43
Acquisition of Huber SilicaAccess to new highly attractive silica applications for Evonik
Evonik‘s focus areas in Silica Huber’s focus areas in Silica
Tire
Coatings
Industrial Specialties
Dental
Life Science Specialties
Complementary
applications
Attractive
growth rates:
4-6%
Combined sales1: > €1.3 bn I Adj. EBITDA margin: >20%
1. Sales of Evonik Business Line Silica and Huber Silica
44
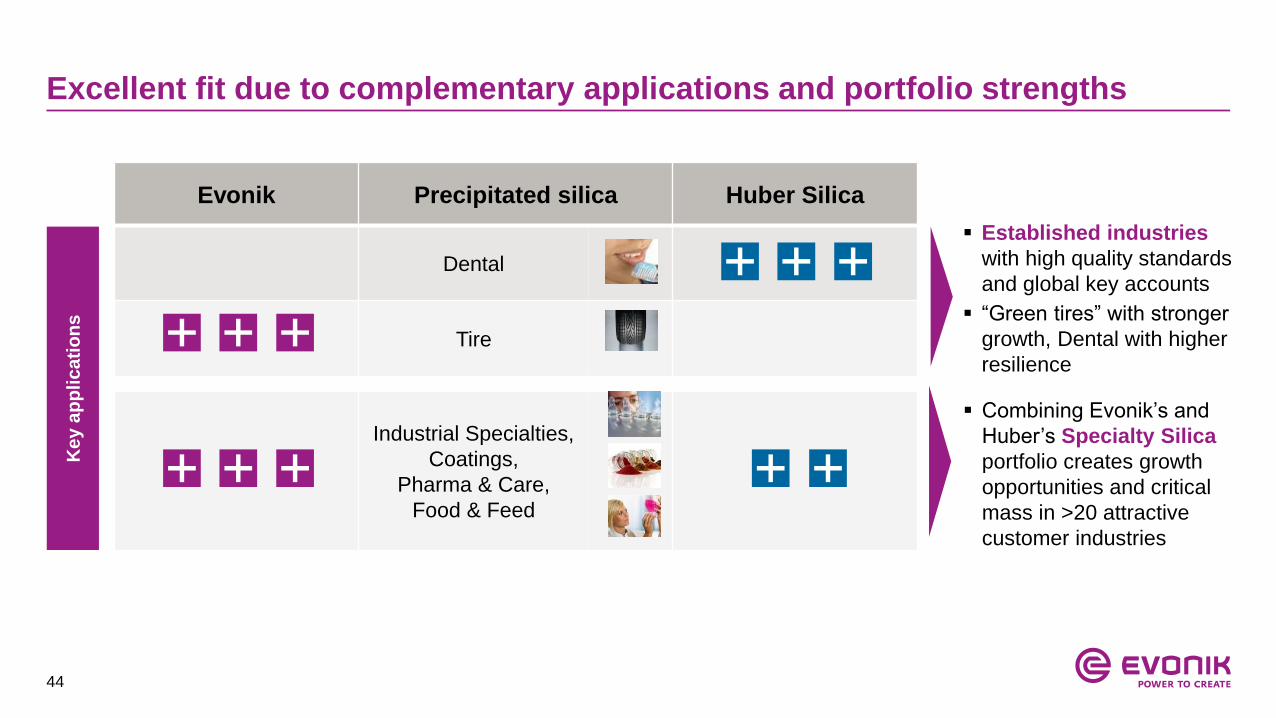
Excellent fit due to complementary applications and portfolio strengths
Evonik Precipitated silica Huber Silica
Dental
Tire
Industrial Specialties,
Coatings,
Pharma & Care,
Food & Feed
Established industries
with high quality standards
and global key accounts
“Green tires” with stronger
growth, Dental with higher
resilience
Ke
y a
pp
lic
ati
on
s
Combining Evonik’s and
Huber’s Specialty Silica
portfolio creates growth
opportunities and critical
mass in >20 attractive
customer industries

45
Diversified exposure with attractive growth ratesResource Efficiency and Convenience as major growth drivers
Coatings Matting agent of choice for waterborne coatings
Rheology control additive in automotive coatings
Reduced rolling resistance of “Green Tires”
Increased tensile strength and hardness of e.g. beltsTire
Tear resistance in silicones and rubbers
Flow control of bonding pastes in windmill productionIndustrial
Pharma & Care
Tableting aid and carrier for drugs
Replacement of plastic scrub particles for peelings
Food & Feed Anti-settling in liquid agrochemicals
Carrier for liquid ingredients (e.g. vitamins)
Anti-caking during food processing
Dental Abrasive silica for cleaning and whitening
Thickening agent for toothpaste
5% p.a.
5-7% p.a.
3-5% p.a.
5% p.a.
4% p.a.
4% p.a.
Source: Notch Consulting, Inc.; Evonik estimates

46
Optimizing the regional production setupDedicated plants for specific silica types in each major region
Asset optimization:
Asia
North America Europe
Combination of production setups: Enabling a dedicated regional plant setup for specific applications
Situation today:
Plants producing different silica
types for several applications
New setup after integration:
Asset optimization towards one
dedicated application per plant
fuels higher efficiency
R&D centers in each major region
facilitating targeted R&D for
Specialties
Combined and optimized
capacities enable capex saving
potential for Evonik in the future
Tire
Dental
Specialties
Tire
Dental
Specialties
Tire
Dental
Specialties
Target
setup:
Production site Huber Production site Evonik Plant under construction in USA
47
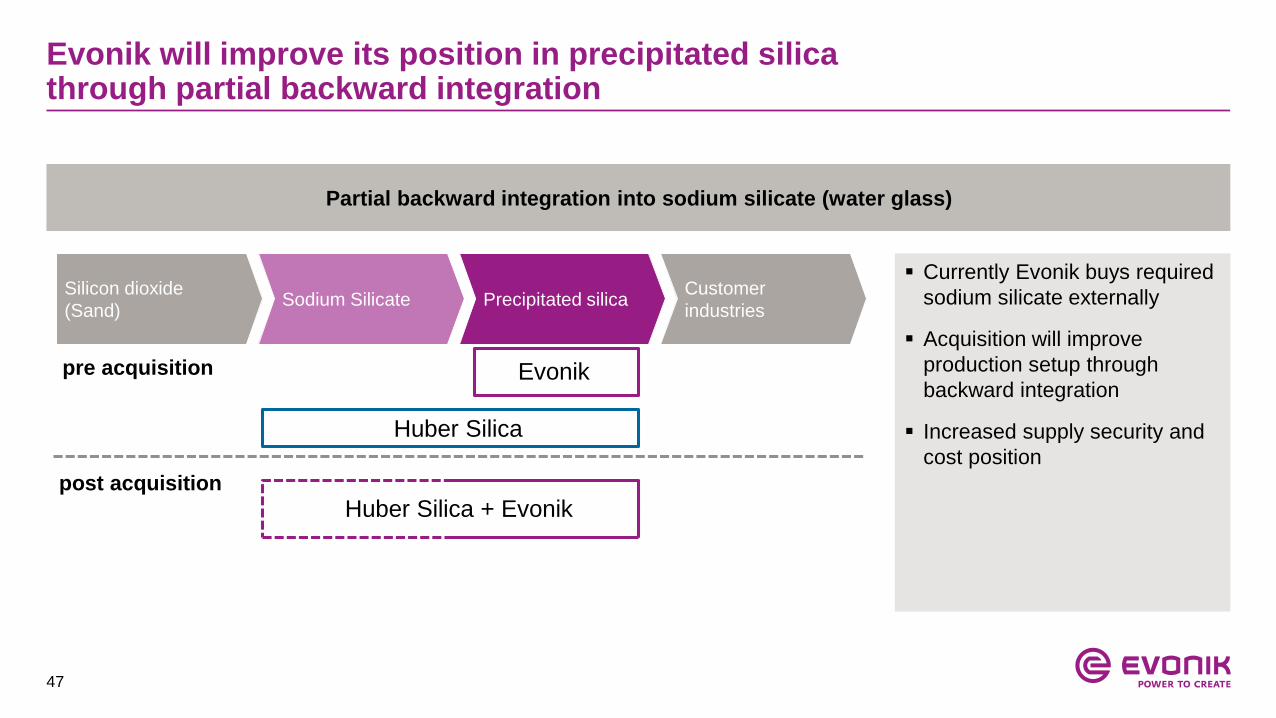
Evonik will improve its position in precipitated silicathrough partial backward integration
Silicon dioxide
(Sand)Sodium Silicate Precipitated silica
Customer
industries
Evonik
Currently Evonik buys required
sodium silicate externally
Acquisition will improve
production setup through
backward integration
Increased supply security and
cost position
Partial backward integration into sodium silicate (water glass)
pre acquisition
post acquisition
Huber Silica + Evonik
Huber Silica
48
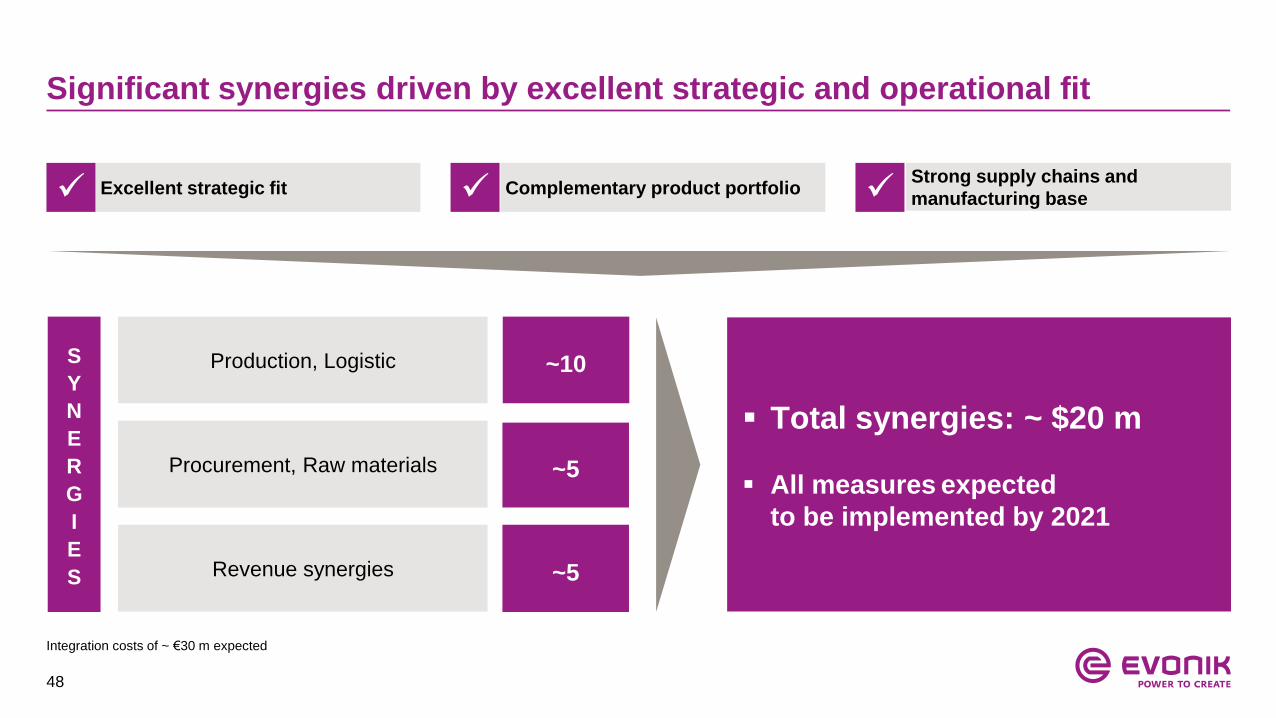
Significant synergies driven by excellent strategic and operational fit
~10Production, Logistic
Total synergies: ~ $20 m
All measures expected
to be implemented by 2021
Excellent strategic fit Complementary product portfolioStrong supply chains and
manufacturing base
S
Y
N
E
R
G
I
E
S
Procurement, Raw materials
Revenue synergies
~5
~5
Integration costs of ~ €30 m expected

49
Synergy ramp-up on track for Huber Silica specialty additives
Implementation schedule of Huber Silica acquisition
0
5
10
15
20
25
30
~10
~20
2017 2018 2019 2020 2021
(in € m)
One-time integration
costs1
Annual synergies
All measures expected
to be implemented by 2021
Total
~ €17 m p.a.(USD20 m)
~ €30 m
One-time costsAnnual synergies
1. Excluding transaction-related costs
~2

50
Synergies and position as strategic buyer leading to attractive valuation
Enterprise Value (in $ m) EV / EBITDA 2016E
~7 xincl. synergies & tax benefits
EV / EBITDA 2016E
10.5 xexcl. synergies & tax benefits
EPS accretive
from year one1
EBITDA incl. synergies (in $ m)
EBITDA incl.
synergies
80
Sustainable
synergies
EBITDA
2016E
60
EV incl.
tax benefits
550
NPV of
tax benefits
80
EV excl.
tax benefits
630
20
2
1. First full year after closing | 2. By purchasing assets, tax benefits from higher D&A after asset step-up will reduce future cash tax burden
51
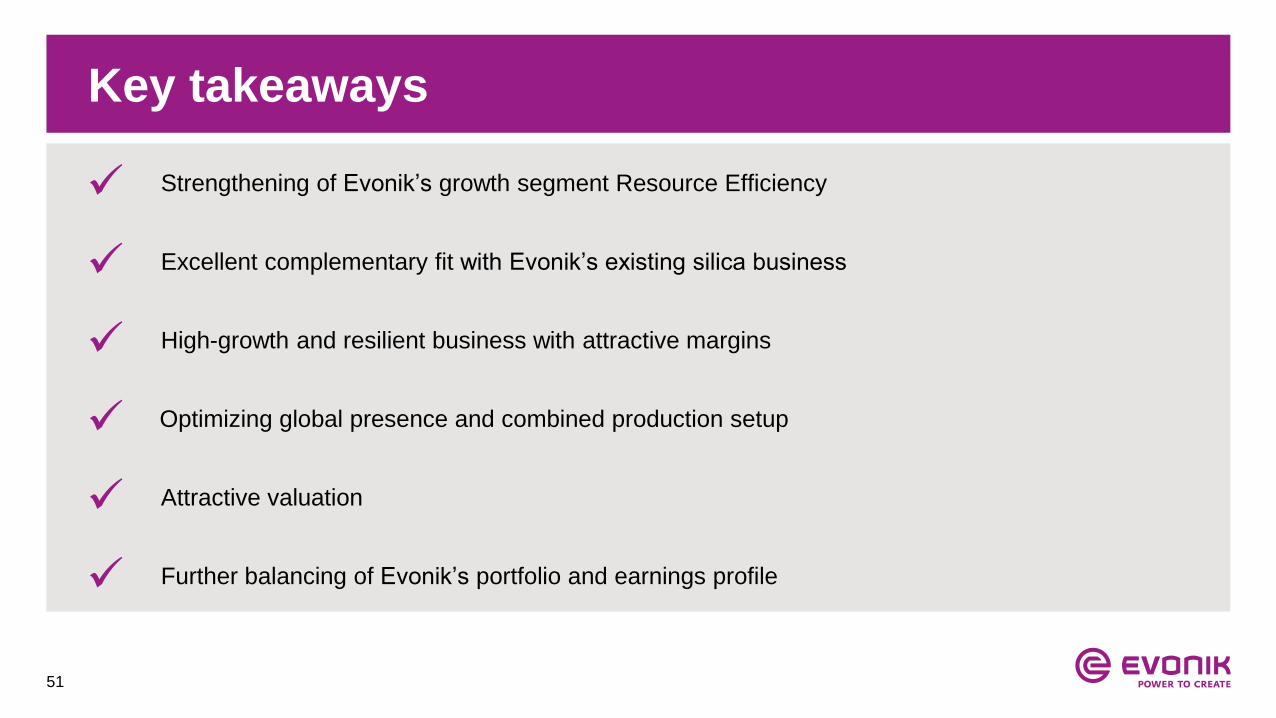
Optimizing global presence and combined production setup
Attractive valuation
Further balancing of Evonik’s portfolio and earnings profile
Excellent complementary fit with Evonik’s existing silica business
Strengthening of Evonik’s growth segment Resource Efficiency
High-growth and resilient business with attractive margins
Key takeaways

52
Table of contents
1. Evonik Industries
2. Segments
3. Financials & outlook
4. Evonik share & Investor Relations

53
Evonik Group22 Business Lines grouped in 3 segments
Animal Nutrition
Baby Care
Health Care
Personal Care
Household Care
Comfort & Insulation
Interface & Performance
Silica
Crosslinkers
Oil Additives
Coating & Adhesive Resins
High Performance Polymers
Active Oxygens
Silanes
Coating Additives
Catalysts
Performance Intermediates
Methacrylates
Acrylic Products
Functional Solutions
Agrochemicals & Polymer Additives
CyPlus Technologies
2016 financials; Business Lines ranked by turnover
Nutrition & Care
Resource
Efficiency
Performance
Materials
€4,316 m €1,006 m / 23.3% €4,473 m €977 m / 21.8%
Sales
€3,145 m
Adj. EBITDA / Margin
€371 m / 11.4%
Sales Adj. EBITDA / MarginSales Adj. EBITDA / Margin
54
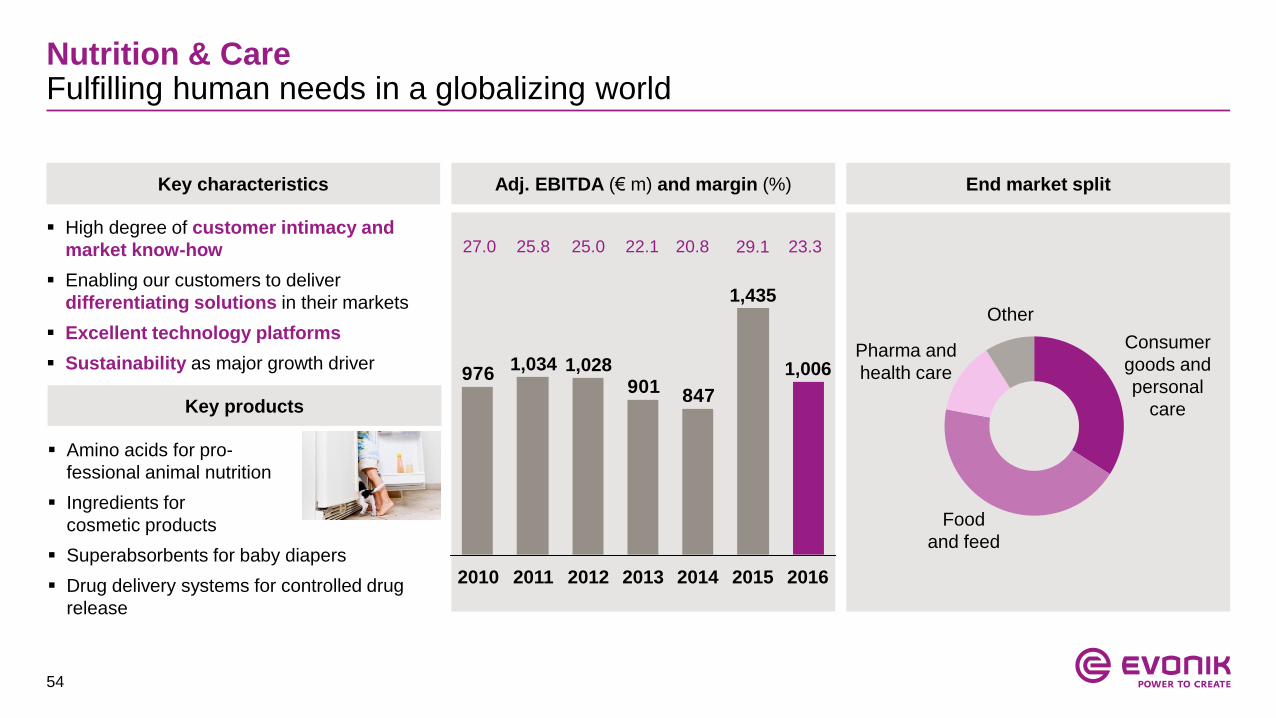
Key characteristics
Key products
Adj. EBITDA (€ m) and margin (%) End market split
847901
976 1,028
2011
1,034
2010
1,006
20162015
1,435
201420132012
27.0 25.8 25.0 22.1 20.8 29.1
Consumer
goods and
personal
care
Food
and feed
Other
Pharma and
health care
Nutrition & CareFulfilling human needs in a globalizing world
High degree of customer intimacy and
market know-how
Enabling our customers to deliver
differentiating solutions in their markets
Excellent technology platforms
Sustainability as major growth driver
Amino acids for pro-
fessional animal nutrition
Ingredients for
cosmetic products
Superabsorbents for baby diapers
Drug delivery systems for controlled drug
release
23.3

55
Animal Nutrition Baby Care Personal Care Household Care
Methionine Lysine, Threonine,
Tryptophan
Personal Care Laundry care Home care Car care
Baby Care Female Care Adult Care
Feed additives and services for animal nutrition
Fabric conditioners Specialty surfactants
Superabsorbents
# 3-4 in cosmetic ingredients # 1 in fabric softeners
# 2-3 in superabsorbents # 1 in Feed Amino Acids
Ashland BASF Croda
AkzoNobel BASF Solvay Stepan
BASF Nippon Shokubai
Chem China/Adisseo Novus Ajinomoto Cheil Jedang
Key
products
Main
Applications
Market
position1
Main
competitors
1. Company estimates for relevant markets based on multiple research reports
Nutrition & CareBusiness Line overview (1/2)
Actives Emulsifiers Conditioners

56
1. Company estimates for relevant markets based on multiple research reports
Nutrition & CareBusiness Line overview (2/2)
Key
products
Main
Applications
Market
position1
Main
competitors
Health Care Comfort & Insulation Interface & Performance
Pharmaceutical coatings Active pharma ingredients Pharma grade amino acids
Packaging / tapes Agrochemicals Plastic additives
Furniture / appliances Construction Automotive
Drug delivery systems for oral and parenteral dosage
Tailor-made pharmaceutical syntheses Pharma Amino Acids
Foam stabilizers Catalysts Release agents
# 1-2 in release coatings # 1 in polyurethane foam additives # 1 Functional Polymers for Controlled Release
# 3 Exclusive Synthesis # 3 Pharma Amino Acids
Clariant Dow Corning Momentive Wacker
Maysta Momentive
BASF DSM Lonza Ajinomoto
Release coatings Super spreading additives

57
Amino acids significantly increase efficiency and improve our customer‘s P&L
Business Line Animal Nutrition
Significant increase in efficiency
Feed costs to produce poultry meat
Low protein diets with full range of Evonik
amino acids
Balanced amino acid and nutrient profiles via
Evonik’s Animal Nutrition service offering
1 2
1
2
-28%-23%
With amino acid
suppl. and
technical services
With amino
acid suppl.
Without amino
acid suppl.
1 2
Significant savings potential
58
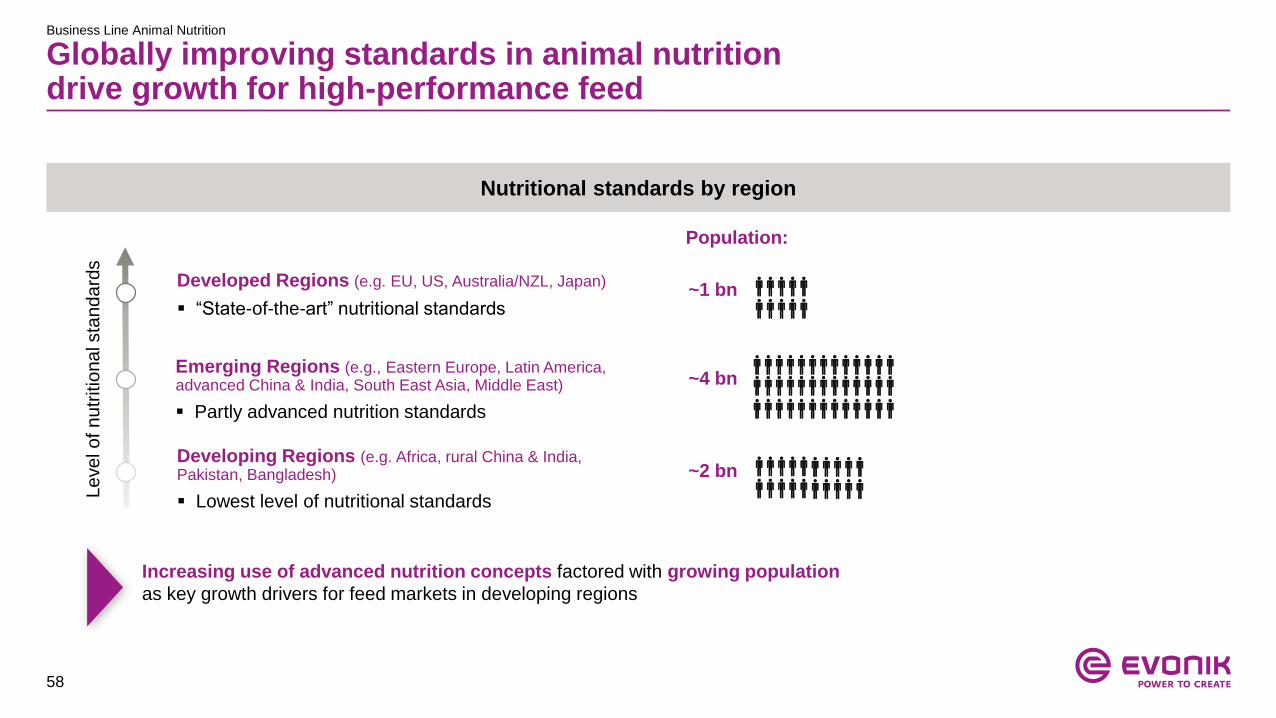
Globally improving standards in animal nutrition drive growth for high-performance feed
Business Line Animal Nutrition
Increasing use of advanced nutrition concepts factored with growing population
as key growth drivers for feed markets in developing regions
Developed Regions (e.g. EU, US, Australia/NZL, Japan)
“State-of-the-art” nutritional standards
Emerging Regions (e.g., Eastern Europe, Latin America, advanced China & India, South East Asia, Middle East)
Partly advanced nutrition standards
Developing Regions (e.g. Africa, rural China & India, Pakistan, Bangladesh)
Lowest level of nutritional standards
Le
ve
l o
f n
utr
itio
na
l sta
nd
ard
s
Population:
~1 bn
~4 bn
~2 bn
Nutritional standards by region
59
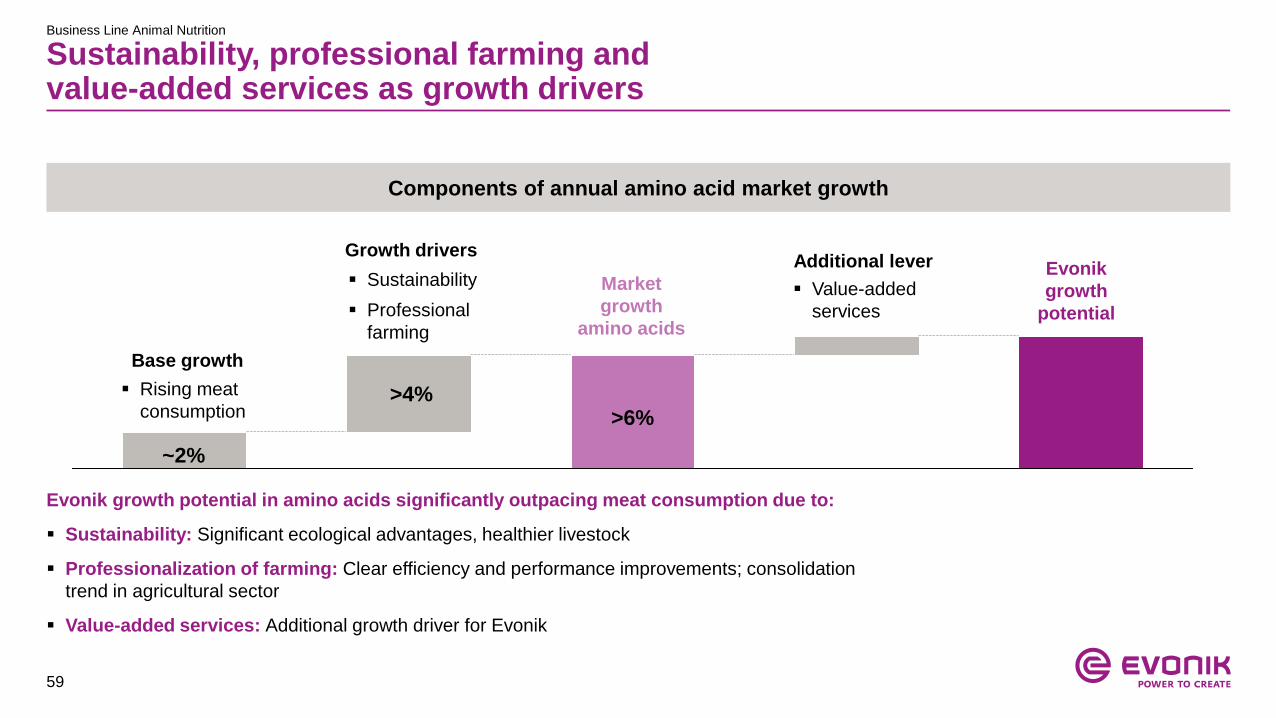
Sustainability, professional farming and value-added services as growth drivers
Business Line Animal Nutrition
Rising meat
consumption
Sustainability
Professional
farming
Market
growth
amino acids
Value-added
services
Evonik
growth
potential
Base growth
Growth drivers
>4%
~2%
Additional lever
Evonik growth potential in amino acids significantly outpacing meat consumption due to:
Sustainability: Significant ecological advantages, healthier livestock
Professionalization of farming: Clear efficiency and performance improvements; consolidation
trend in agricultural sector
Value-added services: Additional growth driver for Evonik
>6%
Components of annual amino acid market growth
60
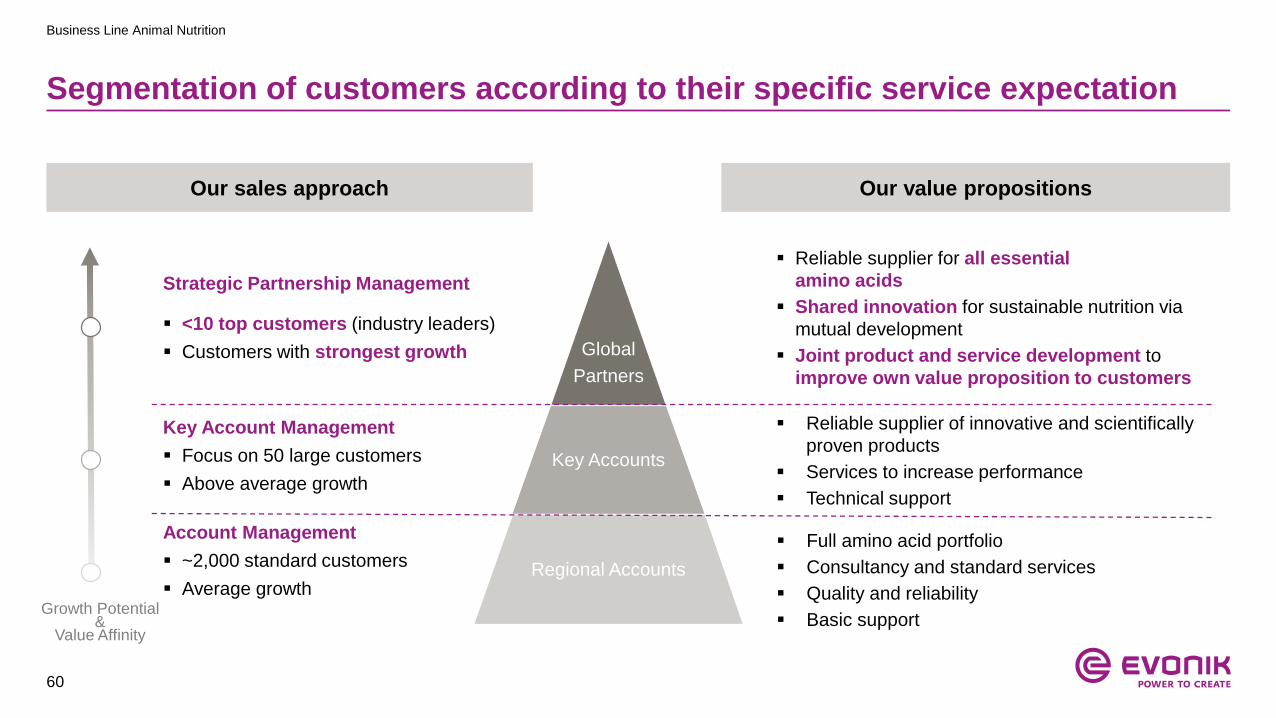
Segmentation of customers according to their specific service expectation
Business Line Animal Nutrition
Our sales approach Our value propositions
Global
Partners
Key Accounts
Regional Accounts
Strategic Partnership Management
<10 top customers (industry leaders)
Customers with strongest growth
Reliable supplier for all essential
amino acids
Shared innovation for sustainable nutrition via
mutual development
Joint product and service development to
improve own value proposition to customers
Reliable supplier of innovative and scientifically
proven products
Services to increase performance
Technical support
Growth Potential &
Value Affinity
Key Account Management
Focus on 50 large customers
Above average growth
Account Management
~2,000 standard customers
Average growth
Full amino acid portfolio
Consultancy and standard services
Quality and reliability
Basic support

61
Excellence in technology as key strength
Business Line Animal Nutrition
“The Right to Play”: 60 years of experience and process know-
how
“Setting standards”: Continuous innovation leadership for
cutting-edge safety technology
“Best in Class”: Continuously optimized manufacturing and
technology position
Fully backward integrated production complexes
Economies of scale with world-scale plants to meet market
growth timely
Raw
materialsintermediates Product
Propene
Methanol
Sulfur
Methane
Ammonia
Acrolein
Hydrocyanic acid
MMP
MetAMINO®
Methyl mercaptane
Evonik production set up
Advantages of Evonik Setup of Methionine complex
• Latest innovations implemented in Singapore plant:
Further minimization of toxic intermediates
Realization of economy of scale (150 kt)
New highly efficient energy integration concept

62
Strategic perspective:Expand portfolio to broaden our participation in the food value chain
Business Line Animal Nutrition
Evonik
todayAmino Acids + Services Impact
Customer Access / Application
Inno-
vation
pipelineImpact
• Ingredients to promote gut health
• Aquaculture-Products:
Omega-3 Fatty acids, AQUAVI® Met-Met, etc.
• New specialties for various species
Customer Access / Application
Driving
needs
Animal Health
and Welfare
Healthy
Nutrition
Premix/
Feed Mills
Feed
AdditivesAnimal Farmer
(Livestock production)Meat Retail Food Consumer
Raw
Materials
Performance,
Emission Food Safety & QualityEconomic and sustainable
nutrients (Quality, Reliability)
Apply our technology platforms to broaden portfolio in the field of sustainable nutrition
Utilizing our
technology
platforms to grow
the amino acid
core and expand
beyond

63
Consolidated markets with strong and robust growth
Business Line Baby Care
Main suppliers & customers Market characteristics
4 leading customers
own 60% global
market share
Evonik
BASF
Nippon
Shokubai
Others
Evonik is one
of three big
SAP producers
“Solid market growth of 5% p.a.,
driven by growing demand for
disposable diapers and other
hygiene products
with focus in emerging regions
(growing wealth)
with low demand volatility
Evonik one of three big superabsorbents producers and
strategic partner of big diaper manufacturers
As innovation leader Evonik is capable of bringing next-
generation superabsorbents to the market
64
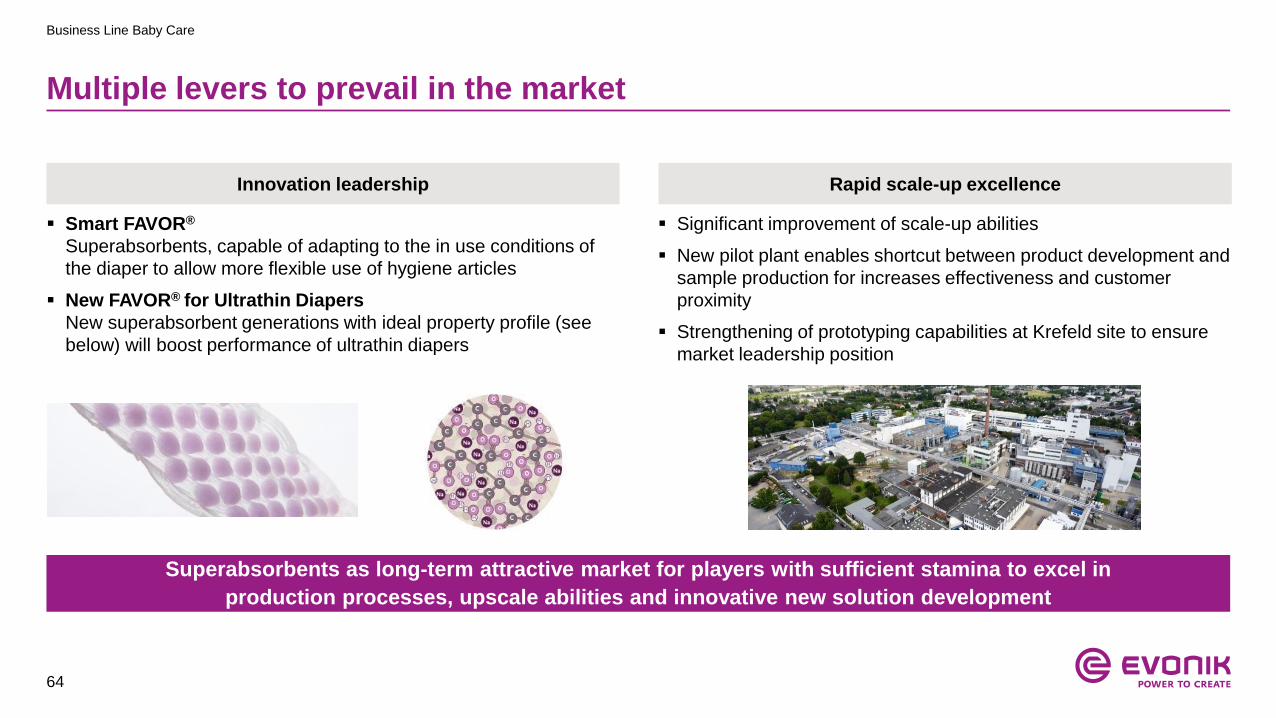
Multiple levers to prevail in the market
Significant improvement of scale-up abilities
New pilot plant enables shortcut between product development and
sample production for increases effectiveness and customer
proximity
Strengthening of prototyping capabilities at Krefeld site to ensure
market leadership position
Smart FAVOR®
Superabsorbents, capable of adapting to the in use conditions of
the diaper to allow more flexible use of hygiene articles
New FAVOR® for Ultrathin Diapers
New superabsorbent generations with ideal property profile (see
below) will boost performance of ultrathin diapers
Superabsorbents as long-term attractive market for players with sufficient stamina to excel in
production processes, upscale abilities and innovative new solution development
Business Line Baby Care
Innovation leadership Rapid scale-up excellence
65
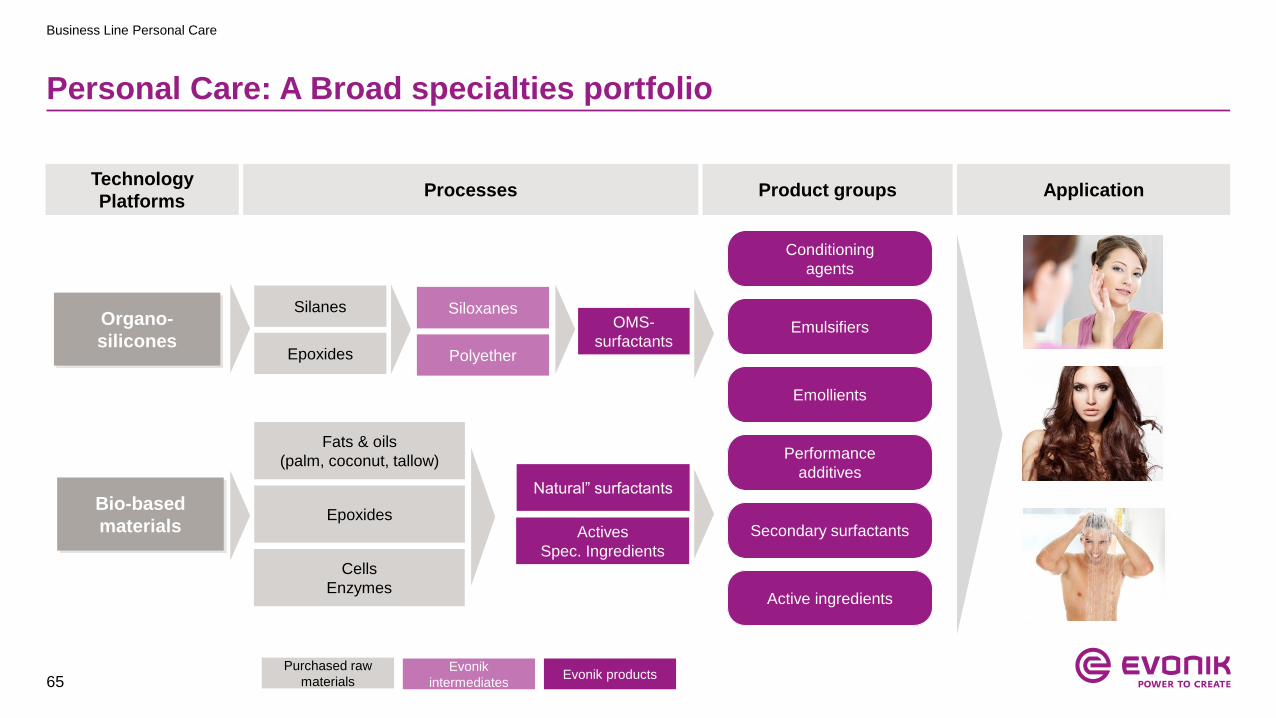
Personal Care: A Broad specialties portfolio
Business Line Personal Care
Technology
Platforms Processes Product groups Application
Active ingredients
Conditioning
agents
Emulsifiers
Emollients
Performance
additives
Secondary surfactants
Silanes
Epoxides
Siloxanes
Polyether
OMS-
surfactants
Organo-
silicones
Bio-based
materials
Fats & oils
(palm, coconut, tallow)
Epoxides
Cells
Enzymes
Natural” surfactants
Actives
Spec. Ingredients
Purchased raw
materialsEvonik
intermediatesEvonik products

66
Prime partner for Polyurethane (PU) foam additives
Business Line Comfort & Insulation
Global strategic partner of key customers with production in all major regions
Differentiation by quality, product development, application technology and superior logistics
RIGID FOAMFLEXIBLE FOAM
Construction
Appliance
Furniture &
Bedding
Automotive
Seating
Others
Business Model
PU foam end markets Customers (exemplary) Competitive landscape
Polyols

67
Polyurethane is a versatile materialWe create performance advantages in a wide range of markets
Business Line Comfort & Insulation
Appliances Construction Home Automotive
Excellent thermal
insulation & energy
efficiency
Smooth surface
creation & design
freedom
Extremely fine and
homogeneous cell
structure
Excellent flowabilities
Outstanding nucleation
performances
Surface voids reduction
High potencies &
insulation values
Advanced fire properties
Ultra-low VOC for
consumer safety
Noise and vibration
reduction for enhanced
passenger comfort
Special EVONIK A III
solvent technology
Extremly broad
processing latitude
Consumer safety
(phthalate free solutions)
Good cell regulation
properties
High flexibility in
production
68
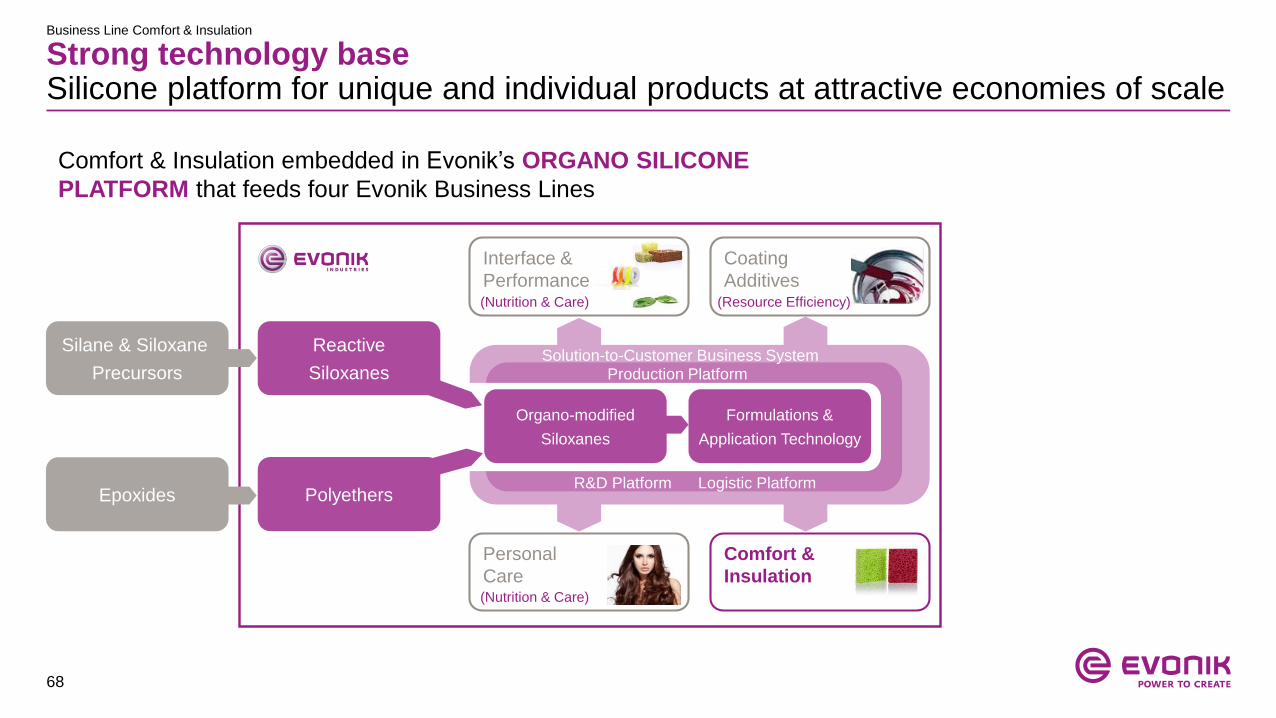
Strong technology baseSilicone platform for unique and individual products at attractive economies of scale
Business Line Comfort & Insulation
Interface &
Performance
Personal
Care
Silane & Siloxane
Precursors
Epoxides
Reactive
Siloxanes
Polyethers
Organo-modified
Siloxanes
Formulations &
Application Technology
Comfort &
Insulation
Production Platform
R&D Platform Logistic Platform
Solution-to-Customer Business System
(Nutrition & Care)
Coating
Additives
(Nutrition & Care)
Comfort & Insulation embedded in Evonik’s ORGANO SILICONE
PLATFORM that feeds four Evonik Business Lines
(Resource Efficiency)
69
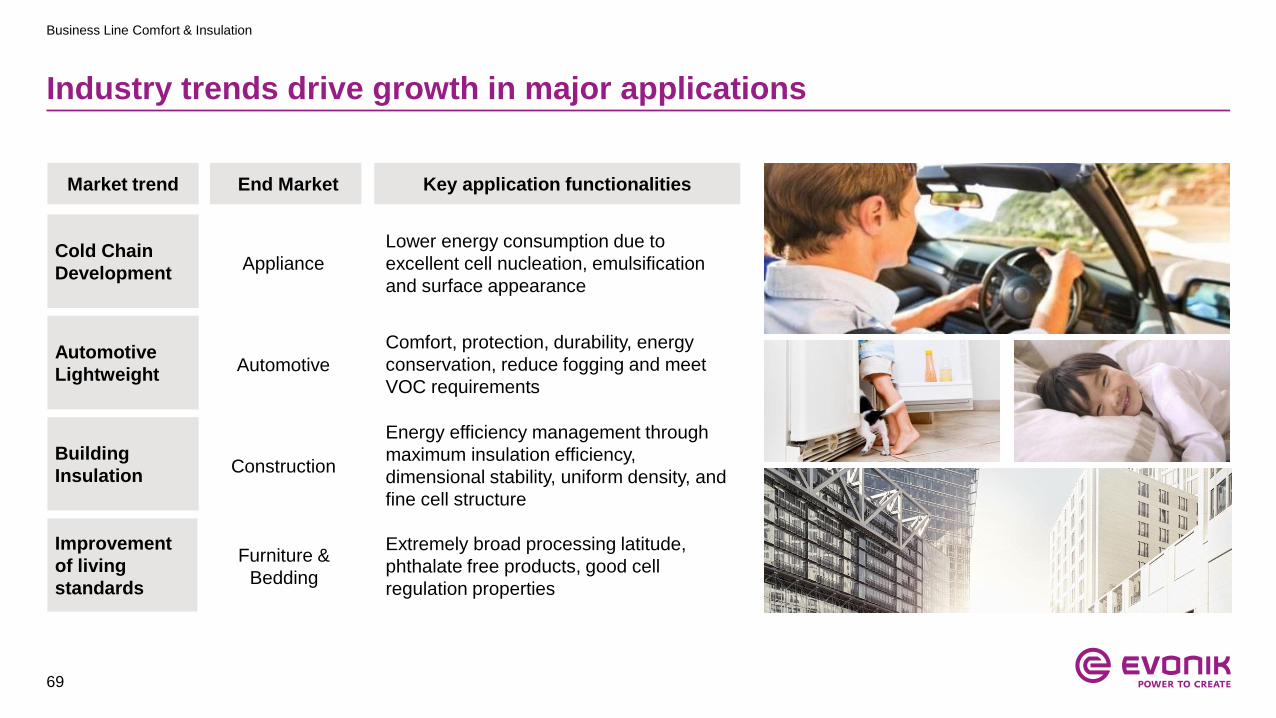
Industry trends drive growth in major applications
Business Line Comfort & Insulation
ApplianceCold Chain
Development
AutomotiveAutomotive
Lightweight
Building
InsulationConstruction
Lower energy consumption due to
excellent cell nucleation, emulsification
and surface appearance
Comfort, protection, durability, energy
conservation, reduce fogging and meet
VOC requirements
Energy efficiency management through
maximum insulation efficiency,
dimensional stability, uniform density, and
fine cell structure
Improvement
of living
standards
Furniture &
Bedding
Extremely broad processing latitude,
phthalate free products, good cell
regulation properties
End MarketMarket trend Key application functionalities
70
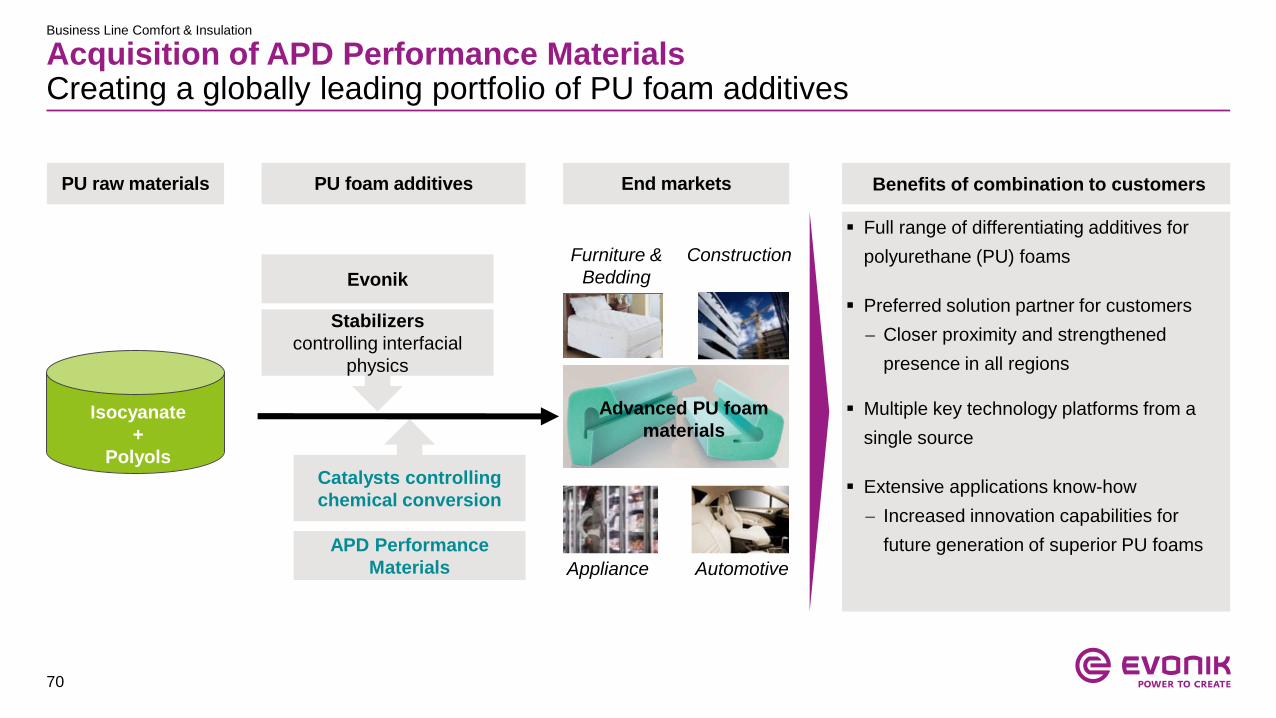
Acquisition of APD Performance MaterialsCreating a globally leading portfolio of PU foam additives
Business Line Comfort & Insulation
Full range of differentiating additives for
polyurethane (PU) foams
Preferred solution partner for customers
Closer proximity and strengthened
presence in all regions
Multiple key technology platforms from a
single source
Extensive applications know-how
Increased innovation capabilities for
future generation of superior PU foams
Benefits of combination to customers
Appliance
Furniture &
Bedding
Automotive
Construction
Advanced PU foam
materialsIsocyanate
+
Polyols
PU foam additivesPU raw materials End markets
Stabilizers
controlling interfacial
physics
Catalysts controlling
chemical conversion
APD Performance
Materials
Evonik
71
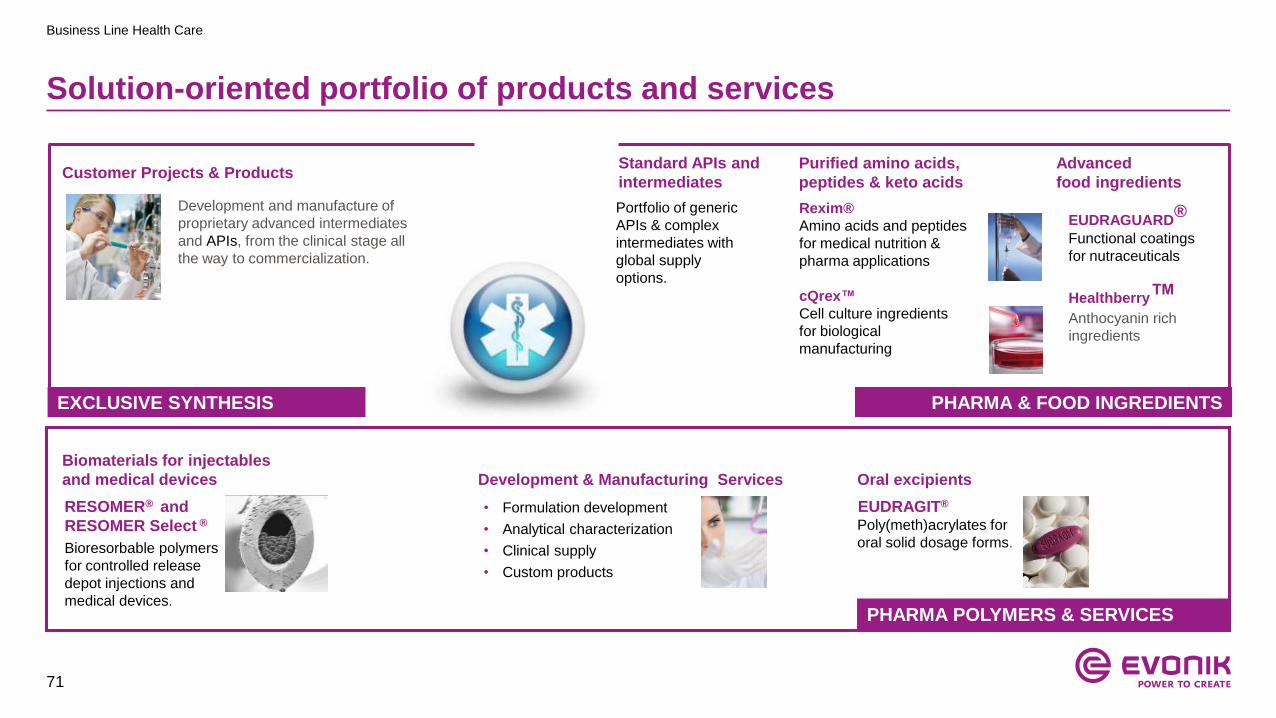
Solution-oriented portfolio of products and services
Business Line Health Care
Oral excipients
EUDRAGIT®
Poly(meth)acrylates for
oral solid dosage forms.
• Formulation development
• Analytical characterization
• Clinical supply
• Custom products
RESOMER® and
RESOMER Select ®
Bioresorbable polymers
for controlled release
depot injections and
medical devices.
Customer Projects & Products
Development and manufacture of
proprietary advanced intermediates
and APIs, from the clinical stage all
the way to commercialization.
Development & Manufacturing Services
PHARMA & FOOD INGREDIENTSEXCLUSIVE SYNTHESIS
PHARMA POLYMERS & SERVICES
Purified amino acids,
peptides & keto acids
Advanced
food ingredients
EUDRAGUARD®
Functional coatings
for nutraceuticals
Healthberry™Anthocyanin rich
ingredients
Rexim®
Amino acids and peptides
for medical nutrition &
pharma applications
cQrex™
Cell culture ingredients
for biological
manufacturing
Biomaterials for injectables
and medical devices
Standard APIs and
intermediates
Portfolio of generic
APIs & complex
intermediates with
global supply
options.

72
Strategic roadmap towards pharma-value driven businesses
Business Line Health Care
1. Market for development & manufacturing services of complex parenteral formulations
Growth field:
Healthcare
Solutions
Development of a broad drug delivery platform
Excellent strategic fit for drug delivery business
Powerhouse for complex injectable dosage forms
Doubling Evonik’s access to relevant markets
Global market1 size: USD1.2 bn, CAGR ~8%
2010 Evonik only covered one drug delivery platform
Acquisition of RESOMER® – bioresorbable polymers
Acquisition of SurModics –
services and advanced drug delivery
Tranferra Nanosciences –
new injectable liposome technology
Delivering active ingredients to the virus-infected cell
membrane (targeted drug delivery)
1
2
3
4
Ph
arm
a-v
alu
e in
bu
sin
es
s m
od
el
One drugdelivery platform
Multiple drugdelivery platforms
Low
High
21
RESOMER®
2010
Pharma liability
Risk of commoditization/ low value capture
2
4
2011
2011
3
2016

73
977
896836818822826
685
2014 20152013 201620122010 2011
Resource EfficiencyInnovative products for resource-efficient solutions
Key characteristics
Key products
Adj. EBITDA (€ m) and margin (%) End market split
Other
Focus on performance-impacting and
value-driving components
Minor share of cost in most end products
Strong focus on technical service
Low risk of substitution
High pricing power (value-based pricing)
Precipitated and fumed
silica as flow property
enhancers
Crosslinkers for composite
materials and coatings
Viscosity modifiers for oils and hydraulic
fluids
18.4 19.9 21.4 21.3 20.7 20.9
Automotive,
transportation
and machinery
Construction
Coatings,
paintings
and printing
21.8
Plastics
and rubber

74
1. Company estimates for relevant markets based on multiple research reports
Resource EfficiencyBusiness Line overview (1/3)
Key
products
Main
Applications
Market
position1
Main
competitors
Silica Oil Additives Crosslinkers
Precipitated silica Fumed silica Special oxides
Composites Coatings & inks Construction / Flooring Automotive interior
Automotive lubes Industrial lubes Hydraulic systems
Silicone rubber Tires, green tires & rubber Paints & coatings Adhesives & sealants
Lubricant additives (viscosity modifiers)
# 1 in isophorone chemicals # 1 in viscosity modifiers for lubricants # 1 in silicas (precipitated, fumed, special oxides, matting agents and specialty fillers)
Arkema BASF Covestro
Infineum Lubrizol Afton Oronite
Cabot JM Huber Solvay Wacker
Crosslinkers for composites, elastomers and coatings
75
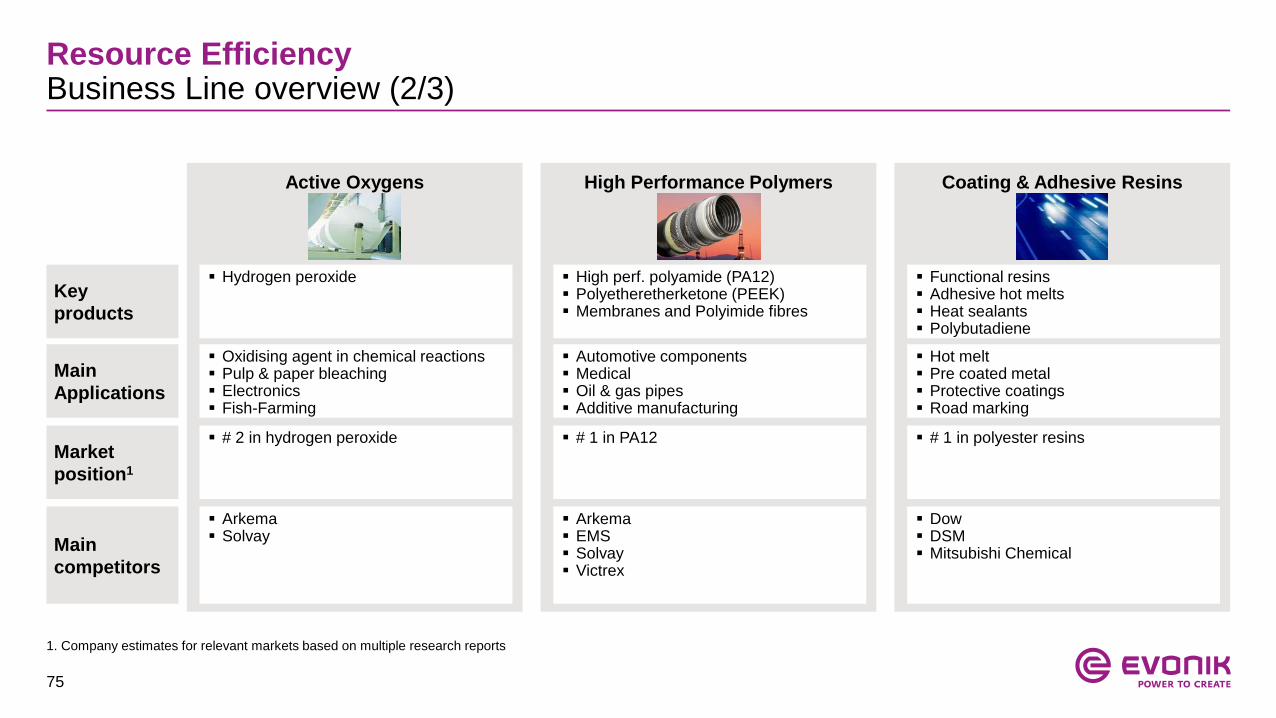
1. Company estimates for relevant markets based on multiple research reports
Resource EfficiencyBusiness Line overview (2/3)
Key
products
Main
Applications
Market
position1
Main
competitors
Active Oxygens High Performance Polymers Coating & Adhesive Resins
Hydrogen peroxide
Hot melt Pre coated metal Protective coatings Road marking
Automotive components Medical Oil & gas pipes Additive manufacturing
Oxidising agent in chemical reactions Pulp & paper bleaching Electronics Fish-Farming
High perf. polyamide (PA12) Polyetheretherketone (PEEK) Membranes and Polyimide fibres
# 1 in polyester resins # 1 in PA12 # 2 in hydrogen peroxide
Dow DSM Mitsubishi Chemical
Arkema EMS Solvay Victrex
Arkema Solvay
Functional resins Adhesive hot melts Heat sealants Polybutadiene

76
1. Company estimates for relevant markets based on multiple research reports
Resource EfficiencyBusiness Line overview (3/3)
Key
products
Main
Applications
Market
position1
Main
competitors
Silanes Coating Additives Catalysts
Chlorosilanes
Organofunctional silanes
Rubber silanes
Catalysts for chemical processes
Enabler for process efficiency / innovation
Eco-friendly coatings (low VOC, water based)
High solid industrial coatings
Fumed silica Optical fibres Adhesive & sealants Building protection
Additives for eco-friendly and high solid industrial coatings
#1 in precious metal powder catalysts
#2 in activated base metal catalysts
# 2 in high performance additives for coatings and inks
# 1-2 in silicone resins for special applications
# 1 in chlorosilanes
# 1 in organofunctional and rubber silanes
BASF
Clariant
Johnson Matthey
WR Grace
Altana
BASF
Dow Chemical (Dow Corning)
Dow Chemical (Dow Corning)
Momentive
Shin Etsu
Tokuyama
Activated base metal catalysts
Precious metal catalysts
Catalysts for industrial & petrochemicals
77
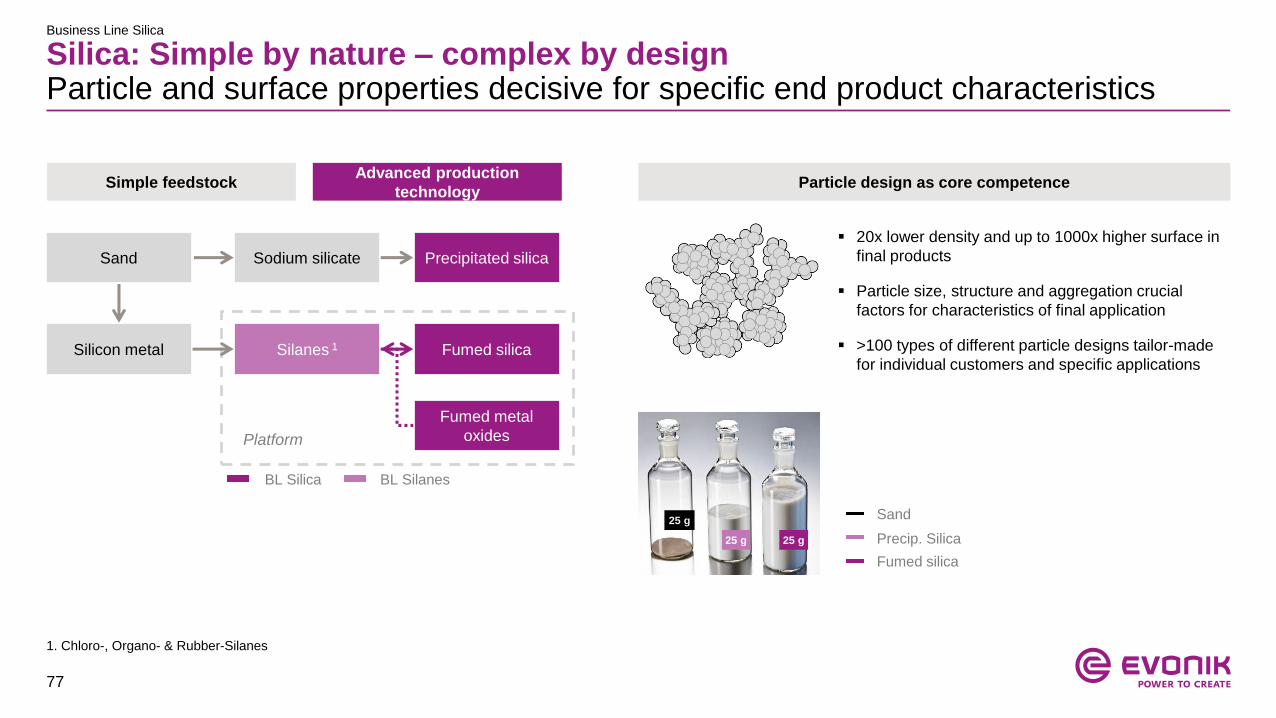
Silica: Simple by nature – complex by designParticle and surface properties decisive for specific end product characteristics
Business Line Silica
BL Silica BL Silanes
Sodium silicate Precipitated silica
Silanes 1 Fumed silica
Fumed metal
oxides
Silicon metal
Sand
Platform
Simple feedstockAdvanced production
technologyParticle design as core competence
20x lower density and up to 1000x higher surface in
final products
Particle size, structure and aggregation crucial
factors for characteristics of final application
>100 types of different particle designs tailor-made
for individual customers and specific applications
25 g25 g
25 g Sand
Precip. Silica
Fumed silica
1. Chloro-, Organo- & Rubber-Silanes

78
Key success factorsTailor-made solutions based on deep understanding of customers’ needs
Business Line Silica
Precipitated silica and fumed metal
oxides
Broad variety of specialties
Options to customize
Future winner concept and industry
teams
Strong brands
(Technical) service orientation
Production platforms in all major
regions
High quality standards
Global coordination and cross-
regional support
Unbiased advising
Cross-selling potential
Innovation leader
Long-term relationships with key
customers
Communication and support on
par level
Preferred partner for global
businesses
Supply security
Customer proximity
= = =
Broad product &
industry portfolio
Strong
customer intimacy
Global
production network

79
Extending Smart Materials growth engine Expansion of fumed Silica capacities in Antwerp
Evonik is extending its capacities for fumed silica in Antwerp
Double digit million € investment volume
Highly specialized chemistry with GDP+ growth in various
end-markets
Typical applications of these specialty silica, which Evonik
markets under the name AEROSIL®, include
coatings and paints
modern adhesive systems
transparent silicones
non-flammable high-performance insulation materials
Investment ensures Evonik’s position as leading global
manufacturer of silica
Business Line Silica
80
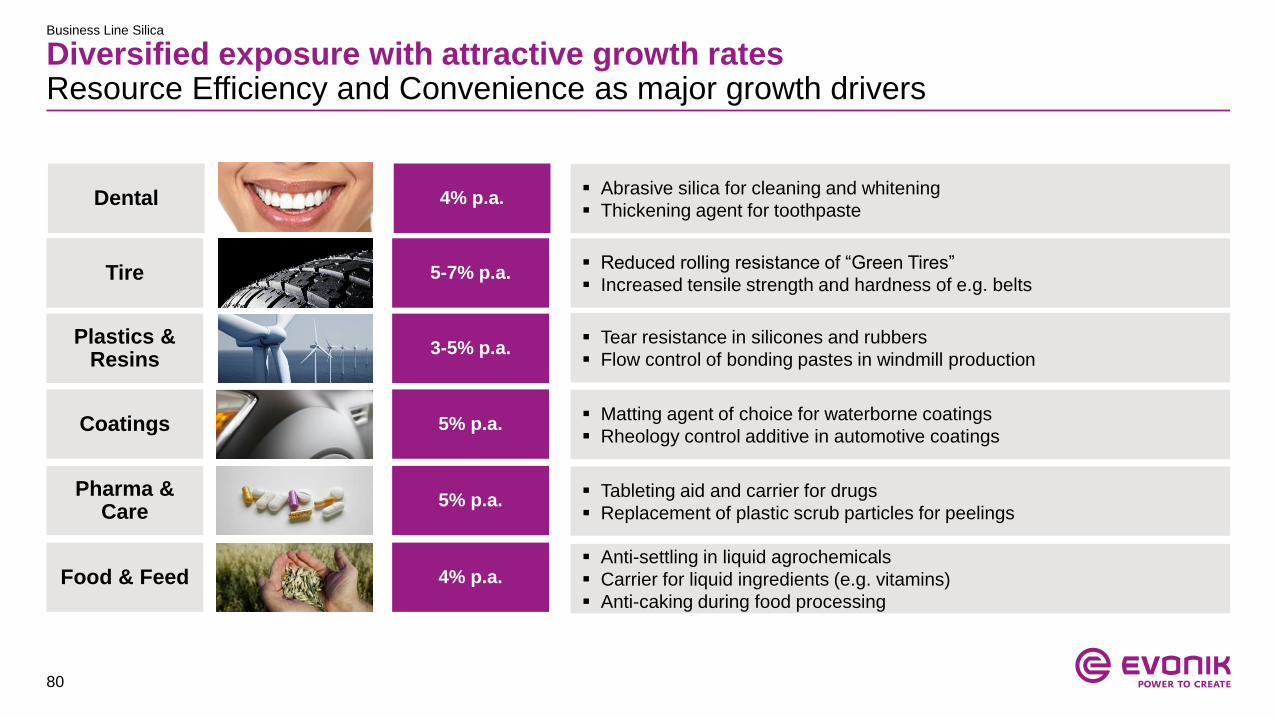
Diversified exposure with attractive growth ratesResource Efficiency and Convenience as major growth drivers
Business Line Silica
Coatings Matting agent of choice for waterborne coatings
Rheology control additive in automotive coatings
Reduced rolling resistance of “Green Tires”
Increased tensile strength and hardness of e.g. beltsTire
Tear resistance in silicones and rubbers
Flow control of bonding pastes in windmill production
Plastics & Resins
Pharma & Care
Tableting aid and carrier for drugs
Replacement of plastic scrub particles for peelings
Food & Feed Anti-settling in liquid agrochemicals
Carrier for liquid ingredients (e.g. vitamins)
Anti-caking during food processing
Dental Abrasive silica for cleaning and whitening
Thickening agent for toothpaste
5% p.a.
5-7% p.a.
3-5% p.a.
5% p.a.
4% p.a.
4% p.a.
81
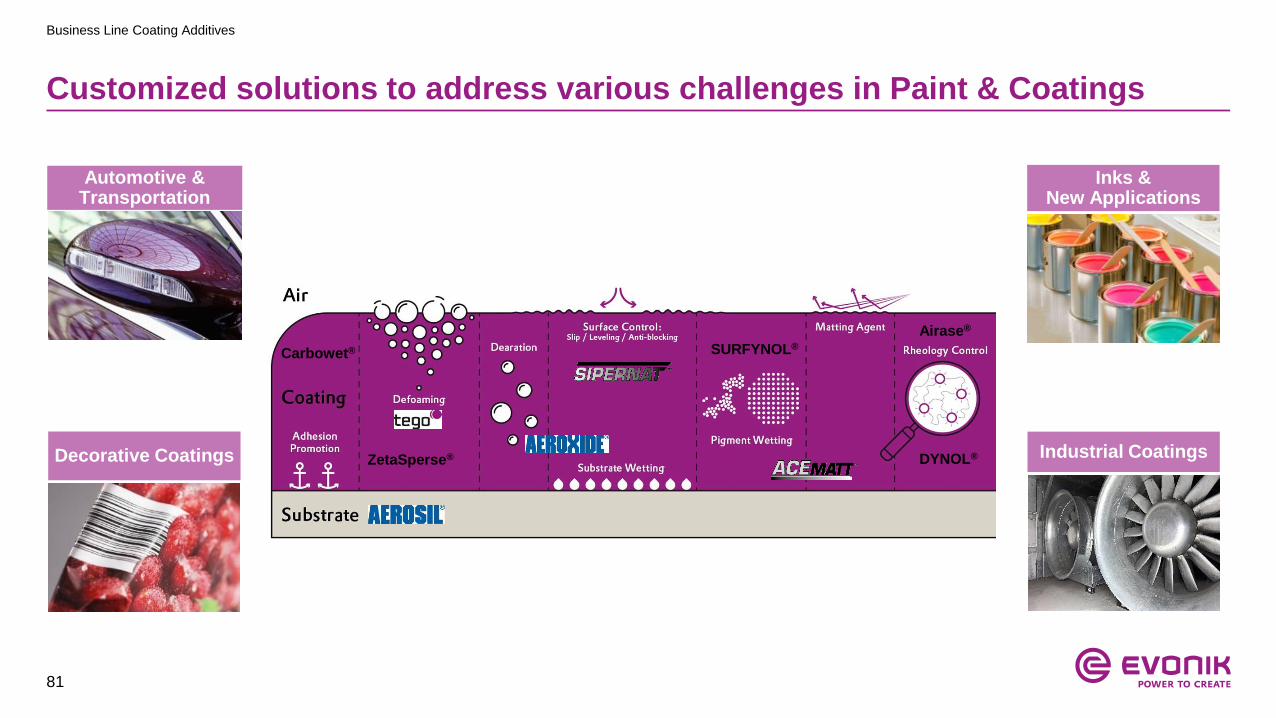
Customized solutions to address various challenges in Paint & Coatings
Business Line Coating Additives
Dispersing
Additives
Silicone-Hybrid
Hydrophobing
Agents
Automotive & Transportation
Decorative Coatings
Inks & New Applications
Industrial Coatings
SURFYNOL®
DYNOL®ZetaSperse®
Carbowet®
Airase®

82
Key value drivers
Global leader for formulations enabling environmentally-friendly /
waterborne coatings, and solvent-borne coatings
Access to complementary APD Performance Materials’ wetting agent
technology with
Market-leading position
Stronger focus on automotive industry
Additional customers to create cross-selling opportunities
Expanded toolkit and solutions expertise
Truly global set-up
Leveraging APD Performance Materials’ position in North American
coatings market
APD Performance Materials adds unique products to a strong portfolioand strengthens the access to new markets
Business Line Coating Additives
Ad
dit
ive
tec
hn
olo
gie
s
Defoamers
Dispersing
Agents
Wetting
Agents
Leader
in water-based
coating additives
Leader
in Wetting Agents
Coatings end-markets
Decorative
Coatings Inks
Automotive
Coatings
Industrial
Coatings
Broader
market access
The unique APD Performance Materials product line complements
Evonik’s existing coating additives portfolio
Evonik APD Performance Materials
Matting
Agents
83
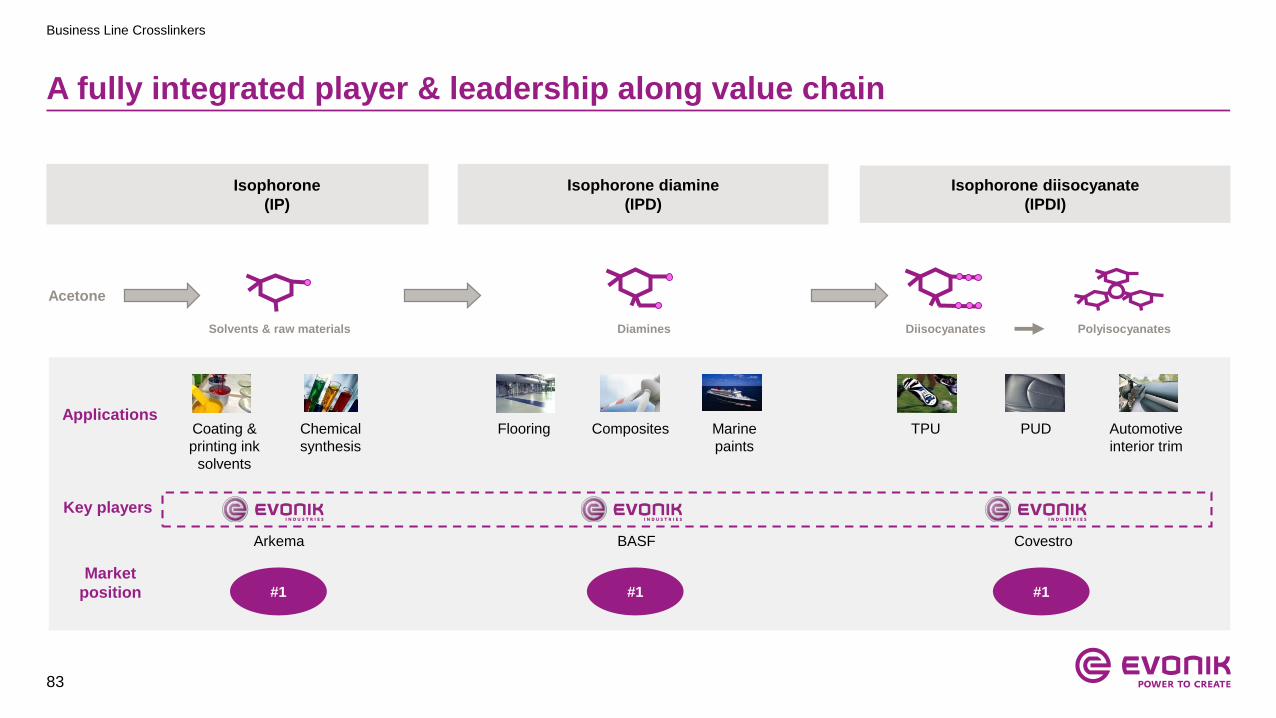
A fully integrated player & leadership along value chain
Business Line Crosslinkers
Isophorone
(IP)
Isophorone diisocyanate
(IPDI)
Solvents & raw materials Diamines Diisocyanates Polyisocyanates
Isophorone diamine
(IPD)
Acetone
Coating &
printing ink
solvents
Chemical
synthesis
Flooring Composites Marine
paints
Automotive
interior trim
PUDTPUApplications
Key players
#1 #1 #1
Arkema BASF Covestro
Market
position
84
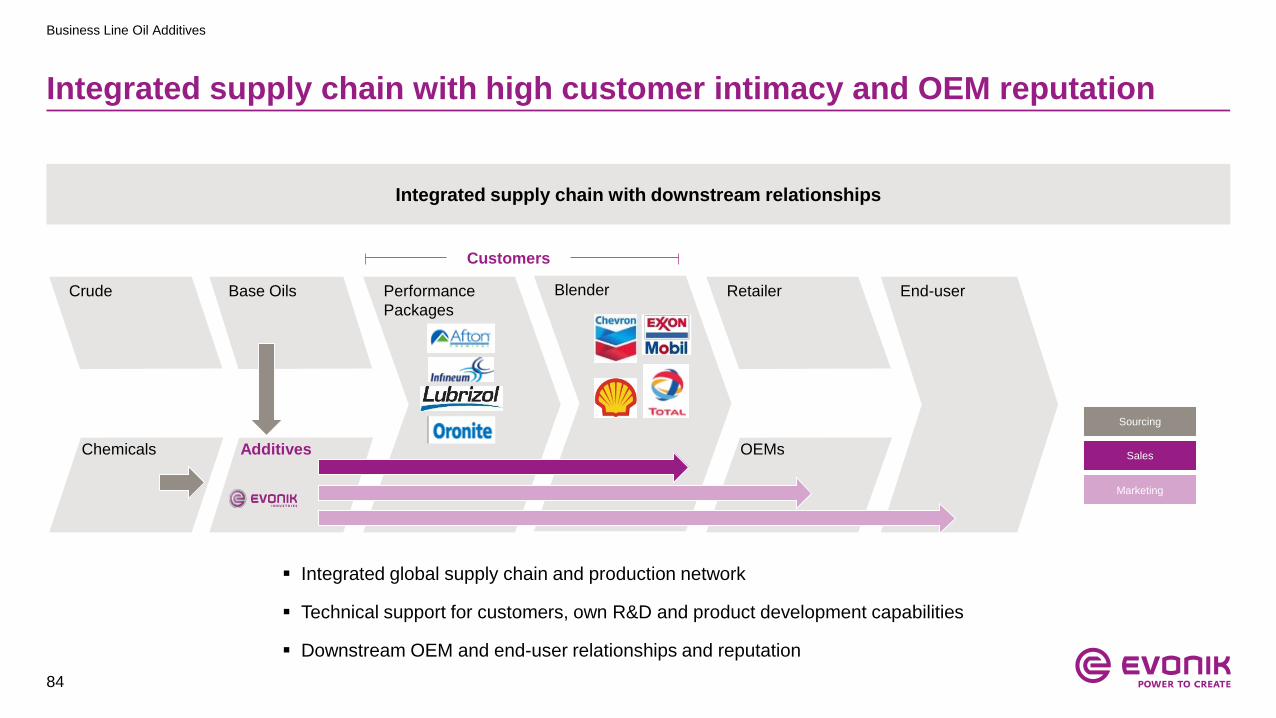
Integrated supply chain with high customer intimacy and OEM reputation
Business Line Oil Additives
Performance
Packages
End-userBlenderCrude
Chemicals
Base Oils
Additives
Retailer
OEMs
Sourcing
Marketing
Sales
Integrated global supply chain and production network
Technical support for customers, own R&D and product development capabilities
Downstream OEM and end-user relationships and reputation
Customers
Integrated supply chain with downstream relationships
85
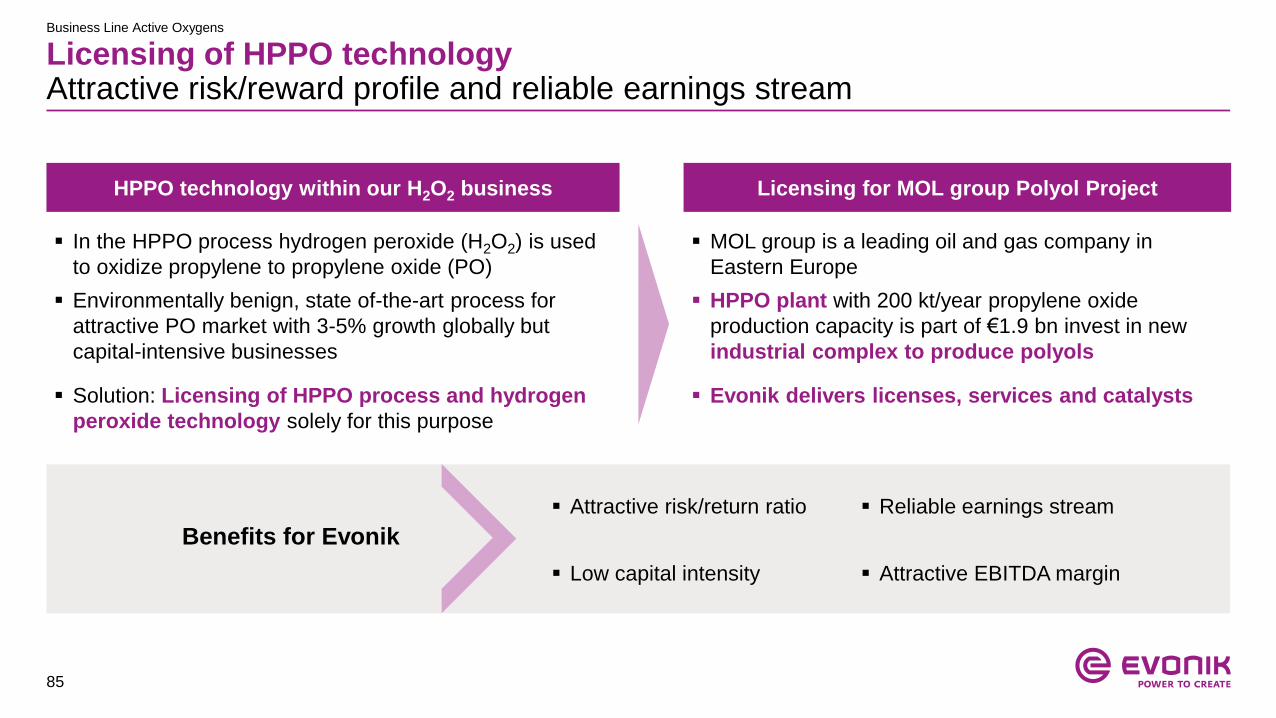
Licensing of HPPO technologyAttractive risk/reward profile and reliable earnings stream
HPPO technology within our H2O2 business Licensing for MOL group Polyol Project
In the HPPO process hydrogen peroxide (H2O2) is used
to oxidize propylene to propylene oxide (PO)
Environmentally benign, state of-the-art process for
attractive PO market with 3-5% growth globally but
capital-intensive businesses
MOL group is a leading oil and gas company in
Eastern Europe
HPPO plant with 200 kt/year propylene oxide
production capacity is part of €1.9 bn invest in new
industrial complex to produce polyols
Attractive risk/return ratio
Low capital intensity
Solution: Licensing of HPPO process and hydrogen
peroxide technology solely for this purpose
Evonik delivers licenses, services and catalysts
Benefits for Evonik
Reliable earnings stream
Attractive EBITDA margin
Business Line Active Oxygens

86
Performance Materials Integrated production platforms forefficientproductionof rubberandplastic intermediates
Key characteristics
Key products
Adj. EBITDA (€ m) and margin (%) End market split
Other
Strong integrated production platforms
Leading cost positions
Favorable raw material access
Focus on continuous efficiency
improvements
High degree of supply reliability
Acrylic sheets, molding
compounds (PMMA) and
its precursors (MMA),
e.g. for LED and touch
screens
Butadiene for synthetic rubber
MTBE as fuel additive
Automotive,
transportation
and machinery
Construction
Plastics and
rubber
371309325
404
712761
539
20112010 20162015201420132012
15.8 18.8 16.9 10.6 8.5 9.0 11.4

87
1. Company estimates for relevant markets based on multiple research reports
Performance Materials Business Line overview (1/2)
Key
products
Main
Applications
Market
position1
Main
competitors
Performance Intermediates Methacrylates Acrylic Products
Butadiene
MTBE
Butene-1
Plasticizers (INA & DINP)
Construction
Light-weight systems
Automotive components
Light-guiding systems
Coatings
PMMA extrusion
Light-weight systems
Automotive components
Plastics
Styrene-Butadiene-Rubber
High performance polymers
Methylmethacrylate (MMA) & application monomers
Molding compounds (PMMA granulate)
# 2 in PMMA sheets # 2 in MMA
# 2 in PMMA molding compounds
# 1 in Butene-1
# 2 in INA
Arkema
Mitsubishi Chemicals
Sumitomo
LG MMA
Mitsubishi Chemicals
Sumitomo
BASF
Sabic
LyondellBasell
Acrylic sheets and semi-finished products (Plexiglas®/ Acrylite®)
PMMA systems
88
1. Company estimates for relevant markets based on multiple research reports
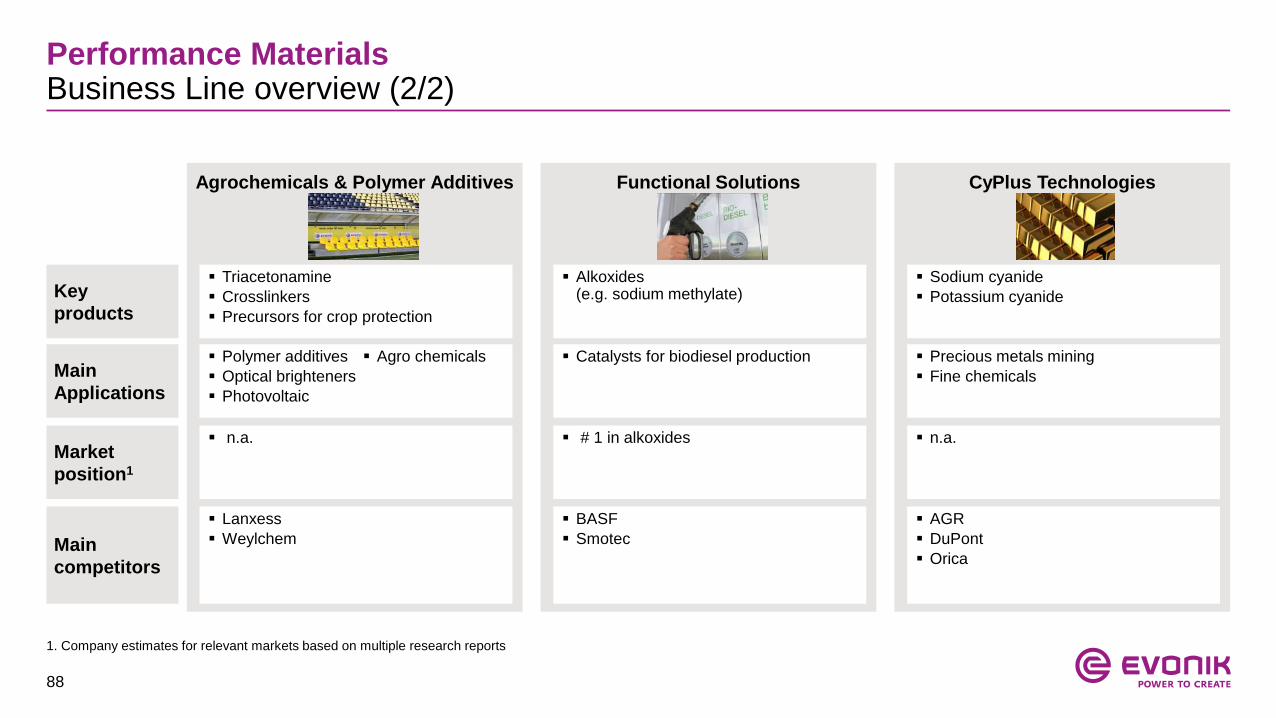
Performance Materials Business Line overview (2/2)
Key
products
Main
Applications
Market
position1
Main
competitors
Agrochemicals & Polymer Additives Functional Solutions CyPlus Technologies
Triacetonamine
Crosslinkers
Precursors for crop protection
Precious metals mining
Fine chemicals
Catalysts for biodiesel production Polymer additives
Optical brighteners
Photovoltaic
Agro chemicals
Alkoxides(e.g. sodium methylate)
n.a. # 1 in alkoxides n.a.
AGR
DuPont
Orica
BASF
Smotec
Lanxess
Weylchem
Sodium cyanide
Potassium cyanide
89
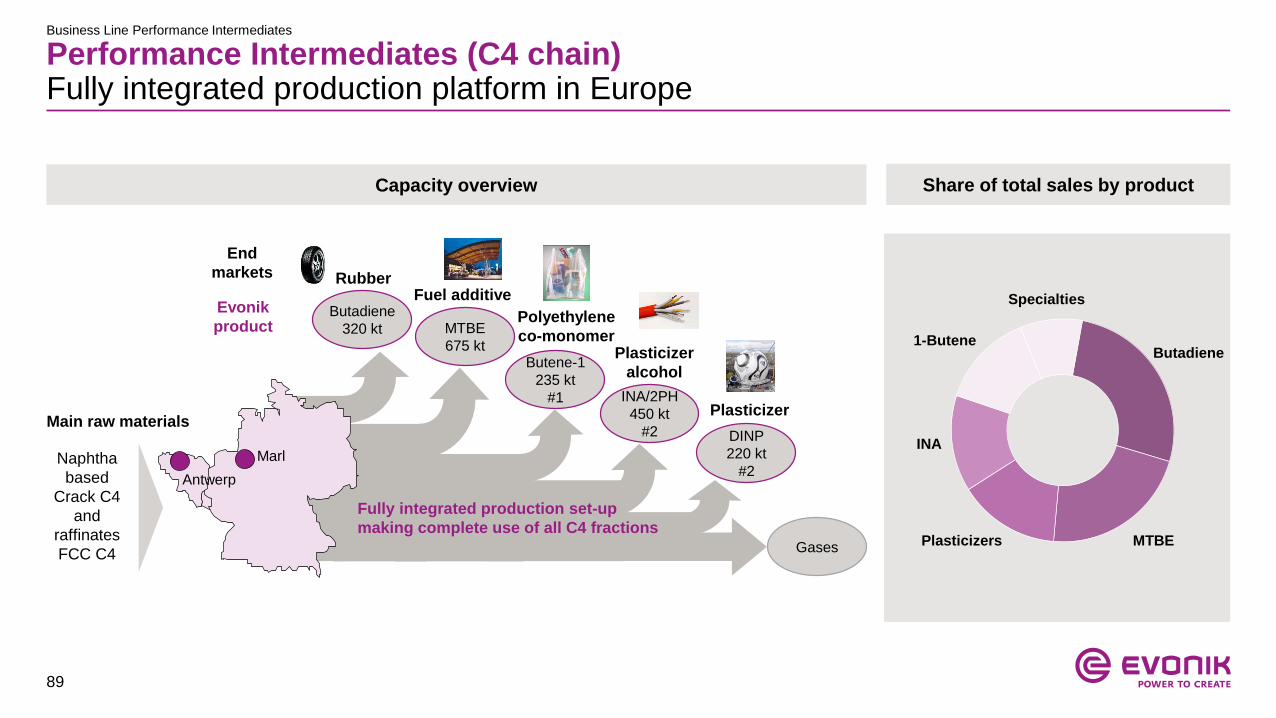
Business Line Performance Intermediates
Performance Intermediates (C4 chain)Fully integrated production platform in Europe
Butadiene
320 kt
Butene-1
235 kt
#1 INA/2PH
450 kt
#2
Gases
MTBE
675 kt
DINP
220 kt
#2Antwerp
Marl
Rubber
Plasticizer
Plasticizer
alcohol
Polyethylene
co-monomer
Fuel additive
Fully integrated production set-up
making complete use of all C4 fractions
Main raw materials
Naphtha
based
Crack C4
and
raffinates
FCC C4
End
markets
Evonik
product
Capacity overview Share of total sales by product
Butadiene
MTBE
Specialties
1-Butene
INA
Plasticizers

90
Vertical integration in Methacrylates & Acrylic Products
Business Line Methacrylates and Acrylic Products
Lightweight construction
Lighting systems
Leading process technology and innovation, e.g. Aveneer®:
new, highly efficient process technology for MMA production
Global production set-up
Competitive cost position
Clear benefits from vertical integration
Flexibility in downstream use
Monomers
(MMA)Applications
Polymers (PMMA)
~50%
xx%
External sale
Other captive use
Feedstock
MTBE-based production
• MTBE
• Methanol
Acetone-based production
• Acetone
• Hydrogen cyanide
Methacrylate platform
E.g. Coatings, Pharma
Polymers, Oil Additives
91
Table of contents
1. Evonik Industries
2. Segments
3. Financials & outlook
Financial policy and pensions
Key financials FY 2016
Outlook 2017
4. Evonik share & Investor Relations

92
Financial policyMaintaining a solid investment grade rating
BBB+Baa1stable
BBBBaa2stable
BBB-Baa3stable
BB+Ba1stable
A-A3stable Baa1 /stable
BBB+ /stable
Speculative
grade
Investment
grade
Rating affirmed at BBB+ stable on May 6, 2016 shortly after Air
Products specialty additives business acquisition announcement
Will enhance Evonik's business risk profile
Resilient combined performance expected
BBB+ (stable)
Rating upgraded to Baa1 stable from Baa2 positive on
May 10, 2016 also after PM acquisition
Specialty chemicals franchise will be improved
Further strengthening by adding scale and diversity
Baa1 (stable)
Maintaining a solid investment grade rating is a central element in our financing strategy
2010 2011 2012 2013 2014 2015 2016 2017
93
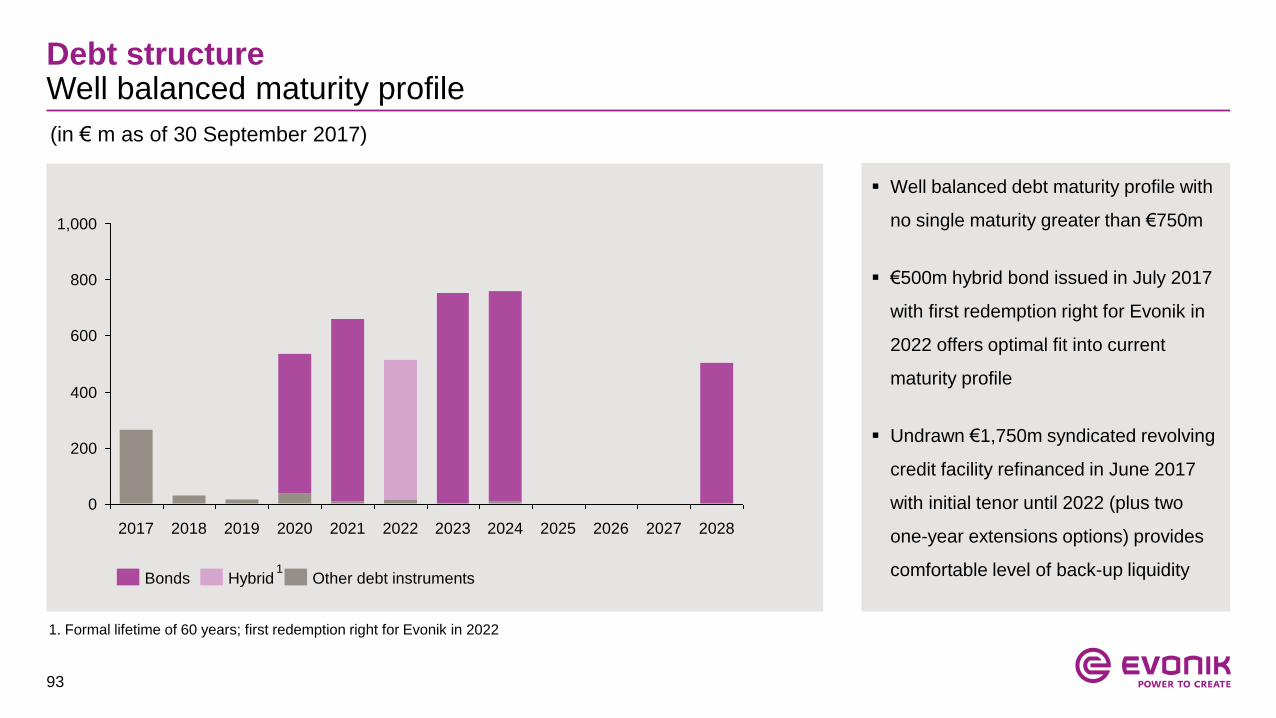
Debt structureWell balanced maturity profile
Well balanced debt maturity profile with
no single maturity greater than €750m
€500m hybrid bond issued in July 2017
with first redemption right for Evonik in
2022 offers optimal fit into current
maturity profile
Undrawn €1,750m syndicated revolving
credit facility refinanced in June 2017
with initial tenor until 2022 (plus two
one-year extensions options) provides
comfortable level of back-up liquidity
(in € m as of 30 September 2017)
1,000
800
600
400
200
0
20212020201920182017 2028202720262025202420232022
Other debt instrumentsBonds Hybrid
1. Formal lifetime of 60 years; first redemption right for Evonik in 2022
1

94
Funding level increased to >65%
Pension fund /
reinsured support
fund
Funded through
Evonik CTA
28%
28%11%
33%
Unfunded
(~ pension
provision on
balance sheet) DBO:
€11.6 bn
Funded
outside Germany
PensionsPension funding overview as of Dec 31, 2016
Pensions very long-term, patient
debt (>16 years) with no funding
obligations in Germany
DBO level in 2016 of €11.6 bn;
Increase of €1.1 bn vs. 2015
mainly driven by change in
discount rate esp. in Germany
from 2.75% to 2.00%
Funding ratio increased to >65%

95
PensionsBreakdown of P&L and cash flow effects
in € m 2015 2016 Annual report ‘16
Benefits paid -433 -428 p. 161
Benefits paid from plan assets +185 +181 p. 162
Contribution to plan assets (excl. CTA) -145 -152 p. 162
Payments under defined contribution plans -156 -166 p. 163
Total cash out for pensions (excl. CTA) -549 -565
P&L
Cashflow
From
defined
benefit
plans
in € m P&L item / KPI 2015 2016 Annual report ‘16
Current service costs Adj. EBITDA -191 -180 p. 161
Interest costs Net interest expense -281 -297 p. 161
Exp. return on plan assets Net interest expense +185 +207 p. 162 / 163
Other Adj. EBITDA -40 -44 p. 163
Total pension expense -327 -316
96
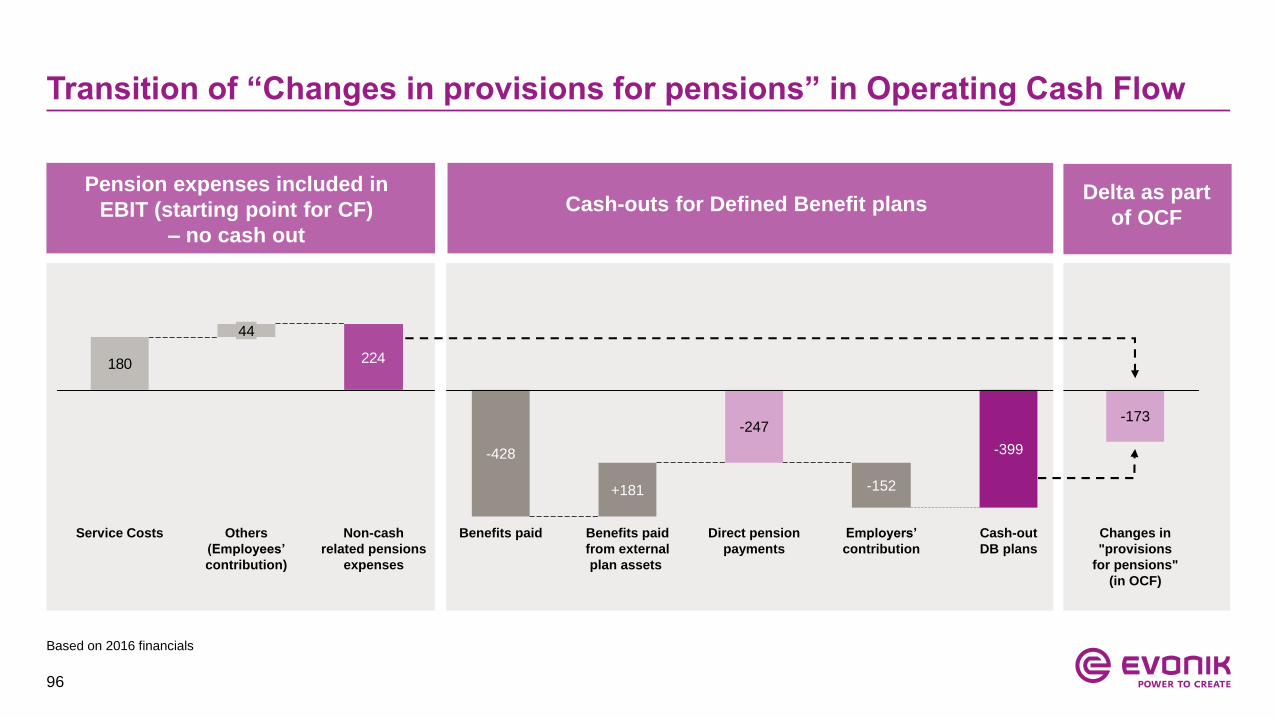
Transition of “Changes in provisions for pensions” in Operating Cash Flow
224180
Others
(Employees’
contribution)
44
Service Costs
-247
-152
Direct pension
payments
-399
Employers’
contribution
-173
Cash-out
DB plans
Changes in
"provisions
for pensions"
(in OCF)
Benefits paid
from external
plan assets
+181
-428
Benefits paidNon-cash
related pensions
expenses
Pension expenses included in
EBIT (starting point for CF)
– no cash out
Cash-outs for Defined Benefit plans Delta as part
of OCF
Based on 2016 financials

97
1. Excluding any effects from potential actuarial changes and changes in the valuation of plan assets
PensionsSensitivity to discount rate changes
Sensitivity analysis1:
Increase (decrease) in
discount rate
by 100 bp in year x
Personnel costs: no impact
Finance costs: no impact
Cash flow: no impact
Balance sheet: decrease (increase) of pension provision by -€1.7 bn (+€2.2 bn) against equity and deferred tax liabilities (assets)
Personnel costs: decrease (increase) due to lower (higher) service costs
Finance costs: increase (decrease) due to higher (lower) pension interest
Cash flow: no impact
Balance sheet: no impact
Impact in year x Impact in year x+1
98
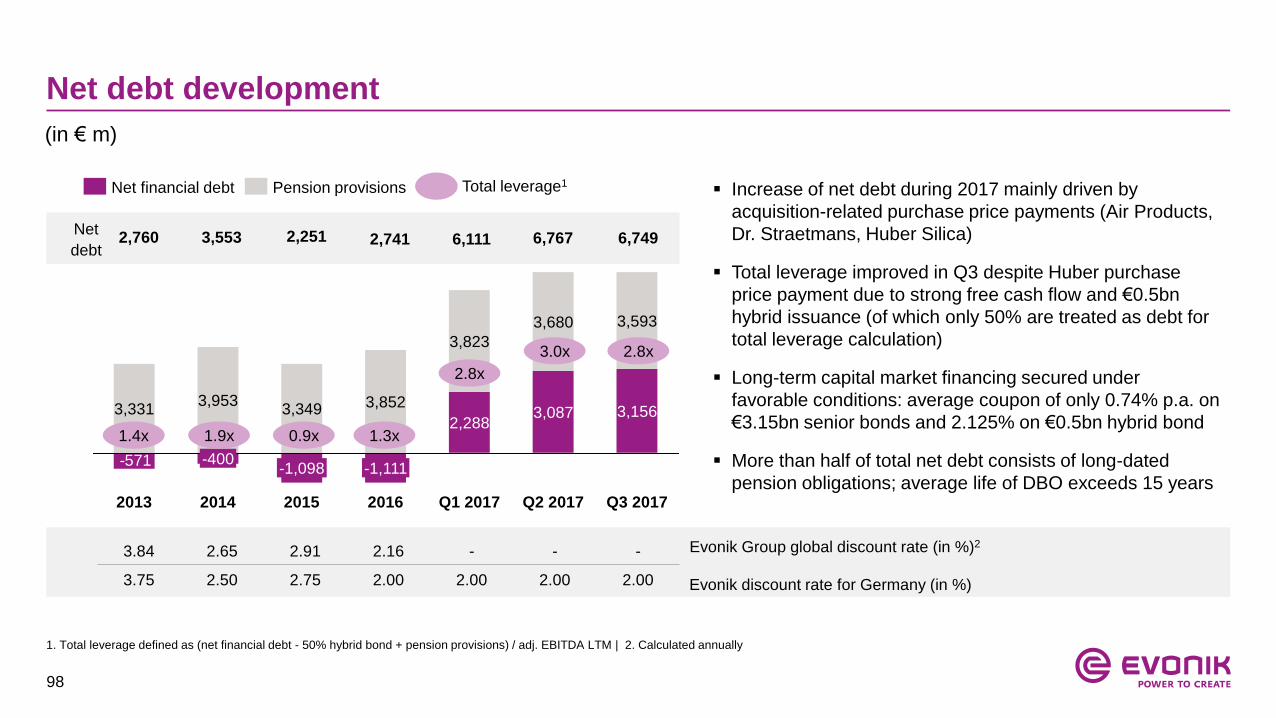
Net debt development
-571
Q3 2017Q2 2017
3,087
3,680
Q1 2017
2,288
3,823
2016
3,852
-1,111
2015
3,349
-1,098
2014
3,953
-400
2013
3,331 3,156
3,593
Pension provisionsNet financial debt Total leverage1
Evonik Group global discount rate (in %)2
Evonik discount rate for Germany (in %)
3.84 2.65 2.91 2.16 - - -
3.75 2.50 2.75 2.00 2.00 2.00 2.00
1.9x1.4x 0.9x
Net
debt2,760 3,553 2,251 2,741
Increase of net debt during 2017 mainly driven by
acquisition-related purchase price payments (Air Products,
Dr. Straetmans, Huber Silica)
Total leverage improved in Q3 despite Huber purchase
price payment due to strong free cash flow and €0.5bn
hybrid issuance (of which only 50% are treated as debt for
total leverage calculation)
Long-term capital market financing secured under
favorable conditions: average coupon of only 0.74% p.a. on
€3.15bn senior bonds and 2.125% on €0.5bn hybrid bond
More than half of total net debt consists of long-dated
pension obligations; average life of DBO exceeds 15 years
1. Total leverage defined as (net financial debt - 50% hybrid bond + pension provisions) / adj. EBITDA LTM | 2. Calculated annually
(in € m)
6,111
3.0x
6,767
1.3x
2.8x
2.8x
6,749
99
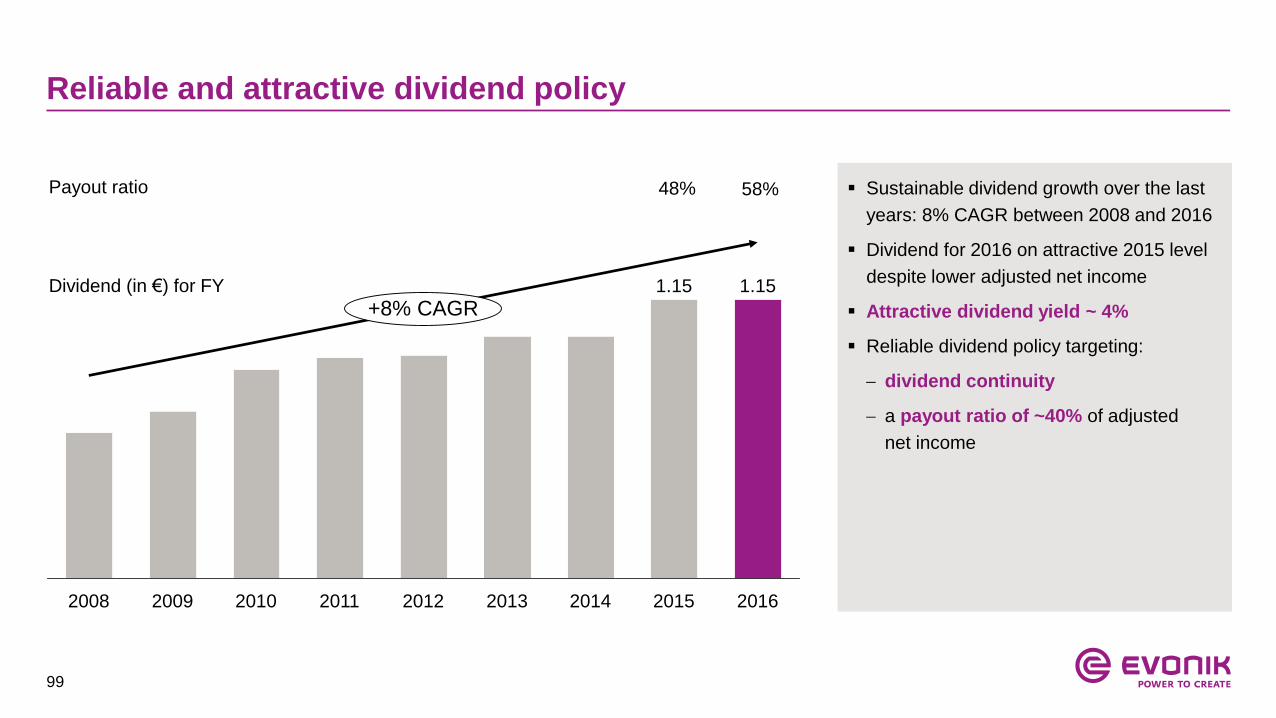
Reliable and attractive dividend policy
2008 2009 20112010 20132012 20152014
1.15
+8% CAGR
2016
1.15
Sustainable dividend growth over the last
years: 8% CAGR between 2008 and 2016
Dividend for 2016 on attractive 2015 level
despite lower adjusted net income
Attractive dividend yield ~ 4%
Reliable dividend policy targeting:
dividend continuity
a payout ratio of ~40% of adjusted
net income
Dividend (in €) for FY
Payout ratio 48% 58%
100
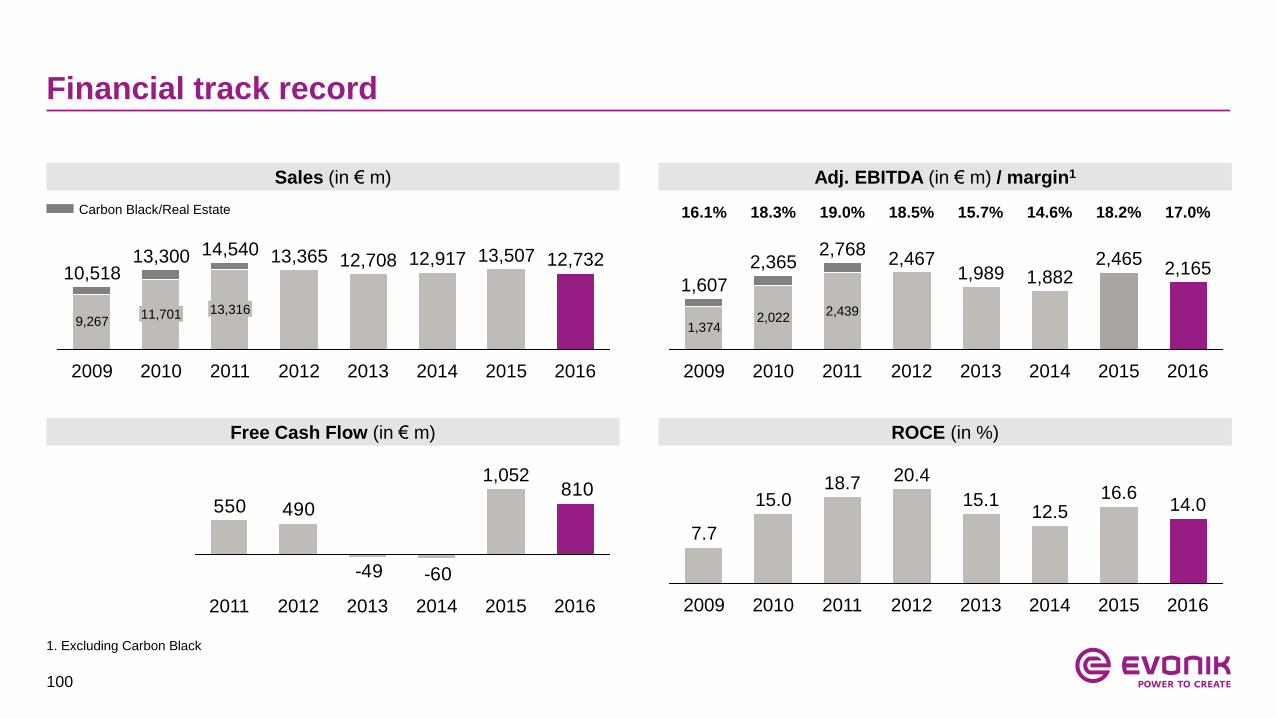
Financial track record
Carbon Black/Real Estate 16.1% 18.3% 19.0% 18.5% 15.7% 14.6%
1. Excluding Carbon Black
2016
2,165
2015
2,465
2014
1,882
2013
1,989
2012
2,467
2011
2,768
2,439
2010
2,365
2,022
2009
1,607
1,374
18.2%
13,316
2010
13,300
11,701
2009
10,518
9,267
2016
12,732
2015
13,507
2014
12,917
2013
12,708
2012
13,365
2011
14,540
810
-60-49
490550
1,052
20162012 20152013 20142011 2014
14.0
2016
7.7
20152009
15.0 16.612.5
20132012
15.1
20.4
20112010
18.7
Sales (in € m) Adj. EBITDA (in € m) / margin1
Free Cash Flow (in € m) ROCE (in %)
17.0%
101
Table of contents
1. Evonik Industries
2. Segments
3. Financials & outlook
Financial policy and pensions
Key financials FY 2016
Outlook 2017
4. Evonik share & Investor Relations
102
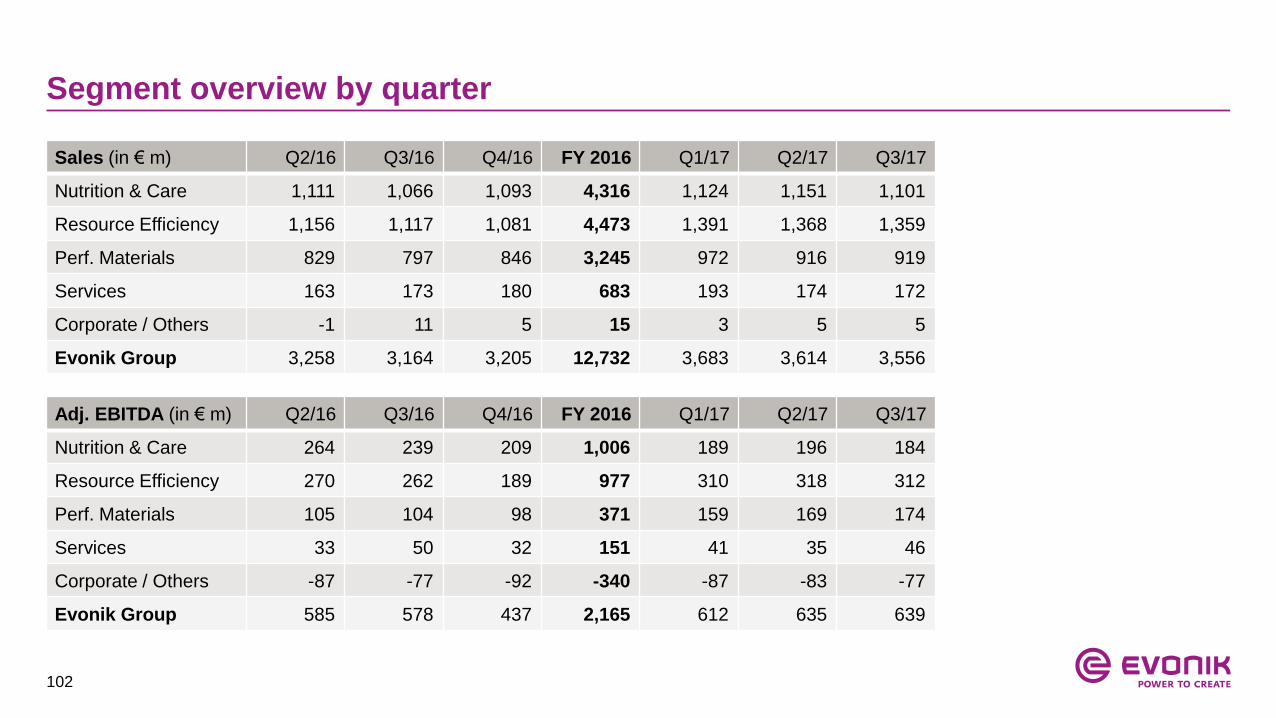
Segment overview by quarter
Sales (in € m) Q2/16 Q3/16 Q4/16 FY 2016 Q1/17 Q2/17 Q3/17
Nutrition & Care 1,111 1,066 1,093 4,316 1,124 1,151 1,101
Resource Efficiency 1,156 1,117 1,081 4,473 1,391 1,368 1,359
Perf. Materials 829 797 846 3,245 972 916 919
Services 163 173 180 683 193 174 172
Corporate / Others -1 11 5 15 3 5 5
Evonik Group 3,258 3,164 3,205 12,732 3,683 3,614 3,556
Adj. EBITDA (in € m) Q2/16 Q3/16 Q4/16 FY 2016 Q1/17 Q2/17 Q3/17
Nutrition & Care 264 239 209 1,006 189 196 184
Resource Efficiency 270 262 189 977 310 318 312
Perf. Materials 105 104 98 371 159 169 174
Services 33 50 32 151 41 35 46
Corporate / Others -87 -77 -92 -340 -87 -83 -77
Evonik Group 585 578 437 2,165 612 635 639

103
Resource Efficiency and Performance Materials with strong earnings growthSegment performance FY 2016
Volume Price FX Other
+2% -14% +/-0% +/-0%
Nutrition & Care Resource Efficiency Performance Materials
-30%
2016
1,006
2015
1,435
23.329.1
Adj.
EBITDA
(in € m)
Margin
(in %)
Sales
Volume Price FX Other
+4% -2% +1% +2%
977896
+9%
20162015
21.820.9
Volume Price FX Other
+4% -10% +/-0% +/-0%
371309
2015
+20%
2016
11.49.0

104
Adjusted income statement FY 2016
Adj. net financial result:
Improvement mainly due to positive year-end effects (see
previous slide)
EBITDA adjustments:
Restructuring + €1 m: expenses for optimization of the
portfolio structure in the Performance Materials segment;
compensated by income from reversal of provisions in
connection with the streamlining of administrative
structures
Impairments - €48 m: mainly in Nutrition & Care and due
to the early termination of a project in Performance
Materials
M&A - €46 m: mainly project expenses related to APD PM
and Huber acquisitions
Others - €57 m
in € m FY 2015 FY 2016 ∆ in %
Sales 13,507 12,732 -6
Adj. EBITDA 2,465 2,165 -12
Depreciation & amortization -713 -717
Adj. EBIT 1,752 1,448 -17
Adj. net financial result -179 -139
D&A on intangible assets 39 47
Adj. income before income taxes 1,612 1,356 -16
Adj. income tax -473 -412
Adj. income after taxes 1,139 944 -17
Adj. non-controlling interests -11 -14
Adj. net income 1,128 930 -18
Adj. earnings per share 2.42 1.99
Adjustments -88 -150

105
Cash flow statement FY 2016
CF from operating activities
NWC: High inflow driven by continuous
improved NWC mgmt. towards year-end
Outflows for income taxes:
pre-payments for strong earnings level of
last year; outflows for tax audit relating to
prior periods
Others:
Change driven by reclassification of
VivaWest disposal in 2015: disposal gain
shown as inflow from divestments of
shareholdings (investing cash flow)
CF from financing activities
Financing of APD purchase price and
dividend payment
in € m FY 2015 FY 2016
Income before financial result and income taxes 1,664 1,298
Depreciation and amortization 764 747
∆ Net working capital -10 381
Change in other provisions 111 -124
Change in miscellaneous assets/liabilities 92 113
Outflows from income taxes -336 -492
Others -317 -165
Cash flow from operating activities 1,968 1,758
Cash flow from investing activities, thereof: -660 -883
Cash outflows for investment in intangible assets, pp&e -916 -948
Cash inflows/outflows from investment/divestment of
shareholdings351 -148
Cash flow from financing activities 133 1,384
Continuing operations
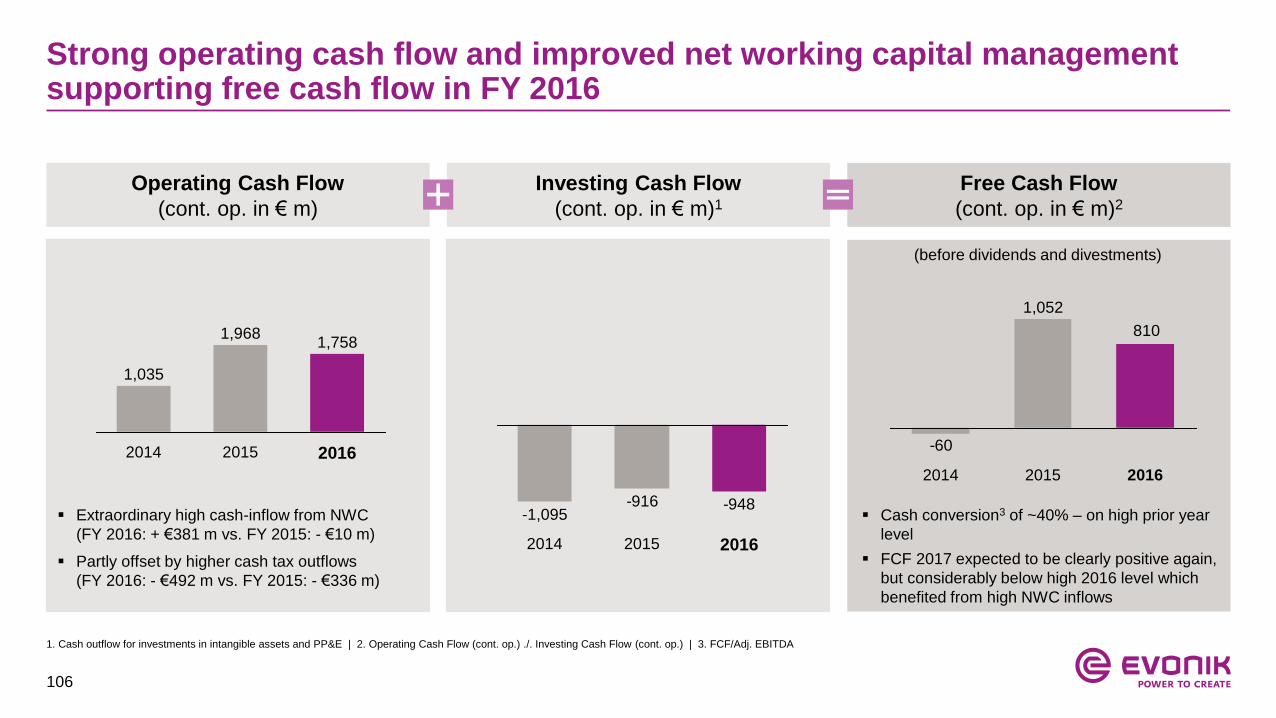
106
Strong operating cash flow and improved net working capital management supporting free cash flow in FY 2016
Operating Cash Flow
(cont. op. in € m)
Investing Cash Flow
(cont. op. in € m)1
Free Cash Flow
(cont. op. in € m)2
1. Cash outflow for investments in intangible assets and PP&E | 2. Operating Cash Flow (cont. op.) ./. Investing Cash Flow (cont. op.) | 3. FCF/Adj. EBITDA
(before dividends and divestments)
1,758
2015
1,968
2014
1,035
2016
-948-916
201620152014
-1,095
810
-60
1,052
2014 2015 2016
Cash conversion3 of ~40% – on high prior year
level
FCF 2017 expected to be clearly positive again,
but considerably below high 2016 level which
benefited from high NWC inflows
Extraordinary high cash-inflow from NWC
(FY 2016: + €381 m vs. FY 2015: - €10 m)
Partly offset by higher cash tax outflows
(FY 2016: - €492 m vs. FY 2015: - €336 m)

107
InvestmentsCapex with significant decrease since 2013 – focus on growth segments
Capex has considerably declined since 2013
Clear focus on the two growth segments
Sustainable capex level going forward: ~€900 m
Sizable investment projects will result in slightly elevated levels
during project time (e.g. second methionine plant in Singapore
with more than half a billion € of Capex between 2016 and 2019,
peaking in 2018)
2017E
~1,0 bn
2016
960
2015
877
2014
1,123
2013
1,140
2012
960
Capex spending (in € m)
Nutrition
& Care
Resource
Efficiency
Performance
Materials
42%
36%
22%
Capex 2016 for chemical segments
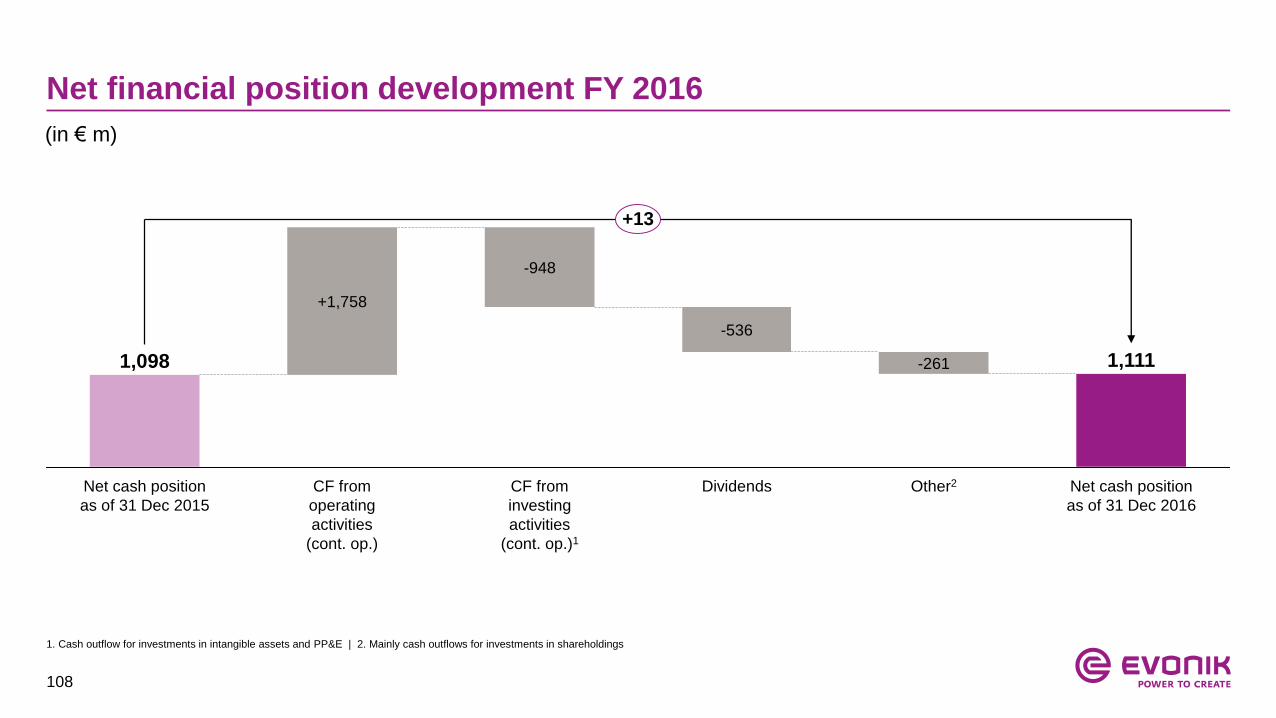
108
Net financial position development FY 2016
(in € m)
+13
Net cash position
as of 31 Dec 2016
1,111
Other2
-261
Dividends
-536
CF from
investing
activities
(cont. op.)1
-948
CF from
operating
activities
(cont. op.)
+1,758
Net cash position
as of 31 Dec 2015
1,098
1. Cash outflow for investments in intangible assets and PP&E | 2. Mainly cash outflows for investments in shareholdings

109
Balance Sheet as of year-end 2016
+16%
8,808
Non-current
assets
19,645
6,685
17,005
10,320
Dec. 31,
2015
Current
assets
Dec. 31,
2016
10,837
+16%
3,076Current
liabilities
Non-current
liabilities
17,005
Dec. 31,
2016
19,645
Equity/
equity ratio
Dec. 31,
2015
6,353
7,576
7,750
8,700
3,195
45%
40%
Assets (in € million) Equity and liabilities (in € million)

110
Raw material split
Fossil
Crack C4
Propylene
Acrylic acid
Acetone
MethanolInorganic & other
Sodium silicate
Sodium hydroxide
Silicon metal
Bio
Dextrose
Fatty alcohols
Tallow fatty acid
Fatty acids
tallow
1. Raw material spend 59% of total procurement volume in 2016
Total procurement volume 2016 (in € m) Oil price link of raw material spend1 (examples)
Energy
(incl. natural gas)
Raw materialMachinery
& Equipment
Logistic & Packaging
~€7.6 bn ~€4.5 bn

111
Table of contents
1. Evonik Industries
2. Segments
3. Financials & outlook
Financial policy and pensions
Key financials FY 2016
Outlook 2017
4. Evonik share & Investor Relations

112
Outlook for 2017 specifiedUpper half of guidance range expected
Outlook
Significantly
higher sales
(previously: higher sales;
2016: €12.7 bn)
Adj. EBITDA in
upper half of
€2.2 and 2.4 bn
range(2016: €2,165 bn)
€2.2 bn
€2.3 bn
Adj. EBITDA
€2.4 bn
2017E
Specified:
“upper half”Outlook
range

113
Additional indications for 2017
1. Including transaction effects (after hedging) and translation effects; before secondary / market effects | 2. Guidance for “Adj. net financial result” subject to interest rate fluctuations
which influence discounting effects on provisions
Air Products specialty Adj. EBITDA of around €250 m including first synergies of €10-20 m; Sales and adj.
additives business EBITDA will be allocated roughly equally between N&C and RE
Huber Adj. EBITDA of around €15-20 m (for four month after closing on Sept 1st)
ROCE Above cost of capital (10.0% before taxes), but perceptibly lower than in 2016 (14.0%) as a consequence
of the substantial acquisition-driven rise in capital employed
Capex ~ €1.0 bn (2016: €960 m)
Free cash flow Clearly positive, but considerably below the strong prior year (2016: €785 m)
EUR/USD Around 1.13 EUR/USD (previously: 1.10 EUR/USD)
EUR/USD sensitivity1 +/-1 USD cent = -/+ ~ €7 m adj. EBITDA (FY basis)
Adj. EBITDA Services Slightly below 2016 (2016: €151 m)
Adj. EBITDA Corporate / Others Slightly more negative than in 2016 (2016: -€340 m)
Adj. D&A ~ €840 m (2016: €717 m; increase due to finalized PPA, mainly related to Intangible Assets)
Adj. net financial result2 ~ -€180 m (previously; ~€190 m; 2016: -€139 m); absence of pronounced positive year-end effects vs. 2016
Adj. tax rate ~ 31% (2016: 30.4%), due to higher share of profits in USA

114
Table of contents
1. Evonik Industries
Company overview
Group strategy
2. Segments
3. Financials & outlook
4. Evonik share & Investor Relations

115
Key Facts
The Evonik Share
First Trading Day: April 25, 2013
Indices: MDAX, STOXX 600
Chemicals
Segment: Prime Standard, Frankfurt
Sector: Chemicals
Subsector: Specialty Chemicals
WKN: EVNK01
ISIN: DE000EVNK013
Ticker Symbol: EVK
Reuters: EVKn.DE
Bloomberg: EVK GY
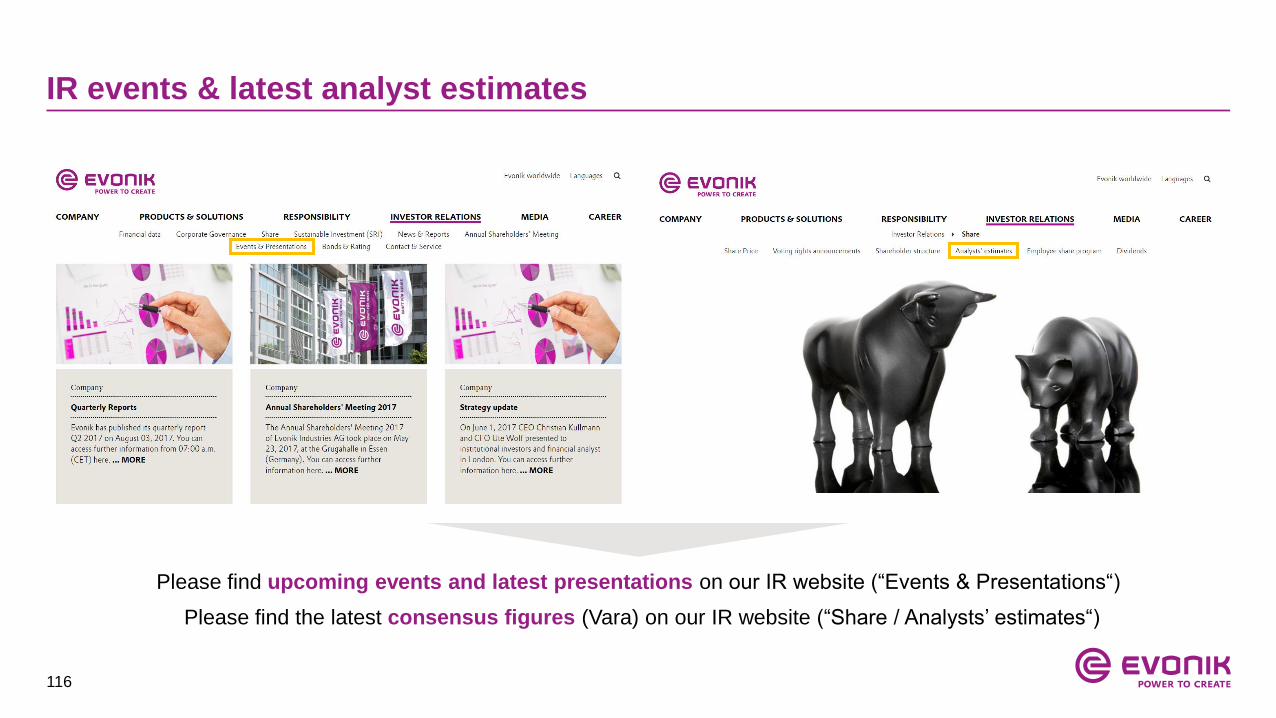
116
IR events & latest analyst estimates
Please find the latest consensus figures (Vara) on our IR website (“Share / Analysts’ estimates“)
Please find upcoming events and latest presentations on our IR website (“Events & Presentations“)

117
Evonik Investor Relations team
Tim Lange
Head of Investor Relations
+49 201 177 3150
Janine Kanotowsky
Team Assistant
+49 201 177 3146
Eva Frerker
Investor Relations Manager
+49 201 177 3142
Daniel Györy
Investor Relations Manager
+49 201 177 3147
Kai Kirchhoff
Investor Relations Manager
+49 201 177 3145
Joachim Kunz
Investor Relations Manager
+49 201 177 3148
Fabian Schwane
Investor Relations Manager
+49 201 177 3149
Janine Kanotowsky
Team Assistant
+49 201 177 3146

118
Disclaimer
In so far as forecasts or expectations are expressed in this presentation or where our statements concern the future, these
forecasts, expectations or statements may involve known or unknown risks and uncertainties. Actual results or developments
may vary, depending on changes in the operating environment. Neither Evonik Industries AG nor its group companies
assume an obligation to update the forecasts, expectations or statements contained in this release.
119