not all mlps are created equal - cfra research cfra hannink mlp... · not all mlps are created...
TRANSCRIPT

© 2013 CFRA. All rights reserved. This document may not be reproduced or redisseminated in whole or in part without prior written permission from CFRA. 1
Not All MLPs are Created Equal A discussion on energy master limited partnerships + identifying related accounting risks
Julie Hilt Hannink, CFA Energy Sector Lead | +1 616.517.2462 [email protected] AUGUST 22, 2013

© 2013 CFRA. All rights reserved. This document may not be reproduced or redisseminated in whole or in part without prior written permission from CFRA. 2
Why MLP accounting matters
General Partner and management
discretion over Distributable Cash
Flow (DCF) calculation and the
resulting Distribution Coverage
calculation means there is the
potential for MLPs to use various
adjustments and tricks to overstate
their ability to sustain and grow
distribution, the key MLP
fundamental.

© 2013 CFRA. All rights reserved. This document may not be reproduced or redisseminated in whole or in part without prior written permission from CFRA. 3
Expect SEC focus
A reshuffling at the Securities & Exchange Commission (SEC) enforcement division is expected to increase the focus on accounting fraud.
Non-GAAP metrics are expected to be front and center as part of the SEC’s potential crack-down on fraud and financial disclosure concerns.
The SEC’s Accounting Quality Model searches the filings of more than 9,000 companies, with one search point being big differences between net income and actual cash outflows available to investors.
The non-GAAP DCF figures can allow large cash distributions even if reported GAAP income and cash flow from operations (CFFO) results are weak.
The Linn Energy (LINE) SEC informal inquiry includes derivative accounting, non-GAAP metrics and the Berry Petroleum (BRY) merger.

© 2013 CFRA. All rights reserved. This document may not be reproduced or redisseminated in whole or in part without prior written permission from CFRA. 4
MLPs decade of growth
National Association of Publicly Traded Partnerships reports a universe of more than 100 MLPs with a total market capitalization in excess of $450 billion.
Growth drivers:
Not all MLPs will make it and you can bet given so much management discretion there will be some stumbles. CFRA can help identify them before they fall.
• Universe size • Unit price performance • Asset classes
• Alternatives • MLP mutual funds • Exchange-traded funds • I-units

© 2013 CFRA. All rights reserved. This document may not be reproduced or redisseminated in whole or in part without prior written permission from CFRA. 5
MLPs defined
Partnerships are typically two-tiered structures with the operating MLP owned
2% by the GP and 98% publicly held by LP unit holders.
Owners of these pass-through entities must treat part of the distribution as current taxable income and the rest as a return of capital.
GPs are typically owned by a sponsoring corporation that is can be publicly traded but there are some GPs owned directly by the public or are privately held.
Unlike other pass-through entities, royalty trusts or REITs, MLPs do not have statutory minimum distributions
Most MLPs are engaged in energy and natural resource operations with midstream businesses (gathering, transport, storage and processing of oil, natural gas and natural gas liquids) being the most common.
MLP operations are now more aggressively expanding into other areas including upstream energy, fertilizer manufacture, oil services and carbon dioxide operations.

© 2013 CFRA. All rights reserved. This document may not be reproduced or redisseminated in whole or in part without prior written permission from CFRA. 6
Why MLPs are attractive to investors
High yields – current average is around 6%
Current tax shelter
Unit price appreciation
Midstream MLPs tend to have the most stable yields given:
• infrastructure nature
• stable cash flows
• fee-oriented revenue streams
• high barriers to entry

© 2013 CFRA. All rights reserved. This document may not be reproduced or redisseminated in whole or in part without prior written permission from CFRA. 7
Why MLPs are attractive to sponsors
Attractive “sales” price since MLPs have a lower cost of capital so can pay more for contributed assets
Ability to redeploy cash
Retention of ownership interest
Incentive distributions for growing distribution rate
Reimbursement of certain costs
Payment of management fees
Limited fiduciary responsibilities to unitholders

© 2013 CFRA. All rights reserved. This document may not be reproduced or redisseminated in whole or in part without prior written permission from CFRA. 8
Energy Investment supporting MLP growth
Projected US infrastructure spending needs at $50-$300 billion+ ... MLP structure is a key investment vehicle for this growth.
CFRA’s caveat is that the market can change relatively quickly – the attached map from 2011 that shows the US LNG inflows – those terminals were thought to be imperative for US energy security just 7 years ago but today are being relicensed as export facilities.
Source: INGAA

© 2013 CFRA. All rights reserved. This document may not be reproduced or redisseminated in whole or in part without prior written permission from CFRA. 9
Energy Investment Needed, Supporting MLP Growth
Source: Geology.com
Although rails will remain an important transport option, additional oil shale pipelines needed
Half of all oil coming out of the Bakken is transported by rail vs. a third by pipe.
The train that crashed in Lac-Megantic, Quebec was carrying Bakken crude.
Offset to increased pipeline is that rails are more flexible.
Source: EIA

© 2013 CFRA. All rights reserved. This document may not be reproduced or redisseminated in whole or in part without prior written permission from CFRA. 10
Shales Driving Growth: EIA Processing Plants 2009
Source: EIA

© 2013 CFRA. All rights reserved. This document may not be reproduced or redisseminated in whole or in part without prior written permission from CFRA. 11
Non-traditional Energy MLPs Commodity-oriented asset classes:
E&P
Fertilizer
Refining
Oil Services
Variable rate distributions
CVR Partners LP (UAN) – Nitrogen fertilizer from petroleum coke
CVR Refining LP (CVRR) – Refining & logistics
Alon USA Partners, LP (ALDW)-- Refining
Northern Tier Energy LP (NTI) – Refining & Fuel Distribution
Terra Nitrogen Company, LP (TNH) – Nitrogen fertilizer from natural gas
Dorchester Minerals LP (DMLP) – Royalty Interests
Rentech Nitrogen Partners , LP (RNF) – Nitrogen fertilizer
PetroLogistics LP (PDH) – Processes propane in propylene
Numerous 2012 IRS private letter rulings expanded qualifying income
Renewables potential with introduction of Master Limited Partner Parity Act

© 2013 CFRA. All rights reserved. This document may not be reproduced or redisseminated in whole or in part without prior written permission from CFRA. 12
Along with Growth Potential Comes Risk
Economic Higher interest rates create competition
Higher interest rates increase cost structure
Regulatory Fracking/EPA/Environmental
Focus on renewables
Tax status
Industry Technology
Geology
Geopolitics/Fiscal Regimes

© 2013 CFRA. All rights reserved. This document may not be reproduced or redisseminated in whole or in part without prior written permission from CFRA. 13
MLPs within CFRA’s Accounting Lens
MLPs are no different than any other sector, industry, or geography.
CFRA screens and analyzes MLP financial reports and disclosures to determine if the choices made by the MLP conceal the underlying position of the entity.
For MLPs our reviews seek to determine if distribution rates can be maintained and grow as promised by management.
IDR Relinquishment – similar to distribution cut
CFRA wants to determine if the MLP’s GAAP and non-GAAP metrics properly reflect its financial position.

© 2013 CFRA. All rights reserved. This document may not be reproduced or redisseminated in whole or in part without prior written permission from CFRA. 14
CFRA MLP Research
Educational/Industry
10 Questions to Ask MLP Managements – June 12, 2013
E&P: Alternatives to Raising Capital- July 24, 2013
Accounting Notebooks
Enterprise Products Partners LP (EPD) -7/24/13
Linn Energy LLC (LINE) -7/24/13
Kinder Morgan Energy Partners (KMP) – 7/18/13
Accounting Lens
Kinder Morgan Energy Partners (KMP) – 11/26/07

© 2013 CFRA. All rights reserved. This document may not be reproduced or redisseminated in whole or in part without prior written permission from CFRA. 15
MLPs that Fall Within CFRA Market Cap Screens
T icker C o mpany N ame Secto r
ACM P Access M idstream Partners LP M idstream
ATLS Atlas Energy L.P. M idstream
APL Atlas Pipeline Partners L.P. M idstream
BWP Boardwalk P ipeline Partners L.P. M idstream
BPL Buckeye Partners L.P. M idstream
CQP Cheniere Energy Partners L.P. M idstream
CM LP Crestwood M idstream Partners LP M idstream
DPM DCP M idstream Partners L.P. M idstream
EROC Eagle Rock Energy Partners L.P. M idstream
EPB El Paso Pipeline Partners L.P. M idstream
EEP Enbridge Energy Partners L.P. Cl A M idstream
ETE Energy Transfer Equity L.P. M idstream
ETP Energy Transfer Partners L.P. M idstream
EPD Enterprise Products Partners L.P. M idstream
GEL Genesis Energy L.P. M idstream
HEP Holly Energy Partners L.P. M idstream
NRGY Inergy L.P. M idstream
KM P Kinder M organ Energy Partners L.P. M idstream
M M P M agellan M idstream Partners L.P. M idstream
M WE M arkWest Energy Partners L.P. M idstream
M M LP M artin M idstream Partners L.P. M idstream
M PLX M PLX LP M idstream
NGL NGL Energy Partners LP M idstream
OKS ONEOK Partners L.P. M idstream
PNG PAA Natural Gas Storage L.P. M idstream
PAA Plains All American Pipeline L.P. M idstream
PVR PVR Partners L.P. M idstream
RGP Regency Energy Partners L.P. M idstream
SEP Spectra Energy Partners L.P. M idstream
SXL Sunoco Logistics Partners L.P. M idstream
NGLS Targa Resources Partners L.P. M idstream
TCLP TC PipeLines L.P. M idstream
TLLP Tesoro Logistics LP M idstream
WGP Western Gas Equity Partners LP M idstream
WES Western Gas Partners LP M idstream
WPZ Williams Partners L.P. M idstream
T icker C o mpany N ame Secto r
ARLP Alliance Resource Partners L.P. Coal & Consumable Fuels
NRP Natural Resource Partners L.P. Coal & Consumable Fuels
EXLP Exterran Partners L.P. Oil & Gas Equipment & Services
USAC USA Compression Partners LP Oil & Gas Equipment & Services
ARP Atlas Resource Partners LP Oil & Gas Exploration & Production
BBEP BreitBurn Energy Partners L.P. Oil & Gas Exploration & Production
EVEP EV Energy Partners L.P. Oil & Gas Exploration & Production
LGCY Legacy Reserves L.P. Oil & Gas Exploration & Production
LINE Linn Energy LLC Oil & Gas Exploration & Production
M EM P M emorial Production Partners L.P. Oil & Gas Exploration & Production
QRE QR Energy L.P. Oil & Gas Exploration & Production
ALDW Alon USA Partners L.P. Oil & Gas Refining & M arketing
CLM T Calumet Specialty Products Partners L.P. Oil & Gas Refining & M arketing
XTEX Crosstex Energy L.P. Oil & Gas Refining & M arketing
CVRR CVR Refining LP Oil & Gas Refining & M arketing
NTI Northern Tier Energy LP Cl A Oil & Gas Refining & M arketing
NS NuSTAR Energy L.P. Oil & Gas Refining & M arketing
GM LP Golar LNG Partners LP LNG Floating Platforms
TGP Teekay LNG Partners L.P. LNG & Crude Carriers
TOO Teekay Offshore Partners L. P. Shuttle Tankers

© 2013 CFRA. All rights reserved. This document may not be reproduced or redisseminated in whole or in part without prior written permission from CFRA. 16
MLPs & Screening
Accounting and financial reporting techniques that may mislead investors about a company’s financial performance or economic health:
Earnings: Adjusting accrual-based performance numbers by managing reported revenue and expenses
GAAP earnings pale in comparison to cash flow due to MLPs main purpose of distributing cash to unit holders
Cash Flow: Employing techniques to report misleadingly high operating cash flow and free cash flow
MLPs focus on cash available for distribution (CAD) or distributable cash flow (DCF) vs. cash flow from operations (CFFO) or GAAP free cash flow (FCF); however, need to access capital markets means CFFO is a key screening tool.
Key Metrics: Misusing accepted non-GAAP metrics or creating misleading ones to overstate performance or distort economic health.
CAD/DCF and Distribution Coverage are the central non-GAAP key metrics for MLPs

© 2013 CFRA. All rights reserved. This document may not be reproduced or redisseminated in whole or in part without prior written permission from CFRA. 17
MLPs within CFRA’s Accounting Lens
When analyzing these partnerships it is crucial to:
Review GAAP items due to continued need to access capital markets to fund growth
Analyze non-GAAP items due to the need to maintain and/or grow LP distribution rates
Key non-GAAP metrics:
Distributable Cash Flow (DCF)/ Cash Available for Distribution (CAD)
Maintenance/Sustaining Capital Spending (Capex)
Distribution Coverage
A High Level of Management Discretion:
DCF/CAD and Maintenance Capex are either defined in the operating or partnership agreement
Limited fiduciary responsibilities of GP to LP unitholders.

© 2013 CFRA. All rights reserved. This document may not be reproduced or redisseminated in whole or in part without prior written permission from CFRA. 18
Distributions Could be at Risk if an MLP . . .
Operational
Is unable to maintain or attain planned growth benchmarks
Needs access to debt markets as interest rate spikes
Issues excessive LP units
Accounting
Changes how DCF/CAD is calculated.
Has difficulty maintaining a coverage ratio above 100%.
Maintains a 100% or more coverage ratio by lowering indicated maintenance capex levels.

© 2013 CFRA. All rights reserved. This document may not be reproduced or redisseminated in whole or in part without prior written permission from CFRA. 19
10 Questions to Ask MLP Management – an Update
1. What is the definition of
DCF/CAD?.
2. What is the Distribution
Coverage ratio?
3. What is the break-out of Fee
vs. Commodity exposure?
4. How is the
Sustaining/Maintenance Capex
determined?
5. How many distributions do
current cash balances cover?
6. What is the ownership
structure?
7. How are service costs and
reimbursements allocated
between related parties?
8. How has the MLP grown?
9. How has growth been funded
and is there a target level of
debt?
10.What are the governance
policies?

© 2013 CFRA. All rights reserved. This document may not be reproduced or redisseminated in whole or in part without prior written permission from CFRA. 20
1. Definition of DCF/CAD?
Not always easy to find
Many companies provide the adjustment to Adjusted EBITDA and then
adjust this Non-GAAP figure to arrive at DCF/CAD.
The problem – many of the adjustments are not decipherable from
looking at the either the press release or the SEC filings.
Complicating matters are things such as:
Incentive Distribution Rights (IDRs)
Relinquishment of IDRS
GP income
Traditional DCF = Net Income + (DD&A – Maintenance Capex)

© 2013 CFRA. All rights reserved. This document may not be reproduced or redisseminated in whole or in part without prior written permission from CFRA. 21
1. Definition of DCF/CAD?
6/30/13 6/30/12 6/30/13 6/30/12
Net income before certain items $ 627
$ 467
$ 1,282
$ 1,001
Less: Noncontrolling Interest before certain items (7 ) (5 ) (14 ) (11 )
Net income attributable to KMP before certain items 620
462
1,268
990
Less: General Partner’s interest in net income before certain items
(13) (418 ) (337 ) (819 ) (658 )
Limited Partners’ net income before certain items 202
125
449
332
Depreciation, depletion and amortization (14) 379
292
717
582
Book (cash) taxes - net —
(2 ) 12
7
Express & Endeavor contribution (6 ) 3
(5 ) 3
Sustaining capital expenditures (15) (70 ) (52 ) (118 ) (96 )
DCF before certain items $ 505
$ 366
$ 1,055
$ 828
Net income / unit before certain items $ 0.49
$ 0.37
$ 1.14
$ 0.98
DCF / unit before certain items $ 1.22
$ 1.07
$ 2.67
$ 2.44
Weighted average units outstanding 413
342
395
340
Three months Ended
Six Months Ended
For some MLPs, clear disclosure and easy to follow the adjustments. A good example is Kinder Morgan Energy Partners (KMP) as shown by this excerpt from its 2Q13 Press Release.

© 2013 CFRA. All rights reserved. This document may not be reproduced or redisseminated in whole or in part without prior written permission from CFRA. 22
1. Definition of DCF/CAD? In contrast to the clear KMP disclosure, here is a summary of the Energy Transfer Partners (ETP), DCF disclosure. Beginning in 1Q13, ETP simplified its calculation but a significant portion of the DCF is tied to its subsidiaries so they need to be analyzed as well. ETP also changed how it calculated DCF in 4Q12.
1Q11 2Q11 3Q11 4Q11 1Q12 2Q12 3Q12 4Q12 1Q13 2Q13
Net Income/ Adjusted EBITDA Beg 1Q12 247.2 156.6 76.1 217.3 494.0 642.0 660.0 948.0 956.0 1,069.0
Amort. Finance Cost in Int Exp 2.3 2.4 2.5 2.7 0.0 0.0 0.0 0.0 0.0 0.0
Deferred Income Tax 1.6 (0.0) 0.4 2.1 0.0 0.0 0.0 0.0 0.0 0.0
Depreciation 89.5 98.5 106.4 110.3 0.0 0.0 0.0 0.0 0.0 0.0
Loss on Debt Extinguishment 0.0 0.0 0.0 0.0 0.0 0.0 0.0 0.0 0.0 0.0
Non-Cash Compensation 10.2 10.6 10.4 6.3 0.0 0.0 0.0 0.0 0.0 0.0
Gain on Asset Sales/Deconsolid. 1.7 0.5 1.0 (0.0) 0.0 0.0 0.0 0.0 0.0 0.0
Unrealized deriv (gains) Losses - Inter (1.0) (7.5) 79.0 12.7 0.0 0.0 0.0 0.0 0.0 0.0
AFUD 1.1 (1.2) (0.6) (0.3) 0.0 0.0 0.0 0.0 0.0 0.0
Unrealized deriv (gains) Losses - Comm (7.1) (0.6) 6.4 12.6 0.0 0.0 0.0 0.0 0.0 0.0
Impairments 0.0 0.0 5.4 0.0 0.0 0.0 0.0 0.0 0.0 0.0
Distribution (<) > Earnings Unconsold 4.7 (2.8) 16.0 6.9 0.0 0.0 0.0 0.0 0.0 0.0
DCF for non-controlling 0.0 (10.1) (11.9) (13.3) 0.0 0.0 0.0 0.0 0.0 0.0
Adjusted EBITDA Unconsolidated Subs (99.0) (97.0) (106.0) (178.0) (165.0) (158.0)
Distributions Unconsolidated Subs 42.0 67.0 81.0 72.0 95.0 102.0
Interest Expense Net of capitalized (141.0) (191.0) (147.0) (186.0) (211.0) (211.0)
Income Tax (2.0) (7.0) (27.0) (27.0) (3.0) (89.0)
Maintance Capex (19.6) (29.5) (31.4) (53.6) (24.0) (77.0) (69.0) (143.0) (51.0) (121.0)
Other 6.5 6.5 6.5 6.7 1.0 0.0 0.0 2.0 1.0 1.0
DCF 337.1 223.3 266.1 310.4 271.0 337.0 392.0 488.0 622.0 593.0
DCF attributable to SXL 0.0 0.0 0.0 0.0 0.0 0.0 0.0 (165.0) (195.0) (184.0)
Distributions from SXL 0.0 0.0 0.0 0.0 0.0 0.0 0.0 41.0 45.0 49.0
Distributions to ETE respect to LoneStar 0.0 0.0 0.0 0.0 0.0 0.0 0.0 (75.0) (50.0) 0.0
Distributions to RGP respect to LoneStar 0.0 0.0 0.0 0.0 (11.0) (21.0) (14.0) (17.0) (23.0) (16.0)
DCF attributable to ETP Partners 337.1 223.3 266.1 310.4 260.0 316.0 378.0 272.0 399.0 442.0
© 2013 CFRA. All rights reserved. This document may not be reproduced or redisseminated in whole or in part without prior written permission from CFRA. 23
2. Distribution Coverage ratio?
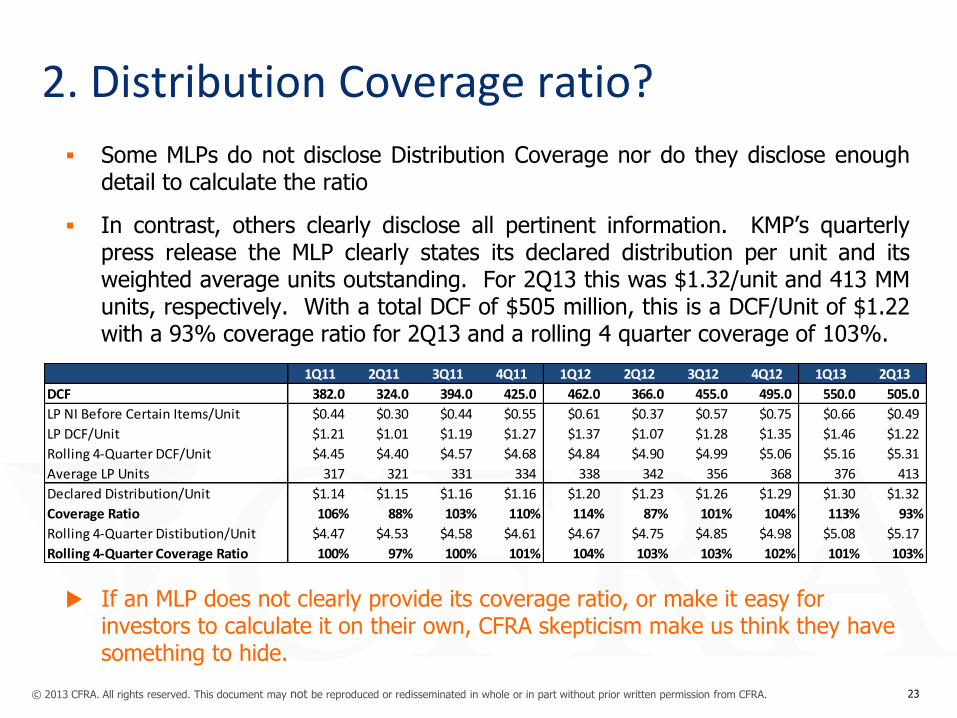
Some MLPs do not disclose Distribution Coverage nor do they disclose enough detail to calculate the ratio
In contrast, others clearly disclose all pertinent information. KMP’s quarterly press release the MLP clearly states its declared distribution per unit and its weighted average units outstanding. For 2Q13 this was $1.32/unit and 413 MM units, respectively. With a total DCF of $505 million, this is a DCF/Unit of $1.22 with a 93% coverage ratio for 2Q13 and a rolling 4 quarter coverage of 103%.
If an MLP does not clearly provide its coverage ratio, or make it easy for investors to calculate it on their own, CFRA skepticism make us think they have something to hide.
1Q11 2Q11 3Q11 4Q11 1Q12 2Q12 3Q12 4Q12 1Q13 2Q13
DCF 382.0 324.0 394.0 425.0 462.0 366.0 455.0 495.0 550.0 505.0
LP NI Before Certain Items/Unit $0.44 $0.30 $0.44 $0.55 $0.61 $0.37 $0.57 $0.75 $0.66 $0.49
LP DCF/Unit $1.21 $1.01 $1.19 $1.27 $1.37 $1.07 $1.28 $1.35 $1.46 $1.22
Rolling 4-Quarter DCF/Unit $4.45 $4.40 $4.57 $4.68 $4.84 $4.90 $4.99 $5.06 $5.16 $5.31
Average LP Units 317 321 331 334 338 342 356 368 376 413
Declared Distribution/Unit $1.14 $1.15 $1.16 $1.16 $1.20 $1.23 $1.26 $1.29 $1.30 $1.32
Coverage Ratio 106% 88% 103% 110% 114% 87% 101% 104% 113% 93%
Rolling 4-Quarter Distibution/Unit $4.47 $4.53 $4.58 $4.61 $4.67 $4.75 $4.85 $4.98 $5.08 $5.17
Rolling 4-Quarter Coverage Ratio 100% 97% 100% 101% 104% 103% 103% 102% 101% 103%

© 2013 CFRA. All rights reserved. This document may not be reproduced or redisseminated in whole or in part without prior written permission from CFRA. 24
3. Break-out of Fee vs. Commodity Exposure? Investors need to understand what they are buying and it is not always easy to ascertain without management disclosure.
Becomes even more problematic once a parent MLP has multiple subsidiary MLPs.
Regency Energy Partners (RGP) provides details on its Segment Margin:
Fee-based and Hedged Commodity are not created equal.
Even fee-based can fall off : HiCrush Partners LP (HCLP) fell 30% when Baker Hughes terminated its contract.
RGP stopped reporting Haynesville JV volumes in 2012
FY 2010 FY 2011 FY 2012
FY 2013
Target
Fee-based 76% 83% 83% 70%
Hedged Commodity 21% 11% 8% 20%
Un-hedged Commodity 3% 6% 9% 10%
Fee Based + Hedged 97% 94% 91% 90%
Three Months Ended December 31, Year Ended December 31,
2011 2010 2009
2011 2010 2009
($ in thousands)
Haynesville Joint Venture
Financial data:
Segment margin $ 43,901
$ 47,450
$ 12,157
$ 183,309
$ 174,347
$ 52,051
Operating data:
Throughput (MMbtu/d)
1,054,392
1,543,570
640,166
1,321,266
1,277,881
738,654
© 2013 CFRA. All rights reserved. This document may not be reproduced or redisseminated in whole or in part without prior written permission from CFRA. 25
3. Break-out of Fee vs. Commodity Exposure?
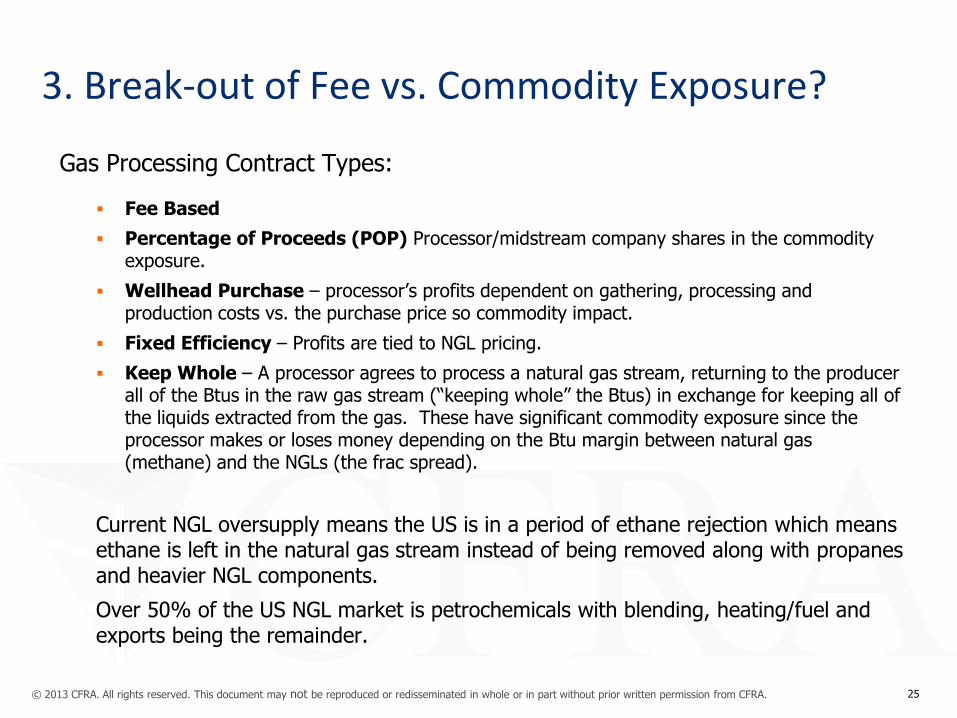
Gas Processing Contract Types:
Fee Based
Percentage of Proceeds (POP) Processor/midstream company shares in the commodity exposure.
Wellhead Purchase – processor’s profits dependent on gathering, processing and production costs vs. the purchase price so commodity impact.
Fixed Efficiency – Profits are tied to NGL pricing.
Keep Whole – A processor agrees to process a natural gas stream, returning to the producer all of the Btus in the raw gas stream (“keeping whole” the Btus) in exchange for keeping all of the liquids extracted from the gas. These have significant commodity exposure since the processor makes or loses money depending on the Btu margin between natural gas (methane) and the NGLs (the frac spread).
Current NGL oversupply means the US is in a period of ethane rejection which means ethane is left in the natural gas stream instead of being removed along with propanes and heavier NGL components.
Over 50% of the US NGL market is petrochemicals with blending, heating/fuel and exports being the remainder.
© 2013 CFRA. All rights reserved. This document may not be reproduced or redisseminated in whole or in part without prior written permission from CFRA. 26
3. Break-out of Fee vs. Commodity Exposure?
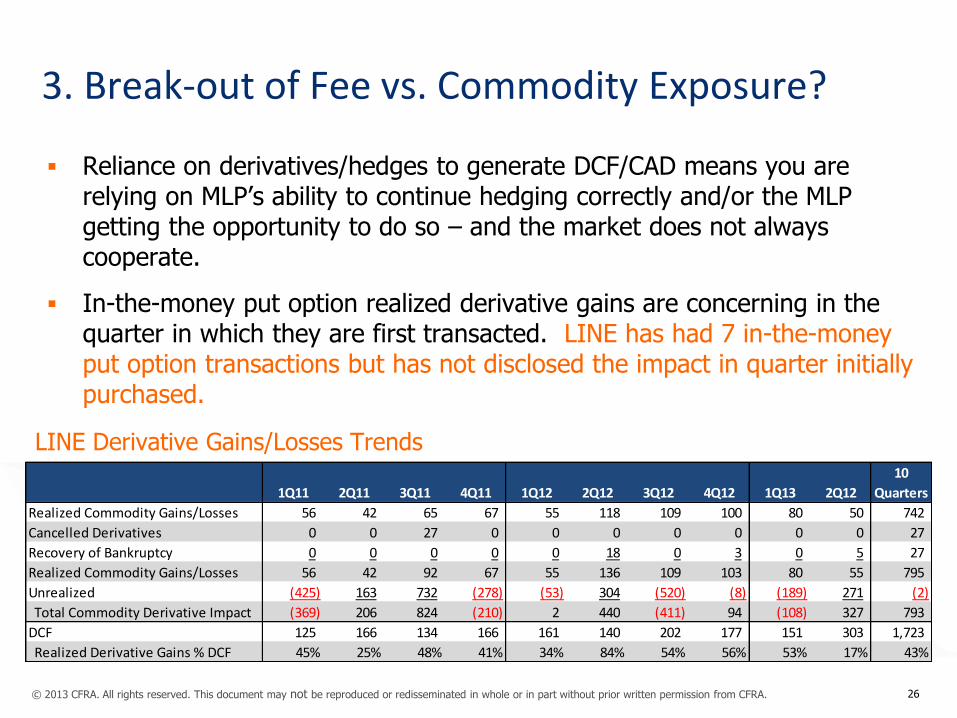
Reliance on derivatives/hedges to generate DCF/CAD means you are relying on MLP’s ability to continue hedging correctly and/or the MLP getting the opportunity to do so – and the market does not always cooperate.
In-the-money put option realized derivative gains are concerning in the quarter in which they are first transacted. LINE has had 7 in-the-money put option transactions but has not disclosed the impact in quarter initially purchased.
1Q11 2Q11 3Q11 4Q11 1Q12 2Q12 3Q12 4Q12 1Q13 2Q12
10
Quarters
Realized Commodity Gains/Losses 56 42 65 67 55 118 109 100 80 50 742
Cancelled Derivatives 0 0 27 0 0 0 0 0 0 0 27
Recovery of Bankruptcy 0 0 0 0 0 18 0 3 0 5 27
Realized Commodity Gains/Losses 56 42 92 67 55 136 109 103 80 55 795
Unrealized (425) 163 732 (278) (53) 304 (520) (8) (189) 271 (2)
Total Commodity Derivative Impact (369) 206 824 (210) 2 440 (411) 94 (108) 327 793
DCF 125 166 134 166 161 140 202 177 151 303 1,723
Realized Derivative Gains % DCF 45% 25% 48% 41% 34% 84% 54% 56% 53% 17% 43%
LINE Derivative Gains/Losses Trends

© 2013 CFRA. All rights reserved. This document may not be reproduced or redisseminated in whole or in part without prior written permission from CFRA. 27
4. How is Sustaining/Maintenance Capex determined?
1Q11 2Q11 3Q11 4Q11 1Q12 2Q12 3Q12 4Q12 1Q13 2Q13
Maintenance Capex 36 49 55 72 44 52 78 111 48 52
PP&E, net 14,696 14,824 15,344 15,596 14,916 15,130 19,326 22,330 22,584 15,130
Depreciation (281) (294) (301) (304) (321) (337) (367) (387) (401) (337)
Total Capex 265 270 302 361 353 424 496 533 552 424
Maintenance Capex % net PP&E 0.24% 0.33% 0.36% 0.46% 0.29% 0.34% 0.40% 0.50% 0.21% 0.34%
Maintenance Capex % Depreciation 12.8% 16.7% 18.3% 23.7% 13.7% 15.4% 21.3% 28.7% 12.0% 15.4%
Maintenance Capex % Total Capex 13.6% 18.1% 18.2% 19.9% 12.5% 12.3% 15.7% 20.8% 8.7% 12.3%
Rolling 4 Quarter
Maintenance Capex % net PP&E 1.14% 1.24% 1.29% 1.36% 1.47% 1.47% 1.27% 1.28% 1.28% 1.47%
Maintenance Capex % Depreciation 15.6% 16.4% 17.2% 18.0% 18.0% 17.7% 18.5% 20.2% 19.4% 17.7%
Maintenance Capex % Total Capex 15.9% 16.9% 18.5% 17.7% 17.1% 15.5% 15.1% 15.8% 14.4% 15.5%
Depreciation % net PP&E 1.91% 1.98% 1.96% 1.95% 2.15% 2.23% 1.90% 1.73% 1.78% 2.23%
What is good for a midstream assets . . .
KMP Maintenance Capex Trends

© 2013 CFRA. All rights reserved. This document may not be reproduced or redisseminated in whole or in part without prior written permission from CFRA. 28
4. How is Sustaining/Maintenance Capex determined?
Adjusted for Price Revisions 2006 2007 2008 2009 2010 2011 2012 5-yr Avg
Drill-bit F&D/BOE $8.31 $15.43 $8.68 $26.48 $9.45 $12.99 $41.52 $16.78
Acquisition F&D/BOE $10.34 $14.09 $9.64 $11.27 $12.13 $15.72 $9.21 $10.96
Total F&D/BOE $10.04 $14.21 $9.27 $16.44 $11.63 $14.80 $11.81 $12.13
Adjusted for Price Revisions 2010* 2011 2012 2013E
5-YR F&D - Hist Used for Maint Capex $11.15 $11.15 $11.96 $16.78
Annual Production 16 22 41 50
CFRA Estimated Maintenance Capex 180 249 491 839
LINE Reported/Proj Maint. Capex 87 167 362 440
Total Shortfall (93) (82) (128) (399)
Quarterly Shortfall (23) (21) (32) (100)
... is not what is good for E&P assets.
Why should we compare E&P maintenance capex to EBITDA?
LINE Maintenance Capex Trends

© 2013 CFRA. All rights reserved. This document may not be reproduced or redisseminated in whole or in part without prior written permission from CFRA. 29
5. How many distributions do current cash balances cover?
Variable distribution MLPs should have higher coverage than traditional
MLPs.
When reviewing cash position of variable distribution MLPs also review the
reserving needed to get to that cash position.
1Q11 2Q11 3Q11 4Q11 1Q12 2Q12 3Q12 4Q12 1Q13 2Q13
Cash and Cash Equivalents 178 353 271 409 491 522 532 529 736 656
Quarterly Distribution 361 369 384 387 406 421 449 475 489 545
Cash Balance Distribution Coverage 0.5 1.0 0.7 1.1 1.2 1.2 1.2 1.1 1.5 1.2
KMP Cash Balances
NTI Cash Balances 3Q12 4Q12 1Q13 2Q13
Cash and Cash Equivalents 324 273 172 99
Quarterly Distribution 136 117 113 62
Cash Balance Distribution Coverage 2.4 2.3 1.5 1.6
Reserves & Adjustments (51.7) 16.6 (10.0) 0.0
% of Quarterly Distribution -38% 14% -9% 0%

© 2013 CFRA. All rights reserved. This document may not be reproduced or redisseminated in whole or in part without prior written permission from CFRA. 30
6. What is the ownership structure?
Make sure you know what they own and who owns them.
Few traditional midstream companies left that are not or do not
have an MLP.

© 2013 CFRA. All rights reserved. This document may not be reproduced or redisseminated in whole or in part without prior written permission from CFRA. 31
6. What is the ownership structure?
General Partner
Sponsoring
Corporation
MLP
Subsidiary Holding
Company
100% Interest
2% GP Interest
100% Interest 10% LP Interest
88% External LP Unit
Holders

© 2013 CFRA. All rights reserved. This document may not be reproduced or redisseminated in whole or in part without prior written permission from CFRA. 32
6. What is the ownership structure?
Source: Energy Transfer Partners

© 2013 CFRA. All rights reserved. This document may not be reproduced or redisseminated in whole or in part without prior written permission from CFRA. 33
6. What is the ownership structure?
Distribution
Schedule LP% GP%
LP Distrib Up
To
Distribution
by Tier LP Share
Total
Distribution
Total GP
Share
GP
Regular GP IDR
Tier 1 98% 2% $0-$1 $1.00 $98.00 $100.00 $2.00 $2.00 $0.00
Tier 2 85% 15% $1-$2 $1.00 $98.00 $115.29 $17.29 $2.00 $15.29
Tier 3 75% 25% $2-$3 $1.00 $98.00 $130.67 $32.67 $2.00 $30.67
Tier 4 50% 50% Over $3 $1.00 $98.00 $196.00 $98.00 $2.00 $96.00
Total 72% 28% $4.00 $392.00 $541.96 $149.96 $8.00 $141.96
1) 100 shares total with 98 LP units and the remainder GP units
2) Current distribution is $4.00/unit
GPs may also have Incentive Distribution Rights as part of their
ownership interest which could pressure it to raise overall distributions
more quickly than what can be supported by the underlying assets.

© 2013 CFRA. All rights reserved. This document may not be reproduced or redisseminated in whole or in part without prior written permission from CFRA. 34
6. What is the ownership structure?
Source: Energy Transfer Partners
1Q11 2Q11 3Q11 4Q11 1Q12 2Q12 3Q12 4Q12 1Q13 2Q13
ETE's Cash Distributions from ETP
GP Interest 4.9 4.9 4.9 4.9 4.9 4.9 4.9 5.0 5.0 5.0
IDR 103.2 103.4 103.7 111.6 99.5 120.9 147.3 148.0 156.0 183.0
LP Interest 44.9 44.9 44.9 44.9 46.9 44.9 44.9 45.0 45.0 89.0
Total 153.0 153.1 153.5 161.4 151.4 170.7 197.1 198.0 206.0 277.0
IDR Reliquishment Citrus & Sunoco 0.0 0.0 0.0 0.0 0.0 (13.8) (31.3) (31.0) (31.0) (55.0)
Total Cash Distribution from ETP 153.0 153.1 153.5 161.4 151.4 156.9 165.9 167.0 175.0 222.0
ETE's Cash Distributions from RGP
GP Interest 1.3 1.3 1.3 1.3 1.3 1.3 1.3 1.0 1.0 1.0
IDR 1.1 1.3 1.7 1.9 2.1 2.1 2.1 2.0 2.0 3.0
IDR Reliquishment 0.0 0.0 0.0 0.0 0.0 0.0 0.0 0.0 0.0 (1.0)
LP Interest 11.7 11.8 12.0 12.1 12.1 12.1 12.1 12.0 12.0 12.0
Total Cash Distribution from RGP 14.1 14.4 14.9 15.3 15.5 15.5 15.5 15.0 15.0 15.0
Total Distribution from ETP and RGP 167.0 167.6 168.4 176.8 166.8 172.4 181.4 182.0 190.0 237.0
SUG CF/Regency Adjustment 0.0 0.0 0.0 0.0 (45.7) 51.3 76.5 75.0 50.0 0.0
SG&A ex non-cash comp (1.8) (12.0) (11.6) (4.3) (31.0) (10.3) (6.3) (4.0) (6.0) (24.0)
Interest net of adjustments (40.1) (40.1) (40.0) (40.5) (42.4) (65.7) (63.9) (60.0) (58.0) (48.0)
Bridge Financing/Other 0.0 0.0 0.0 0.0 (62.2) 0.0 0.0 0.0 0.0 0.0
DCF 125.2 115.5 116.9 132.1 (14.5) 147.8 187.7 193.0 176.0 165.0
Acquisition expenses/Other 0.6 9.0 9.5 2.8 145.2 10.5 1.4 0.0 2.0 15.0
DCF Adjusted 125.8 124.6 126.4 134.9 130.7 158.2 189.2 193.0 178.0 180.0
GPs can also relinquish IDRs for a period of time – this should only
happen if growth was not as expected and should send the same type of
signal as a LP distribution cut.

© 2013 CFRA. All rights reserved. This document may not be reproduced or redisseminated in whole or in part without prior written permission from CFRA. 35
7. How are service costs and reimbursements allocated between related parties?
Limited disclosure
Particularly concerning if there are numerous MLP
related parties.
1Q11 2Q11 3Q11 4Q11 1Q12 2Q12 3Q12 4Q12 1Q13 2Q13
Total Service Fee RGP to ETE -- RGP Qs 3.9 4.2 4.2 4.3 4.3 4.3 4.3 4.3 4.3 2.0
Total Service Fee ETE to ETP -- ETE Qs 4.9 3.5 4.4 4.4 4.4 4.5 4.4 4.7 NA NA
Total Service Fee SUG to ETP -- ETP Qs 0.0 0.0 0.0 0.0 0.0 0.0 2.3 NA NA NA
Employee Reimb RGC to ETP -- RGP Qs 20.3 4.3 12.6 20.8 13.8 11.0 12.9 NA NA NA
Opex reim RGP to ETP -- RGP Qs 5.5 3.1 6.2 6.8 8.3 6.2 9.4 NA NA NA
Reimb G&A RGC to ETP-- ETP Qs 3.0 0.8 NA NA 1.8 1.8 NA NA NA NA
Source: Energy Transfer Partners. Energy Transfer Equity, Regency Energy Partners

© 2013 CFRA. All rights reserved. This document may not be reproduced or redisseminated in whole or in part without prior written permission from CFRA. 36
8. How has the MLP grown?
Organic vs. Acquisitions
Dropdowns vs. Third Party Acquisitions
Funding: Debt vs. Equity
E&P MLPs largely grow by acquisitions

© 2013 CFRA. All rights reserved. This document may not be reproduced or redisseminated in whole or in part without prior written permission from CFRA. 37
9. How as the growth been funded and is there a target level of debt?
Creditors still look at GAAP items
Higher commodity exposure means less willing to accept high leverage
As balance sheet leverage bumps up against target debt increased
likelihood of equity offering which will pressure unit performance.
NTI Balance Sheet Items
3Q12 4Q12 1Q13 2Q13
Cash and Cash Equivalents 324 273 172 99
Current Assets 643 600 569 498
Total Assets 1,177 1,137 1,123 1,085
Cash % Current Assets 50.3% 45.5% 30.3% 19.8%
Cash % Total Assets 27.5% 24.0% 15.3% 9.1%
Debt 269 283 282 282
Total Partners' Capital 538 484 492 443
Total Capital 806 766 774 725
Debt-to-Total Capital Ratio 33.3% 36.9% 36.5% 38.9%
Net Debt (55) 10 110 184
Total Net Capital 483 493 602 627
Net Debt to Total Capital Ratio -11.4% 1.9% 18.3% 29.3%
© 2013 CFRA. All rights reserved. This document may not be reproduced or redisseminated in whole or in part without prior written permission from CFRA. 38
10. What are the governance policies?
Conflicts Committees
Cross-Board Relationships
Cannot Contract Away “Good Faith”
Understand Management Compensation
Understand IDR Status

© 2013 CFRA. All rights reserved. This document may not be reproduced or redisseminated in whole or in part without prior written permission from CFRA. 39
Questions?
New York City September 9-10
Julie Hilt Hannink, CFA Energy Sector Lead 646-517-2472 [email protected]

© 2013 CFRA. All rights reserved. This document may not be reproduced or redisseminated in whole or in part without prior written permission from CFRA. 40
About Julie Hilt Hannink
Julie Hilt Hannink is the head of energy sector research for CFRA and has 28 years of experience in financial and fundamental research and analysis. Before joining CFRA seven years ago, Julie was Director-Oil and Gas Equity Research at Medley Global Advisors. Prior to that, she spent nearly 15 years on the asset management side of the investment business, most recently at J.P. Morgan Asset Management where she was a Managing Director and senior North American oil & gas analyst.
Julie holds a BS in Commerce (concentration in Accounting) from the University of Virginia.

© 2013 CFRA. All rights reserved. This document may not be reproduced or redisseminated in whole or in part without prior written permission from CFRA. 41
Client Services Email
+ 1 (212) 981-1062 [email protected]
The content of this report and the opinions expressed within are those of CFRA. This analysis has not been submitted to, nor received approval
from, the United States Securities and Exchange Commission or any other regulatory body. While CFRA exercised due care in compiling this
analysis, CFRA AND ALL RELATED ENTITIES SPECIFICALLY DISCLAIM ALL WARRANTIES, EXPRESS OR IMPLIED, regarding the accuracy,
completeness or usefulness of this information. and assumes no liability with respect to the consequences of relying on this information for
investment or other purposes. In particular, the research provided is not intended to constitute an offer, solicitation or advice to buy or sell
securities.
CFRA’s financial data provider for financial companies is SNL FINANCIAL LC. CONTAINS COPYRIGHTED AND TRADE SECRET MATERIAL
DISTRIBUTED UNDER LICENSE FROM SNL. FOR RECIPIENT’S INTERNAL USE ONLY
CFRA, CFRA Accounting Lens, CFRA Legal Edge, CFRA Score, and all other CFRA product names are the trademarks, registered trademarks, or
service marks of CFRA or its affiliates in the United States and other jurisdictions. CFRA Score may be protected by U.S. Patent No. 7,974,894
and/or other patents.
If you have any comments or questions, please contact [email protected].