northumbria research linknrl.northumbria.ac.uk/41513/1/polymers-10-00667.pdf · (a) epoxy, epon 862...
TRANSCRIPT

Northumbria Research Link
Citation: Tarfaoui, Mostapha, Lafdi, Khalid, Beloufa, Imane, Daloia, Debora and Muhsan, Ali (2018) Effect of Graphene Nano-Additives on the Local Mechanical Behavior of Derived Polymer Nanocomposites. Polymers, 10 (6). p. 667. ISSN 2073-4360
Published by: MDPI
URL: http://doi.org/10.3390/polym10060667 <http://doi.org/10.3390/polym10060667>
This version was downloaded from Northumbria Research Link: http://nrl.northumbria.ac.uk/41513/
Northumbria University has developed Northumbria Research Link (NRL) to enable users to access the University’s research output. Copyright © and moral rights for items on NRL are retained by the individual author(s) and/or other copyright owners. Single copies of full items can be reproduced, displayed or performed, and given to third parties in any format or medium for personal research or study, educational, or not-for-profit purposes without prior permission or charge, provided the authors, title and full bibliographic details are given, as well as a hyperlink and/or URL to the original metadata page. The content must not be changed in any way. Full items must not be sold commercially in any format or medium without formal permission of the copyright holder. The full policy is available online: http://nrl.northumbria.ac.uk/pol i cies.html
This document may differ from the final, published version of the research and has been made available online in accordance with publisher policies. To read and/or cite from the published version of the research, please visit the publisher’s website (a subscription may be required.)

polymers
Article
Effect of Graphene Nano-Additives on the LocalMechanical Behavior of DerivedPolymer Nanocomposites
Mostapha Tarfaoui 1,2,* ID , Khalid Lafdi 2, Imane Beloufa 1, Debora Daloia 2 and Ali Muhsan 2
1 ENSTA Bretagne, IRDL—UMR CNRS 6027, F-29200 Brest, France; [email protected] University of Dayton, Dayton, OH 45469-0168, USA; [email protected] (K.L.); [email protected] (D.D.);
[email protected] (A.M.)* Correspondence: [email protected]; Tel.: +33-2-98-34-87-05
Received: 24 March 2018; Accepted: 12 June 2018; Published: 15 June 2018�����������������
Abstract: In this study, indentation tests of graphene-based polymer nanocomposites were carriedout to determine the local elastic mechanical properties. The samples consist of epoxy matrix withgraphene additives. Additives were added at levels of 0% as a control, 0.5%, 1%, 2.5%, 5% and 10%by weight. The local elastic properties such as moduli and hardness were calculated. After eachindentation, the prints were characterized using scanning electron microscopy (SEM). It seemsthat the local mechanical properties of nanocomposite samples were improved as the amount ofnano-additives increased. Based on the curve displacement and surface imaging, we can conclude thatthe nano-additives influenced the overall plastic mechanical behavior of the samples. For simulatingmicro-indentation test, a finite element analysis model was developed using ABAQUS software andcompared to experimental tests. Good correlation was observed.
Keywords: epoxy matrix; graphene nano-additives; micro-indentation test; local properties;effect of graphene
1. Introduction
To enhance the mechanical performance of monolithic epoxy, many researchers have usednanofillers such as graphene, carbon black, carbone nanotubes, and other carbonaceous materialsto reinforce it, due to their high modulus of elasticity and capacity to stop crack propagation [1–3].Indeed, graphene has become popular as a reinforcement material for a wide range of polymer matrices,including polystyrene [4], epoxy [5–7], polyaniline [8], polymethylmethacrylate [9], polypropylene [10]and nylon [11], for several applications. It can improve the thermal stability, mechanical and electricalproperties of polymers. Furthermore, they are affordable [12]. Atif et al. [13] published a reviewpaper concerning the effect of graphene nanoparticles and their influence on thermal, electricaland mechanical properties. They showed that adding a small amount of nanoparticles seems toimprove the overall physical properties. The incorporation of graphene in composites can increase itsfracture toughness by as much as 131%. It was observed that the graphene distribution, its weightfraction and its surface modification all have a strong influence on the properties of nanocomposites.However, all these parameters contribute to the degree of dispersion of these additives in the polymermatrix. In recent studies, several processing routes were proposed to disperse graphene additives intoa polymer, e.g., melt compounding, solution blending, and in situ polymerization [14]. Kim et al. [15]observed that these three different processing methods produced different effects on the mechanicalproperties and electrical conductivity of graphene/polyurethane composites, which might lead todifferent dispersion levels of graphene in the matrix. On the other hand, Tang et al. [16] used two
Polymers 2018, 10, 667; doi:10.3390/polym10060667 www.mdpi.com/journal/polymers

Polymers 2018, 10, 667 2 of 17
different dispersions of graphene, with and without ball mill mixing, to investigate the influence ofgraphene exfoliation on the mechanical properties of epoxy resin. They found a negligible differencein both the tensile and flexural modulus. However, a poor dispersion of epoxy/graphene showed alower strength and fracture toughness than a good dispersion. Furthermore, Yao and colleagues [17]studied the homogeneous dispersion of graphene nanosheets in epoxy to facilitate mixing process,and favor stability of graphene via chemical functionalization. On the other hand, they showed thatgraphene nanosheets are well-exfoliated in epoxy using optical and transmission electron microscopy.The influence of modified graphene on the tensile and thermal properties of epoxy/graphene is studiedto comprehend their property–structure relationship. The enhancement in mechanical properties ofnanocomposites is not only due to the dispersion but also to the type of graphene and the interfacialbonding between graphene and epoxy resin as confirmed by microscopy characterization [18].Salom et al. studied the influence of various types of graphene on the adhesive and mechanicalproperties of an epoxy resin [19]. In their research, three different types of graphene were used toprepare epoxy/graphene-based nanocomposites: two non-functionalized graphene having differentsizes and one functionalized using amine groups. All nanocomposites showed higher moduli than theneat epoxy. whereas increase of graphene presented lower lap shear strength due to the aggregationof the graphene particles. Alexopoulos et al. [20] investigated the mechanical performance of anepoxy resin reinforced with different concentrations and sizes of graphene nanoplatelets. To increasethe interfacial interaction between the resin and nanofillers, an epoxy was prepared with hydroxylfunctionalized graphene by Manjunatha et al. [21]. They showed that the epoxy resin contains 0.5 wt %of functionalized graphene present a higher strength compared with neat epoxy and specimenshaving 0.25 and 1.0 wt % of nanofillers. Ferreira et al. [22] studied the functionalized graphene oxideas reinforcement in epoxy based nanocomposites. The results showed improved properties in themodified surface with finding an improvement of hardness by 33% for functionalized graphene oxide.
Indentation has been intensively used to characterize local mechanical properties of differentmaterials such as polymer, composites, etc. The aim of this study was to quantitatively understandthe effects of neat epoxy and NGP/epoxy on its indentation measurement with experimental andnumerical approaches. Micro-indentation tests of graphene-based polymer nanocomposites werecarried out to determine the local elastic mechanical properties. The samples consisted of epoxy matrixwith graphene additives. Additives were added at levels of 0% as a control, 0.5%, 1%, 2.5%, 5% and10% by weight. Our results clearly demonstrate that the influence of the presence of NGP in epoxymatrix on its indentation measurement can be significant.
2. Materials and Sample Preparation
The nanocomposite samples were produced using the conventional dry mixing method andadding 0.5, 1, 2.5, 5 and 10 wt % of graphene to epoxy. To maintain uniformity and producesound samples, the unfilled polymer and the composites were processed under identical conditions.Graphene used in this study was produced by exfoliation and reduction of graphite in our ownlaboratory (Figure 1). The polymer was a low viscosity liquid epoxy resin, Epon 862 (DiglycidylEther of Bisphenol F), and the curing agent was Epikure W (diethyl toluenediamine, or DETDA),both acquired from Momentive Specialty Chemicals Inc. (Cleveland, OH, USA). This epoxy waschosen here due to its low viscosity and long shelf life at room temperature, which make the systemversatile and easy to process. The aromatic amine curing agent has the advantage of providingexcellent performance and chemical resistance at elevated temperatures. The molecular formulae ofboth compounds are given in Figure 2.
Graphene tends to agglomerate in chunks because of its small particle size, large surface areaand superior particle activity. To improve the dispersion of graphene in epoxy resin, the graphenebundles were dry-blended in a blender to obtain a uniform density graphene. It was then weighed toobtain five concentrations ranging from 0 to 10 wt % with the epoxy resin system. The lowest grapheneconcentration selected was 0.5 wt %, an intermediate value of 5 wt %, and the maximum concentration
Polymers 2018, 10, 667 3 of 17
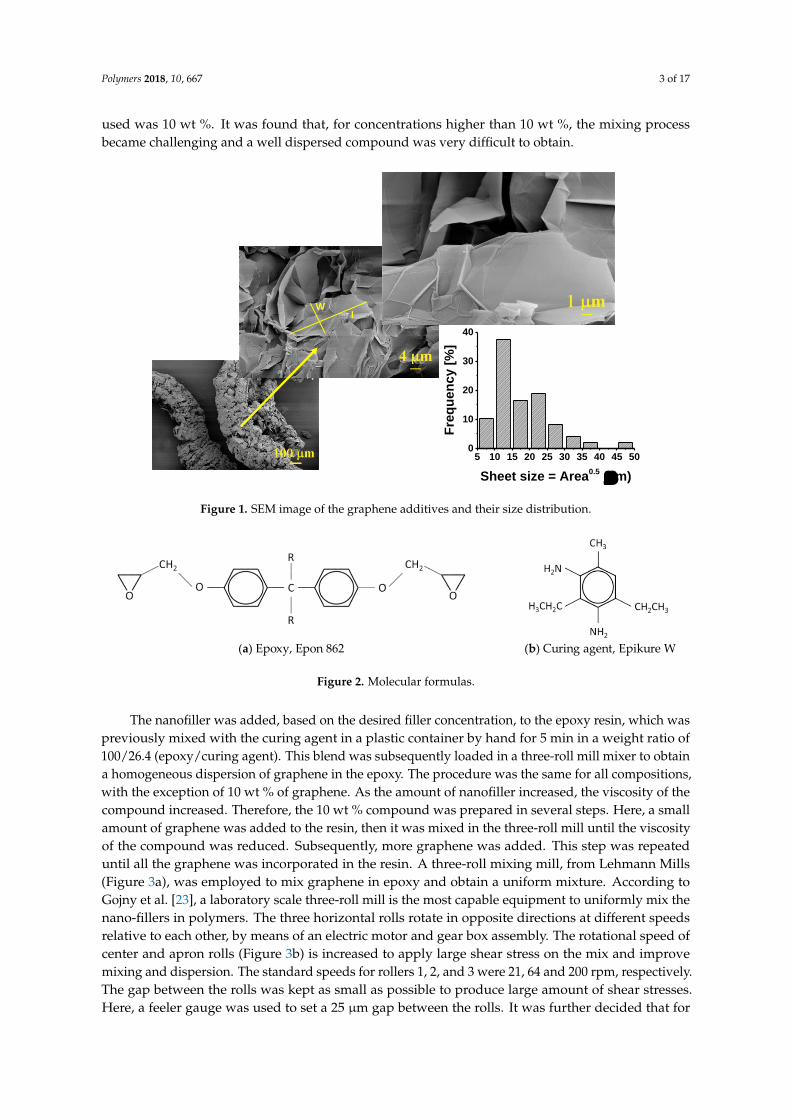
used was 10 wt %. It was found that, for concentrations higher than 10 wt %, the mixing processbecame challenging and a well dispersed compound was very difficult to obtain.
Polymers 2018, 10, x FOR PEER REVIEW 3 of 17
concentration used was 10 wt %. It was found that, for concentrations higher than 10 wt %, the
mixing process became challenging and a well dispersed compound was very difficult to obtain.
Figure 1. SEM image of the graphene additives and their size distribution.
(a) Epoxy, Epon 862 (b) Curing agent, Epikure W
Figure 2. Molecular formulas.
The nanofiller was added, based on the desired filler concentration, to the epoxy resin, which
was previously mixed with the curing agent in a plastic container by hand for 5 min in a weight ratio
of 100/26.4 (epoxy/curing agent). This blend was subsequently loaded in a three-roll mill mixer to
obtain a homogeneous dispersion of graphene in the epoxy. The procedure was the same for all
compositions, with the exception of 10 wt % of graphene. As the amount of nanofiller increased, the
viscosity of the compound increased. Therefore, the 10 wt % compound was prepared in several
steps. Here, a small amount of graphene was added to the resin, then it was mixed in the three-roll
mill until the viscosity of the compound was reduced. Subsequently, more graphene was added.
This step was repeated until all the graphene was incorporated in the resin. A three-roll mixing mill,
from Lehmann Mills (Figure 3a), was employed to mix graphene in epoxy and obtain a uniform
mixture. According to Gojny et al. [23], a laboratory scale three-roll mill is the most capable
equipment to uniformly mix the nano-fillers in polymers. The three horizontal rolls rotate in
opposite directions at different speeds relative to each other, by means of an electric motor and gear
box assembly. The rotational speed of center and apron rolls (Figure 3b) is increased to apply large
shear stress on the mix and improve mixing and dispersion. The standard speeds for rollers 1, 2, and
3 were 21, 64 and 200 rpm, respectively. The gap between the rolls was kept as small as possible to
produce large amount of shear stresses. Here, a feeler gauge was used to set a 25 μm gap between
the rolls. It was further decided that for all formulations, the compound would be passed through
the roll mill five times, and the feed roll speed be increased with increasing graphene content (Table
1). Since the shear stress produces heat, the temperature of the rolls was controlled by a cooling
system, where chilled water at a temperature of 21 °C was used.
lW
5 10 15 20 25 30 35 40 45 500
10
20
30
40
Fre
qu
en
cy
[%
]
Sheet size = Area0.5
(m)
Figure 1. SEM image of the graphene additives and their size distribution.
Polymers 2018, 10, x FOR PEER REVIEW 3 of 17
concentration used was 10 wt %. It was found that, for concentrations higher than 10 wt %, the
mixing process became challenging and a well dispersed compound was very difficult to obtain.
Figure 1. SEM image of the graphene additives and their size distribution.
(a) Epoxy, Epon 862 (b) Curing agent, Epikure W
Figure 2. Molecular formulas.
The nanofiller was added, based on the desired filler concentration, to the epoxy resin, which
was previously mixed with the curing agent in a plastic container by hand for 5 min in a weight ratio
of 100/26.4 (epoxy/curing agent). This blend was subsequently loaded in a three-roll mill mixer to
obtain a homogeneous dispersion of graphene in the epoxy. The procedure was the same for all
compositions, with the exception of 10 wt % of graphene. As the amount of nanofiller increased, the
viscosity of the compound increased. Therefore, the 10 wt % compound was prepared in several
steps. Here, a small amount of graphene was added to the resin, then it was mixed in the three-roll
mill until the viscosity of the compound was reduced. Subsequently, more graphene was added.
This step was repeated until all the graphene was incorporated in the resin. A three-roll mixing mill,
from Lehmann Mills (Figure 3a), was employed to mix graphene in epoxy and obtain a uniform
mixture. According to Gojny et al. [23], a laboratory scale three-roll mill is the most capable
equipment to uniformly mix the nano-fillers in polymers. The three horizontal rolls rotate in
opposite directions at different speeds relative to each other, by means of an electric motor and gear
box assembly. The rotational speed of center and apron rolls (Figure 3b) is increased to apply large
shear stress on the mix and improve mixing and dispersion. The standard speeds for rollers 1, 2, and
3 were 21, 64 and 200 rpm, respectively. The gap between the rolls was kept as small as possible to
produce large amount of shear stresses. Here, a feeler gauge was used to set a 25 μm gap between
the rolls. It was further decided that for all formulations, the compound would be passed through
the roll mill five times, and the feed roll speed be increased with increasing graphene content (Table
1). Since the shear stress produces heat, the temperature of the rolls was controlled by a cooling
system, where chilled water at a temperature of 21 °C was used.
lW
5 10 15 20 25 30 35 40 45 500
10
20
30
40
Fre
qu
en
cy
[%
]
Sheet size = Area0.5
(m)
Figure 2. Molecular formulas.
The nanofiller was added, based on the desired filler concentration, to the epoxy resin, which waspreviously mixed with the curing agent in a plastic container by hand for 5 min in a weight ratio of100/26.4 (epoxy/curing agent). This blend was subsequently loaded in a three-roll mill mixer to obtaina homogeneous dispersion of graphene in the epoxy. The procedure was the same for all compositions,with the exception of 10 wt % of graphene. As the amount of nanofiller increased, the viscosity of thecompound increased. Therefore, the 10 wt % compound was prepared in several steps. Here, a smallamount of graphene was added to the resin, then it was mixed in the three-roll mill until the viscosityof the compound was reduced. Subsequently, more graphene was added. This step was repeateduntil all the graphene was incorporated in the resin. A three-roll mixing mill, from Lehmann Mills(Figure 3a), was employed to mix graphene in epoxy and obtain a uniform mixture. According toGojny et al. [23], a laboratory scale three-roll mill is the most capable equipment to uniformly mix thenano-fillers in polymers. The three horizontal rolls rotate in opposite directions at different speedsrelative to each other, by means of an electric motor and gear box assembly. The rotational speed ofcenter and apron rolls (Figure 3b) is increased to apply large shear stress on the mix and improvemixing and dispersion. The standard speeds for rollers 1, 2, and 3 were 21, 64 and 200 rpm, respectively.The gap between the rolls was kept as small as possible to produce large amount of shear stresses.Here, a feeler gauge was used to set a 25 µm gap between the rolls. It was further decided that for

Polymers 2018, 10, 667 4 of 17
all formulations, the compound would be passed through the roll mill five times, and the feed rollspeed be increased with increasing graphene content (Table 1). Since the shear stress produces heat,the temperature of the rolls was controlled by a cooling system, where chilled water at a temperatureof 21 ˝C was used.Polymers 2018, 10, x FOR PEER REVIEW 4 of 17
(a) Lehman Mills three roll mixer (b) Schematic of the rolls
Figure 3. The mixture production device.
Table 1. Feed roller speed.
Formula Nanofiller (%) Feed Roll Speed (rpm)
1 0 333
2 0.5 and 1 400
3 2.5 480
4 5 550
5 10 600
The mixing of the compound was started by slowly pouring the pre-mixed compound
(graphene, epoxy and curing agent) between feed and center rolls. The mixture then automatically
passed between center and apron rolls by sticking to them, and a knife edge blade scraped the
processed material off the apron roll and stored in the pan (Figure 3). When the entire mixture was
collected in the pan, it was poured again between the feed and center rolls. The process was repeated
five times for each compound. As the mixture became homogeneous, it started presenting a shiny
metallic surface due to the presence of exfoliated graphite. Composite samples were then molded
into 10 cm × 10 cm × 0.5 cm plates using a two-piece mold, as shown in Figure 4. The mold was
comprised of two flat plates (aluminum) and a 5 mm thick aluminum plate, which had two 10 cm ×
10 cm windows machined in it. First, the mold release agent, Frekote 770-NC from Henkel
(Germantown, WI, USA), was applied on all three pieces of the mold, which were previously
cleaned and dried. Two coats of this agent were applied and, after the evaporation of the solvent, the
composite mixture was poured into the assembled mold (aluminum and molding plate) (Figure 4b),
which were held together by high temperature tape. The poured mold was then covered with the
silicone rubber plate and transferred to the molding press. This mold was heated to a temperature of
121 °C for 10 min without applying pressure to eliminate any bubbles, and then a load of 7 tons was
applied on the mold. According to the technical data sheet, the curing process called for: heating the
mold under pressure for 1 h at a temperature of 121 °C, 2 h at 177 °C and finally cooling down to 38
°C prior to releasing pressure. The cooling of the mold inside of the press was an effort to obtain a
flat sample.
Figure 3. The mixture production device.
Table 1. Feed roller speed.
Formula Nanofiller (%) Feed Roll Speed (rpm)
1 0 3332 0.5 and 1 4003 2.5 4804 5 5505 10 600
The mixing of the compound was started by slowly pouring the pre-mixed compound (graphene,epoxy and curing agent) between feed and center rolls. The mixture then automatically passed betweencenter and apron rolls by sticking to them, and a knife edge blade scraped the processed materialoff the apron roll and stored in the pan (Figure 3). When the entire mixture was collected in the pan,it was poured again between the feed and center rolls. The process was repeated five times for eachcompound. As the mixture became homogeneous, it started presenting a shiny metallic surface due tothe presence of exfoliated graphite. Composite samples were then molded into 10 cm ˆ 10 cm ˆ 0.5 cmplates using a two-piece mold, as shown in Figure 4. The mold was comprised of two flat plates(aluminum) and a 5 mm thick aluminum plate, which had two 10 cm ˆ 10 cm windows machined init. First, the mold release agent, Frekote 770-NC from Henkel (Germantown, WI, USA), was appliedon all three pieces of the mold, which were previously cleaned and dried. Two coats of this agent wereapplied and, after the evaporation of the solvent, the composite mixture was poured into the assembledmold (aluminum and molding plate) (Figure 4b), which were held together by high temperature tape.The poured mold was then covered with the silicone rubber plate and transferred to the molding press.This mold was heated to a temperature of 121 ˝C for 10 min without applying pressure to eliminateany bubbles, and then a load of 7 tons was applied on the mold. According to the technical data sheet,the curing process called for: heating the mold under pressure for 1 h at a temperature of 121 ˝C, 2 h at177 ˝C and finally cooling down to 38 ˝C prior to releasing pressure. The cooling of the mold inside ofthe press was an effort to obtain a flat sample.

Polymers 2018, 10, 667 5 of 17
Polymers 2018, 10, x FOR PEER REVIEW 5 of 17
(a) (b)
Figure 4. (a) Two-separate piece mold made of stainless steel; (b) Combined molds one serves as a
window frame and the second as a baseplate.
Afterwards, both sides of the composite plates were polished by hand for 1.5 min each with a
180 grit emery paper, and then they were washed in water and dried.
The mechanical properties of each constituent are listed in Table 2.
Table 2. Mechanical properties of the constituents.
Materials E (GPa) υ
Epoxy matrix 2.72 0.3
Graphene 1030 0.19
3. Indentation Tests
The mechanical properties of epoxy matrix with grapheme additives specimens were evaluated
for each volume fraction using the indentation test. A CSM Micro-Hardness Tester (Figure 5) using
Vickers diamond indenter with a nominal angle of 136° was used in this study. The
micro-indentation parameters used for the tests are: approach speed of 50,000 nm/min, contact load
of 20 mN, load rate of 2000 mN/min, unload rate of 2000 mN/min, maximum load of 1000 mN and 20
s of pause. Schematic representations of indentation curves are presented and analyzed in this
section for different graphene weight fractions.
(a) (b)
Figure 5. Image of (a) the indentation machine and (b) specimens under test.
For this type of material, and to control the dispersion of graphene in the matrix,
micro-indentation tests were carried out in the specimen (Figure 6). Minimum distances of 0.5 mm
between indentation marks were used to avoid any hardening effect from previous tests. Possible
Figure 4. (a) Two-separate piece mold made of stainless steel; (b) Combined molds one serves as awindow frame and the second as a baseplate.
Afterwards, both sides of the composite plates were polished by hand for 1.5 min each with a 180grit emery paper, and then they were washed in water and dried.
The mechanical properties of each constituent are listed in Table 2.
Table 2. Mechanical properties of the constituents.
Materials E (GPa) υ
Epoxy matrix 2.72 0.3Graphene 1030 0.19
3. Indentation Tests
The mechanical properties of epoxy matrix with grapheme additives specimens were evaluatedfor each volume fraction using the indentation test. A CSM Micro-Hardness Tester (Figure 5) usingVickers diamond indenter with a nominal angle of 136˝ was used in this study. The micro-indentationparameters used for the tests are: approach speed of 50,000 nm/min, contact load of 20 mN, load rateof 2000 mN/min, unload rate of 2000 mN/min, maximum load of 1000 mN and 20 s of pause.Schematic representations of indentation curves are presented and analyzed in this section for differentgraphene weight fractions.
Polymers 2018, 10, x FOR PEER REVIEW 5 of 17
(a) (b)
Figure 4. (a) Two-separate piece mold made of stainless steel; (b) Combined molds one serves as a
window frame and the second as a baseplate.
Afterwards, both sides of the composite plates were polished by hand for 1.5 min each with a
180 grit emery paper, and then they were washed in water and dried.
The mechanical properties of each constituent are listed in Table 2.
Table 2. Mechanical properties of the constituents.
Materials E (GPa) υ
Epoxy matrix 2.72 0.3
Graphene 1030 0.19
3. Indentation Tests
The mechanical properties of epoxy matrix with grapheme additives specimens were evaluated
for each volume fraction using the indentation test. A CSM Micro-Hardness Tester (Figure 5) using
Vickers diamond indenter with a nominal angle of 136° was used in this study. The
micro-indentation parameters used for the tests are: approach speed of 50,000 nm/min, contact load
of 20 mN, load rate of 2000 mN/min, unload rate of 2000 mN/min, maximum load of 1000 mN and 20
s of pause. Schematic representations of indentation curves are presented and analyzed in this
section for different graphene weight fractions.
(a) (b)
Figure 5. Image of (a) the indentation machine and (b) specimens under test.
For this type of material, and to control the dispersion of graphene in the matrix,
micro-indentation tests were carried out in the specimen (Figure 6). Minimum distances of 0.5 mm
between indentation marks were used to avoid any hardening effect from previous tests. Possible
Figure 5. Image of (a) the indentation machine and (b) specimens under test.

Polymers 2018, 10, 667 6 of 17
For this type of material, and to control the dispersion of graphene in the matrix, micro-indentationtests were carried out in the specimen (Figure 6). Minimum distances of 0.5 mm between indentationmarks were used to avoid any hardening effect from previous tests. Possible indentation forces areranging from 1 mN to 10 N. The elastic moduli, stiffness, hardness, and max displacement wereobtained as the average value of all specimen tests. For a rigorous approach and a realistic comparison,the testing conditions are the same for all specimens and for all weight fractions.
Polymers 2018, 10, x FOR PEER REVIEW 6 of 17
indentation forces are ranging from 1 mN to 10 N. The elastic moduli, stiffness, hardness, and max
displacement were obtained as the average value of all specimen tests. For a rigorous approach and
a realistic comparison, the testing conditions are the same for all specimens and for all weight
fractions.
Figure 6. Micro-indentation tests.
4. Results
4.1. Graphene Dispersion in Epoxy
The mechanical and physical properties of nanocomposites depend on the dispersion of filler
agent into the matrix. Here, the dispersion of graphene in epoxy was analyzed using optical and
scanning electron microscopes. The optical microscope specimens were produced by mounting a 5
mm × 5 mm × 5 mm composite cube in epoxy holder and polishing its surface to optical flatness
through several steps. The SEM samples were obtained by breaking a thin strip of the composite in
tension. The graphene layers in epoxy can be identified via color contrast caused by the polarized
light. This method is qualitative because the color contrast often varies from one laboratory to
another [19]. However, it is an accurate and reliable technique to evaluate the graphene dispersion
and distribution in polymer matrix. Figure 7 shows optical microscope images of cured
nanocomposites for 1, 5 and 10 wt % of graphene filled epoxy. The white spots and streaks as
indicated by arrows are the graphene sheets. In all cases, the graphene can be seen to be dispersed all
over the surface. The density of graphene sheets increases with its concentration. As such, these
images indicate that the graphene dispersion in epoxy is reasonably uniform, which was further
verified by the SEM analysis.
Figure 7. Overview nanocomposite fracture surfaces showing the graphene dispersion.
Figure 6. Micro-indentation tests.
4. Results
4.1. Graphene Dispersion in Epoxy
The mechanical and physical properties of nanocomposites depend on the dispersion of filleragent into the matrix. Here, the dispersion of graphene in epoxy was analyzed using optical andscanning electron microscopes. The optical microscope specimens were produced by mounting a5 mm ˆ 5 mm ˆ 5 mm composite cube in epoxy holder and polishing its surface to optical flatnessthrough several steps. The SEM samples were obtained by breaking a thin strip of the composite intension. The graphene layers in epoxy can be identified via color contrast caused by the polarized light.This method is qualitative because the color contrast often varies from one laboratory to another [19].However, it is an accurate and reliable technique to evaluate the graphene dispersion and distributionin polymer matrix. Figure 7 shows optical microscope images of cured nanocomposites for 1, 5 and10 wt % of graphene filled epoxy. The white spots and streaks as indicated by arrows are the graphenesheets. In all cases, the graphene can be seen to be dispersed all over the surface. The density ofgraphene sheets increases with its concentration. As such, these images indicate that the graphenedispersion in epoxy is reasonably uniform, which was further verified by the SEM analysis.
Polymers 2018, 10, x FOR PEER REVIEW 6 of 17
indentation forces are ranging from 1 mN to 10 N. The elastic moduli, stiffness, hardness, and max
displacement were obtained as the average value of all specimen tests. For a rigorous approach and
a realistic comparison, the testing conditions are the same for all specimens and for all weight
fractions.
Figure 6. Micro-indentation tests.
4. Results
4.1. Graphene Dispersion in Epoxy
The mechanical and physical properties of nanocomposites depend on the dispersion of filler
agent into the matrix. Here, the dispersion of graphene in epoxy was analyzed using optical and
scanning electron microscopes. The optical microscope specimens were produced by mounting a 5
mm × 5 mm × 5 mm composite cube in epoxy holder and polishing its surface to optical flatness
through several steps. The SEM samples were obtained by breaking a thin strip of the composite in
tension. The graphene layers in epoxy can be identified via color contrast caused by the polarized
light. This method is qualitative because the color contrast often varies from one laboratory to
another [19]. However, it is an accurate and reliable technique to evaluate the graphene dispersion
and distribution in polymer matrix. Figure 7 shows optical microscope images of cured
nanocomposites for 1, 5 and 10 wt % of graphene filled epoxy. The white spots and streaks as
indicated by arrows are the graphene sheets. In all cases, the graphene can be seen to be dispersed all
over the surface. The density of graphene sheets increases with its concentration. As such, these
images indicate that the graphene dispersion in epoxy is reasonably uniform, which was further
verified by the SEM analysis.
Figure 7. Overview nanocomposite fracture surfaces showing the graphene dispersion. Figure 7. Overview nanocomposite fracture surfaces showing the graphene dispersion.

Polymers 2018, 10, 667 7 of 17
Figures 7 and 8 show the scanning electron micrographs of the fracture surfaces of graphene filledepoxy strips. Figure 7 shows the overview of the nanocomposites identifying the graphene sheets,while Figure 8 provides the detailed view of each of the surfaces. In both cases, the nanographenesheets (NGP) are again indicated by single arrows. It may be noted that graphene is reasonably welldispersed in all the three composites. The wrinkled surface morphology of the graphene nanosheets isshown in Figure 8. According to Shen et al. [24], it is this morphology which plays an important role inenhancing mechanical interlocking and transferring load from the epoxy matrix to graphene sheets.
Polymers 2018, 10, x FOR PEER REVIEW 7 of 17
Figures 7 and 8 show the scanning electron micrographs of the fracture surfaces of graphene
filled epoxy strips. Figure 7 shows the overview of the nanocomposites identifying the graphene
sheets, while Figure 8 provides the detailed view of each of the surfaces. In both cases, the
nanographene sheets (NGP) are again indicated by single arrows. It may be noted that graphene is
reasonably well dispersed in all the three composites. The wrinkled surface morphology of the
graphene nanosheets is shown in Figure 8. According to Shen et al. [24], it is this morphology which
plays an important role in enhancing mechanical interlocking and transferring load from the epoxy
matrix to graphene sheets.
Figure 8. Enlarged view of nanocomposite fracture surfaces showing graphene morphology.
4.2. Graphene Nanoparticles (NGP) Effect
The mechanical properties of epoxy matrix with graphene additives specimens were evaluated
for each weight fraction using an indentation test. In this study, a CSM Micro-Hardness Tester with
a Vickers diamond indenter was used. A minimum of eight indentation tests were carried out for
every sample. Minimum distances of 0.5 mm between indentation marks were used to avoid any
hardening effect from previous tests. For all the micro-indentation tests carried out, the maximum
effort was set 1000 mN. The micro-indentation parameters used for the tests are: approach speed of
50 μm/min, contact load of 10 mN, load rate of 2000 mN/min, unload rate of 2000 mN/min,
maximum load of 1000 mN and 20 s of pause. The elastic moduli, indentation depth, stiffness and
hardness were determined as an average value of all specimen tests. For a rigorous approach and a
realistic comparison, the testing conditions were the same for all specimens. Micro-indentation tests
were performed using Vickers indenter, which monitors and records the load vs. displacement of
the indenter. Figure 9 shows the four steps of a micro-indentation tests:
First step: Vickers indenter approaches the surface.
Second step: Loading phase up to the maximum load. The maximum load applied was 1000
mN.
Third step: Holding the load. It was done to avoid the creep effect on the unloading
characteristics.
Fourth step: Unloading phase.
Figure 8. Enlarged view of nanocomposite fracture surfaces showing graphene morphology.
4.2. Graphene Nanoparticles (NGP) Effect
The mechanical properties of epoxy matrix with graphene additives specimens were evaluatedfor each weight fraction using an indentation test. In this study, a CSM Micro-Hardness Tester witha Vickers diamond indenter was used. A minimum of eight indentation tests were carried out forevery sample. Minimum distances of 0.5 mm between indentation marks were used to avoid anyhardening effect from previous tests. For all the micro-indentation tests carried out, the maximumeffort was set 1000 mN. The micro-indentation parameters used for the tests are: approach speedof 50 µm/min, contact load of 10 mN, load rate of 2000 mN/min, unload rate of 2000 mN/min,maximum load of 1000 mN and 20 s of pause. The elastic moduli, indentation depth, stiffness andhardness were determined as an average value of all specimen tests. For a rigorous approach and arealistic comparison, the testing conditions were the same for all specimens. Micro-indentation testswere performed using Vickers indenter, which monitors and records the load vs. displacement of theindenter. Figure 9 shows the four steps of a micro-indentation tests:
‚ First step: Vickers indenter approaches the surface.‚ Second step: Loading phase up to the maximum load. The maximum load applied was 1000 mN.‚ Third step: Holding the load. It was done to avoid the creep effect on the unloading characteristics.‚ Fourth step: Unloading phase.

Polymers 2018, 10, 667 8 of 17Polymers 2018, 10, x FOR PEER REVIEW 8 of 17
Figure 9. Representative plot of load versus displacement.
The indentation depths:
ht is the total depth under a load, Pt;
he is the elastic rebound depth during unloading;
hf is the residual impression depth;
ha is the surface displacement at the perimeter; and
hp is the contact indentation depth.
The contact stiffness, S, is defined as the slope at the beginning of the unloading curve.
4.3. Micro-Indentation Tests
For a qualitative and quantitative study, it is necessary to ensure test reproducibility. Figure 10
shows the indentation profile for epoxy matrix with 2.5 wt % of graphene additives. Only a
negligible difference was found between various indentation curves. From these curves, it appears
that specimens show little difference in maximum indentation depths under the same load level, for
example 13.96, 14.13, 14.02, and 13.99 µm. This can be explained by the indented zone, the presence
of graphene particles in Epoxy matrix, graphene/Matrix interface and possibility to have a minor
amount of pores in specimens.
Figure 10. Indentation profile for epoxy matrix, 2.5 wt %NGP.
Figure 9. Representative plot of load versus displacement.
The indentation depths:
ht is the total depth under a load, Pt;he is the elastic rebound depth during unloading;hf is the residual impression depth;ha is the surface displacement at the perimeter; andhp is the contact indentation depth.
The contact stiffness, S, is defined as the slope at the beginning of the unloading curve.
4.3. Micro-Indentation Tests
For a qualitative and quantitative study, it is necessary to ensure test reproducibility. Figure 10shows the indentation profile for epoxy matrix with 2.5 wt % of graphene additives. Only a negligibledifference was found between various indentation curves. From these curves, it appears that specimensshow little difference in maximum indentation depths under the same load level, for example 13.96,14.13, 14.02, and 13.99 µm. This can be explained by the indented zone, the presence of grapheneparticles in Epoxy matrix, graphene/Matrix interface and possibility to have a minor amount of poresin specimens.
Polymers 2018, 10, x FOR PEER REVIEW 8 of 17
Figure 9. Representative plot of load versus displacement.
The indentation depths:
ht is the total depth under a load, Pt;
he is the elastic rebound depth during unloading;
hf is the residual impression depth;
ha is the surface displacement at the perimeter; and
hp is the contact indentation depth.
The contact stiffness, S, is defined as the slope at the beginning of the unloading curve.
4.3. Micro-Indentation Tests
For a qualitative and quantitative study, it is necessary to ensure test reproducibility. Figure 10
shows the indentation profile for epoxy matrix with 2.5 wt % of graphene additives. Only a
negligible difference was found between various indentation curves. From these curves, it appears
that specimens show little difference in maximum indentation depths under the same load level, for
example 13.96, 14.13, 14.02, and 13.99 µm. This can be explained by the indented zone, the presence
of graphene particles in Epoxy matrix, graphene/Matrix interface and possibility to have a minor
amount of pores in specimens.
Figure 10. Indentation profile for epoxy matrix, 2.5 wt %NGP. Figure 10. Indentation profile for epoxy matrix, 2.5 wt %NGP.

Polymers 2018, 10, 667 9 of 17
4.4. Micro-Indentation Profiles
The load–displacement curves for each graphene-based nanocomposite are shown in Figure 11.These load–displacement curves help to analyze the elastic to plastic behavior of the specimens at thesurface. Figure 11 shows the P–δ relationships of NGP/epoxy samples measured using indentationapparatus. Compared to neat epoxy, the NGP/epoxy sample displays a significantly higher indentationload (P), e.g., the value of P is roughly increased by 3.7%, 8.2%, 19.6%, 21.8% and 22.7% for 0.5, 1,2.5, 5, and 10 wt %respectively at δ = 10 µm, which means that the graphene produced a significantcontribution to the overall indentation response of NGP/epoxy (Figure 12). The same observationcan be made for the displacement of the indenter. Indeed, with the addition of graphene particles,there is an increase in the stiffness, and, subsequently, a decrease in displacement for a force of1000 mN. In comparison to neat epoxy, the displacement decreases for 0.5, 1, 2.5, 5, and 10 wt % NGPsby 2.8%, 5.8%, 8.3%, 10.1% and 11.7%, respectively (Figure 12). For both Epoxy and Epoxy/NGPsamples, the indentation deformation could not be recovered after unloading, which means thattheir deformations were not elastic; there is a difference between the loading and unloading curves.In this figure, it can be observed that as the concentration of the additives increased, the rigidity of thematerial increased.
Polymers 2018, 10, x FOR PEER REVIEW 9 of 17
4.4. Micro-Indentation Profiles
The load–displacement curves for each graphene-based nanocomposite are shown in Figure 11.
These load–displacement curves help to analyze the elastic to plastic behavior of the specimens at
the surface. Figure 11 shows the P–δ relationships of NGP/epoxy samples measured using
indentation apparatus. Compared to neat epoxy, the NGP/epoxy sample displays a significantly
higher indentation load (P), e.g., the value of P is roughly increased by 3.7%, 8.2%, 19.6%, 21.8% and
22.7% for 0.5, 1, 2.5, 5, and 10 wt %respectively at δ = 10 μm, which means that the graphene
produced a significant contribution to the overall indentation response of NGP/epoxy (Figure 12).
The same observation can be made for the displacement of the indenter. Indeed, with the addition of
graphene particles, there is an increase in the stiffness, and, subsequently, a decrease in
displacement for a force of 1000 mN. In comparison to neat epoxy, the displacement decreases for
0.5, 1, 2.5, 5, and 10 wt % NGPs by 2.8%, 5.8%, 8.3%, 10.1% and 11.7%, respectively (Figure 12). For
both Epoxy and Epoxy/NGP samples, the indentation deformation could not be recovered after
unloading, which means that their deformations were not elastic; there is a difference between the
loading and unloading curves. In this figure, it can be observed that as the concentration of the
additives increased, the rigidity of the material increased.
(a) Neat epoxy (b) 0.5 wt %NGP
(c) 1 wt % NGP (d) 2.5 wt % NGP
(e) 5 wt % NGP (f) 10 wt % NGP
Figure 11. Indentation profile for epoxy matrix with graphene additives. Figure 11. Indentation profile for epoxy matrix with graphene additives.

Polymers 2018, 10, 667 10 of 17
Polymers 2018, 10, x FOR PEER REVIEW 10 of 17
Figure 12. Graphene effect on local mechanical behavior, indentation tests.
Figures 13 and 14 combine the calculated Young’s modulus and the maximum displacement as
a function of graphene weight fractions. The addition of graphene into epoxy matrix appears to have
enhanced the interfacial resistance, thereby increasing the elastic modulus from 2.7 GPa to 3.6 GPa.
This improvement is due to the high aspect ratio and intrinsic mechanical performance of graphene
in comparison to the epoxy matrix.
Figure 13. Effect of graphene additives on young modulus.
As shown in Figure 14, the NGP/epoxy samples showed much less indentation depth than Neat
Epoxy at 1000 mN. The lower indentation depth for the NGP/epoxy was affected by the percentage
of NGP. The graphene additives, therefore, can significantly improve the indentation resistance of
the polymer nanocomposite. The improved indentation resistance by NGP/epoxy can be identified
in the loading phase and the hold periods at Pmax.
Figure 12. Graphene effect on local mechanical behavior, indentation tests.
Figures 13 and 14 combine the calculated Young’s modulus and the maximum displacement as afunction of graphene weight fractions. The addition of graphene into epoxy matrix appears to haveenhanced the interfacial resistance, thereby increasing the elastic modulus from 2.7 GPa to 3.6 GPa.This improvement is due to the high aspect ratio and intrinsic mechanical performance of graphene incomparison to the epoxy matrix.
Polymers 2018, 10, x FOR PEER REVIEW 10 of 17
Figure 12. Graphene effect on local mechanical behavior, indentation tests.
Figures 13 and 14 combine the calculated Young’s modulus and the maximum displacement as
a function of graphene weight fractions. The addition of graphene into epoxy matrix appears to have
enhanced the interfacial resistance, thereby increasing the elastic modulus from 2.7 GPa to 3.6 GPa.
This improvement is due to the high aspect ratio and intrinsic mechanical performance of graphene
in comparison to the epoxy matrix.
Figure 13. Effect of graphene additives on young modulus.
As shown in Figure 14, the NGP/epoxy samples showed much less indentation depth than Neat
Epoxy at 1000 mN. The lower indentation depth for the NGP/epoxy was affected by the percentage
of NGP. The graphene additives, therefore, can significantly improve the indentation resistance of
the polymer nanocomposite. The improved indentation resistance by NGP/epoxy can be identified
in the loading phase and the hold periods at Pmax.
Figure 13. Effect of graphene additives on young modulus.
As shown in Figure 14, the NGP/epoxy samples showed much less indentation depth than NeatEpoxy at 1000 mN. The lower indentation depth for the NGP/epoxy was affected by the percentage ofNGP. The graphene additives, therefore, can significantly improve the indentation resistance of thepolymer nanocomposite. The improved indentation resistance by NGP/epoxy can be identified in theloading phase and the hold periods at Pmax.

Polymers 2018, 10, 667 11 of 17
Polymers 2018, 10, x FOR PEER REVIEW 11 of 17
Figure 14. Effect of graphene additives on maximum displacement.
Figure 15 shows that the graphene-reinforced epoxy matrix have a much greater resistance to
indentation than that of the individual stiffness of neat epoxy.
Figure 15. Effect of graphene additives on stiffness.
Figure 16 show the effect of graphene content on the hardness of the NGP/epoxy
nanocomposites. A significant improvement in hardness was observed with the addition of NGP.
The neat epoxy samples exhibit a hardness of 26.56 kgf/mm2, which increases to 28.90 (8.83%), 31.59
(19%), 33.37 (26%), 35.02 (32%) and 39.89 (50%) with the addition of 0.5 1, 2.5, 5 and 10 wt % NGP,
respectively. This increment in hardness is due to a good dispersion and interfacial bonding between
NGP and the epoxy matrix.
Figure 14. Effect of graphene additives on maximum displacement.
Figure 15 shows that the graphene-reinforced epoxy matrix have a much greater resistance toindentation than that of the individual stiffness of neat epoxy.
Polymers 2018, 10, x FOR PEER REVIEW 11 of 17
Figure 14. Effect of graphene additives on maximum displacement.
Figure 15 shows that the graphene-reinforced epoxy matrix have a much greater resistance to
indentation than that of the individual stiffness of neat epoxy.
Figure 15. Effect of graphene additives on stiffness.
Figure 16 show the effect of graphene content on the hardness of the NGP/epoxy
nanocomposites. A significant improvement in hardness was observed with the addition of NGP.
The neat epoxy samples exhibit a hardness of 26.56 kgf/mm2, which increases to 28.90 (8.83%), 31.59
(19%), 33.37 (26%), 35.02 (32%) and 39.89 (50%) with the addition of 0.5 1, 2.5, 5 and 10 wt % NGP,
respectively. This increment in hardness is due to a good dispersion and interfacial bonding between
NGP and the epoxy matrix.
Figure 15. Effect of graphene additives on stiffness.
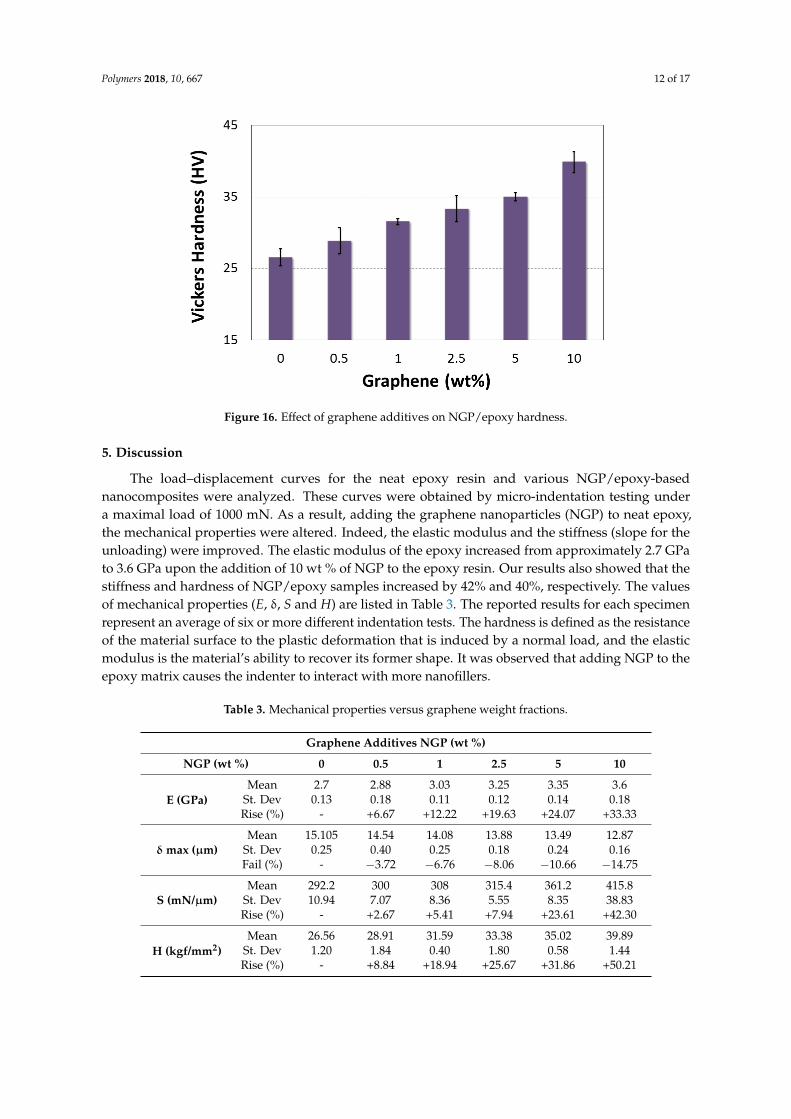
Figure 16 show the effect of graphene content on the hardness of the NGP/epoxy nanocomposites.A significant improvement in hardness was observed with the addition of NGP. The neat epoxy samplesexhibit a hardness of 26.56 kgf/mm2, which increases to 28.90 (8.83%), 31.59 (19%), 33.37 (26%),35.02 (32%) and 39.89 (50%) with the addition of 0.5 1, 2.5, 5 and 10 wt % NGP, respectively.This increment in hardness is due to a good dispersion and interfacial bonding between NGP and theepoxy matrix.
Polymers 2018, 10, 667 12 of 17
Polymers 2018, 10, x FOR PEER REVIEW 12 of 17
Figure 16. Effect of graphene additives on NGP/epoxy hardness.
5. Discussion
The load–displacement curves for the neat epoxy resin and various NGP/epoxy-based
nanocomposites were analyzed. These curves were obtained by micro-indentation testing under a
maximal load of 1000 mN. As a result, adding the graphene nanoparticles (NGP) to neat epoxy, the
mechanical properties were altered. Indeed, the elastic modulus and the stiffness (slope for the
unloading) were improved. The elastic modulus of the epoxy increased from approximately 2.7 GPa
to 3.6 GPa upon the addition of 10 wt % of NGP to the epoxy resin. Our results also showed that the
stiffness and hardness of NGP/epoxy samples increased by 42% and 40%, respectively. The values of
mechanical properties (E, δ, S and H) are listed in Table 3. The reported results for each specimen
represent an average of six or more different indentation tests. The hardness is defined as the
resistance of the material surface to the plastic deformation that is induced by a normal load, and the
elastic modulus is the material’s ability to recover its former shape. It was observed that adding NGP
to the epoxy matrix causes the indenter to interact with more nanofillers.
Table 3. Mechanical properties versus graphene weight fractions.
Graphene Additives NGP (wt %)
NGP (wt %) 0 0.5 1 2.5 5 10
E (GPa)
Mean 2.7 2.88 3.03 3.25 3.35 3.6
St. Dev 0.13 0.18 0.11 0.12 0.14 0.18
Rise (%) - +6.67 +12.22 +19.63 +24.07 +33.33
δ max (μm)
Mean 15.105 14.54 14.08 13.88 13.49 12.87
St. Dev 0.25 0.40 0.25 0.18 0.24 0.16
Fail (%) - −3.72 −6.76 −8.06 −10.66 −14.75
S (mN/µm)
Mean 292.2 300 308 315.4 361.2 415.8
St. Dev 10.94 7.07 8.36 5.55 8.35 38.83
Rise (%) - +2.67 +5.41 +7.94 +23.61 +42.30
H (kgf/mm2)
Mean 26.56 28.91 31.59 33.38 35.02 39.89
St. Dev 1.20 1.84 0.40 1.80 0.58 1.44
Rise (%) - +8.84 +18.94 +25.67 +31.86 +50.21
6. Finite Elements Analysis
In the previous sections, the experimental results of the indentation tests are summarized. In
this section, the numerical investigations performed using finite element methods are presented.
Figure 16. Effect of graphene additives on NGP/epoxy hardness.
5. Discussion
The load–displacement curves for the neat epoxy resin and various NGP/epoxy-basednanocomposites were analyzed. These curves were obtained by micro-indentation testing undera maximal load of 1000 mN. As a result, adding the graphene nanoparticles (NGP) to neat epoxy,the mechanical properties were altered. Indeed, the elastic modulus and the stiffness (slope for theunloading) were improved. The elastic modulus of the epoxy increased from approximately 2.7 GPato 3.6 GPa upon the addition of 10 wt % of NGP to the epoxy resin. Our results also showed that thestiffness and hardness of NGP/epoxy samples increased by 42% and 40%, respectively. The valuesof mechanical properties (E, δ, S and H) are listed in Table 3. The reported results for each specimenrepresent an average of six or more different indentation tests. The hardness is defined as the resistanceof the material surface to the plastic deformation that is induced by a normal load, and the elasticmodulus is the material’s ability to recover its former shape. It was observed that adding NGP to theepoxy matrix causes the indenter to interact with more nanofillers.
Table 3. Mechanical properties versus graphene weight fractions.
Graphene Additives NGP (wt %)
NGP (wt %) 0 0.5 1 2.5 5 10
E (GPa)Mean 2.7 2.88 3.03 3.25 3.35 3.6
St. Dev 0.13 0.18 0.11 0.12 0.14 0.18Rise (%) - +6.67 +12.22 +19.63 +24.07 +33.33
δ max (µm)Mean 15.105 14.54 14.08 13.88 13.49 12.87
St. Dev 0.25 0.40 0.25 0.18 0.24 0.16Fail (%) - ´3.72 ´6.76 ´8.06 ´10.66 ´14.75
S (mN/µm)Mean 292.2 300 308 315.4 361.2 415.8
St. Dev 10.94 7.07 8.36 5.55 8.35 38.83Rise (%) - +2.67 +5.41 +7.94 +23.61 +42.30
H (kgf/mm2)Mean 26.56 28.91 31.59 33.38 35.02 39.89
St. Dev 1.20 1.84 0.40 1.80 0.58 1.44Rise (%) - +8.84 +18.94 +25.67 +31.86 +50.21

Polymers 2018, 10, 667 13 of 17
6. Finite Elements Analysis
In the previous sections, the experimental results of the indentation tests are summarized. In thissection, the numerical investigations performed using finite element methods are presented.
6.1. Generation and Meshing of Micro-Indentation Model
A 3D structural solid element type C3D8R for specimen of composites based NGPs and epoxymatrix for modeling Vickers indenter was adopted by using Finite Element software ABAQUS.The mechanical properties are isotropic for epoxy matrix, NGPs and for the indenter (rigid) (Table 2).A homogenization procedure was necessary to evaluate the properties of the specimens with thedifferent percentages of NGPs. The indentation was simulated as a contact between rigid indenterand elastic specimens; no elasto-plastic effect was considered. The specimen was fixed on the bottomand lateral sections, and the rigid indenter was animated by a translation movement in the directionof thickness. Figure 17a shows the mesh of 1{4 models. As the effect of indentation is very localized,Figure 17b shows the studied part. We can also note the mesh used which is the result of the study ofthe mesh convergence. The mesh refinement around contact area was performed and, by consideringa good estimation of the indentation contact area, the mesh size was optimized for rapid convergence.The mesh size was arranged to be more refined in the indentation site, i.e., under Vickers indenter,and coarse at the others zones.
The total mesh of indentation geometry was composed of 45,310 linear hexahedral elements ofC3D8R for specimen, 4986 linear quadrilateral elements of R3D4 and 2 linear triangular elements ofR3D3 for rigid indenter. Figure 17 shows the schematic representation of the finite element mesh of1{4 model and an enlarged view of the contact region.
Polymers 2018, 10, x FOR PEER REVIEW 13 of 17
6.1. Generation and Meshing of Micro-Indentation Model
A 3D structural solid element type C3D8R for specimen of composites based NGPs and epoxy
matrix for modeling Vickers indenter was adopted by using Finite Element software ABAQUS. The
mechanical properties are isotropic for epoxy matrix, NGPs and for the indenter (rigid) (Table 2). A
homogenization procedure was necessary to evaluate the properties of the specimens with the
different percentages of NGPs. The indentation was simulated as a contact between rigid indenter
and elastic specimens; no elasto-plastic effect was considered. The specimen was fixed on the bottom
and lateral sections, and the rigid indenter was animated by a translation movement in the direction
of thickness. Figure 17a shows the mesh of ¼ models. As the effect of indentation is very localized,
Figure 17b shows the studied part. We can also note the mesh used which is the result of the study of
the mesh convergence. The mesh refinement around contact area was performed and, by
considering a good estimation of the indentation contact area, the mesh size was optimized for rapid
convergence. The mesh size was arranged to be more refined in the indentation site, i.e., under
Vickers indenter, and coarse at the others zones.
The total mesh of indentation geometry was composed of 45,310 linear hexahedral elements of
C3D8R for specimen, 4986 linear quadrilateral elements of R3D4 and 2 linear triangular elements of
R3D3 for rigid indenter. Figure 17 shows the schematic representation of the finite element mesh of
¼ model and an enlarged view of the contact region.
(a) Mesh of ¼ model (b) Delimitation of the contact zone
Figure 17. 3D Finite element model for indentation test simulation.
6.2. First Validation of Numerical Models
We developed a numerical model of micro-indentation of the composites based on the implicit
scheme using Abaqus FEA software. The force at each increment time was examined and correlated
to the experimental variations to validate our numerical model and enhance the convergence of
results. The boundary condition applied to the indenter is the displacement resulting from the
experimental results (Figure 18). The correlations between numerical and experimental load are
presented in Figure 19. A good correlation was found between the two methods. Comparable to
experimental variation, the numerical response presents three different zones: load phase, 15 s of
pause and unloading phase. A small difference is noted in the unloading phase beyond 30 s of
loading. This difference is due to the presence of damage. Thus, the numerical model could be
employed to simulate the indentation test. No damage criteria were executed in the numerical
model.
Figure 17. 3D Finite element model for indentation test simulation.
6.2. First Validation of Numerical Models
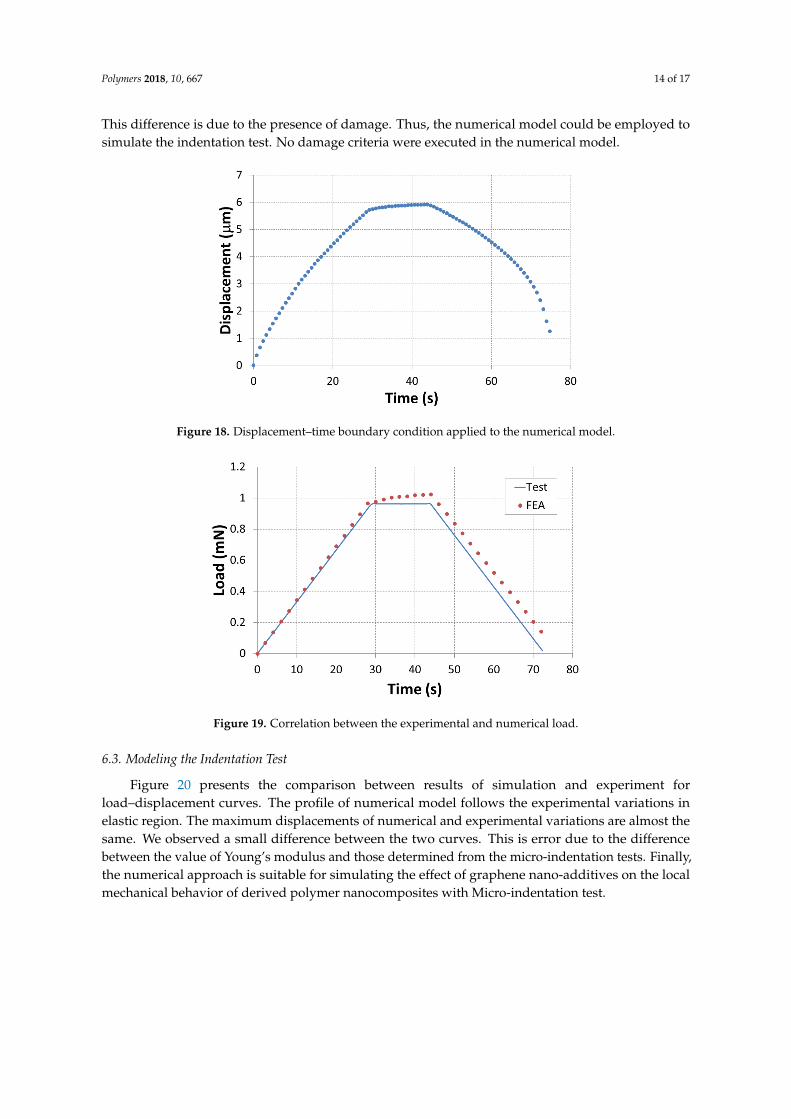
We developed a numerical model of micro-indentation of the composites based on the implicitscheme using Abaqus FEA software. The force at each increment time was examined and correlatedto the experimental variations to validate our numerical model and enhance the convergence ofresults. The boundary condition applied to the indenter is the displacement resulting from theexperimental results (Figure 18). The correlations between numerical and experimental load arepresented in Figure 19. A good correlation was found between the two methods. Comparable toexperimental variation, the numerical response presents three different zones: load phase, 15 s ofpause and unloading phase. A small difference is noted in the unloading phase beyond 30 s of loading.
Polymers 2018, 10, 667 14 of 17
This difference is due to the presence of damage. Thus, the numerical model could be employed tosimulate the indentation test. No damage criteria were executed in the numerical model.Polymers 2018, 10, x FOR PEER REVIEW 14 of 17
Figure 18. Displacement–time boundary condition applied to the numerical model.
Figure 19. Correlation between the experimental and numerical load.
6.3. Modeling the Indentation Test
Figure 20 presents the comparison between results of simulation and experiment for load–
displacement curves. The profile of numerical model follows the experimental variations in elastic
region. The maximum displacements of numerical and experimental variations are almost the same.
We observed a small difference between the two curves. This is error due to the difference between
the value of Young’s modulus and those determined from the micro-indentation tests. Finally, the
numerical approach is suitable for simulating the effect of graphene nano-additives on the local
mechanical behavior of derived polymer nanocomposites with Micro-indentation test.
Figure 18. Displacement–time boundary condition applied to the numerical model.
Polymers 2018, 10, x FOR PEER REVIEW 14 of 17
Figure 18. Displacement–time boundary condition applied to the numerical model.
Figure 19. Correlation between the experimental and numerical load.
6.3. Modeling the Indentation Test
Figure 20 presents the comparison between results of simulation and experiment for load–
displacement curves. The profile of numerical model follows the experimental variations in elastic
region. The maximum displacements of numerical and experimental variations are almost the same.
We observed a small difference between the two curves. This is error due to the difference between
the value of Young’s modulus and those determined from the micro-indentation tests. Finally, the
numerical approach is suitable for simulating the effect of graphene nano-additives on the local
mechanical behavior of derived polymer nanocomposites with Micro-indentation test.
Figure 19. Correlation between the experimental and numerical load.
6.3. Modeling the Indentation Test
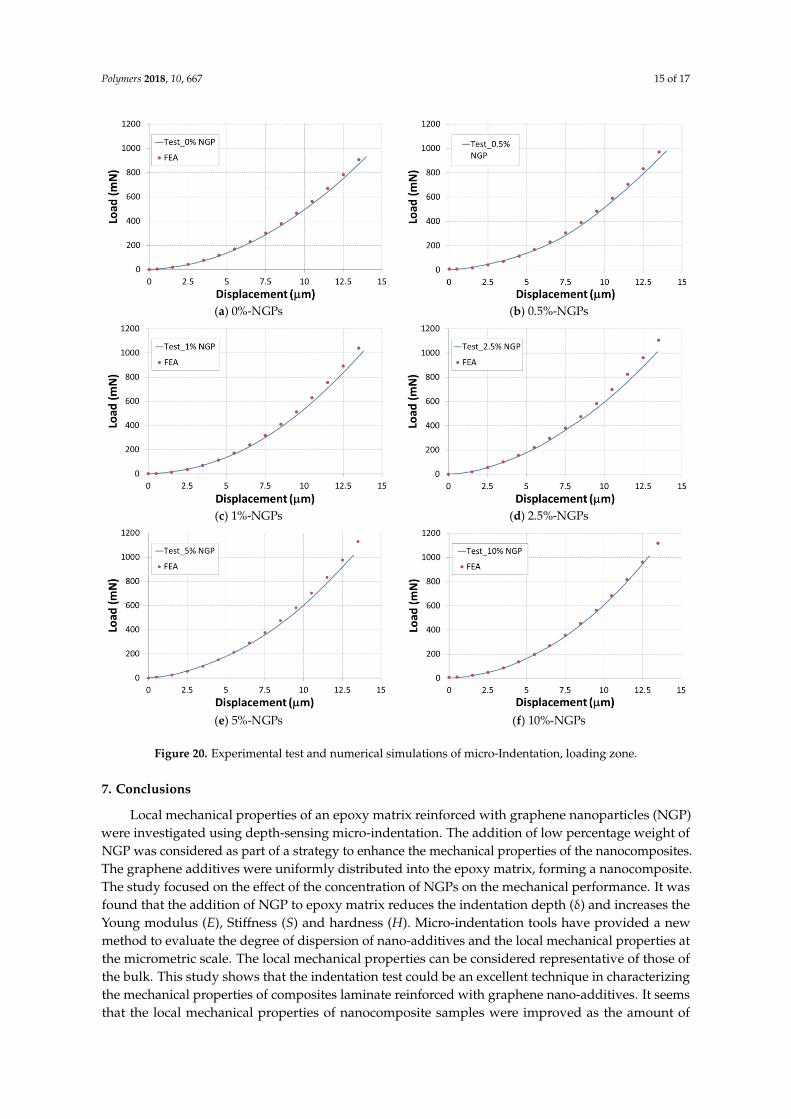
Figure 20 presents the comparison between results of simulation and experiment forload–displacement curves. The profile of numerical model follows the experimental variations inelastic region. The maximum displacements of numerical and experimental variations are almost thesame. We observed a small difference between the two curves. This is error due to the differencebetween the value of Young’s modulus and those determined from the micro-indentation tests. Finally,the numerical approach is suitable for simulating the effect of graphene nano-additives on the localmechanical behavior of derived polymer nanocomposites with Micro-indentation test.
Polymers 2018, 10, 667 15 of 17Polymers 2018, 10, x FOR PEER REVIEW 15 of 17
(a) 0%-NGPs (b) 0.5%-NGPs
(c) 1%-NGPs (d) 2.5%-NGPs
(e) 5%-NGPs (f) 10%-NGPs
Figure 20. Experimental test and numerical simulations of micro-Indentation, loading zone.
7. Conclusions
Local mechanical properties of an epoxy matrix reinforced with graphene nanoparticles (NGP)
were investigated using depth-sensing micro-indentation. The addition of low percentage weight of
NGP was considered as part of a strategy to enhance the mechanical properties of the
nanocomposites. The graphene additives were uniformly distributed into the epoxy matrix, forming
a nanocomposite. The study focused on the effect of the concentration of NGPs on the mechanical
performance. It was found that the addition of NGP to epoxy matrix reduces the indentation depth
(δ) and increases the Young modulus (E), Stiffness (S) and hardness (H). Micro-indentation tools
have provided a new method to evaluate the degree of dispersion of nano-additives and the local
mechanical properties at the micrometric scale. The local mechanical properties can be considered
representative of those of the bulk. This study shows that the indentation test could be an excellent
technique in characterizing the mechanical properties of composites laminate reinforced with
graphene nano-additives. It seems that the local mechanical properties of nanocomposite samples
were improved as the amount of nano-additives increased. Based on the curve displacement and
surface imaging, the influence of nano-additives on the overall plastic mechanical behavior is
Figure 20. Experimental test and numerical simulations of micro-Indentation, loading zone.
7. Conclusions
Local mechanical properties of an epoxy matrix reinforced with graphene nanoparticles (NGP)were investigated using depth-sensing micro-indentation. The addition of low percentage weight ofNGP was considered as part of a strategy to enhance the mechanical properties of the nanocomposites.The graphene additives were uniformly distributed into the epoxy matrix, forming a nanocomposite.The study focused on the effect of the concentration of NGPs on the mechanical performance. It wasfound that the addition of NGP to epoxy matrix reduces the indentation depth (δ) and increases theYoung modulus (E), Stiffness (S) and hardness (H). Micro-indentation tools have provided a newmethod to evaluate the degree of dispersion of nano-additives and the local mechanical properties atthe micrometric scale. The local mechanical properties can be considered representative of those ofthe bulk. This study shows that the indentation test could be an excellent technique in characterizingthe mechanical properties of composites laminate reinforced with graphene nano-additives. It seemsthat the local mechanical properties of nanocomposite samples were improved as the amount of

Polymers 2018, 10, 667 16 of 17
nano-additives increased. Based on the curve displacement and surface imaging, the influence ofnano-additives on the overall plastic mechanical behavior is noticeable. A proper numerical modelwas developed for validating the experimental results. A small difference between two approacheswas remarked and defined by the projected contact area and the graphene nano-additive distribution.It seems that graphene tends to improve the fracture toughness of composite and interfacial resistance.
Author Contributions: You have attached the contribution of each of the authors: D.D. worked on the processand production aspects of the specimens; A.M. has prepared the test specimens for tests; I.B. performed theindentation tests; and M.T. and K.L. analyzed the data and wrote the paper.
Funding: This research received no external funding.
Conflicts of Interest: The authors declare no conflicts of interest.
References
1. Tarfaoui, M.; Lafdi, K.; El Moumen, A. Mechanical properties of carbon nanotubes based polymer composites.Compos. Part B Eng. 2016, 103, 113–121. [CrossRef]
2. El Moumen, A.; Tarfaoui, M.; Lafdi, K. Mechanical characterization of carbon nanotubes based polymercomposites using indentation tests. Compos. Part. B Eng. 2017, 114, 1–7. [CrossRef]
3. El Moumen, A.; Tarfaoui, M.; Hassoon, O.; Lafdi, K.; Benyahia, H.; Nachtane, M. Experimental study andnumerical modelling of low velocity impact on laminated composite reinforced with thin film made ofcarbon nanotubes. Appl. Compos. Mater. 2018, 25, 309–320. [CrossRef]
4. Cong, L.; Li, X.; Ma, L.; Peng, Z.; Yang, C.; Han, P.; Wang, G.; Li, H.; Song, W.; Song, G. High-performancegraphene oxide/carbon nanotubes aerogel polystyrene composites: Preparation and mechanical properties.Mater. Lett. 2018, 214, 190–193. [CrossRef]
5. Tarfaoui, M.; Gning, P.B.; Hamitouche, L. Dynamic response and damage modeling of glass/epoxy tubularstructures: Numerical investigation. Compos. Part A Appl. Sci. Manuf. 2008, 39, 1–12. [CrossRef]
6. Tarfaoui, M.; Gning, P.B.; Collombet, F. Residual strength of damaged glass/epoxy tubular structures.J. Compos. Mater. 2007, 41, 2165–2182. [CrossRef]
7. Tarfaoui, M.; El Moumen, A.; Lafdi, K. Progressive damage modeling in carbon fibers/carbon nanotubesreinforced polymer composites. Compos. Part B Eng. 2017, 112, 185–195. [CrossRef]
8. Tanga, L.; Yanga, Z.; Duana, F.; Chena, M. Fabrication of graphene sheets/polyaniline nanofibers compositeforenhanced supercapacitor properties. Colloids Surf. A Physicochem. Eng. Asp. 2017, 520, 184–192. [CrossRef]
9. Zhang, H.-B.; Zheng, W.-G.; Yan, Q.; Jiang, Z.-G.; Yu, Z.-Z. The effect of surface chemistry of graphene onrheological and electrical properties of polymethylmethacrylate composites. Carbon 2012, 50, 5117–5125.[CrossRef]
10. Ahmad, S.-R.; Xue, C.; Young, R.-J. The mechanisms of reinforcement of polypropylene by graphenenanoplatelets. Mater. Sci. Eng. B 2017, 216, 2–9. [CrossRef]
11. Xiang, M.; Li, C.; Ye, L. In situ synthesis of monomer casting nylon-6/reduced graphene oxidenanocomposites: Intercalation structure and electrically conductive properties. J. Ind. Eng. Chem. 2017, 50,123–132. [CrossRef]
12. Hu, K.; Kulkarni, D.; Choi, I.; Tsukruk, V. Graphene-polymer nanocomposites for structural and functionalapplications. Prog. Polym. Sci. 2014, 39, 1934–1972. [CrossRef]
13. Atif, R.; Shyha, I.; Inam, F. Mechanical, Thermal, and Electrical Properties of Graphene-EpoxyNanocomposites—A Review. Polymers 2016, 8, 281. [CrossRef]
14. Kuilla, T.; Bhadra, S.; Yao, D.-H.; Kim, N.-H.; Bose, S.; Lee, J.-H. Recent advances in graphene based polymercomposite. Prog. Polym. Sci. 2010, 35, 1350–1375. [CrossRef]
15. Kim, H.; Miura, Y.; Macosko, C.W. Graphene/Polyurethane Nanocomposites for Improved Gas Barrier andElectrical Conductivity. Chem. Mater. 2010, 22, 3441–3450. [CrossRef]
16. Tang, L.-C.; Wan, Y.-J.; Yan, D.; Pei, Y.-B.; Zhao, L.; Li, Y.-B.; Wu, L.-B.; Jiang, J.-X.; Lai, G.-Q. The effect ofgraphene dispersion on the mechanical properties of graphene/epoxy composites. Carbon 2013, 60, 16–27.[CrossRef]
17. Yao, H.; Hawkins, S.A.; Sue, H.J. Preparation of epoxy nanocomposites containing well-dispersed graphenenanosheets. Compos. Sci. Technol. 2017, 146, 161–168. [CrossRef]

Polymers 2018, 10, 667 17 of 17
18. Naebe, M.; Wang, J.; Amini, A.; Khayyam, H.; Hameed, N.; Li, L.H.; Chen, Y.; Fox, B. Mechanical propertyand structure of covalent functionalized graphene/epoxy nanocomposites. Sci. Rep. 2014, 4, 4375. [CrossRef][PubMed]
19. Salom, C.; Prolongo, M.G.; Toribio, A.; Martínez-Martínez, A.J.; Aguirre de Cárcer, I.; Prolongo, S.G.Mechanical properties and adhesive behavior of epoxygraphene nanocomposites. Int. J. Adhes. Adhes.2018, 44, 119–125. [CrossRef]
20. Alexopoulos, N.D.; Paragkamian, Z.; Poulin, P.; Kourkoulis, S.K. Fracture related mechanical properties oflow and high graphene reinforcement of epoxy nanocomposites. Compos. Sci. Technol. 2017, 150, 194–204.[CrossRef]
21. Manjunatha, G.; George, R.; Hiremath, I. Functionalized graphene for epoxy composites with improvedmechanical properties. Am. J. Mater. Sci. 2016, 6, 41–46.
22. Ferreira, F.V.; Brito, F.S.; Franceschi, W.; Simonetti, E.A.N.; Cividanes, L.S.; Chipara, M.; Lozano, K.Functionalized graphene oxide as reinforcement in epoxy based nanocomposites. Surf. Interfaces 2018,10, 100–109. [CrossRef]
23. Gojny, F.H.; Wichmann, M.H.G.; Kopke, U.; Fiedler, B.; Schulte, K. Carbon nanotube-reinforcedepoxy-composites: Enhanced stiffness and fracture toughness at low nanotube content. Compos. Sci.Technol. 2004, 64, 2363–2371. [CrossRef]
24. Shen, X.; Pei, X.; Fu, S.; Friedrich, K. Significantly modified tribological performance of epoxy nanocompositesat very low graphene oxide content. Polymer 2013, 54, 1234–1242. [CrossRef]
© 2018 by the authors. Licensee MDPI, Basel, Switzerland. This article is an open accessarticle distributed under the terms and conditions of the Creative Commons Attribution(CC BY) license (http://creativecommons.org/licenses/by/4.0/).