north wales combined authority annual progress … · dave jones – pollution control officer...
TRANSCRIPT

North Wales Combined Authority Annual Progress Report 2017
Bureau Veritas
September 2017
Document Control Sheet
Issue/Revision Issue 1 Issue 2
Remarks Draft Final
Date August 2017 September 2017
Submitted to Robert Johnston Robert Johnston
Prepared by Hannah Smith – Senior Consultant
Hannah Smith – Senior Consultant
Signature
Approved by Jamie Clayton Jamie Clayton
Signature
Project number 6461908
Disclaimer
This Report was completed by Bureau Veritas on the basis of a defined programme of work and terms and conditions agreed with the Client. Bureau Veritas’ confirms that in preparing this Report it has
exercised all reasonable skill and care taking into account the project objectives, the agreed scope of works, prevailing site conditions and the degree of manpower and resources allocated to the project.
Bureau Veritas accepts no responsibility to any parties whatsoever, following the issue of the Report, for
any matters arising outside the agreed scope of the works.
This Report is issued in confidence to the Client and Bureau Veritas has no responsibility to any third parties to whom this Report may be circulated, in part or in full, and any such parties rely on the
contents of the report solely at their own risk.
Unless specifically assigned or transferred within the terms of the agreement, the consultant asserts and retains all Copyright, and other Intellectual Property Rights, in and over the Report and its contents.
Any questions or matters arising from this Report should be addressed in the first instance to the report
author.
North Wales Combined Authority
LAQM Progress Report 2017 i
North Wales Combined Authority 2017 Air Quality Progress Report In fulfillment of Part IV of the Environment Act 1995 Local Air Quality Management September, 2017

North Wales Combined Authority
LAQM Progress Report 2017 ii
Eilir Rhiannon Thomas – Public Protection Isle of Anglesey County Council Council Offices Llangefni Anglesey LL77 7TW Tel: 01248 752820 Email: [email protected]
Simon Contrill – Principal Environment Officer Conwy County Borough Council Civic Offices Colwyn Bay Conwy LL29 6DW Tel: 01492 575266 Email: [email protected]
Andrew Lord - Public Protection Business Manager Denbighshire County Council PO Box 62 Ruthin Denbighshire LL15 9AZ Tel: 01824 706087 Email: [email protected]
Dave Jones – Pollution Control Officer Flintshire County Council Pollution Control Section Country Hall Mold CH7 6NF Tel: 01352 703276 Email: [email protected]
David A Williams – Environment Officer Gwynedd Council Dwyfor Area Office Ffordd y Cob Pwllheli Gwynedd LL53 5AA Tel: 01758 704125 Email: [email protected]
Robert Johnston – Environmental Health & Housing Standards Lead Wrexham County Borough Council Environment and Planning Department, Ruthin Road Wrexham LL13 7TU Tel: 01978 297425 Email: [email protected]
Report Reference Number 6461908 Date September 2017

North Wales Combined Authority
LAQM Progress Report 2017 i
Executive Summary Part IV of the Environment Act 1995 places a statutory duty on local authorities to
review and assess the air quality within their area and take account of Government
Guidance when undertaking such work. This Annual Progress Report is a
requirement of the Sixth Round of Review and Assessment and is a requirement for
all local authorities. The Report covers the 6 local authorities which encompass the
North Wales region (The North Wales Combined Authority). The local authorities are
as follows:
Isle of Anglesey County Council (IACC)
Conwy County Borough Council (CCBC)
Denbighshire County Council (DCC)
Flintshire County Council (FCC)
Gwynedd Council (GC)
Wrexham County Borough Council (WCBC)
The Report has been undertaken in accordance with the Technical Guidance
LAQM.TG (16) and associated tools.
This annual progress report considers all new monitoring data within the North Wales
Combined Authority and assesses the data against the Air Quality Strategy (AQS)
objectives. It also considers any changes that may have an impact on air quality.
Automatic monitoring was carried out in IACC and WCBC. The four Osiris monitoring
stations measuring PM10 and PM2.5 in IACC reported no exceedances of the annual and
24-hour mean PM10 AQS objectives or the PM2.5 target value. The AURN station located
in WCBC measured NO2, PM10, PM2.5 and SO2 concentrations in 2016. Similar to the
stations in IACC, no exceedances of the relevant AQS objectives or target values for any
measured pollutant was reported.
Diffusion tube NO2 monitoring was carried out throughout the North Wales Combined
Authority at key locations within town centres and along the main transport links
throughout North Wales. Only one exceedance was reported, at a diffusion tube in IACC.
NO2 concentrations at this site have either exceeded or been within 10% of the
annual mean AQS objective for the past 5 years. The diffusion tube is located along

North Wales Combined Authority
LAQM Progress Report 2017 ii
the A55 at a kerbside location. There are no nearby sensitive receptors and as a
consequence the site does not represent relevant exposure.
There were no other diffusion tube monitoring sites in 2016 where the annual mean
AQS objective for NO2 was exceeded.
WCBC also monitored benzene at one diffusion tube location near an acid tar
lagoon. No exceedances of the annual mean AQS objective for benzene have been
reported for the past 5 years.
Having considered each pollutant and reviewed the new developments approved in
2016, it can be concluded that there is no requirement for any of the six local
authorities within the North Wales Combined Authority to undertake a detailed
assessment.
The North Wales Combined Authority will continue to maintain their monitoring
programmes and ensure new monitoring sites are installed as required.

North Wales Combined Authority
LAQM Progress Report 2017 i
Table of Contents
Executive Summary ............................................................................... i 1 Introduction .................................................................................... 1
1.1 Description of Local Authority Areas ......................................................... 1
1.2 Purpose of Progress Report ..................................................................... 4
1.3 Air Quality Objectives ............................................................................... 4
1.4 Summary of Previous Review and Assessments...................................... 6
2 New Monitoring Data ..................................................................... 8
2.1 Summary of Monitoring Undertaken ......................................................... 8
2.2 Comparison of Monitoring Results with Air Quality Objectives ............... 34
3 New Local Developments ............................................................ 63
3.1 Road Traffic Sources .............................................................................. 63
3.2 Other Transport Sources ........................................................................ 64
3.3 Industrial Sources ................................................................................... 65
3.4 Commercial and Domestic Sources ........................................................ 66
3.5 New Developments with Fugitive or Uncontrolled Sources .................... 66
4 Air Quality Planning Policies ...................................................... 68
5 Local Transport Plans and Strategies ........................................ 69
6 Conclusions and Proposed Actions ........................................... 71
6.1 Conclusions from New Monitoring Data .................................................. 71
6.2 Other Conclusions .................................................................................. 71
6.3 Proposed Actions .................................................................................... 71
7 References ................................................................................... 72

North Wales Combined Authority
LAQM Progress Report 2017 ii
List of Tables Table 1.1 – Air Quality Objectives included in Regulations for the purpose of LAQM in Wales .......................................................................................................................... 5
Table 1.2 – Summary of Previous Rounds of Review and Assessment in the North Wales Combines Authority .......................................................................................... 6
Table 2.1 – Details of Automatic Monitoring Sites in the North Wales Combined Authority .................................................................................................................... 11
Table 2.2 – Details of Non- Automatic Monitoring Sites in the North Wales Combined Authority .................................................................................................................... 21
Table 2.3 – Results of Automatic Monitoring for NO2: Comparison with Annual Mean Objective.................................................................................................................... 35
Table 2.4 – Results of Automatic Monitoring for NO2: Comparison with 1-hour Mean Objective.................................................................................................................... 35
Table 2.5 – Results of NO2 Diffusion Tubes 2016 ..................................................... 40
Table 2.6 – Results of Automatic Monitoring for PM10: Comparison with Annual Mean Objective.................................................................................................................... 57
Table 2.7 – Results of Automatic Monitoring for PM10: Comparison with 24-hour Mean Objective .......................................................................................................... 57
Table 2.8 – Results of PM2.5 Automatic Monitoring ................................................... 59
Table 2.9 – Results of SO2 Automatic Monitoring ...................................................... 60
Table 2.10 – Results of Benzene Diffusion Tube Monitoring ..................................... 61
Table 3.1 – Approved Planning Applications: Road Traffic Sources .......................... 63
Table 3.2 – Approved Planning Applications: Industrial Sources ............................... 65
Table 3.3 – Approved Planning Applications: Commercial and Domestic Sources ... 66
Table A.1 – Short-Term to Long-Term Monitoring NO2 Adjustment: Non-Automatic Stations...................................................................................................................... 79
Table A.2 – Short-Term to Long-Term Monitoring PM10 Adjustment ......................... 79
Table A.3 – Short-Term to Long-Term Monitoring PM2.5 Adjustment ......................... 79
Table B.1 – Results of NO2 Diffusion Tubes (2012 to 2016): Isle of Anglesey .......... 80
Table B.2 – Results of NO2 Diffusion Tubes (2012 to 2016): Conwy Borough Council80
Table B.3 – Results of NO2 Diffusion Tubes (2012 to 2016): Denbighshire County Council ...................................................................................................................... 81
Table B.4 – Results of NO2 Diffusion Tubes (2012 to 2016): Flintshire Council ........ 82
Table B.5 – Results of NO2 Diffusion Tubes (2012 to 2016): Gwynedd Council ........ 85
Table B.6 – Results of NO2 Diffusion Tubes (2012 to 2016): Wrexham County Borough Council ........................................................................................................ 86
Table C.1- Full Monthly Diffusion Tube Results for 2016: Isle of Anglesey County Council ...................................................................................................................... 87
Table C.2- Full Monthly Diffusion Tube Results for 2016: Conwy County Borough Council ...................................................................................................................... 88
North Wales Combined Authority
LAQM Progress Report 2017 iii
Table C.3- Full Monthly Diffusion Tube Results for 2016: Denbighshire County Council ...................................................................................................................... 88
Table C.4- Full Monthly Diffusion Tube Results for 2016: Gwynedd Council ............ 90
Table C.5- Full Monthly Diffusion Tube Results for 2016: Flintshire Council ............. 90
Table C.6- Full Monthly Diffusion Tube Results for 2016: Wrexham County Borough Council ...................................................................................................................... 93
List of Figures Figure 2.1 – Map of Automatic Monitoring Site: Isle of Anglesey County Council ....... 9
Figure 2.2 – Map of Automatic Monitoring Site: Isle of Anglesey County Council – Felin Cafnan, close to the Wylfa Newydd construction site ......................................... 9
Figure 2.3 – Map of Automatic Monitoring Site: Wrexham County Borough Council . 10
Figure 2.4 – Map of non-Automatic Monitoring Sites: Isle of Anglesey County Council – Llanfairpwllgwyngyll and Llangefni ......................................................................... 13
Figure 2.5 – Map of non-Automatic Monitoring Sites: Isle of Anglesey County Council – Along the A55 and A5025 ....................................................................................... 13
Figure 2.6 – Map of non-Automatic Monitoring Sites: Isle of Anglesey County Council – Along A5025, Cemaes and Amlwch ....................................................................... 14
Figure 2.7 – Map of non-Automatic Monitoring Sites: Denbighshire County Council – Ruthin ........................................................................................................................ 14
Figure 2.8 – Map of non-Automatic Monitoring Sites: Denbighshire County Council – Denigh ....................................................................................................................... 15
Figure 2.9 – Map of non-Automatic Monitoring Sites: Denbighshire County Council – North .......................................................................................................................... 15
Figure 2.10 – Map of non-Automatic Monitoring Sites: Conwy County Borough Council – A55 by Llanfairfechan ................................................................................ 16
Figure 2.11 – Map of non-Automatic Monitoring Sites: Conwy County Borough Council – Wider Area ................................................................................................. 16
Figure 2.12 – Map of non-Automatic Monitoring Sites: Gwynedd Council – Wider Area ........................................................................................................................... 17
Figure 2.13 – Map of non-Automatic Monitoring Sites: Gwynedd Council – Pwllhei .. 17
Figure 2.14 – Map of non-Automatic Monitoring Sites: Flintshire County Council Wider Area ................................................................................................................. 18
Figure 2.15 – Map of non-Automatic Monitoring Sites: Flintshire County Council – Rhewl Mostyn and Treffynnon Holywell areas ........................................................... 18
Figure 2.16 – Map of non-Automatic Monitoring Sites: Flintshire County Council – Hope Area ................................................................................................................. 19
Figure 2.17 – Map of non-Automatic Monitoring Sites: Wrexham County Borough Council – South ........................................................................................................ 19
Figure 2.18 – Map of non-Automatic Monitoring Sites: Wrexham County Borough Council – North ......................................................................................................... 20
Figure 2.19 – Trends in Annual Mean NO2 Concentrations Measured at Automatic Monitoring Stations .................................................................................................... 36

North Wales Combined Authority
LAQM Progress Report 2017 iv
Figure 2.20 – Trends in Annual Mean Nitrogen Dioxide Concentrations Measured at Diffusion Tube Monitoring Sites: Isle of Anglesey County Council ............................ 48
Figure 2.21 – Trends in Annual Mean Nitrogen Dioxide Concentrations Measured at Diffusion Tube Monitoring Sites: Conwy County Borough Council ............................ 49
Figure 2.22 – Trends in Annual Mean Nitrogen Dioxide Concentrations Measured at Diffusion Tube Monitoring Sites: Denbighshire County Council................................. 50
Figure 2.23 – Trends in Annual Mean Nitrogen Dioxide Concentrations Measured at Diffusion Tube Monitoring Sites: Flintshire Council <20µg/m3 in 2016 ...................... 51
Figure 2.24 – Trends in Annual Mean Nitrogen Dioxide Concentrations Measured at Diffusion Tube Monitoring Sites: Flintshire Council >20µg/m3 in 2016 ...................... 52
Figure 2.25 – Trends in Annual Mean Nitrogen Dioxide Concentrations Measured at Diffusion Tube Monitoring Sites: Gwynedd Council ................................................... 53
Figure 2.26 – Trends in Annual Mean Nitrogen Dioxide Concentrations Measured at Diffusion Tube Monitoring Sites: Wrexham County Borough Council ........................ 54
Figure 2.27 – Trends in Annual Mean PM10 Concentrations ..................................... 58
Figure 2.28 – Trends in Annual Mean PM2.5 Concentrations at the AURN Continuous Monitoring Site ........................................................................................................... 60
Figure 2.29 – Trends in SO2 Concentrations ............................................................. 61
Figure 2.30 – Trends in Annual Mean Benzene Concentrations ............................... 62
Figure A.1 – Factor from Local Co-Location Study .................................................... 74
Figure A.2 – Fall-off Distance Correction of DT4: Isle of Anglesey County Council ... 78
Figure A.3 – Fall-off Distance Correction of Site 57: Flintshire Council ..................... 78
Appendices Appendix A: Quality Assurance / Quality Control (QA/QC) Data
Appendix B: Complete Monitoring Results (2012-2016)
Appendix C: Full Monthly Diffusion Tube Results for 2016

North Wales Combined Authority
LAQM Progress Report 2017 1
1 Introduction 1.1 Description of Local Authority Areas The North Wales Combined Authority Area is comprised of six local authorities. A
summary of each local authority and their main pollution sources can be found below.
There are no Air Quality Management Areas (AQMAs) declared in any of the six local
authority areas.
Isle of Anglesey County Council Isle of Anglesey County Council (IACC) is an island situated off the coast of north-
west Wales. It is linked to the mainland by two bridges, Telford’s Menai Suspension
Bridge and Stephenson’s Britannia Bridge. IACC is predominately rural in nature with
a number of scattered towns and villages throughout. The Council serves a resident
population of approximately 67,8001 with the majority of whom are situated in the
larger towns of Holyhead, Llangefni, Amlwch, Menai Bridge and Beaumaris.
The island suffers from significant job losses and outward migration due to the
closure of a number of industrial processes. IACC has been declared as an
Enterprise Zone focusing on Energy by the Welsh Government in an attempt to bring
low carbon energy industrial activities onto the island. The industrial emissions from
such activities will likely be a source of air pollution on the island. Furthermore,
Holyhead remains a principal shipping port serving Dublin and as a tourist stop for
Snowdonia National Park. Road traffic emissions also contribute to pollution levels,
notably along the A55 duel carriage way which begins at Holyhead and runs in a
south-easterly direction across the island. The A55 is the most heavily used road on
the island and helps alleviate congestion on the A5 which travels through many of the
towns and villages.
Conwy County Borough Council Conwy County Borough Council (CCBC) is bounded by the Irish Sea to the north,
with the coastal boundary stretching for 37 miles between Llanfairfechan in the west
to the River Clwyd in the east. CCBC extends down to Dolwyddelan and across to
Carrigydrudion in the southwest. The Borough serves a total resident population of

North Wales Combined Authority
LAQM Progress Report 2017 2
approximately 115,2001, the majority of which are settled along the coastal strip in
the larger towns of Abergele, Colwyn Bay and Llandudno. Approximately 35% of the
geographical area of CCBC lies within Snowdonia National Park. As a consequence,
the number of residents and visitors increase dramatically during the summer months
due to high levels of tourism.
CCBC is a main trunk route through North Wales and therefore the major arterial
roads are a significant source of pollution from emissions from road vehicles. In
particular, the A55 dual carriage way which is the main trunk route between the
northwest and Holyhead ferry port and the A470 single carriage way which leads
inland to Snowdonia.
Denbighshire County Council Denbighshire County Council (DCC) covers an area extending from Rhyl and
Prestatyn, through the Vale of Clwyd, as far south as Corwen and Llangollen. DCC is
largely rural in character with tourism and agriculture being the main industries. The
Council serves a total resident population of approximately 93,7001, the majority of
which are located in the largest coastal towns of Rhyl and Prestatyn.
The main source of air pollution in DCC is road traffic emissions from major roads,
notably the A55, A5 and A494. The A55 crosses north Denbighshire providing direct
links to the national motorway network, whilst the A5 crosses the county linking
through to Snowdonia in the south. The A494 runs across the county linking Chester
to Dolgellau.
Flintshire County Council Flintshire County Council (FCC) is the north-eastern gateway to Wales. It is bounded
by Wrexham in the south, Denbighshire to the west and Cheshire to the east. The
extreme north-west of the Council area is bounded by the Irish Sea with the tidal
estuary of the River Dee acting as the local authority boundary. FCC is largely rural in
character however the coast along the Dee estuary is heavily developed by industry
and the northern coast much developed for tourism. The Council serves a total
resident population of approximately 152,5001, the majority of which are located in
1 Source : Office of National Statistics - 2011 Census Published 11th July 2012 (http://ons.gov.uk)

North Wales Combined Authority
LAQM Progress Report 2017 3
the larger towns of Buckley, Connah’s Quay, Flint, Hawarden, Holywell, Mold,
Queensferry and Shotton.
The main source of air pollution in FCC is road traffic emissions from major roads
linking England to the rest of north Wales. These include the A55 towards Colwyn
Bay in the north and the A494 towards Snowdonia in the south.
Gwynedd Council Gwynedd Council (GC) lies between the area from Abergwyngregyn in the north to
Aberdyfi in the south, and from the Llyn Peninsula in the west to Glan yr Afon in the
east. Gwynedd has a population of approximately 120,0001. The county shares it’s
inland boundary with four other counties; Conwy, Denbighshire, Powys and
Ceredigion. GC is predominantly rural in nature, with the main areas of population
concentrated at the University City of Bangor and Gwyneed Administration Centre,
Caernarfon, both situated on the south shore of the Manai Strait to the north-west of
the county.
The main source of air pollution is emissions from road traffic due to the dependence
of cars and the increase in the influx from tourism along the main roads. The busiest
road within the country is the A55, connecting the port of Holyhead on Anglesey to
the north-west of England. The A470 is the primary route between north and south
Wales. It traverses Gwynedd from Blaenau Ffestiniog to Mallwyd in the south.
Another important road is the A487 which links Caernarfon and Bangor with the
south of the county before merging with the A470 at Llan Ffestiniog, then continuing
from the south of Dolgellau towards, Machynlleth and beyond.
Wrexham County Borough Council Wrexham Country Borough Council (WCBC) is bounded by the Clwydian Hills to the
west and the Shropshire and Powys countryside to the south. The council serves a
resident population of approximately 133,5001 of which the majority are situated
within the centre of Wrexham itself or in the surrounding urban villages. Outside
Wrexham centre, the predominant land use is agriculture with the landscape being
largely rural in nature.

North Wales Combined Authority
LAQM Progress Report 2017 4
The main source of air pollution is traffic emissions from vehicles travelling along the
A483 which links the north of the county to the south. There are also several
industrial estates within its borders, the largest of which is located 5 miles to the east
of the main town area and contain over 300 businesses.
1.2 Purpose of Progress Report This report fulfils the requirements of the Local Air Quality Management (LAQM)
process as set out in Part IV of the Environment Act (1995), the Air Quality Strategy
for England, Scotland, Wales and Northern Ireland 2007 and the relevant Policy and
Technical Guidance documents. The LAQM process places an obligation on all local
authorities to regularly review and assess air quality in their areas, and to determine
whether or not the air quality objectives are likely to be achieved. Where
exceedances are considered likely, the local authority must then declare an Air
Quality Management Area (AQMA) and prepare an Air Quality Action Plan (AQAP)
setting out the measures it intends to put in place in pursuit of the objectives.
For Local Authorities in Wales, Progress Reports are required in the intervening
years between the three-yearly Updating and Screening Assessment reports. Their
purpose is to maintain continuity in the LAQM process.
They are not intended to be as detailed as Updating and Screening Assessment
Reports, or to require as much effort. However, if the Progress Report identifies the
risk of exceedance of an Air Quality Objective, the Local Authority (LA) should
undertake a Detailed Assessment immediately, and not wait until the next round of
Review and Assessment.
1.3 Air Quality Objectives The air quality objectives applicable to LAQM in Wales are set out in the Air Quality
(Wales) Regulations 2000, No. 1940 (Wales 138), Air Quality (Amendment) (Wales)
Regulations 2002, No 3182 (Wales 298), and are shown in Table 1.1. This table
shows the objectives in units of microgrammes per cubic metre µg/m3 (milligrammes
per cubic metre, mg/m3 for carbon monoxide) with the number of exceedances in
each year that are permitted (where applicable).

North Wales Combined Authority
LAQM Progress Report 2017 5
Table 1.1 – Air Quality Objectives included in Regulations for the purpose of LAQM in Wales
Pollutant Air Quality Objective Date to be achieved by Concentration Measured as
Benzene 16.25 µg/m3 Running annual
mean 31.12.2003
5.00 µg/m3 Annual mean 31.12.2011
1,3-butadiene 2.25 µg/m3 Running annual mean 31.12.2003
Carbon monoxide 10 mg/m3 Running 8-hour mean 31.12.2003
Lead 0.50 µg/m3 Annual mean 31.12.2004 0.25 µg/m3 Annual mean 31.12.2008
Nitrogen dioxide
200 µg/m3 not to be exceeded more than 18 times a
year
1-hour mean 31.12.2005
40 µg/m3 Annual mean 31.12.2005
Particulate matter (PM10)
(gravimetric)
50 µg/m3, not to be exceeded more than 35 times a
year
24-hour mean 31.12.2004
40 µg/m3 Annual mean 31.12.2004
Sulphur dioxide
350 µg/m3, not to be exceeded more
than 24 times a year
1-hour mean 31.12.2004
125 µg/m3, not to be exceeded more than 3 times a year
24-hour mean 31.12.2004
266 µg/m3, not to be exceeded more
than 35 times a year
15-minute mean 31.12.2005

North Wales Combined Authority
LAQM Progress Report 2017 6
1.4 Summary of Previous Review and Assessments Previous rounds of review and assessment have identified areas in the North Wales
Combined Authority where exceedances of the annual mean objectives have
occurred. Detailed assessments have been carried out when exceedances have
been reported to evaluate whether an Air Quality Management Area (AQMA) needs
to be declared. There are currently no AQMAs declared in the North Wales
Combined Authority.
Table 1.2 – Summary of Previous Rounds of Review and Assessment in the North Wales Combines Authority
Year Report Type Detailed Assessment Recommended AQMA Declared
2003 Updating and
Screening Assessment
No detailed assessments required in any Local Authority Area.
No AQMAs declared in any Local Authority Area.
2004 Progress Report
Detailed assessment carried out for PM10 and NO2 close to the A494 in FCC. No other detailed assessments required in any Local Authority Area.
No AQMAs declared in any Local Authority Area.
2005 Progress Report
No detailed assessments required in any Local Authority Area.
No AQMAs declared in any Local Authority Area.
2006 Updating and
Screening Assessment
Detailed assessment required at Trimm Rock and Aberdo Limestone Quarries and at Roadrunner Waste Transfer Station in FCC. No other detailed assessments required in any Local Authority Area.
No AQMAs declared in any Local Authority Area.
2007 Progress Report
Detailed assessment carried out for SO2 15-minute mean objective for Penrhos Coastal Park in IACC. No other detailed assessments required in any Local Authority Area.
No AQMAs declared in any Local Authority Area.
2008 Progress Report
No detailed assessments required in any Local Authority Area.
No AQMAs declared in any Local Authority Area.

North Wales Combined Authority
LAQM Progress Report 2017 7
Year Report Type Detailed Assessment Recommended AQMA Declared
2009 Updating and
Screening Assessment
Detailed assessment no longer required at Trimm Rock and Aberdo Limestone Quarries and at Roadrunner Waste Transfer Station in FCC. Detailed assessment carried out for SO2 15-minute mean objective for Holyhead Railway Station in IACC. Detailed assessment required for SO2 as a result of steam trains in GC. No other detailed assessments required in any Local Authority Area.
No AQMAs declared in any Local Authority Area.
2010 Progress Report
Detailed assessment required for the area around Wrexham Road in Cefn Y Bedd in FCC. Detailed assessment carried out for SO2 as a result of steam trains in GC. No other detailed assessments required in any Local Authority Area.
No AQMAs declared in any Local Authority Area.
2011 Progress Report
Detailed assessment carried out for NO2 along Vale Street, Denbigh in DCC.
No AQMAs declared in any Local Authority Area.
2012 Updating and
Screening Assessment
Detailed assessment no longer required for the area around Wrexham Road in Cefn Y Bedd in FCC. Detailed assessment carried out for the junction of the A5119 and A494 in Mold in FCC. No other detailed assessments required in any Local Authority Area.
No AQMAs declared in any Local Authority Area.
2013 Progress Report
No detailed assessments required in any Local Authority Area.
No AQMAs declared in any Local Authority Area.
2014 Progress Report
No detailed assessments required in any Local Authority Area.
No AQMAs declared in any Local Authority Area.
2015 Updating and
Screening Assessment
No detailed assessments required in any Local Authority Area.
No AQMAs declared in any Local Authority Area.
2016 Progress Report
No detailed assessments required in any Local Authority Area.
No AQMAs declared in any Local Authority Area.

North Wales Combined Authority
LAQM Progress Report 2017 8
2 New Monitoring Data 2.1 Summary of Monitoring Undertaken 2.1.1 Automatic Monitoring Sites
Automatic monitoring was carried out at four sites within the IACC and at one
location in WCBC. No other automatic monitoring was undertaken in the North Wales
Combined Authority. The monitoring sites are as follows:
CM1: Llynfaes – Measuring PM10 and PM2.5 at Gwyndy Quarry;
CM2: Brynteg – Measuring PM10 and PM2.5 at Rhuddlan Back Quarry;
CM3: Felin Cafnan – Measuring PM10 and PM2.5 at a National Trust Property
located near to the Wylfa Newydd construction site;
CM4: IVC Penhesgyn – Measuring PM10 and PM2.5 at Penhesgyn Recycling
Centre; and
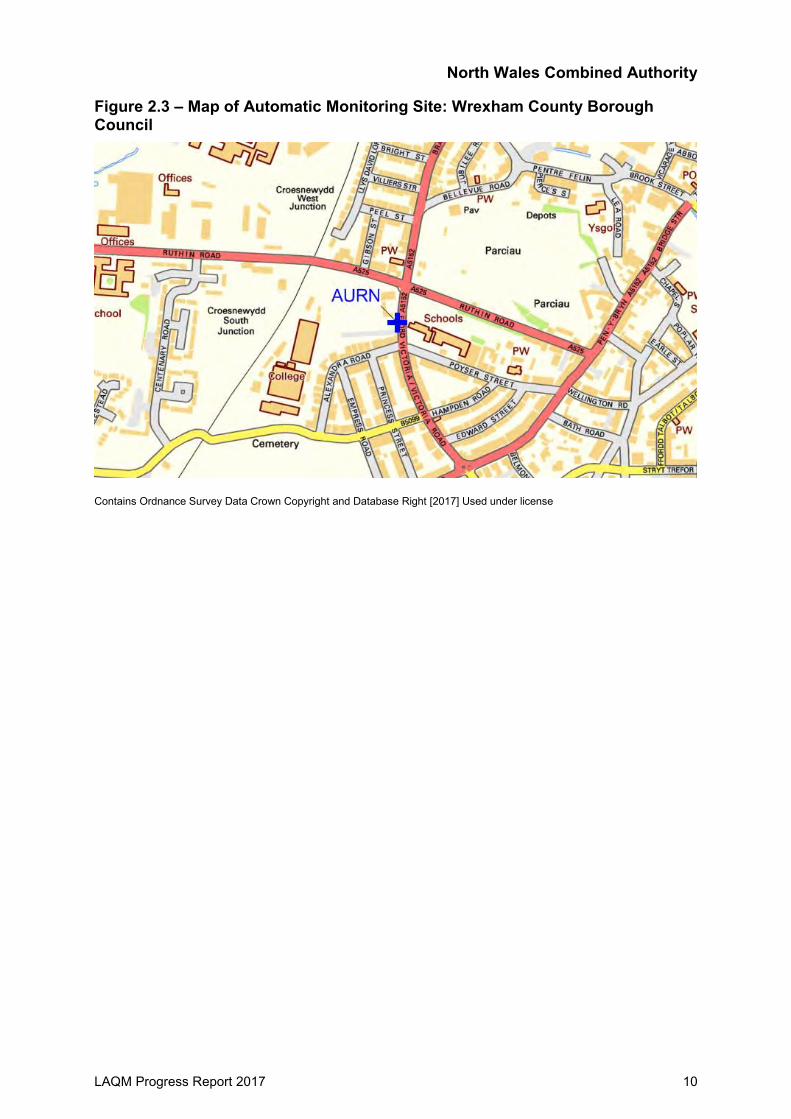
AURN: Victoria Road – Measuring NO2, SO2, PM10 and PM2.5 at a roadside
location in Wrexham.
Figure 2.1 to Figure 2.3 and Table 2.1 provide further information with regards to the
automatic monitoring sites.
There was one new automatic station installed in the North Wales Combined
Authority, at Felin Cafnan, measuring PM10. Monitoring started in December 2015 at
the site which is run by the IACC. PM10 monitoring was completed in August 2016 at
the IVC Penhesgyn site which was also run by the IACC.
The Rose Cottage, Mold automatic monitor measuring PM10, NOx and NO2 in FCC
was decommissioned in 2016 due to resource constraints. Reported concentrations
have been below the relevant Air Quality Standards for the past couple of years and
therefore continued monitoring was not deemed to be necessary at this location.
The Wrexham Isycoed automatic monitor measuring PM10, SO2 and NOx in WCBC
was decommissioned at the start of 2016 by the Welsh Air Quality Forums (WAQF)
as the monitoring programme had concluded that there were no breaches of the air
quality objectives over nine years of monitoring.

North Wales Combined Authority
LAQM Progress Report 2017 9
Figure 2.1 – Map of Automatic Monitoring Site: Isle of Anglesey County Council
Contains Ordnance Survey Data Crown Copyright and Database Right [2017] Used under license Figure 2.2 – Map of Automatic Monitoring Site: Isle of Anglesey County Council – Felin Cafnan, close to the Wylfa Newydd construction site
Contains Ordnance Survey Data Crown Copyright and Database Right [2017] Used under license
Gwyndy Quarry
Rhuddlan Bach Quarry
Penhesgyn Recycling Centre
North Wales Combined Authority
LAQM Progress Report 2017 10
Figure 2.3 – Map of Automatic Monitoring Site: Wrexham County Borough Council
Contains Ordnance Survey Data Crown Copyright and Database Right [2017] Used under license

North Wales Combined Authority
LAQM Progress Report 2017 11
Table 2.1 – Details of Automatic Monitoring Sites in the North Wales Combined Authority
Site ID Site Name Site
Type X OS Grid Reference
Y OS Grid Reference
Inlet Height
(m) Pollutants Monitored
In AQMA?
Monitoring Technique
Relevant Exposure? (Y/N with distance (m) from
monitoring site to
relevant exposure)
Distance to Kerb of Nearest
Road (m) (N/A if not applicable)
Does this Location
Represent Worst-Case
Exposure?
Isle of Anglesey County Council CM1 Llynfaes
(Creigiau) Rural 239692 379774 1.5 PM10 N Osiris Y (1m) 10 Y
CM2 Brynteg (Chwarelau) Rural 248566 381325 4.0 PM10 N Osiris Y (1m) 5 Y
CM3 Felin
Cafnan, Cemlyn
Rural 234355 393310 1.5 PM10 No Osiris Y (10m) N/A Y
CM4 IVC Penhesgyn Rural 253320 374281 1.5 PM10 N Osiris N (100m) 200 Y
Wrexham Country Borough Council AURN Victoria
Road AURN Roadside 332863 349913 3 NOx, SO2 No Continuous Y (20m) 4m Y (20m)
AURN Victoria Road AURN Roadside 332863 349913 3 PM10, PM2.5 No Daily
Gravimetric Y (20m) 4m Y (20m)

North Wales Combined Authority
LAQM Progress Report 2017 12
2.1.2 Non-Automatic Monitoring Sites
Non-automatic monitoring of NO2 using passive diffusion tubes were undertake within
all six local authorities at roadside, kerbside, industrial and urban background
locations. The number of monitoring locations within each local authority is as
follows:
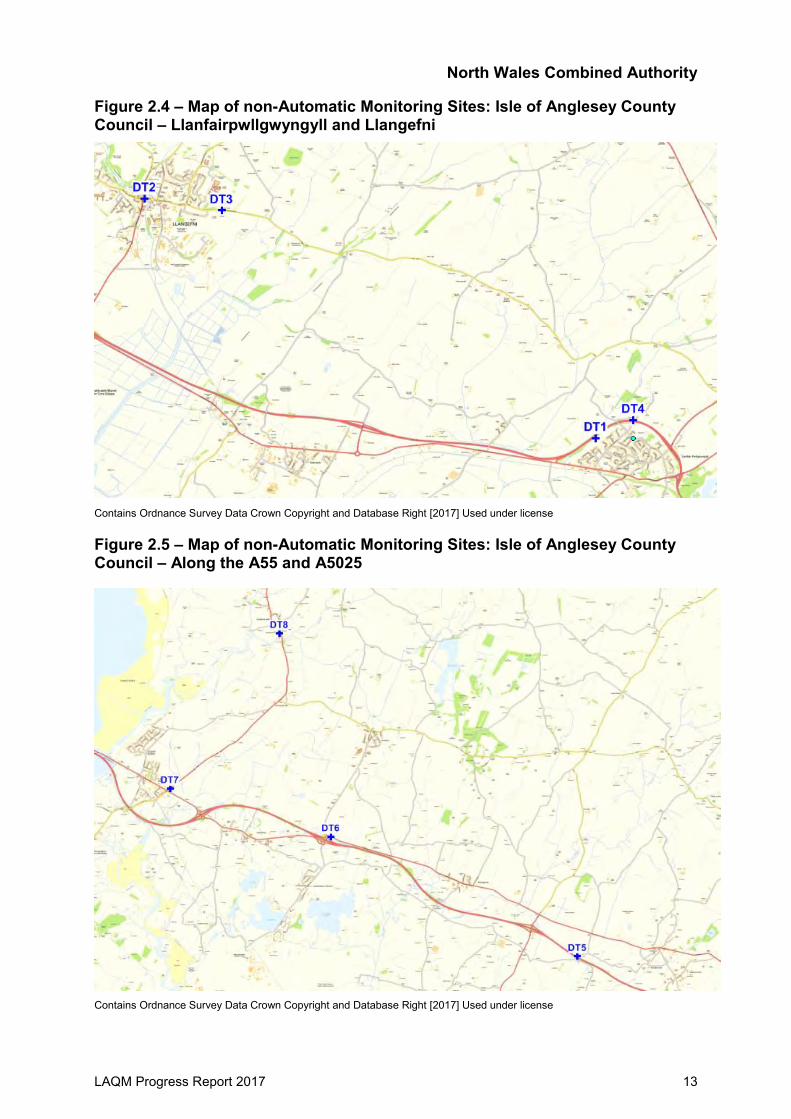
Isle of Anglesey County Council undertook monitoring at 15 locations. A 12-
month NO2 survey, consisting of 12 diffusion tubes, commenced along
sections of the A55 and A5025 in February 2016 to gather baseline data for
the Horion Nuclear Power Project. The monitoring survey has been since
extended for a further 6 months.
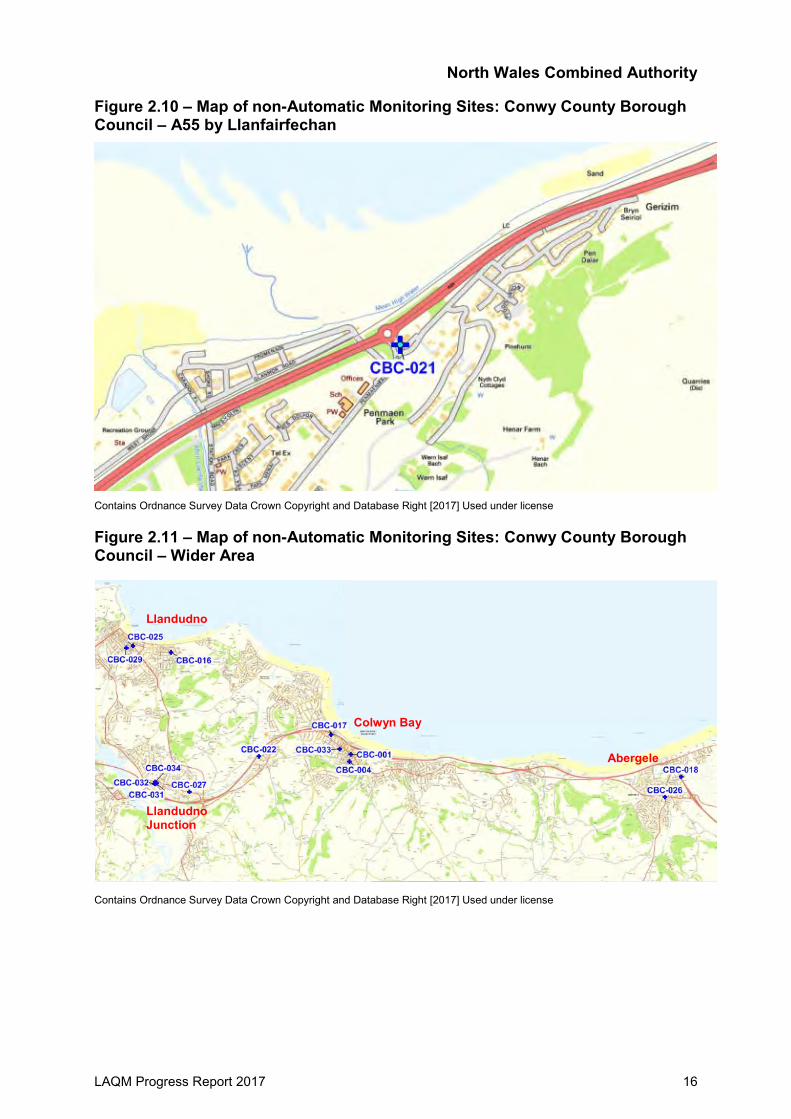
Conwy County Borough Council undertook monitoring at 15 locations. A new
diffusion tube location was added at a roadside site along Victoria Drive in
March 2016 (CBC-034).
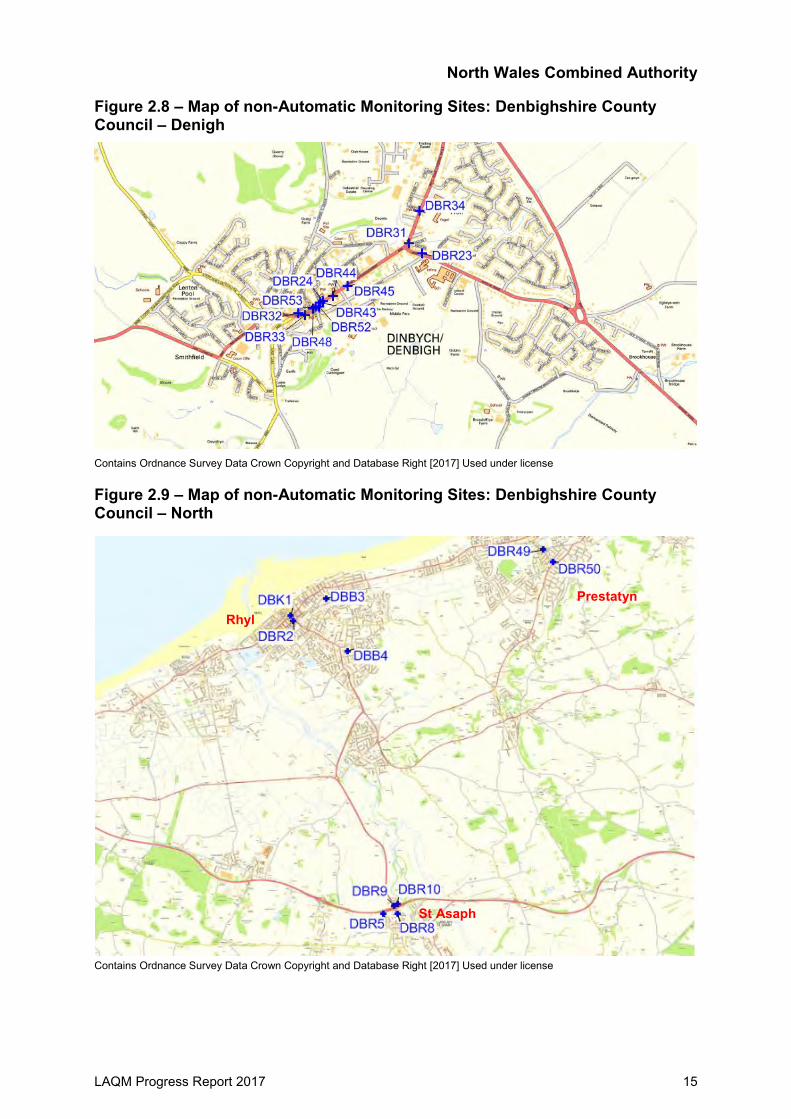
Denbighshire County Council undertook monitoring at 26 locations. No
changes to the monitoring locations or number of tubes deployed have
occurred in 2016.
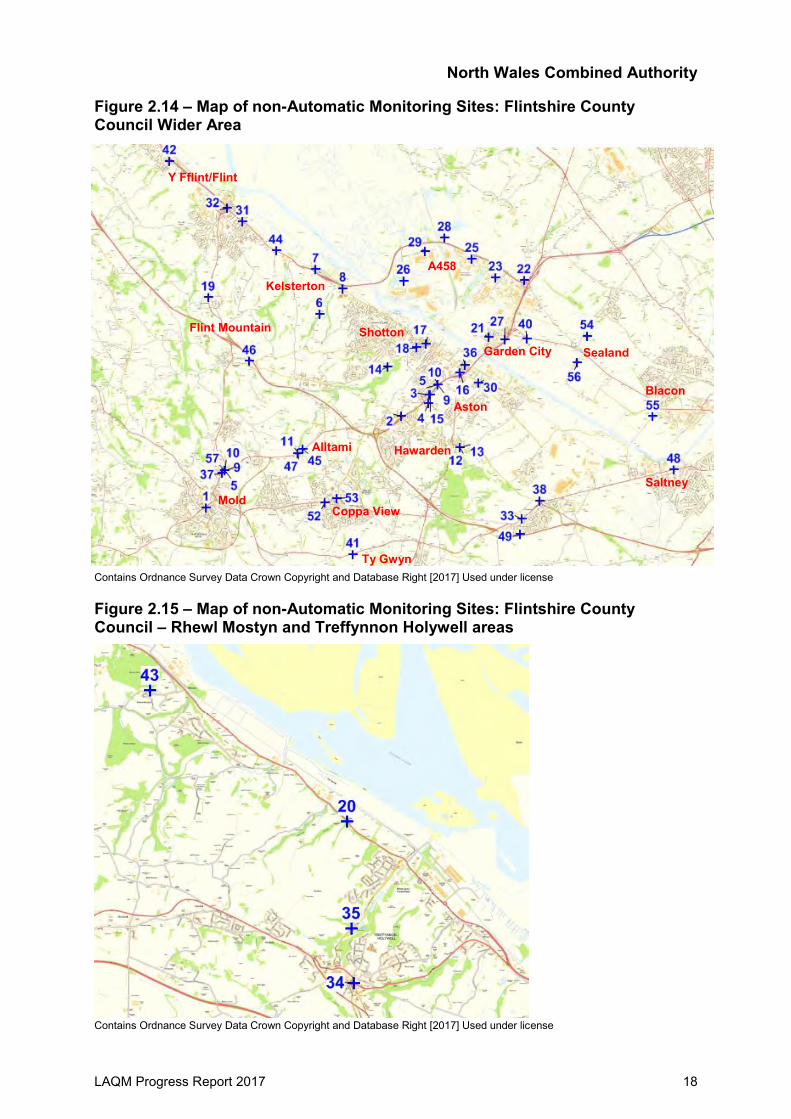
Flintshire County Council undertook monitoring at 52 locations, including
duplicate diffusion tube monitoring at 3 sites (3 Davies Cottage, 20/22 Glynne
Way and Llys Alun). Triplicate tubes were installed at Rose Cottage until July
2016 where they were then moved to be co-located with the South Bank,
Aston Park continuous station for the remainder of 2016.
Gwynedd Council undertook monitoring at 12 locations. No changes to the
monitoring locations or number of diffusion tubes deployed have occurred in
2016.
Wrexham Country Borough Council undertook monitoring at 24 locations,
including one triplicate site which is co-located with the Victoria Road AURN
station. There was one new diffusion tube site installed in 2016 at Chapel
Lane.
Non-automatic monitoring of benzene (C6H6) was also undertaken at one monitoring
location in WCBC.
Figure 2.4 to Figure 2.17 and Table 2.2 provide further information with regards to
the non- automatic monitoring sites.
North Wales Combined Authority
LAQM Progress Report 2017 13
Figure 2.4 – Map of non-Automatic Monitoring Sites: Isle of Anglesey County Council – Llanfairpwllgwyngyll and Llangefni
Contains Ordnance Survey Data Crown Copyright and Database Right [2017] Used under license Figure 2.5 – Map of non-Automatic Monitoring Sites: Isle of Anglesey County Council – Along the A55 and A5025
Contains Ordnance Survey Data Crown Copyright and Database Right [2017] Used under license

North Wales Combined Authority
LAQM Progress Report 2017 14
Figure 2.6 – Map of non-Automatic Monitoring Sites: Isle of Anglesey County Council – Along A5025, Cemaes and Amlwch
Contains Ordnance Survey Data Crown Copyright and Database Right [2017] Used under license Figure 2.7 – Map of non-Automatic Monitoring Sites: Denbighshire County Council – Ruthin
Contains Ordnance Survey Data Crown Copyright and Database Right [2017] Used under license
North Wales Combined Authority
LAQM Progress Report 2017 15
Figure 2.8 – Map of non-Automatic Monitoring Sites: Denbighshire County Council – Denigh
Contains Ordnance Survey Data Crown Copyright and Database Right [2017] Used under license Figure 2.9 – Map of non-Automatic Monitoring Sites: Denbighshire County Council – North
Contains Ordnance Survey Data Crown Copyright and Database Right [2017] Used under license
St Asaph
Rhyl
Prestatyn
North Wales Combined Authority
LAQM Progress Report 2017 16
Figure 2.10 – Map of non-Automatic Monitoring Sites: Conwy County Borough Council – A55 by Llanfairfechan
Contains Ordnance Survey Data Crown Copyright and Database Right [2017] Used under license Figure 2.11 – Map of non-Automatic Monitoring Sites: Conwy County Borough Council – Wider Area
Contains Ordnance Survey Data Crown Copyright and Database Right [2017] Used under license
Colwyn Bay
Llandudno
Llandudno Junction
Abergele

North Wales Combined Authority
LAQM Progress Report 2017 17
Figure 2.12 – Map of non-Automatic Monitoring Sites: Gwynedd Council – Wider Area
Contains Ordnance Survey Data Crown Copyright and Database Right [2017] Used under license Figure 2.13 – Map of non-Automatic Monitoring Sites: Gwynedd Council – Pwllhei
Contains Ordnance Survey Data Crown Copyright and Database Right [2017] Used under license
Bangor
Bethesda
Caernarfon
Llanwnda
North Wales Combined Authority
LAQM Progress Report 2017 18
Figure 2.14 – Map of non-Automatic Monitoring Sites: Flintshire County Council Wider Area
Contains Ordnance Survey Data Crown Copyright and Database Right [2017] Used under license Figure 2.15 – Map of non-Automatic Monitoring Sites: Flintshire County Council – Rhewl Mostyn and Treffynnon Holywell areas
Contains Ordnance Survey Data Crown Copyright and Database Right [2017] Used under license
Kelsterton
Y Fflint/Flint
Flint Mountain
Mold
Alltami
Coppa View
Ty Gwyn
A458
Garden City
Aston
Shotton
Hawarden
Sealand
Blacon
Saltney

North Wales Combined Authority
LAQM Progress Report 2017 19
Figure 2.16 – Map of non-Automatic Monitoring Sites: Flintshire County Council – Hope Area
Contains Ordnance Survey Data Crown Copyright and Database Right [2017] Used under license Figure 2.17 – Map of non-Automatic Monitoring Sites: Wrexham County Borough Council – South
Contains Ordnance Survey Data Crown Copyright and Database Right [2017] Used under license
Chirk
Acrefair
Ruabon
Overton
North Wales Combined Authority
LAQM Progress Report 2017 20
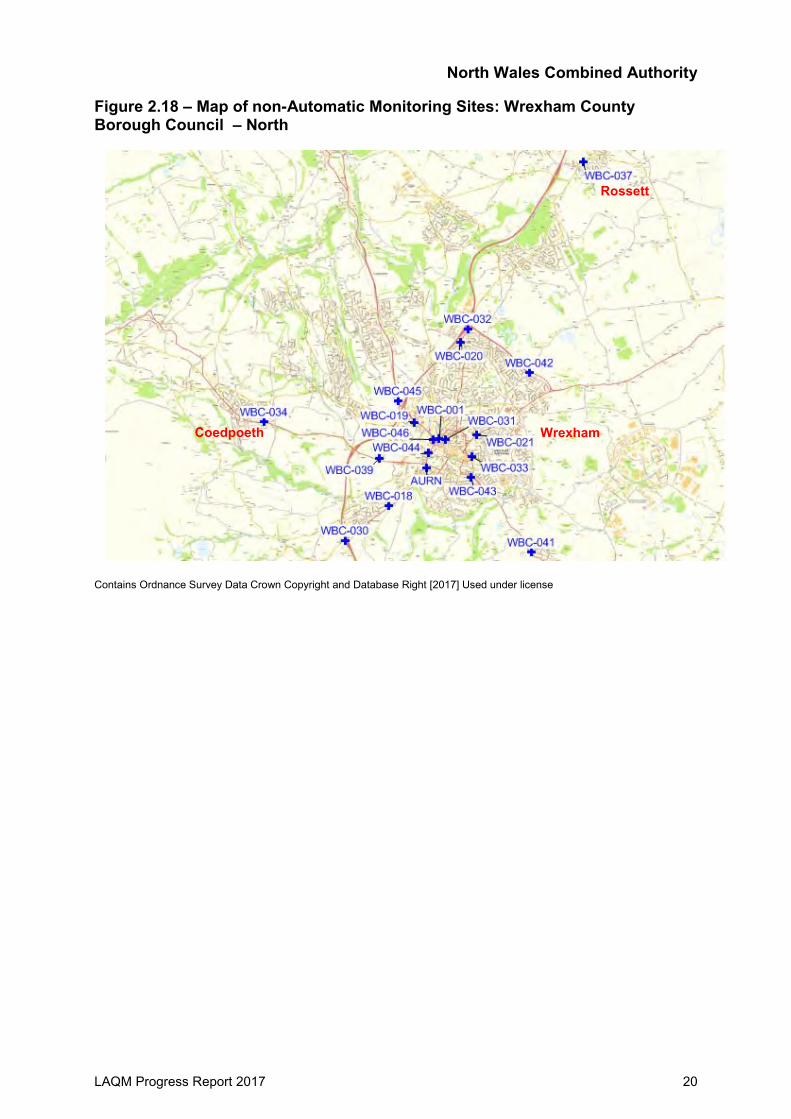
Figure 2.18 – Map of non-Automatic Monitoring Sites: Wrexham County Borough Council – North
Contains Ordnance Survey Data Crown Copyright and Database Right [2017] Used under license
Rossett
Wrexham Coedpoeth

North Wales Combined Authority
LAQM Progress Report 2017 21
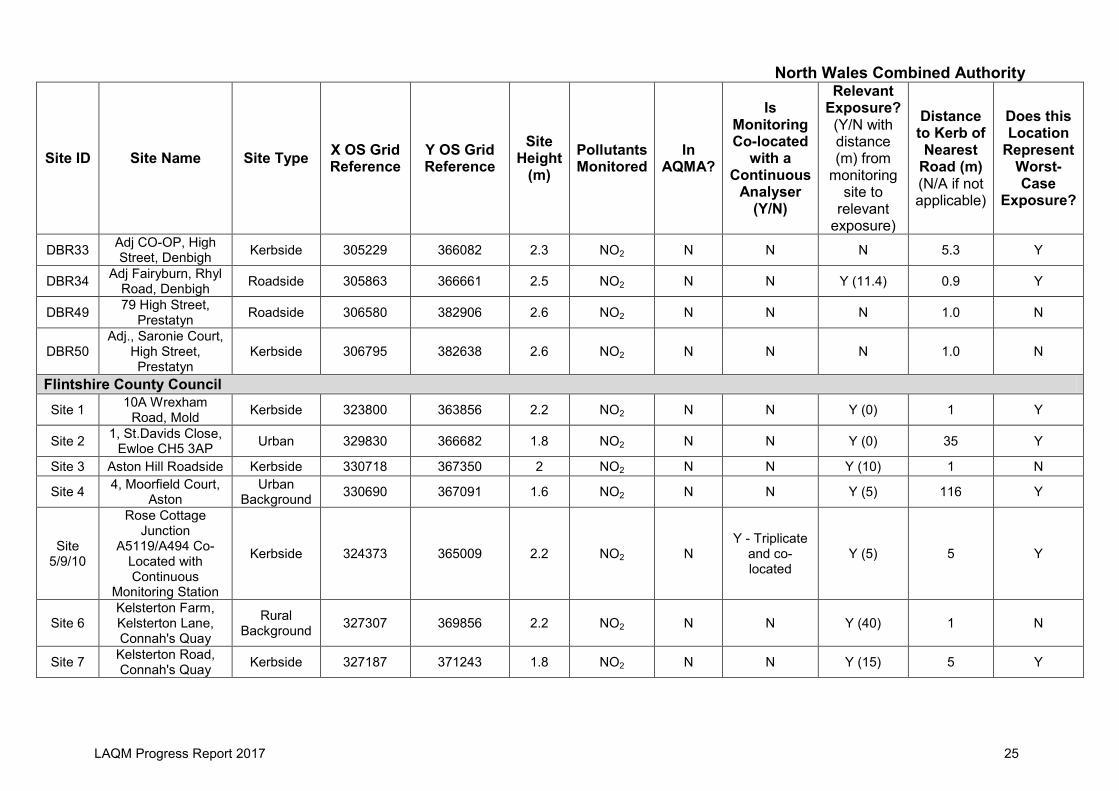
Table 2.2 – Details of Non- Automatic Monitoring Sites in the North Wales Combined Authority
Site ID Site Name Site Type X OS Grid Reference
Y OS Grid Reference
Site Height
(m) Pollutants Monitored
In AQMA?
Is Monitoring Co-located
with a Continuous
Analyser (Y/N)
Relevant Exposure?
(Y/N with distance (m) from
monitoring site to
relevant exposure)
Distance to Kerb of Nearest
Road (m) (N/A if not applicable)
Does this Location
Represent Worst-Case
Exposure?
Isle of Anglesey County Council DT1 Llanfair P.G.
By-pass Kerbside 252700 372100 1.2 NO2 No No N 1 Y
DT2 Bulkeley Square, Llangefni Kerbside 245926 375688 2.5 NO2 No No Y (1) 1 Y
DT3 Penmynydd Road Roadside 247084 375511 2.8 NO2 No No Y (10) 1.9 Y
DT4 Llanfair P.G. O2 Mast Roadside 253265 372372 1.4 NO2 No No Y (30) 3 Y
DT5 Bridge over A55 Roadside 237267 376129 1.8 NO2 No No Y (50) 1.2 Y DT6 A55, Junction 4 Roadside 232573 378407 2.4 NO2 No No Y (40) 1.5 Y DT7 A5025, Valley Kerbside 229513 379321 1.5 NO2 No No N 1 Y
DT8 A5025, Llanfachraeth Roadside 231593 382274 2.8 NO2 No No Y (8) 1.7 Y
DT9 A5025, Llanfaethlu Roadside 231555 387112 1.9 NO2 No No Y (75) 1.5 Y
DT10 A5025, Llanfellech Crossroads Roadside 234152 390193 1.9 NO2 No No N 3.5 Y
DT11 A5025, Tregele Roadside 235575 392545 2.5 NO2 No No Y (15) 1.6 Y
DT12 Ffordd Caergybi, Cemaes Roadside 236752 393090 2.7 NO2 No No Y (10) 1.7 Y
DT13 Maes Cynfor, Cemaes Roadside 236908 393378 2.6 NO2 No No Y (10) 1.7 Y
DT14 A5025, Amlwch Roadside 244126 392914 2.8 NO2 No No Y (1) 1.4 Y
DT15 A5025 Near Salem Street, Amlwch Roadside 244270 392498 2.2 NO2 No No Y (10) 1.2 Y

North Wales Combined Authority
LAQM Progress Report 2017 22
Site ID Site Name Site Type X OS Grid Reference
Y OS Grid Reference
Site Height
(m) Pollutants Monitored
In AQMA?
Is Monitoring Co-located
with a Continuous
Analyser (Y/N)
Relevant Exposure?
(Y/N with distance (m) from
monitoring site to
relevant exposure)
Distance to Kerb of Nearest
Road (m) (N/A if not applicable)
Does this Location
Represent Worst-Case
Exposure?
Conwy County Borough Council CBC-001
Theatre Colwyn, Colwyn Bay Roadside 285119 378817 3 NO2 N N Y (0.5) 3.5 Y
CBC-034 Victoria Drive Roadside 279245 377995 3 NO2 N N Y (1.0) 2.2 Y
CBC-004
Grove Park Rd. Colwyn Bay
Urban Background 285089 378592 3 NO2 N N Y (1.0) 1.7 N
CBC-016
Silva Gardens North, Llandudno
Urban Background 285089 378592 3 NO2 N N Y (1.0) 2.1 N
CBC-017
Kingsway,Colwyn Bay Roadside 279724 381877 3 NO2 N N Y (1.0) 1.1 Y
CBC-018 Heol Dewi Pensarn Roadside 284526 379417 3 NO2 N N Y (2.0) 1.0 Y
CBC-026
Chapel Street Abergele Roadside 295049 378144 3 NO2 N N Y (1.0) 1.0 Y
CBC-025 Parc Llandudno Roadside 294571 377534 3 NO2 N N Y (1.0) 1.0 Y
CBC-031
Conwy Road East (53), Llandudno Jcn Roadside 278574 382071 2.5 NO2 N N Y (2.0) 1.75 Y
CBC-032
Conwy Road West, Llandudno Jcn (39) Roadside 279279 377946 3 NO2 N N Y (3.0) 1.0 Y
CBC-021 Llanfairfechan Roadside 279235 377936 3 NO2 N N Y (2.0) 1.1 Y
CBC-022 Bryn Marl, Mochdre Roadside 268572 375472 3 NO2 N N Y (2.0) 1.5 Y
CBC-033
Coed Pella Road, Colwyn Bay Roadside 282362 378757 3 NO2 N N Y (2.0) 1.0 Y

North Wales Combined Authority
LAQM Progress Report 2017 23
Site ID Site Name Site Type X OS Grid Reference
Y OS Grid Reference
Site Height
(m) Pollutants Monitored
In AQMA?
Is Monitoring Co-located
with a Continuous
Analyser (Y/N)
Relevant Exposure?
(Y/N with distance (m) from
monitoring site to
relevant exposure)
Distance to Kerb of Nearest
Road (m) (N/A if not applicable)
Does this Location
Represent Worst-Case
Exposure?
CBC-027
Llandudno Junction, New Roundabout
Roadside 284789 378983 3 NO2 N N Y (2.0) 2.0 Y
CBC-029
Llandudno Railway Stn Taxi Rank Roadside 280271 377692 3 NO2 N N Y (2.0) 1.0 Y
Denbighshire County Council DBK1 Wellington Road,
Rhyl Roadside 300846 381407 2.3 NO2 N N Y (0.5) 2.2 Y
DBR2 10 Kinmel Street, Rhyl Roadside 300903 381292 2.5 NO2 N N Y (2.5) 0.3 Y
DBB3 5 St. Georges Cres., Rhyl Suburban 301640 381800 2.1 NO2 N N Y (0) 15.1 Y
DBB4 73 Bryn Coed Park, Rhyl Suburban 302128 380611 2.3 NO2 N N Y (4.7) 1.7 Y
DBR5 2 Pant Glas, St. Asaph Suburban 302938 374638 2.0 NO2 N N Y (9.6) 27.5 Y
DBR48 Adj. 1 Vale Street, Denbigh Roadside 305276 366119 2.4 NO2 N N Y (0) 1.0 Y
DBR23 31 Ruthin Road, Denbigh Suburban 305878 366424 2.5 NO2 N N Y (1.4) 2.5 Y
DBR8 1 Plas Elwy
Orchard, The Roe, St. Asaph
Roadside 303270 374640 2.0 NO2 N N Y (0) 19.4 Y
DBR9 7 Roe Park, St. Asaph Roadside 303197 374830 2.0 NO2 N N Y (0) 14 Y
DBR10 13 Roe Park, St. Asaph Suburban 303263 374867 2.0 NO2 N N Y (0) 47 Y

North Wales Combined Authority
LAQM Progress Report 2017 24
Site ID Site Name Site Type X OS Grid Reference
Y OS Grid Reference
Site Height
(m) Pollutants Monitored
In AQMA?
Is Monitoring Co-located
with a Continuous
Analyser (Y/N)
Relevant Exposure?
(Y/N with distance (m) from
monitoring site to
relevant exposure)
Distance to Kerb of Nearest
Road (m) (N/A if not applicable)
Does this Location
Represent Worst-Case
Exposure?
DBR24 Denbigh Cutters, 21
Vale Street, Denbigh
Suburban 305330 366160 2.2 NO2 N N Y (0) 3 Y
DBR54 Adj. 2 Market Street, Ruthin Suburban 312502 358376 2.2 NO2 N N Y (0) 2.9 Y
DBR20 25 Park Road, Ruthin. Roadside 312106 358306 2.2 NO2 N N Y (4) 1.4 Y
DBR43 Adj HSBC Bank,
Vale Street, Denbigh
Suburban 305314 366153 2.6 NO2 N N Y (5.5) 2.5 Y
DBR44 Opp Rowlands Pharm., Vale
Street, Denbigh Roadside 305386 366191 2.6 NO2 N N Y (1.7) 1.2 Y
DBR45 Adj 50 Vale Street, Denbigh Roadside 305467 366246 2.5 NO2 N N Y (3.9) 2.0 Y
DBR37 Haul Fryn Depot, Ruthin Roadside 312789 358231 2.3 NO2 N N Y (1) 3.5 Y
DBR38 Adj 62 Rhos Street, Ruthin Roadside 312913 358273 2.6 NO2 N N Y (0) 2.3 Y
DBR52 Adj. Swayne
Johnston Sol., Vale Street, Denbigh
Roadside 305308 366130 2.9 NO2 N N N 1.8 Y
DBR53 7 Vale Street, Denbigh Roadside 305290 366130 2.3 NO2 N N N 2.0 Y
DBR31 2 Rhyl Road, Denbigh Roadside 305805 366480 2.4 NO2 N N Y (1.3) 0.8 Y
DBR32 47 High Street, Denbigh Roadside 305193 366093 2.4 NO2 N N N 5.9 Y
North Wales Combined Authority
LAQM Progress Report 2017 25
Site ID Site Name Site Type X OS Grid Reference
Y OS Grid Reference
Site Height
(m) Pollutants Monitored
In AQMA?
Is Monitoring Co-located
with a Continuous
Analyser (Y/N)
Relevant Exposure?
(Y/N with distance (m) from
monitoring site to
relevant exposure)
Distance to Kerb of Nearest
Road (m) (N/A if not applicable)
Does this Location
Represent Worst-Case
Exposure?
DBR33 Adj CO-OP, High Street, Denbigh Kerbside 305229 366082 2.3 NO2 N N N 5.3 Y
DBR34 Adj Fairyburn, Rhyl Road, Denbigh Roadside 305863 366661 2.5 NO2 N N Y (11.4) 0.9 Y
DBR49 79 High Street, Prestatyn Roadside 306580 382906 2.6 NO2 N N N 1.0 N
DBR50 Adj., Saronie Court,
High Street, Prestatyn
Kerbside 306795 382638 2.6 NO2 N N N 1.0 N
Flintshire County Council Site 1 10A Wrexham
Road, Mold Kerbside 323800 363856 2.2 NO2 N N Y (0) 1 Y
Site 2 1, St.Davids Close, Ewloe CH5 3AP Urban 329830 366682 1.8 NO2 N N Y (0) 35 Y
Site 3 Aston Hill Roadside Kerbside 330718 367350 2 NO2 N N Y (10) 1 N
Site 4 4, Moorfield Court, Aston
Urban Background 330690 367091 1.6 NO2 N N Y (5) 116 Y
Site 5/9/10
Rose Cottage Junction
A5119/A494 Co-Located with Continuous
Monitoring Station
Kerbside 324373 365009 2.2 NO2 N Y - Triplicate
and co-located
Y (5) 5 Y
Site 6 Kelsterton Farm, Kelsterton Lane, Connah's Quay
Rural Background 327307 369856 2.2 NO2 N N Y (40) 1 N
Site 7 Kelsterton Road, Connah's Quay Kerbside 327187 371243 1.8 NO2 N N Y (15) 5 Y

North Wales Combined Authority
LAQM Progress Report 2017 26
Site ID Site Name Site Type X OS Grid Reference
Y OS Grid Reference
Site Height
(m) Pollutants Monitored
In AQMA?
Is Monitoring Co-located
with a Continuous
Analyser (Y/N)
Relevant Exposure?
(Y/N with distance (m) from
monitoring site to
relevant exposure)
Distance to Kerb of Nearest
Road (m) (N/A if not applicable)
Does this Location
Represent Worst-Case
Exposure?
Site 8 86, Kelsterton
Road, Connah's Quay CH5 4BJ
Urban background 328032 370647 1.6 NO2 N N Y (0) 22 Y
Site 11/47
3 Davies Cottage, Mold Road, Alltami Kerbside 326643 365550 1.6 NO2 N N - Duplicate Y (0) 4 Y
Site 12/13
20/22 Glynne Way, Hawarden Kerbside 331648 365730 2 NO2 N N - Duplicate Y (0) 1 Y
Site 14 Wepre Park, Connah's Quay
Rural Background 329406 368224 1.6 NO2 N N N 290 N
Site 15 Aston Hill Kerbside 330727 367354 2 NO2 N N Y (10) 1 Y
Site 16 4, Belvedere Close, Queensferry CH5
1TG Urban 331663 368028 1.8 NO2 N N Y (0) 20 Y
Site 17 32 Chester Road West, Shotton Kerbside 330599 368922 2.3 NO2 N N Y (0) 4 Y
Site 18 Victoria Crescent, Shotton
Urban Background 330319 368812 2 NO2 N N Y (7) 1 N
Site 19 Gwylfa, Northop Rd., Flint Mountain Kerbside 323864 370368 2 NO2 N N Y (0) 3 Y
Site 20
Coed Mawr Cott., Mostyn Road,
Greenfield CH8 9DN
Kerbside 318669 378290 2.2 NO2 N N Y (0) 2 Y
Site 21 18, Kingsley Road, Garden City CH5
2JA
Urban Background 332549 369135 1.8 NO2 N N Y (0) 7 Y
Site 22 Green Lane West, Sealand
Rural Background 333645 370898 2.2 NO2 N N Y (15) 70 N

North Wales Combined Authority
LAQM Progress Report 2017 27
Site ID Site Name Site Type X OS Grid Reference
Y OS Grid Reference
Site Height
(m) Pollutants Monitored
In AQMA?
Is Monitoring Co-located
with a Continuous
Analyser (Y/N)
Relevant Exposure?
(Y/N with distance (m) from
monitoring site to
relevant exposure)
Distance to Kerb of Nearest
Road (m) (N/A if not applicable)
Does this Location
Represent Worst-Case
Exposure?
Site 23 Second Avenue,
Deeside Industrial Estate (Valspar)
Kerbside 332764 370981 2 NO2 N N N 1 N
Site 24/51
Llys Alun, Wrexham Road, Cefn Y Bedd Kerbside 331079 356100 1.8 NO2 N N - Duplicate Y (0) 2 Y
Site 25 BASF, Deeside Industrial Park,
Sealand Industrial 332031 371562 1.8 NO2 N N N 20 N
Site 26 Corus rear entrance DIP, Sealand Industrial 329906 370882 1.8 NO2 N N N 1 N
Site 27 89, Riverside Park, Garden City
Urban Background 333040 369051 2.2 NO2 N N Y (0) 15 Y
Site 28 Yacht Club,
Deeside Industrial Park, Sealand
Industrial 331184 372215 2 NO2 N N N 1 N
Site 29 Weighbridge Road, Deeside Industrial
Park, Sealand Industrial 330575 371802 2.2 NO2 N N N 1 N
Site 30 28, Chester Road, Pentre, Deeside
CH5 2DT Kerbside 332221 367723 1.8 NO2 N N Y (0) 5 Y
Site 31 Trelawney Towers 79 Chester Road,
Flint CH6 5DU Kerbside 324935 372722 2 NO2 N N Y (0) 18 Y
Site 32 Flint Town Council Buildings. Kerbside 324459 373141 4 NO2 N N Y (0) 6 N
Site 33 133, Main Road, Broughton CH4
0NR Kerbside 333568 363511 2.4 NO2 N N Y (0) 1 Y

North Wales Combined Authority
LAQM Progress Report 2017 28
Site ID Site Name Site Type X OS Grid Reference
Y OS Grid Reference
Site Height
(m) Pollutants Monitored
In AQMA?
Is Monitoring Co-located
with a Continuous
Analyser (Y/N)
Relevant Exposure?
(Y/N with distance (m) from
monitoring site to
relevant exposure)
Distance to Kerb of Nearest
Road (m) (N/A if not applicable)
Does this Location
Represent Worst-Case
Exposure?
Site 34 2, Coleshill Street, Holywell CH8 7UP Kerbside 318766 375758 2.4 NO2 N N Y (0) 1 Y
Site 35 Sycamore House, Greenfield Road,
Holywell CH8 7PY Kerbside 318735 376611 2.2 NO2 N N Y (0) 1 Y
Site 36 43, Station Road, Queensferry CH5
1SU Kerbside 331806 368271 2 NO2 N N Y (0) 5 Y
Site 37 Glendale Lodge, Rhydgaled, Mold
A5119 Kerbside 324281 364926 2 NO2 N N Y (0) 6 Y
Site 38 Oakdene, St Marys
Way, Broughton CH4 0NQ
Urban 334130 364076 1.8 NO2 N N Y (0) 23 Y
Site 39 Medical Centre,
High Street, Caergwrle
Kerbside 330436 357543 1.8 NO2 N N Y (0) 4 Y
Site 40 1 Manor Road, Sealand CH5 2SB Kerbside 333731 369079 1.8 NO2 N N Y (0) 15 Y
Site 41 Ty-Gwyn, A5118, Padeswood CH7
4JF Kerbside 328348 362413 2 NO2 N N Y (5) 15 N
Site 42 Casa Sol, High
Street, Bagillt CH6 6AP
Kerbside 322665 374595 1.8 NO2 N N Y (0) 7 Y
Site 43 9, Bryn Tirion,
Rhewl-Mostyn CH8 9QW
Urban Background 315580 380347 1.8 NO2 N N Y (0) 15 Y

North Wales Combined Authority
LAQM Progress Report 2017 29
Site ID Site Name Site Type X OS Grid Reference
Y OS Grid Reference
Site Height
(m) Pollutants Monitored
In AQMA?
Is Monitoring Co-located
with a Continuous
Analyser (Y/N)
Relevant Exposure?
(Y/N with distance (m) from
monitoring site to
relevant exposure)
Distance to Kerb of Nearest
Road (m) (N/A if not applicable)
Does this Location
Represent Worst-Case
Exposure?
Site 44 413 Chester Road,
Oakenholt, Flint CH6 5SF
Urban Background 325961 371822 2.2 NO2 N N Y (0) 15 Y
Site 45 Belmont, Alltami, Nr. Mold CH7 6LG Kerbside 326801 365668 1.8 NO2 N N Y (1) 20 Y
Site 46 22, Park View, Northop CH7 6DD
Urban Background 325136 368397 1.8 NO2 N N Y (5) 40 Y
Site 48 74, High Street, Saltney CH4 8SQ Kerbside 338283 365032 1.8 NO2 N N Y (0) 6 Y
Site 49 31, The Rowans, Broughton CH4
0TD Kerbside 333531 363028 2 NO2 N N Y (5) 25 Y
Site 50 Bryn Estyn,
Wrexham Road, Hope LL12 9NB
Kerbside 330972 358681 1.8 NO2 N N Y (0) 5 Y
Site 52 74, High Street, Saltney CH4 8SQ Kerbside 327463 364013 2 NO2 N N Y (0) 8 Y
Site 53 17, Mill Lane, Buckley CH7 3HA Kerbside 327849 364146 2.3 NO2 N N Y (4) 1 Y
Site 54 Elm Tree Rd Saughall Kerbside 335594 369179 2.3 NO2 N N Y (10) 1 N
Site 55 Ferry Lane, Chester Kerbside 337632 366682 2.2 NO2 N N Y (15) 2 N
Site 56 Deeside Lane, Sealand Kerbside 335292 368346 2.2 NO2 N N N 1 N
Site 57 Rose Cottage
Junction A5119/A494
Kerbside 324375 365007 2.2 NO2 N N Y (2) 1 Y

North Wales Combined Authority
LAQM Progress Report 2017 30
Site ID Site Name Site Type X OS Grid Reference
Y OS Grid Reference
Site Height
(m) Pollutants Monitored
In AQMA?
Is Monitoring Co-located
with a Continuous
Analyser (Y/N)
Relevant Exposure?
(Y/N with distance (m) from
monitoring site to
relevant exposure)
Distance to Kerb of Nearest
Road (m) (N/A if not applicable)
Does this Location
Represent Worst-Case
Exposure?
Site 58 South Bank, Aston Park, Queensferry
CH5 1XZ Kerbside 330969 367674 2.0 NO2
N Y* Y (4) 3 Y
Gwynedd Council GCC 002
Roundabout A487, Caernarfon (C1) Kerbside 248273 362132 1.96 NO2 N N Y (10) 1 No
GCC 003
Lon Campbell, Caernarfon (C3)
Urban Background
248480
363456 2 NO2 N N Y (5) N/A N/A
GCC 005
Ffordd Bangor, Caernarfon (C5) Kerbside 248892 364120 1.84 NO2 N N Y (7) 1 Yes
GCC 008 A4087, Bangor (B3) Kerbside 257587 371543 1.90 NO2 N N Y (2) 1 Yes
GCC 011 A5122, Bangor (B5) Kerbside 256292 371663 1.73 NO2 N N Y (>25) 1 Yes
GCC 012
Faenol Roundabout, Bangor (B6)
Kerbside
254286
368835 1.80 NO2 N N Y (>25) 1 Yes
GCC 013 Bethesda (BETH 1) Kerbside 261529 367380 2.03 NO2 N N Y (10) 1 Yes
GCC 015 Llanwnda (LL1) Roadside 247770 358663 1.93 NO2 N N Y 95) 2 Y
GCC 037
Poolside, Caernarfon (C6) Kerbside 248022 362757 1.93 NO2 N N Y (2) 1 Y
GCC 038 A55, Bangor (B4) Roadside 256871 369493 1.32 NO2 N N Y (>25) 2 Y
GCC 039
A55, Bangor (CO-LOC) Roadside 256871 369493 1.32 NO2 N N Y (>25) 2 Y

North Wales Combined Authority
LAQM Progress Report 2017 31
Site ID Site Name Site Type X OS Grid Reference
Y OS Grid Reference
Site Height
(m) Pollutants Monitored
In AQMA?
Is Monitoring Co-located
with a Continuous
Analyser (Y/N)
Relevant Exposure?
(Y/N with distance (m) from
monitoring site to
relevant exposure)
Distance to Kerb of Nearest
Road (m) (N/A if not applicable)
Does this Location
Represent Worst-Case
Exposure?
GCC 040 Pwllheli (PW1) Kerbside 237517 335217 2.04 NO2 N N Y (2) 1 Y
Wrexham County Borough Council WBC-001
Grosvenor Rd, Wrexham Roadside 333200 350600 2.75 NO2 N N N 5 Y
WBC-010
Ceiriog School, Chirk Suburban 329300 338300 2 NO2 N N Y (25) 2 Y
WBC-015
Gardden View, Ruabon Roadside 330300 344600 2 NO2 N N Y (15) 7 Y
WBC-018
Old Farm Rd, Rhostyllen Roadside 332000 349000 1.75 NO2 N N Y (40) 2 Y
WBC-019 Mold Rd, Wrexham Roadside 332600 351000 2 NO2 N N Y (30) 7 Y
WBC-020
Chester Rd, Wrexham Intermediate 333700 352900 2 NO2 N N Y (16) 3 Y
WBC-021 Holt Rd, Wrexham Roadside 334100 350700 1.75 NO2 N N Y (30) 2 Y
WBC-022 Holyhead Rd, Chirk Intermediate 328900 338700 1.5 NO2 N N Y (55) (30) 30 Y
WBC-030
Rhostyllen Roundabout,
Wrexham (A483) Roadside 330950 348170 1.5 NO2 N N Y (35) 4 Y
WBC-031
Bus Station, Wrexham Roadside 333350 350590 3 NO2 N N Y (35) (3) 2 Y
WBC-032
The Sycamores, Chester Road Roadside 333887 353222 1.75 NO2 N N Y (25) n/a Y
WBC-033 Smithfield Road Roadside 333981 350171 1.5 NO2 N N Y (4) 1 Y

North Wales Combined Authority
LAQM Progress Report 2017 32
Site ID Site Name Site Type X OS Grid Reference
Y OS Grid Reference
Site Height
(m) Pollutants Monitored
In AQMA?
Is Monitoring Co-located
with a Continuous
Analyser (Y/N)
Relevant Exposure?
(Y/N with distance (m) from
monitoring site to
relevant exposure)
Distance to Kerb of Nearest
Road (m) (N/A if not applicable)
Does this Location
Represent Worst-Case
Exposure?
WBC-034 Coed Poeth Roadside 329017 351002 2 NO2 N N Y (8) 9 Y
WBC-036 Acrefair Roadside 327630 342990 2 NO2 N N Y (2) 2 Y
WBC-037 Rossett Roadside 336635 357211 1.5 NO2 N N Y(7) 3 Y
WBC-039 Pentre Bach Roadside 331765 350132 1.5 NO2 N N Y (20) (2) 2 Y
WBC-040 Overton Roadside 337449 341702 1.5 NO2 N N Y (14) 4 Y
WBC-041 Marchwiel Roadside 335407 347890 2 NO2 N N Y (28) (3) 8 Y
WBC-042 Llan-Y-Pwll Roadside 335359 352178 1.75 NO2 N N Y (9) 5 Y
WBC-043 Hightown Roadside 333966 349691 2 NO2 N N Y(10) 1 Y
WBC-044 Cobden Road Roadside 332935 350278 2 NO2 N N Y(5) 1 Y
WBC-045 STANSTY Roadside 332214 351503 1.75 NO2 N N Y (8) 8 Y
WBC-046 Regent Street Roadside 333063 350587 2 NO2 N N Y(15) 1 Y
WBC-047 Chapel Lane Roadside 329023 338348 3 NO2 N N Y (50 (15) 1 Y
AURN 1 Victoria Road 1
Roadside 332900 349900 2 NO2 N Y
Y (20) (7) 5 Y AURN 2 Victoria Road 2 1.75 NO2 N Y

North Wales Combined Authority
LAQM Progress Report 2017 33
Site ID Site Name Site Type X OS Grid Reference
Y OS Grid Reference
Site Height
(m) Pollutants Monitored
In AQMA?
Is Monitoring Co-located
with a Continuous
Analyser (Y/N)
Relevant Exposure?
(Y/N with distance (m) from
monitoring site to
relevant exposure)
Distance to Kerb of Nearest
Road (m) (N/A if not applicable)
Does this Location
Represent Worst-Case
Exposure?
AURN 3 Victoria Road 3 2.75 NO2 N Y
WBC-026
Llwyneinion Rd Rhosllanerchrugog
Urban Background 347400 328700 1.5 C6H6 - - - - -
* Automatic monitoring station at this location ran by the Welsh Government. Data from the site is not yet available.
North Wales Combined Authority
LAQM Progress Report 2017 34
2.2 Comparison of Monitoring Results with Air Quality Objectives
2.2.1 Nitrogen Dioxide (NO2)
Automatic Monitoring Data
During 2016 automatic monitoring was carried out at one roadside location along
Victoria Road in WCBC.
The automatic monitoring data for NO2 can be seen in Table 2.3 and Table 2.4. Full
details of the QA/QC procedure are provided in Appendix A.
As data capture for NO2 was 84% during 2016, annualisation was not required.
Results for 2016 show that concentrations of NO2 at the Victoria Road AURN site in
Wrexham were below the annual mean objective and there were no exceedances of
the hourly mean objective.
Figure 2.19 shows the trend in annual mean NO2 concentrations at the automatic
monitoring site between 2012 and 2016. The annual mean NO2 concentration can be
seen to be declining since 2013 onwards. The decrease the annual mean NO2
concentration appears to have slowed between 2015 and 2016. Nonetheless, the
reported concentration is well below the annual mean objective and no exceedances
have been reported in the past 5 years.

North Wales Combined Authority
LAQM Progress Report 2017 35
Table 2.3 – Results of Automatic Monitoring for NO2: Comparison with Annual Mean Objective
ID Type Within AQMA?
Valid Data Capture for Monitoring Period % a
Valid Data Capture 2016
% b
Annual Mean Concentration (µg/m3)
2012 2013 2014 2015 2016
AURN (WCBC) Roadside N 84 84 20.2 21.8 21 19.1 18.8
Table 2.4 – Results of Automatic Monitoring for NO2: Comparison with 1-hour Mean Objective
ID Type Within AQMA?
Valid Data Capture for Monitoring Period % a
Valid Data Capture 2016
% b
Number of Hourly Means > 200µg/m3
2012 2013 2014 2015 2016
AURN (WCBC) Roadside N 84 84 0 0 0 0 0

North Wales Combined Authority
LAQM Progress Report 2017 36
Figure 2.19 – Trends in Annual Mean NO2 Concentrations Measured at Automatic Monitoring Stations
17
17.5
18
18.5
19
19.5
20
20.5
21
21.5
22
22.5
2012 2013 2014 2015 2016
An
nu
al M
ean
NO
2 C
on
cen
trat
ion
(µ
g/m
3)
Year

North Wales Combined Authority
LAQM Progress Report 2017 37
Diffusion Tube Monitoring Data
The NO2 diffusion tube data for 2016 is summarised in Table 2.5 for all six local
authorities. The full dataset, including the reported results from 2012 to 2016 and the
2016 monthly mean values are detailed in Appendix B and C respectively. Figure
2.20 to Figure 2.26 show the general trends in annual mean NO2 concentrations for
the past five years in all six local authorities. Only trend data for DT1 and DT2 in
IACC are available as the remaining diffusion tubes were installed in 2016 and
therefore no historic data is available.
Results for the year 2016 have been bias adjusted against national bias adjustment
factors for all six local authorities. For CCBC, DCC, FCC, IACC and WCBC a factor
of 0.78 was used and for GC a factor of 0.92 was used. Details of the factor selection
are outlined in Appendix A.
Annualisation was carried out at the following diffusion tube locations where data
capture was less than 75%:
DT2 and DT3 in the Isle of Anglesey County Council
Site 5/9/10 and Site 58 in Flintshire County Council
GCC 003 and GCC 037 in Gwynedd Council
WBC-047 in Wrexham County Borough Council Details of the annualisation process are outlined in Appendix A.
Only one exceedance of the annual mean AQS objective for NO2 was recorded at
any diffusion tube monitoring site within the North Wales Combined Authority. The
exceedance was reported at DT4 in IACC. The diffusion tube is located along the
A55 at a roadside location and did not represent relevant exposure. Following
distance correction to estimate the concentration at relevant exposure, the annual
mean NO2 concentration fell below 10% of the annual mean NO2 AQS objective. It
should be noted that DT4 in IACC is located over 20m from the nearest sensitive
receptor. Therefore, the predicted concentration at the relevant exposure site should
be treated with caution. As NO2 concentrations fall rapidly with distance it is unlikely
that concentrations at the sensitive receptor will be elevated.

North Wales Combined Authority
LAQM Progress Report 2017 38
There were a further two locations within the North Wales Combined Authority where
annual mean NO2 concentrations were reported to be within 10% of the annual mean
AQS objective for NO2. These were at DT1 in IACC and at Site 57 in FCC. Both
these diffusion tubes were at locations which did not represent annual mean relevant
exposure.
The NO2 fall-off with distance calculator was used to estimate the NO2 concentration
at the nearest location with relevant exposure for Site 57 in FCC. Following distance
correction, the annual mean NO2 concentration fell below 10% of the annual mean
NO2 AQS objective.

North Wales Combined Authority
LAQM Progress Report 2017 39
Figure A.2 and Figure A.3 in Appendix A detail the procedure for calculating the
concentration at relevant exposure for both DT4 and Site 57.
Distance correction was not carried out for DT1 as there were no nearby sensitive
receptors. However, it should be noted that DT1 in IACC is located close to an
authorised layby that has a maximum waiting time of 4-hours. Therefore DT1 is at a
location where the 1-hour NO2 AQS objective (not to be exceeded more than 18
times per year) would apply. Due to the use of a diffusion tube at this location no
hourly measurements are able to be recorded. In accordance with LAQM.TG16 the
1-hour AQS objective for NO2 is unlikely to be exceeded where the annual mean NO2
concentration is below 60µg/m3. The annual mean recorded at DT1 in 2016 was
45.2µg/m3; therefore it can be assumed that the 1-hour objective was not exceeded
at this location.
All other diffusion tubes measuring NO2 concentrations in the North Wales Combined
Authority were well below the annual mean NO2 AQS objective. Furthermore, annual
mean NO2 concentrations were not greater than 60µg/m3 at any non-automatic
monitoring site. Therefore exceedances of the 1-hour mean objective are unlikely at
all monitoring locations.
The diffusion tube study undertaken at 12 locations along the A5025 by IACC has
shown that annual mean NO2 concentrations are well below the annual mean AQS
objective. These results will help support the A5025 highways improvements
between Valley and the Wylfa Newydd Development Area. Furthermore, there were
no exceedances reported at relevant exposure locations across the main road
network in North Wales, including along the A55, A5 and A494.
There does not appear to be any clear overall trends with regards to annual mean
NO2 concentrations within the six local authorities. However, on the whole, there
appears to be a slight overall increase in NO2 concentrations when compared to the
2015 data. As this increase is widespread, it is unlikely that localised increases in
emissions are the cause. It is more likely that adverse meteorological conditions over
the year led to the overall increase in NO2 concentrations. Nonetheless, when
comparing NO2 concentrations over the past 5 years, there has been a clear
North Wales Combined Authority
LAQM Progress Report 2017 40
decrease reported at the majority of diffusion tube locations throughout the North
Wales Combined Authority since 2012.

North Wales Combined Authority
LAQM Progress Report 2017 41
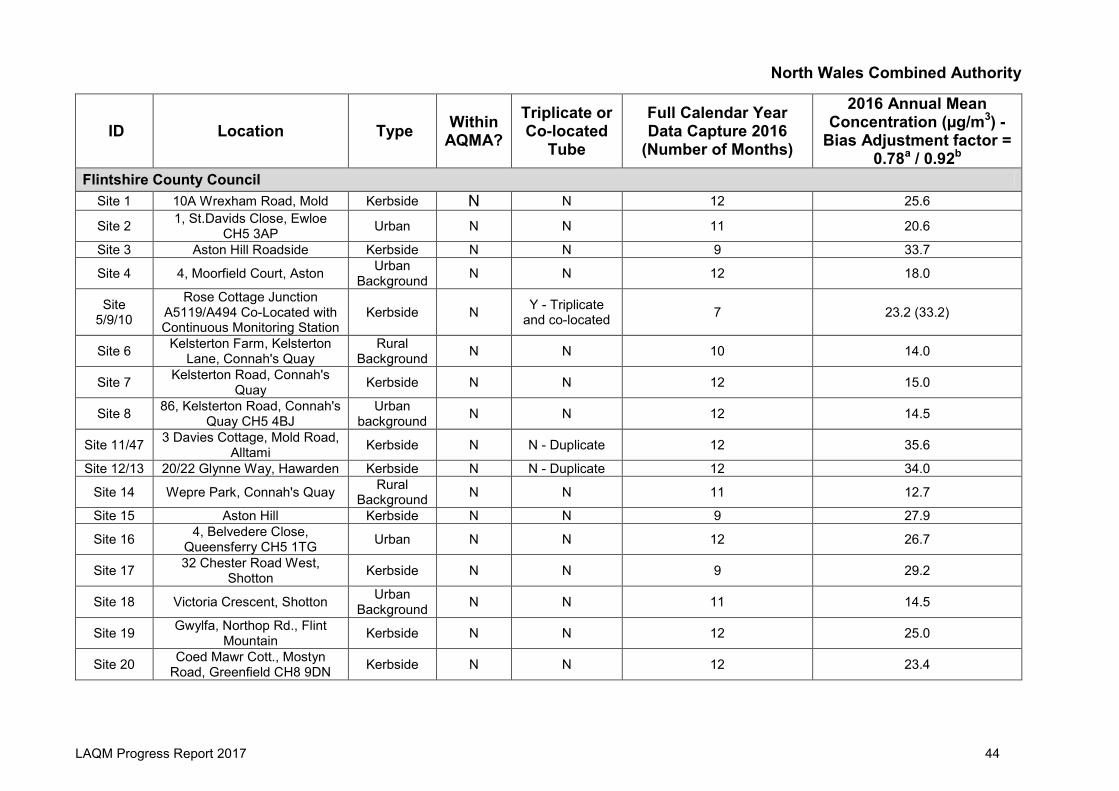
Table 2.5 – Results of NO2 Diffusion Tubes 2016
ID Location Type Within AQMA?
Triplicate or Co-located
Tube
Full Calendar Year Data Capture 2016
(Number of Months)
2016 Annual Mean Concentration (µg/m3) -
Bias Adjustment factor = 0.78a / 0.92b
Isle of Anglesey County Council DT1 Llanfair P.G. By-pass Kerbside N N 12 39.7
DT2 Bulkeley Square, Llangefni Kerbside N N 6 23.5 (28.0)
DT3 Penmynydd Road Roadside N N 6 9.5 (11.2)
DT4 Llanfair P.G. O2 Mast Roadside N N 11 45.2
DT5 Bridge over A55 Roadside N N 10 9.8
DT6 A55, Junction 4 Roadside N N 11 11.3
DT7 A5025, Valley Kerbside N N 11 15.3
DT8 A5025, Llanfachraeth Roadside N N 11 9.9
DT9 A5025, Llanfaethlu Roadside N N 11 9.5
DT10 A5025, Llanfellech Crossroads Roadside N N 11 7.0
DT11 A5025, Tregele Roadside N N 11 10.2
DT12 Ffordd Caergybi, Cemaes Roadside N N 11 9.0
DT13 Maes Cynfor, Cemaes Roadside N N 11 6.7
DT14 A5025, Amlwch Roadside N N 11 12.7
DT15 A5025 Near Salem Street, Amlwch Roadside N N 10 11.2
Conwy County Borough Council CBC-001 Theatre Colwyn, Colwyn Bay Roadside N N 12 19.3
CBC-034 Victoria Drive Roadside N N 10 21.1
CBC-004 Grove Park Rd. Colwyn Bay Urban Background N N 12 10.3

North Wales Combined Authority
LAQM Progress Report 2017 42
ID Location Type Within AQMA?
Triplicate or Co-located
Tube
Full Calendar Year Data Capture 2016
(Number of Months)
2016 Annual Mean Concentration (µg/m3) -
Bias Adjustment factor = 0.78a / 0.92b
CBC-016 Silva Gardens North, Llandudno
Urban Background N N 12 9.1
CBC-017 Kingsway,Colwyn Bay Roadside N N 12 19.0
CBC-018 Heol Dewi Pensarn Roadside N N 12 20.9
CBC-026 Chapel Street Abergele Roadside N N 12 27.8
CBC-025 Parc Llandudno Roadside N N 12 15.6
CBC-031 Conwy Road East (53), Llandudno Jcn Roadside N N 12 21.0
CBC-032 Conwy Road West, Llandudno Jcn (39) Roadside N N 12 18.9
CBC-021 Llanfairfechan Roadside N N 12 17.7
CBC-022 Bryn Marl, Mochdre Roadside N N 12 20.7
CBC-033 Coed Pella Road, Colwyn Bay Roadside N N 12 13.8
CBC-027 Llandudno Junction, New Roundabout Roadside N N 12 14.7
CBC-029 Llandudno Railway Stn Taxi Rank Roadside N N 9 11.2
Denbighshire County Council DBK1 Wellington Road, Rhyl Roadside N N 12 23.5
DBR2 10 Kinmel Street, Rhyl Roadside N N 12 26.4
DBB3 5 St. Georges Cres., Rhyl Suburban N N 12 9.8
DBB4 73 Bryn Coed Park, Rhyl Suburban N N 12 10.3
DBR5 2 Pant Glas, St. Asaph Suburban N N 12 15.5
DBR48 Adj. 1 Vale Street, Denbigh Roadside N N 11 26.7
DBR23 31 Ruthin Road, Denbigh Roadside N N 12 18.6

North Wales Combined Authority
LAQM Progress Report 2017 43
ID Location Type Within AQMA?
Triplicate or Co-located
Tube
Full Calendar Year Data Capture 2016
(Number of Months)
2016 Annual Mean Concentration (µg/m3) -
Bias Adjustment factor = 0.78a / 0.92b
DBR8 1 Plas Elwy Orchard, The Roe, St. Asaph Suburban N N 12 15.5
DBR9 7 Roe Park, St. Asaph Suburban N N 12 21.1
DBR10 13 Roe Park, St. Asaph Suburban N N 12 16.1
DBR24 Denbigh Cutters, 21 Vale Street, Denbigh Roadside N N 11 33.1
DBR20 25 Park Road, Ruthin. Roadside N N 11 19.8
DBR43 Adj HSBC Bank, Vale Street, Denbigh Roadside N N 12 29.1
DBR44 Opp Rowlands Pharm., Vale Street, Denbigh Roadside N N 11 25.0
DBR45 Adj 50 Vale Street, Denbigh Roadside N N 11 23.3
DBR37 Haul Fryn Depot, Ruthin Roadside N N 12 26.6
DBR38 Adj 62 Rhos Street, Ruthin Roadside N N 12 16.8
DBR31 2 Rhyl Road, Denbigh Kerbside N N 12 18.9
DBR32 47 High Street, Denbigh Roadside N N 12 18.9
DBR33 Adj CO-OP, High Street, Denbigh Roadside N N 11 28.2
DBR34 Adj Fairyburn, Rhyl Road, Denbigh Kerbside N N 12 15.2
DBR49 79 High Street, Prestatyn Roadside N N 12 17.1
DBR50 Adj., Saronie Court, High Street, Prestatyn Roadside N N 11 16.0
DBR52 Adj. Swayne Johnston Sol., Vale Street, Denbigh Roadside N N 12 24.1
DBR53 7 Vale Street, Denbigh Roadside N N 12 31.2
DBR54 Adj 2 Market Street, Ruthin Roadside N N 12 13.7
North Wales Combined Authority
LAQM Progress Report 2017 44
ID Location Type Within AQMA?
Triplicate or Co-located
Tube
Full Calendar Year Data Capture 2016
(Number of Months)
2016 Annual Mean Concentration (µg/m3) -
Bias Adjustment factor = 0.78a / 0.92b
Flintshire County Council Site 1 10A Wrexham Road, Mold Kerbside N N 12 25.6
Site 2 1, St.Davids Close, Ewloe CH5 3AP Urban N N 11 20.6
Site 3 Aston Hill Roadside Kerbside N N 9 33.7
Site 4 4, Moorfield Court, Aston Urban Background N N 12 18.0
Site 5/9/10
Rose Cottage Junction A5119/A494 Co-Located with Continuous Monitoring Station
Kerbside N Y - Triplicate and co-located 7 23.2 (33.2)
Site 6 Kelsterton Farm, Kelsterton Lane, Connah's Quay
Rural Background N N 10 14.0
Site 7 Kelsterton Road, Connah's Quay Kerbside N N 12 15.0
Site 8 86, Kelsterton Road, Connah's Quay CH5 4BJ
Urban background N N 12 14.5
Site 11/47 3 Davies Cottage, Mold Road, Alltami Kerbside N N - Duplicate 12 35.6
Site 12/13 20/22 Glynne Way, Hawarden Kerbside N N - Duplicate 12 34.0
Site 14 Wepre Park, Connah's Quay Rural Background N N 11 12.7
Site 15 Aston Hill Kerbside N N 9 27.9
Site 16 4, Belvedere Close, Queensferry CH5 1TG Urban N N 12 26.7
Site 17 32 Chester Road West, Shotton Kerbside N N 9 29.2
Site 18 Victoria Crescent, Shotton Urban Background N N 11 14.5
Site 19 Gwylfa, Northop Rd., Flint Mountain Kerbside N N 12 25.0
Site 20 Coed Mawr Cott., Mostyn Road, Greenfield CH8 9DN Kerbside N N 12 23.4

North Wales Combined Authority
LAQM Progress Report 2017 45
ID Location Type Within AQMA?
Triplicate or Co-located
Tube
Full Calendar Year Data Capture 2016
(Number of Months)
2016 Annual Mean Concentration (µg/m3) -
Bias Adjustment factor = 0.78a / 0.92b
Site 21 18, Kingsley Road, Garden City CH5 2JA
Urban Background N N 12 15.2
Site 22 Green Lane West, Sealand Rural Background N N 12 18.6
Site 23 Second Avenue, Deeside Industrial Estate (Valspar) Kerbside N N 10 24.4
Site 24/51 Llys Alun, Wrexham Road, Cefn Y Bedd Kerbside N N - Duplicate 10 31.4
Site 25 BASF, Deeside Industrial Park, Sealand Industrial N N 12 21.3
Site 26 Corus rear entrance DIP, Sealand Industrial N N 12 16.3
Site 27 89, Riverside Park, Garden City
Urban Background N N 11 21.3
Site 28 Yacht Club, Deeside Industrial Park, Sealand Industrial N N 12 15.5
Site 29 Weighbridge Road, Deeside Industrial Park, Sealand Industrial N N 12 18.0
Site 30 28, Chester Road, Pentre, Deeside CH5 2DT Kerbside N N 12 24.9
Site 31 Trelawney Towers 79 Chester Road, Flint CH6 5DU Kerbside N N 12 23.6
Site 32 Flint Town Council Buildings. Kerbside N N 12 20.2
Site 33 133, Main Road, Broughton CH4 0NR Kerbside N N 12 26.9
Site 34 2, Coleshill Street, Holywell CH8 7UP Kerbside N N 12 25.3
Site 35 Sycamore House, Greenfield Road, Holywell CH8 7PY Kerbside N N 12 21.0
Site 36 43, Station Road, Queensferry CH5 1SU Kerbside N N 12 23.2
Site 37 Glendale Lodge, Rhydgaled, Mold A5119 Kerbside N N 12 26.3

North Wales Combined Authority
LAQM Progress Report 2017 46
ID Location Type Within AQMA?
Triplicate or Co-located
Tube
Full Calendar Year Data Capture 2016
(Number of Months)
2016 Annual Mean Concentration (µg/m3) -
Bias Adjustment factor = 0.78a / 0.92b
Site 38 Oakdene, St Marys Way, Broughton CH4 0NQ Urban N N 12 19.1
Site 39 Medical Centre, High Street, Caergwrle Kerbside N N 12 17.2
Site 40 1 Manor Road, Sealand CH5 2SB Kerbside N N 11 16.8
Site 41 Ty-Gwyn, A5118, Padeswood CH7 4JF Kerbside N N 12 12.0
Site 42 Casa Sol, High Street, Bagillt CH6 6AP Kerbside N N 12 12.3
Site 43 9, Bryn Tirion, Rhewl-Mostyn CH8 9QW
Urban Background N N 12 9.2
Site 44 413 Chester Road, Oakenholt, Flint CH6 5SF
Urban Background N N 10 25.5
Site 45 Belmont, Alltami, Nr. Mold CH7 6LG Kerbside N N 12 17.8
Site 46 22, Park View, Northop CH7 6DD
Urban Background N N 11 12.7
Site 48 74, High Street, Saltney CH4 8SQ Kerbside N N 12 18.8
Site 49 31, The Rowans, Broughton CH4 0TD Kerbside N N 10 16.9
Site 50 Bryn Estyn, Wrexham Road, Hope LL12 9NB Kerbside N N 10 16.9
Site 52 74, High Street, Saltney CH4 8SQ Kerbside N N 12 16.6
Site 53 17, Mill Lane, Buckley CH7 3HA Kerbside N N 12 26.7
Site 54 Elm Tree Rd Saughall Kerbside N N 10 13.2 Site 55 Ferry Lane, Chester Kerbside N N 10 13.0 Site 56 Deeside Lane, Sealand Kerbside N N 9 13.2
Site 57 Rose Cottage Junction A5119/A494 Kerbside N N 11 37.8
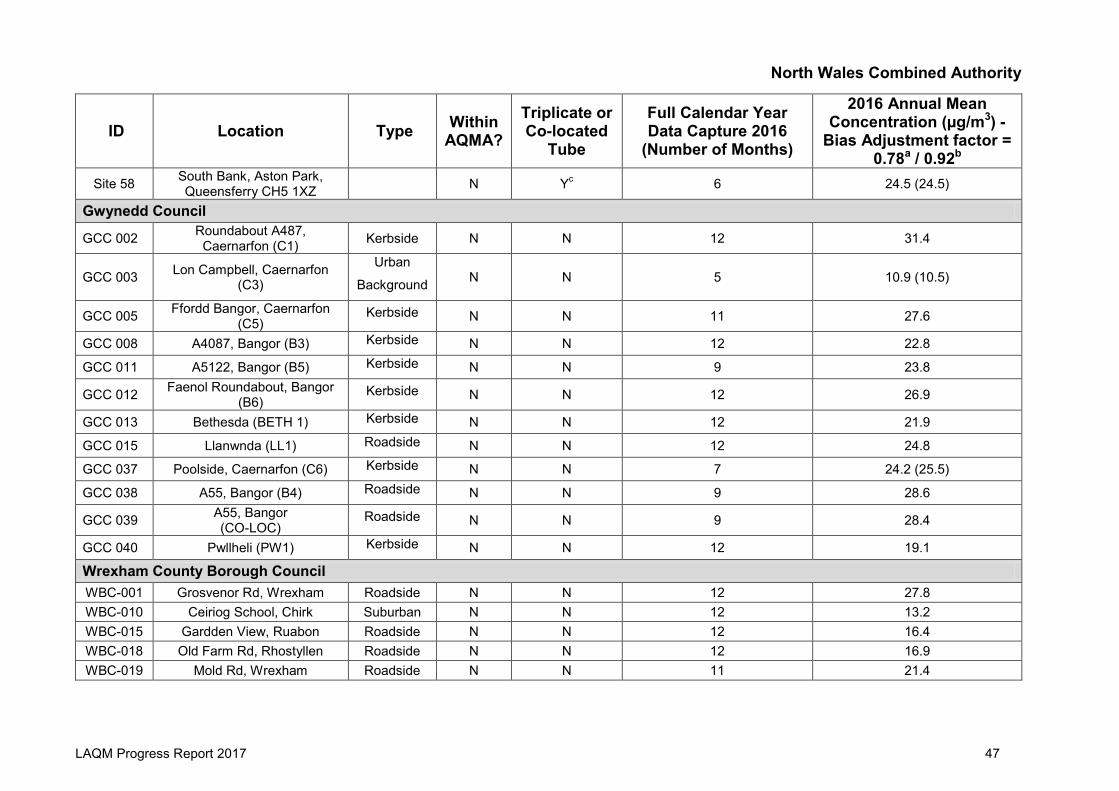
North Wales Combined Authority
LAQM Progress Report 2017 47
ID Location Type Within AQMA?
Triplicate or Co-located
Tube
Full Calendar Year Data Capture 2016
(Number of Months)
2016 Annual Mean Concentration (µg/m3) -
Bias Adjustment factor = 0.78a / 0.92b
Site 58 South Bank, Aston Park, Queensferry CH5 1XZ N Yc 6 24.5 (24.5)
Gwynedd Council
GCC 002 Roundabout A487, Caernarfon (C1) Kerbside N N 12 31.4
GCC 003 Lon Campbell, Caernarfon (C3)
Urban
Background N N 5 10.9 (10.5)
GCC 005 Ffordd Bangor, Caernarfon (C5)
Kerbside N N 11 27.6
GCC 008 A4087, Bangor (B3) Kerbside N N 12 22.8
GCC 011 A5122, Bangor (B5) Kerbside N N 9 23.8
GCC 012 Faenol Roundabout, Bangor (B6)
Kerbside N N 12 26.9
GCC 013 Bethesda (BETH 1) Kerbside N N 12 21.9
GCC 015 Llanwnda (LL1) Roadside N N 12 24.8
GCC 037 Poolside, Caernarfon (C6) Kerbside N N 7 24.2 (25.5)
GCC 038 A55, Bangor (B4) Roadside N N 9 28.6
GCC 039 A55, Bangor (CO-LOC)
Roadside N N 9 28.4
GCC 040 Pwllheli (PW1) Kerbside N N 12 19.1
Wrexham County Borough Council WBC-001 Grosvenor Rd, Wrexham Roadside N N 12 27.8 WBC-010 Ceiriog School, Chirk Suburban N N 12 13.2 WBC-015 Gardden View, Ruabon Roadside N N 12 16.4 WBC-018 Old Farm Rd, Rhostyllen Roadside N N 12 16.9 WBC-019 Mold Rd, Wrexham Roadside N N 11 21.4
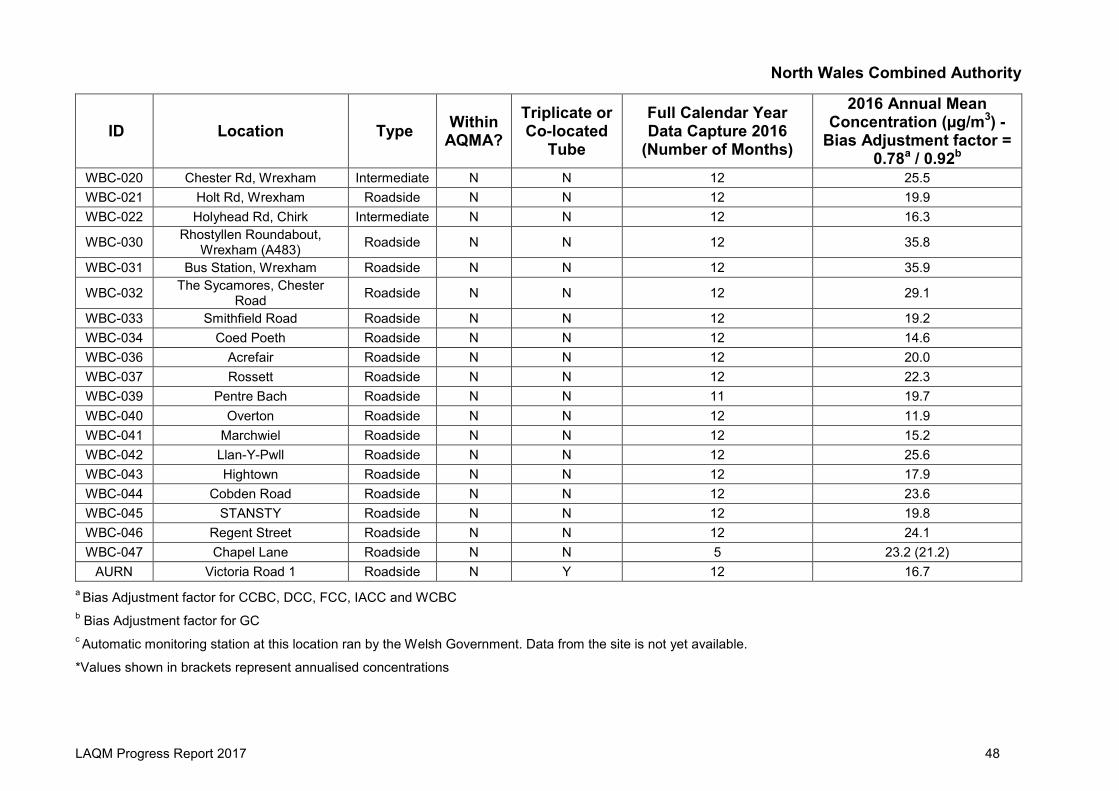
North Wales Combined Authority
LAQM Progress Report 2017 48
ID Location Type Within AQMA?
Triplicate or Co-located
Tube
Full Calendar Year Data Capture 2016
(Number of Months)
2016 Annual Mean Concentration (µg/m3) -
Bias Adjustment factor = 0.78a / 0.92b
WBC-020 Chester Rd, Wrexham Intermediate N N 12 25.5 WBC-021 Holt Rd, Wrexham Roadside N N 12 19.9 WBC-022 Holyhead Rd, Chirk Intermediate N N 12 16.3
WBC-030 Rhostyllen Roundabout, Wrexham (A483) Roadside N N 12 35.8
WBC-031 Bus Station, Wrexham Roadside N N 12 35.9
WBC-032 The Sycamores, Chester Road Roadside N N 12 29.1
WBC-033 Smithfield Road Roadside N N 12 19.2 WBC-034 Coed Poeth Roadside N N 12 14.6 WBC-036 Acrefair Roadside N N 12 20.0 WBC-037 Rossett Roadside N N 12 22.3 WBC-039 Pentre Bach Roadside N N 11 19.7 WBC-040 Overton Roadside N N 12 11.9 WBC-041 Marchwiel Roadside N N 12 15.2 WBC-042 Llan-Y-Pwll Roadside N N 12 25.6 WBC-043 Hightown Roadside N N 12 17.9 WBC-044 Cobden Road Roadside N N 12 23.6 WBC-045 STANSTY Roadside N N 12 19.8 WBC-046 Regent Street Roadside N N 12 24.1 WBC-047 Chapel Lane Roadside N N 5 23.2 (21.2)
AURN Victoria Road 1 Roadside N Y 12 16.7 a Bias Adjustment factor for CCBC, DCC, FCC, IACC and WCBC b Bias Adjustment factor for GC c Automatic monitoring station at this location ran by the Welsh Government. Data from the site is not yet available.
*Values shown in brackets represent annualised concentrations
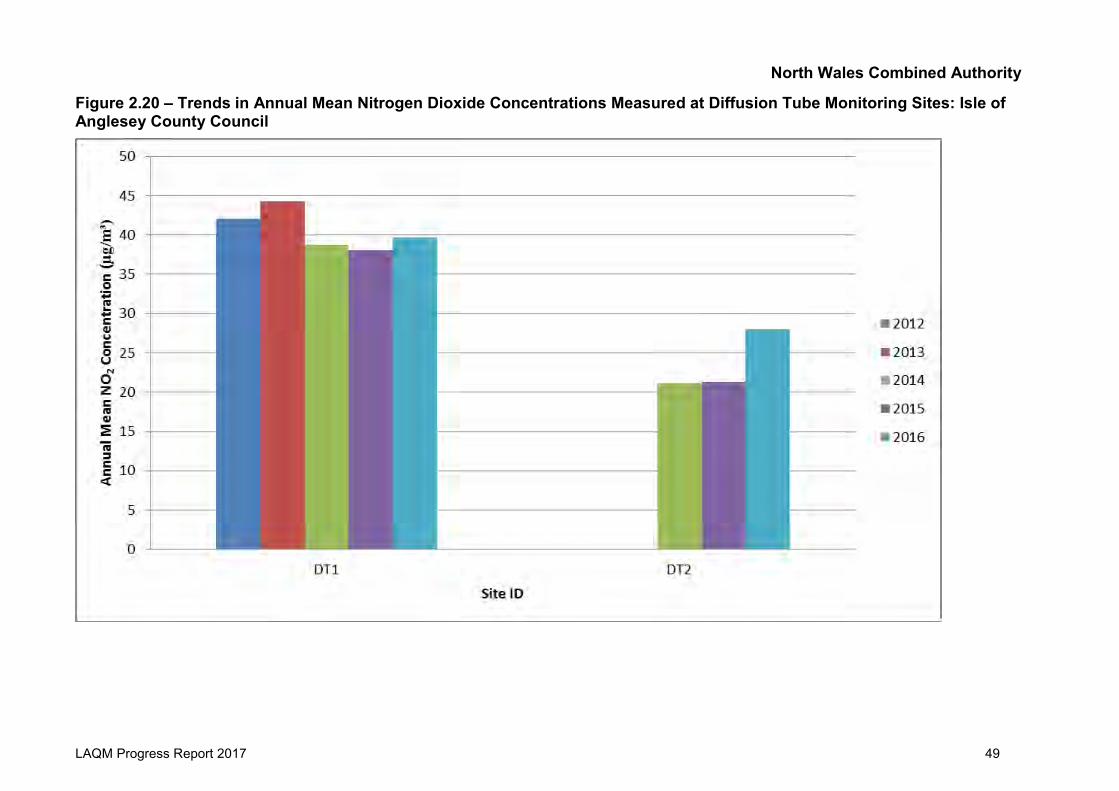
North Wales Combined Authority
LAQM Progress Report 2017 49
Figure 2.20 – Trends in Annual Mean Nitrogen Dioxide Concentrations Measured at Diffusion Tube Monitoring Sites: Isle of Anglesey County Council

North Wales Combined Authority
LAQM Progress Report 2017 50
Figure 2.21 – Trends in Annual Mean Nitrogen Dioxide Concentrations Measured at Diffusion Tube Monitoring Sites: Conwy County Borough Council

North Wales Combined Authority
LAQM Progress Report 2017 51
Figure 2.22 – Trends in Annual Mean Nitrogen Dioxide Concentrations Measured at Diffusion Tube Monitoring Sites: Denbighshire County Council

North Wales Combined Authority
LAQM Progress Report 2017 52
Figure 2.23 – Trends in Annual Mean Nitrogen Dioxide Concentrations Measured at Diffusion Tube Monitoring Sites: Flintshire Council <20µg/m3 in 2016

North Wales Combined Authority
LAQM Progress Report 2017 53
Figure 2.24 – Trends in Annual Mean Nitrogen Dioxide Concentrations Measured at Diffusion Tube Monitoring Sites: Flintshire Council >20µg/m3 in 2016
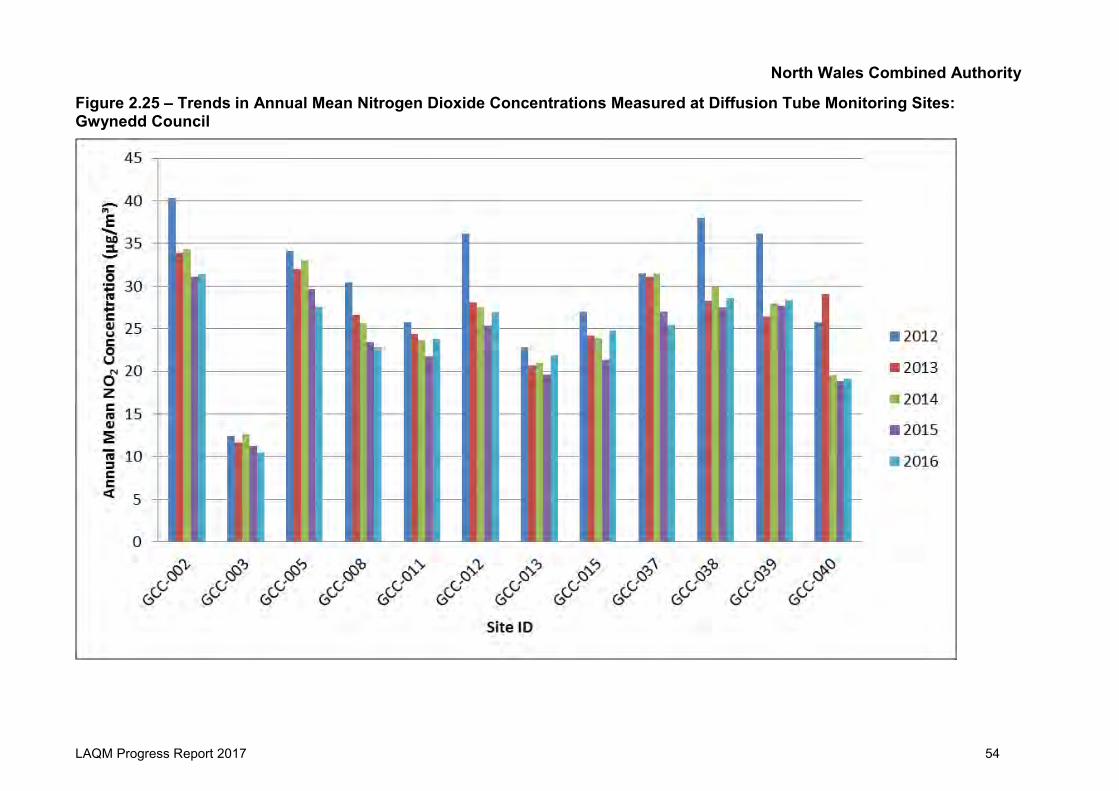
North Wales Combined Authority
LAQM Progress Report 2017 54
Figure 2.25 – Trends in Annual Mean Nitrogen Dioxide Concentrations Measured at Diffusion Tube Monitoring Sites: Gwynedd Council

North Wales Combined Authority
LAQM Progress Report 2017 55
Figure 2.26 – Trends in Annual Mean Nitrogen Dioxide Concentrations Measured at Diffusion Tube Monitoring Sites: Wrexham County Borough Council

North Wales Combined Authority
LAQM Progress Report 2017 56
2.2.2 Particulate Matter (PM10)
During 2016 PM10 monitoring was carried out at four rural and one roadside location
within the North Wales Combined Authority. The automatic monitoring data for PM10
can be seen in Table 2.6 and Table 2.7. Full details of the QA/QC procedures are
provided in Appendix A.
The four Osiris monitoring stations were run by IACC. Data capture was above 75%
at CM1 (Llynfaes) and CM3 (Felin Cafnan). Data capture was just under 75% at CM2
(Brynteg). CM4 (IVC Penhesgyn) was decommissioned in August 2016 and therefore
only half a years’ worth of data was captured. Annualisation was carried out at CM2
and CM4. It should be noted that the background automatic monitoring stations used
to annualise the data against were over 100km from the monitoring sites. Therefore,
the results of the annualisation should be used with caution as the background
locations may not necessarily be representative of the background conditions at the
PM10 monitoring sites. Further information can be found in Appendix A.
CM1 reported 4 exceedances of the 24-hour mean objective. This is well below the
18 allowed exceedances in a year. As less than 85% of data was available at sites
CM2, CM3 and CM4, the 90.4th percentile was recorded to compare against the 24-
hour mean objective. The 90.4th percentile concentrations were all well below the
objective level of 50µg/m3. The roadside monitoring location measuring PM10 was
situated along Victoria Road in Wrexham and is run by the AURN. There were also
no exceedances of the 24-hour mean air quality objective at this location.
No exceedances of the annual mean air quality objective was reported at any of the
PM10 monitoring locations in 2016. Figure 2.27 shows the trend in annual mean PM10
concentrations over the past 5 years. CM3 was not included in the graph as 2016
was the first year with a complete set of data available.
CM2 reported the lowest annual mean PM10 concentration in 2016. Concentrations
have continued to decline since 2014. The Osiris is located by a quarry and suggests
that improvements made to manage dust emissions at the quarry have been
successful in reducing PM10 concentrations. CM4 and the AURN monitoring sites

North Wales Combined Authority
LAQM Progress Report 2017 57
have also both reported a decrease in annual mean PM10 concentrations since 2015.
CM4 is located on the boundary of a recycling centre with no relevant exposure
nearby. The site is now out of service. The AURN site is located at a roadside
location. Similar to the annual mean NO2 downward trend at the same site, it is likely
that traffic management in the area has reduced the level of pollutants emitted from
vehicles.
An increase in the annual mean PM10 concentration was reported at CM1. There has
been a reported upward trend in annual mean PM10 concentrations since 2014. Prior
to 2014 concentrations had been gradually declining. The monitoring site is located
at a quarry. The quarry implemented a stockpile management plan in late 2013 which
resulted in processed material being relocated away from the site boundary to a
more sheltered location. Reported concentrations are still below levels prior to this
management plan being enforced however, continued monitoring at the site will help
determine whether it has been successful in maintaining a low PM10 annual mean
concentration.
CM3 was relocated to a National Trust Property in December 2015 which is close to
the Wylfa Newydd construction site. The annual mean PM10 concentration reported
at this site was well below the AQS objective in 2016. Continued monitoring at this
site will help assess annual PM10 trends at the site.
Overall there have been no reported exceedances of the annual and 24-hour mean
AQS objectives for PM10 at any of the monitoring locations in 2016.

North Wales Combined Authority
LAQM Progress Report 2017 58
Table 2.6 – Results of Automatic Monitoring for PM10: Comparison with Annual Mean Objective
ID Type Within AQMA?
Valid Data Capture for Monitoring Period %
Valid Data Capture 2016 %
Confirm Gravimetric
Equivalent (Y or N/A)
Annual Mean Concentration (µg/m3)
2012 2013 2014 2015 2016
Isle of Anglesey County Council CM1 Rural N 86.9 86.9 Y 25.4 19.2 13.8 17.2 18.8 CM2 Rural N 74.3 74.3 Y 15.6 15.2 17.6 13.1 8.1 (8.1) CM3 Rural N 76.8 76.8 Y - - - 34.8a 14.9 CM4 Rural N 78.2 46.2b Y 14.3 - 9.8 10.4 9.0 (9.1)
Wrexham County Borough Council AURN Roadside N 96 96 Y 15.1 17.1 14.1 13.3 12.2
a CM3 installed on the 16th December 2015 bCM4 was decommissioned in August 2016 *Values shown in brackets represent annualised concentrations
Table 2.7 – Results of Automatic Monitoring for PM10: Comparison with 24-hour Mean Objective
ID Type Within AQMA?
Valid Data Capture for Monitoring Period %
Valid Data Capture 2016 %
Confirm Gravimetric
Equivalent (Y or N/A)
Number of Daily Means > 50µg/m3
2012 2013 2014 2015 2016
Isle of Anglesey County Council CM1 Rural N 86.9 86.9 Y 8 5 2 2 4 CM2 Rural N 74.3 74.3 Y 4 0 6 3 16.9µg/m3
CM3 Rural N 76.8 76.8 Y - - - - 24.9µg/m3 CM4 Rural N 78.2 46.2a Y 1 - 0 0 15.5µg/m3
Wrexham County Borough Council AURN Roadside N 96 96 Y 4 12 8 3 0
aCM4 was decommissioned in August 2016 *Where there is less than 85% data capture, the 90.4th percentile is reported

North Wales Combined Authority
LAQM Progress Report 2017 59
Figure 2.27 – Trends in Annual Mean PM10 Concentrations
2.2.3 Particulate Matter (PM2.5)
Obligatory standards for PM2.5 are provided in the AQS however currently there is no
statutory duty on local government to achieve of these standards. Nonetheless, as
detailed in Policy Guidance LAQM.PG16 (Chapter 7), local authorities are expected
to work towards reducing emissions and/or concentrations of PM2.5. PM2.5 monitoring
is carried out at the Victoria Road AURN continuous monitor in Wrexham County
Borough Council and at CM1, CM2, CM3 and CM4 in the Isle of Anglesey County
Council. No other local authorities in the North Wales Combined Authority monitor
PM2.5.
Annualisation was carried out at CM2 and CM4. It should be noted that the
background automatic monitoring stations used to annualise the data against were
over 80km from the monitoring sites. Therefore, the results of the annualisation
should be used with caution as the background locations may not necessarily be
representative of the background conditions at the PM2.5 monitoring sites. Further
information can be found in Appendix A.

North Wales Combined Authority
LAQM Progress Report 2017 60
Table 2.8 shows the results of the PM2.5 monitoring over the past five years. The
IACC only began publishing collected PM2.5 data in 2016 as a response to the
growing interest surrounding the health impacts of PM2.5. As a consequence, data for
previous years are not available for these sites.
No exceedances of the 25µg/m3 annual mean target, to be achieved by 2020 and
published in the AQS, were recorded in the past five years at any of the monitoring
locations.
Table 2.8 – Results of PM2.5 Automatic Monitoring
Site ID Type Within AQMA?
Valid Data Capture for Monitoring Period %
Valid Data
Capture 2016 %
Annual mean concentrations (µg/m3)
2012 2013 2014 2015 2016
Isle of Anglesey County Council CM1 Rural N 86.9 86.9 - - - - 6.1
CM2 Rural N 74.3 74.3 - - - - 3.9 (4.0)
CM3 Rural N 76.8 76.8 - - - - 7.4
CM4 Rural N 78.2 46.2a - - - - 5.3 (5.4)
Wrexham County Borough Council Victoria Road AURN
Roadside N 93 93 9.3 10.5 9.3 8 7.8
aCM4 was decommissioned in August 2016 *Values shown in brackets represent annualised concentrations
Figure 2.28 shows the trend in annual mean PM2.5 concentrations over the past five
years. There has been a gradual decline recorded at the AURN site since 2013 with
concentrations decreasing from 10.5µg/m3 in 2013 to 7.8µg/m3 in 2016. However the
decrease in annual mean concentrations appears to level off slightly between 2015
and 2016. Nonetheless, the reported concentrations are well below the 25µg/m3
target value. Only 2016 data is available for CM1, CM2, CM3 and CM4. At all
monitoring locations annual mean PM2.5 concentrations are well below the target
value.

North Wales Combined Authority
LAQM Progress Report 2017 61
Figure 2.28 – Trends in Annual Mean PM2.5 Concentrations at the AURN Continuous Monitoring Site
2.2.4 Sulphur Dioxide (SO2)
SO2 monitoring is only carried out in Wrexham County Borough Council, at the AURN
Victoria Road automatic monitoring station. The following table shows the results of
the SO2 monitoring.
Table 2.9 – Results of SO2 Automatic Monitoring
ID Type Within AQMA?
Valid Data Capture
for Monitoring Period %
Valid Data
Capture 2016 %
Number of: 15-minute Means > 266µg/m3
1-hour Means > 350µg/m3
24-hour Means > 125µg/m3
Victoria Road AURN
Roadside N 97 97 0 0 0
Table 2.9 shows the annual mean SO2 concentrations at the Victoria Road AURN
station. There is no annual mean objective in the AQS for SO2 and therefore the
graph is solely to illustrate the trend in SO2 concentrations over the past 5 years.
Since 2012 the annual mean SO2 concentration has stayed relatively consistent and
remained low.

North Wales Combined Authority
LAQM Progress Report 2017 62
Figure 2.29 – Trends in SO2 Concentrations
There were no reported exceedances of the objective levels for SO2 and therefore
there is no need to proceed to a detailed assessment.
2.2.5 Benzene (C6H6)
Benzene monitoring is only carried out in Wrexham County Borough Council who
maintains one diffusion tube for monitoring benzene near to an acid tar lagoon. It has
been sited in this location to monitor for benzene levels that may be released from
the lagoon.
Table 2.10 – Results of Benzene Diffusion Tube Monitoring
Site ID Location Within AQMA?
Data Capture 2017 (%)
Annual mean concentrations (µg/m3)
2012 2013 2014 2015 2016
WCBC26 Llwyneinion Rd (Rhosllanerchrugog) N 100 0.9 0.7 0.9 0.8 0.7
The annual mean benzene concentration recorded in 2016 was well below the limit
value of 5µg/m3. Figure 2.30 shows the trend in annual mean benzene
concentrations for the past 5 years.

North Wales Combined Authority
LAQM Progress Report 2017 63
Figure 2.30 – Trends in Annual Mean Benzene Concentrations
The graph shows that the level of benzene recorded in Rhosllanerchrugog have
remained largely consistent since monitoring began. No exceedances of the
objective level have been reported in the last 5 years. As a result, there is no need to
proceed to a detailed assessment for Benzene.
2.2.1 Other Pollutants Monitored
No other pollutants listed on the Air Quality Standards are monitored within the North
Wales Combined Authority. No new or existing sources of pollution have been
identified that may lead to an exceedance of the Air Quality objectives of any other
pollutant not covered in this report.
2.2.2 Summary of Compliance with AQS Objectives
The North Wales Combined Authority has examined the results from monitoring in
the six local authority areas (Isle of Anglesey County Council, Conwy Borough
Council, Denbighshire County Council, Flintshire Council, Gwynedd Council and
Wrexham County Borough Council).
Concentrations are all below the objectives or at locations not relevant to exposure,
therefore there is no need to proceed to a Detailed Assessment.

North Wales Combined Authority
LAQM Progress Report 2017 64
3 New Local Developments 3.1 Road Traffic Sources Table 3.1 shows the newly identified developments which have been approved in
2016. The table includes details on the outcome of the decision with regards to
impacts on air quality.
Table 3.1 – Approved Planning Applications: Road Traffic Sources Local
Authority Source Type Planning Application Outcome
Isle of Anglesey County Council
Roads with significantly
changed traffic flows.
New roads
constructed or proposed since
the last Updating and Screening Assessment.
Application for a leisure village at Penrhos Coastal Park, London Road, Holyhead. Comprising up to 500 new leisure units, a central hub building with leisure facilities.
Traffic assessed as part of planning application process. No significant air quality impacts predicted.
Application for the erection of a replacement Alternative Emergency Control Centre and District Survey Laboratory facilities to support the Magnox Power Station. Includes parking and new vehicular access and road widening.
It is deemed unlikely that the changes proposed to the road layout will significantly impact air quality.
Application for the erection of a science park, creation of a car park and installation of solar panels. New vehicular access on land at Cefn Du, Gaerwen.
Receptors located over 300m from the source of air pollution. No significant impacts on sensitive receptors are predicted.
A5025 highways improvements between Valley and the Wylfa Newydd Development Area.
Improvements to the A5025 from Valley to Wylfa have been discussed in the 2016 Air Quality Progress Report. A 12 month NO2 diffusion tube study at various locations along the A5025 commenced in February 2016. See Section 2.2.1 for results of this study.

North Wales Combined Authority
LAQM Progress Report 2017 65
Local Authority Source Type Planning Application Outcome
Conwy County
Borough Council
Roads with significantly
changed traffic flows.
Construction and operation of a new superstore and restaurant development including demolition, preparatory earthworks, a new (A1) retail superstore unit, a new (Sui Generis) petrol filling station, 4 new (including 1no. replacement) (A3) restaurant units, a new primary site access road from the A55, hard and soft landscaping and associated new drainage and utility infrastructure at former Brickworks Site, Tremarl Industrial Estate.
An air quality assessment was carried out in support of the application. The existing air quality in the area is significantly below Objective levels and the assessment predicted that annual mean NO2 and PM10 concentrations will have a small/imperceptible impact.
Demolition of all existing on-site buildings and structures at Land in Colwyn Bay Town Centre. The construction of a new four storey council office building including customer service area, child contact centre, CCTV suite, multi storey car park, landscaping and other associated facilities and works.
Due to the potential increase in traffic associated with the use of the large facility an air quality assessment was carried out. The impact significance was predicted to be negligible for the sensitive receptors identified for both NO2 and PM10. Diffusion tubes are now located at positions representing worst case scenario receptor points.
Gwynedd Council
New roads constructed or proposed since
the last Updating and Screening Assessment.
Bypass from the Goat roundabout on the A499/A487 junction to the Plas Menai roundabout, around Llanwnda, Dinas, Bontnewydd and Caernarfon avoiding the town centres.
An air quality assessment was carried out to assess the air quality impacts from construction and operation on both human and ecological receptors. No significant adverse impacts are anticipated.
Since the previous Local Authority Air Quality Progress Reports, there have been
none of the following new or newly identified developments:
Narrow congested streets with residential properties close to the kerb;
Busy streets where people may spend one hour or more close to traffic;
Roads with a high flow of buses and/or HGVs;
Junctions; or
Bus or coach stations.
3.2 Other Transport Sources Since the previous Local Authority Air Quality Progress reports, there have been
none of the following new or newly identified developments:
Airports;

North Wales Combined Authority
LAQM Progress Report 2017 66
Locations where diesel or steam trains are regularly stationary for periods of
15 minutes or more, with potential for relevant exposure within 15m;
Locations with a large number of movements of diesel locomotives, and
potential long-term relevant exposure within 30m; or
Ports for shipping.
3.3 Industrial Sources Table 3.2 shows the newly identified developments which have been approved in
2016. The table includes details on the outcome of the decision with regards to
impacts on air quality.
Table 3.2 – Approved Planning Applications: Industrial Sources Local
Authority Source Type Planning Application Outcome
Isle of Anglesey County Council
New or proposed installations
Application for the erection of a replacement Alternative Emergency Control Centre and District Survey Laboratory facilities to support the Magnox Power Station. Includes installation of emergency generators, which will be tested periodically.
It is considered unlikely that these emergency generators will lead to exceedances of the Air Quality Objectives.
Petrol Stations
Application for the demolition of a petrol station and the adjacent retail furniture unit, together with the erection of a new petrol filling station, replacement of underground fuel tanks together with the erection of three retail units and three storage units and alterations to the existing access at Herron Serivce, Ffordd Glanhwfa Road, Llangefni.
Impacts associated with the application have been assessed and no significant impacts on air quality are predicted. Stage I and II vapour recovery will be included as part of the development.
Since the previous Local Authority Air Quality Progress Reports, there have been
none of the following new or newly identified developments:
Industrial installations: existing where emissions have increased substantially
or relevant exposure introduced;
Major fuel storage depots;

North Wales Combined Authority
LAQM Progress Report 2017 67
3.4 Commercial and Domestic Sources Table 3.3 shows the newly identified developments which have been approved in
2016. The table includes details on the outcome of the decision with regards to
impacts on air quality.
Table 3.3 – Approved Planning Applications: Commercial and Domestic Sources
Local Authority Source Type Planning Application Outcome
Isle of Anglesey County Council
Combined Heat and Power (CHP)
Plant
Application for a leisure village at Penrhos Coastal Park, London Road, Holyhead. Includes the use of Combined Heat and Power.
Separate chimney height assessments are required as part of the planning application.
Since the previous Local Authority Air Quality Progress Reports, there have been
none of the following new or newly identified developments:
Biomass combustion plant – individual installations;
Areas where the combined impact of several biomass combustion sources
may be relevant; or
Areas where domestic solid fuel burning may be relevant.
3.5 New Developments with Fugitive or Uncontrolled Sources
Since the previous Local Authority Air Quality Progress Reports, there have been
none of the following new developments:
Landfill sites;
Quarries;
Unmade haulage roads on industrial sites;
Waste transfer stations etc; or
Other potential sources of fugitive particulate emissions.
The North Wales Combined Authority confirms that there are no new or newly
identified local developments which may have an impact on air quality within the
Local Authority areas.
The North Wales Combined Authority confirms that all the following have been
considered:

North Wales Combined Authority
LAQM Progress Report 2017 68
Road traffic sources Other transport sources Industrial sources Commercial and domestic sources New developments with fugitive or uncontrolled sources.

North Wales Combined Authority
LAQM Progress Report 2017 69
4 Air Quality Planning Policies There are no AQMAs declared in the North Wales Combined Authority. Therefore
there are currently no active air quality action plans. As air quality is considered to be
good within all six local authority areas, there have been no local policies specifically
related to air quality developed. Nonetheless, air quality is considered in the wider
context in several local policies including:
The Isle of Anglesey County Council and Gwynedd Council have adopted a
joint Local Development Plan which provides the land use strategy for the next
15 years. The plan addresses the need to maintain good air quality in the area
and ensure new development does not cause adverse impacts.
The Conwy Local Development Plan 2007-2022 includes strategic policies
(NTE/1) to ensure natural resources, including air quality, are protected.
The Denbighshire County Council Local Development Plan 2006-2021 was
adopted in 2013 and includes a commitment to avoid reaching critical air
quality levels. It acknowledges that assessments of the environmental impact
of transport proposals will need to also include air pollution along with noise
and ecological impacts.
Flintshire County Council is currently preparing their Local Development Plan.
However, in the interim their Unitary Development Plan for the 15 year period,
from 2000 to 2015 remains adopted. The plan identifies sites where new
housing, employment and other development can take place, as well as
setting out policies to protect important countryside, habitats, resources and
heritage. Specific to air quality, Policy STR1 addresses the need to minimise
pollution to air, water and land when proposing new developments and STR7
highlights the need to safeguard the natural environment.
Wrexham County Borough Council is currently preparing the Local
Development Plan 2 2013 to 2028 which will replace the adopted Unitary
Development Plan 1996 to 2011. The plan is a long-term land use and
development strategy focused on achieving sustainable development. It will
set out policies that will be used to decide planning applications and safeguard
areas of land requiring protection including strategies to ensure the
environment is protected from adverse effects of pollution.

North Wales Combined Authority
LAQM Progress Report 2017 70
5 Local Transport Plans and Strategies North Wales Joint Local Transport Plan (LTP) (2015-2025) has been jointly produced
by the six North Wales Local Authorities in response to the Welsh Government
requirement for LTPs to be submitted by the end of January 2015. The plan
preparation has been overseen by Taith as a Joint Committee of the local authorities
for transport. The Plan is a statutory document for transport in the region.
A review of the Wales Transport Strategy Objectives, the Welsh Government targets
for investment and the Regional Transport Plan priorities, together with the review of
issues and opportunities led to the drafting of outcomes for the Local Transport Plan.
The Local Transport Plan Outcomes that relate to bringing about air quality
improvements includes:
Connections to Key Destinations and Markets: Support for Economic Growth
through an improvement in the efficiency, reliability, resilience, and
connectivity of movement, including freight, within and between North Wales
and other regions and countries (with a particular focus on accessibility to the
Enterprise Zones and an improvement in the vitality and viability of towns and
other key centres);
Benefits and Minimised Impacts on the Environment: the potential for transport
improvements to positively affect the local and global natural and built
environment will have been maximised and negative impacts minimised,
including adaptation to the effects of climate change.
A set of higher level interventions have been developed which together aim to deliver
the vision and outcomes sought for the LTP:
Transport network resilience improvements–Improvements to key county
corridors to remove/ improve resilience problems
Integration with strategic public transport services–Schemes to improve
access to rail stations including road access and bus services and interchange
facilities, support for park and ride, walking and cycling routes and facilities.
Improved links to Employment–Schemes to provide improved access to
Enterprise Zones (EZs), ports, employment sites and town centres.

North Wales Combined Authority
LAQM Progress Report 2017 71
Access to services–Range of integrated transport measures to improve
access to education, health, community, shopping and other services by
public transport, walking and cycling as well as community transport, taxi, car
share sites.
Encouraging sustainable travel–Infrastructure improvements and promotional
initiatives to increase levels of walking and cycling both for travel and for
leisure as well as public transport. May include road and rail bridges/
crossings, cycle routes, footway/ footpath provision, safe routes to school,
travel planning as well as road safety measures to assist vulnerable users

North Wales Combined Authority
LAQM Progress Report 2017 72
6 Conclusions and Proposed Actions 6.1 Conclusions from New Monitoring Data Monitoring carried out in 2016 indicated that annual mean and hourly concentrations
of NO2 were below the relevant AQS objective for all but one monitoring location
within the North Wales Combined Authority. The one diffusion tube location (DT1 in
IACC) was situated at a kerbside site along the A55 and did not represent relevant
exposure. Therefore an exceedance at this location was not deemed to be of
concern.
The annual mean concentrations of PM10, PM2.5 and C6H6 and the 24-hour mean
concentrations of PM10 were below the relevant AQS objectives at all sites where
monitoring was undertaken. Furthermore, the 15 minute, 1-hour and 24-hour mean
concentrations of SO2 were all also below the relevant AQS objectives.
6.2 Other Conclusions There were no local developments approved in 2016, in the North Wales Combined
Authority, which are expected to cause an adverse air quality impact on the
surrounding area. Therefore no newly identified or previously unconsidered sources
of air pollution were introduced in 2016.
No detailed assessments are required as a result of exceedances of pollutant
concentrations and no AQMAs need to be declared. As a result there are no air
quality action plans in the North Wales Combined Authority. Nonetheless, wider
policy documents discussed in Section 4 and 5 address air quality issues to ensure
concentrations remain below the AQS objectives.
6.3 Proposed Actions The recommendations for the coming year are listed below:
Proceed to the 2018 Updating and Screening Assessment;
Maintain the air quality monitoring programmes in each local authority and
ensure new monitoring sites are added as required.

North Wales Combined Authority
LAQM Progress Report 2017 73
7 References Department for Environment, Food and Rural Affairs (Defra) (2016) Local Air
Quality Management Technical Guidance LAQM.TG(16).
Department for Environment, Food and Rural Affairs (Defra) (2016) Local Air
Quality Management Policy Guidance LAQM.PG(16).
Isle of Anglesey County Council (2016) Annual Status Report
Conwy County Borough Council (2016) Annual Status Report
Denbighshire County Council (2016) Annual Status Report
Gwynedd Council (2016) Annual Status Report
Flintshire County Council (2016) Annual Status Report
Wrexham County Borough Council (2016) Annual Status Report
National Diffusion Tube Bias Adjustment Spreadsheet, version 07/17
published in July 2017.
https://laqm.defra.gov.uk/assets/airptrounds7to18apr2015feb2017.pdf
https://www.gwynedd.llyw.cymru/en/Council/Strategies-and-
policies/Environment-and-planning/Planning-policy/Joint-Local-Development-
Plan/Joint-Local-Development-Plan.aspx
Flintshire County Council Unitary Development Plan 2000-2015
http://www.flintshire.gov.uk/en/PDFFiles/Planning/LDP-evidence-
base/Local/North-Wales-Joint-Local-Transport-Plan-2015.pdf
The Conwy Local Development Plan 2007-2022
The Denbighshire County Council Local Development Plan 2006-2021
Wrexham County Borough Council Unitary Development Plan 1996 to 2011

North Wales Combined Authority
LAQM Progress Report 2017 74
Appendices
Appendix A: Quality Assurance / Quality Control (QA/QC) Data
Appendix B: Complete Monitoring Results (2012-2016)
Appendix C: Full Monthly Diffusion Tube Results for 2016

North Wales Combined Authority
LAQM Progress Report 2017 75
Appendix A: QA/QC Data
Diffusion Tube Bias Adjustment Factors
The diffusion tubes for CCBC, DCC, FCC, IACC and WCBC are supplied and
analysed by Environmental Scientific Group (ESG) Didcot utilising the 50%
triethanolamine (TEA) in acetone preparation method. The bias adjustment factor for
2016 is 0.78 (based on 38 studies, June 2017) as obtained from the national bias
adjustment calculator.
The diffusion tubes for GC are supplied and analysed by Gradko utilising 20% TEA in
water preparation method. The bias adjustment factor for 2016 is 0.92 (based on 27
studies, June 2017) as obtained from the national bias adjustment calculator.
Factor from Local Co-location Studies A co-location study was undertaken at one location within the North Wales Combined
Authority. Three diffusion tubes were co-located at the Victoria Road AURN
continuous monitoring station in WCBC. The data capture in 2016 was above 90%
during 9 of the monitoring periods and the precision was good at 11 of the monitoring
periods. A factor of 0.93 was produced from the study, which is present in Figure A.1.
Figure A.1 – Factor from Local Co-Location Study

North Wales Combined Authority
LAQM Progress Report 2017 76
Discussion of Choice of Factor to Use
Data have been corrected using a bias adjustment factor, which is an estimate of the
difference between diffusion tube concentrations and continuous monitoring, the
latter assumed to be a more accurate method of monitoring. The technical guidance
LAQM.TG(16) provides guidance with regard to the application of a bias adjustment
factor to correct diffusion tubes. Triplicate co-location studies can be used to
determine a local bias factor based on the comparison of diffusion tube results with
data from NOx/NO2 continuous analysers. Alternatively, the national database of
diffusion tube co-location surveys provides bias factors for the relevant laboratory
and preparation method.
No co-location studies were carried out in CCBC, DCC, FCC, IACC and GC.
Therefore the relevant national bias adjustment factor was used to adjust the
diffusion tube data in 2016. The co-location study carried out in WCBC had good
precision for 11 months and data capture of more than 90% for 9 months. However it
was deemed appropriate to use the national bias adjustment factor, which was based
on 38 studies and therefore considered to be more representative, to adjust the
diffusion tube data in WCBC in 2016.
For previous year’s data 2012 to 2015, the bias adjustment factors have been taken
from the Council’s previous LAQM annual reports. The factors used are as follows:
IACC: 0.79 (2012), 0.81 (2013), 0.81 (2014) and 0.79 (2015);
CCBC: 0.79 (2012), 0.80 (2013), 0.81 (2014) and 0.81 (2015);
DCC: 0.79 (2012), 0.80 (2013), 0.81 (2014) and 0.79 (2015);
FCC: 1.05 (2012), 0.81 (2013), 0.76 (2014) and 0.8 (2015);
GC: 0.97 (2012), 0.95 (2013), 0.92 (2014) and 0.88 (2015); and
WBCB: 0.8 (2012), 0.8 (2013), 0.81 (2014) and 0.81 (2015).
PM Monitoring Adjustment
The particulate monitoring undertaken in WCBC was via use of daily gravimetric
Partisols. These meet the European equivalence testing and therefore are not
subject to any correction.
North Wales Combined Authority
LAQM Progress Report 2017 77
The Osiris instruments run by IACC have not been adjusted. The IACC have
previously demonstrated that an adjustment factor of 1.3 would lead to a significant
overestimation of the impact of coarse dust (e.g. quarry dust). Therefore it was
deemed inappropriate to adjust the data gathered using the Osiris monitors as these
instruments are normally monitoring for the coarse fractions e.g. quarry dust.
QA/QC of Automatic Monitoring The Victoria Road AURN automatic monitoring station in Wrexham County Borough
Council is part of the Automatic Urban and Rural Network (AURN). The data
ratification and station audit are carried out by Ricardo-AEA under contract with
DEFRA and the Devolved Administrations.
The four PM10 automatic monitoring stations in the Isle of Anglesey County Council
are run by the local authority. Routine filter changes and air flow checks (600ml/min)
on the Turnkey Osiris instruments are carried out normally on a quarterly basis. This
is in addition to an annual service and calibration undertaken by Turnkey Instruments
under the terms of the service contract. The data is downloaded electronically from
each of the instruments approximately 2 to 3 times a week using a GSM modem.
This enables the performance of the instrument to be monitored and enables
problems to be rectified quickly and with minimum loss of data. The data is stored as
15-minute averages and is analysed using a dedicated software system (AirQ32). A
visual data ratification process is employed, to safeguard against erroneous peaks
etc., before any results are reported.
QA/QC of Diffusion Tube Monitoring
ESG Didcot and Gradko are both UKAS accredited laboratories who participates in
the in the new AIR-PT Scheme (a continuation of the Workplace Analysis Scheme for
Proficiency (WASP)) for NO2 tube analysis and the Annual Field Inter-Comparison
Exercise. These provide strict performance criteria for participating laboratories to
meet, thereby ensuring NO2 concentrations reported are of a high calibre. The labs
follow the procedures set out in the Harmonisation Practical Guidance In the latest
available AIR-PT results, AIR-PT AR 0012 (January to February 2016), AIR-PT
AR013 (April to May 2016), AIR-PT AR015 (July to August 2016), AIR-PT AR016
(September to October 2016) and AIR-PT AR01 (October to November 2016).

North Wales Combined Authority
LAQM Progress Report 2017 78
ESG Didcot has scored 100% except AR013 and AR015 with 75%. The percentage
score reflects the results deemed to be satisfactory based upon the z-score of < ± 2.
75% of all local Authority co-location studies in 2016 were rated as ‘good’ (tubes are
considered to have "good" precision where the coefficient of variation of duplicate or
triplicate diffusion tubes for eight or more periods during the year is less than 20%).
Gradko has scored 100% on all results. The percentage score reflects the results
deemed to be satisfactory based upon the z-score of < ± 2. All local Authority co-
location studies in 2016 were rated as ‘good’ (tubes are considered to have "good"
precision where the coefficient of variation of duplicate or triplicate diffusion tubes for
eight or more periods during the year is less than 20%).
Fall-off with Distance Correction of Sites Exceeding and within 10% of the NO2 Annual Mean Objective There was one diffusion tube location which exceeded the annual mean AQS
objective for NO2 (DT4 in IACC). There were a further two diffusion tube locations
where the reported concentration was within 10% of the annual mean AQS objective
for NO2. The two locations were Site 57 in FCC and DT1 in IACC. DT1 was at a
kerbside location which did not represent exposure and therefore no adjustment was
required for this site.
The two remaining locations required adjustment using the NO2 fall-off with distance calculator to calculator to estimate the NO2 concentration at the nearest location with relevant exposure. The exposure. The calculations are shown in

North Wales Combined Authority
LAQM Progress Report 2017 79
Figure A.2 and Figure A.3. It should be noted that DT4 was over 20m from a
sensitive receptors and therefore the predicted concentration should be treated with
caution.

North Wales Combined Authority
LAQM Progress Report 2017 80
Figure A.2 – Fall-off Distance Correction of DT4: Isle of Anglesey County Council
Figure A.3 – Fall-off Distance Correction of Site 57: Flintshire Council
Short-term to Long-term Data Adjustment Data capture at all sites which recorded less than 75% data capture during 2016 has
been annualised according to the method set out in Boxes 7.9 and 7.10 of
LAQM.TG16. The details of the annualisation have been provided in Table A.1 to
Table A.3.
It should be noted that the background automatic stations used for annualisation of
the PM10 and PM2.5 data were over 80km from the monitoring locations. Therefore,
the annualised results should be treated with caution as the background locations

North Wales Combined Authority
LAQM Progress Report 2017 81
may not necessarily be representative of the conditions at the monitoring sites in
Anglesey.
Table A.1 – Short-Term to Long-Term Monitoring NO2 Adjustment: Non-Automatic Stations
Site Uncorrected
Diffusion Tube Mean
(μg/m3)
Annualisation Factor Annualised Data
Average (μg/m3)
Annualised Bias
Adjusted Concentration (μg/m3)
Glazebury Stoke-
on-Trent
Aston Hill
Wirral Tranmere Average
Isle of Anglesey County Council DT2 30.1 1.026 1.000 0.909 1.113 1.012 30.5 28.0
DT3 12.2 0.977 1.000 1.103 0.917 0.999 12.2 11.2
Gwynedd Council GCC 003 11.9 0.946 0.955 0.853 1.083 0.959 11.4 10.5
GCC 037 26.3 0.976 0.989 1.206 1.042 1.053 27.7 25.5
Flintshire Council Site5/9/10 39.7 1.094 1.039 1.016 1.144 1.073 42.6 33.2
Site 58 31.5 0.977 1.000 1.103 0.917 0.999 31.4 24.5
Wrexham County Borough Council WBC-047 29.4 0.904 0.956 0.984 0.867 0.928 27.2 25.3
Table A.2 – Short-Term to Long-Term Monitoring PM10 Adjustment
Site Uncorrected
Mean (μg/m3)
Annual Mean/Period Mean (µg/m³) Average
Ratio Corrected
Mean Salford Eccles
Sheffield Devonshire
Green
Chesterfield Loundsley
Green Isle of Anglesey County Council
CM2 8.1 17.3/17.4 17.6/17.2 14.7/14.6 1.01 8.1
CM4 9.0 17.3/16.6 17.6/16.9 14.7/15.1 1.02 9.1
Table A.3 – Short-Term to Long-Term Monitoring PM2.5 Adjustment
Site Uncorrected
Mean (μg/m3)
Annual Mean/Period Mean (µg/m³) Average Ratio
Corrected Mean Salford
Eccles Wirral
Tranmere Stoke-on-
Trent Isle of Anglesey County Council
CM2 3.9 10.5/10.3 7.9/7.5 11.7/11/1 1.04 4.0
CM4 5.3 10.5/10.0 7.9/7.5 11.7/12/2 1.02 5.4
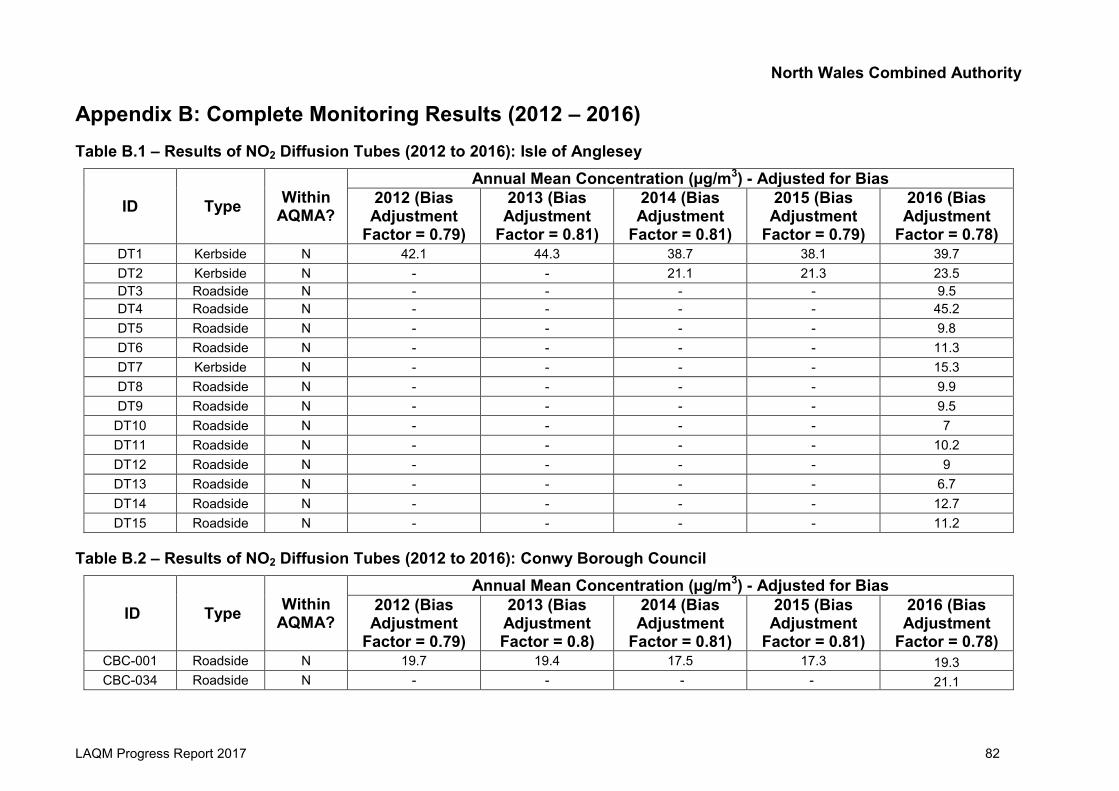
North Wales Combined Authority
LAQM Progress Report 2017 82
Appendix B: Complete Monitoring Results (2012 – 2016) Table B.1 – Results of NO2 Diffusion Tubes (2012 to 2016): Isle of Anglesey
ID Type Within AQMA?
Annual Mean Concentration (µg/m3) - Adjusted for Bias 2012 (Bias Adjustment
Factor = 0.79)
2013 (Bias Adjustment
Factor = 0.81)
2014 (Bias Adjustment
Factor = 0.81)
2015 (Bias Adjustment
Factor = 0.79)
2016 (Bias Adjustment
Factor = 0.78) DT1 Kerbside N 42.1 44.3 38.7 38.1 39.7 DT2 Kerbside N - - 21.1 21.3 23.5 DT3 Roadside N - - - - 9.5 DT4 Roadside N - - - - 45.2 DT5 Roadside N - - - - 9.8 DT6 Roadside N - - - - 11.3 DT7 Kerbside N - - - - 15.3 DT8 Roadside N - - - - 9.9 DT9 Roadside N - - - - 9.5
DT10 Roadside N - - - - 7 DT11 Roadside N - - - - 10.2 DT12 Roadside N - - - - 9 DT13 Roadside N - - - - 6.7 DT14 Roadside N - - - - 12.7 DT15 Roadside N - - - - 11.2
Table B.2 – Results of NO2 Diffusion Tubes (2012 to 2016): Conwy Borough Council
ID Type Within AQMA?
Annual Mean Concentration (µg/m3) - Adjusted for Bias 2012 (Bias Adjustment
Factor = 0.79)
2013 (Bias Adjustment Factor = 0.8)
2014 (Bias Adjustment
Factor = 0.81)
2015 (Bias Adjustment
Factor = 0.81)
2016 (Bias Adjustment
Factor = 0.78) CBC-001 Roadside N 19.7 19.4 17.5 17.3 19.3 CBC-034 Roadside N - - - - 21.1
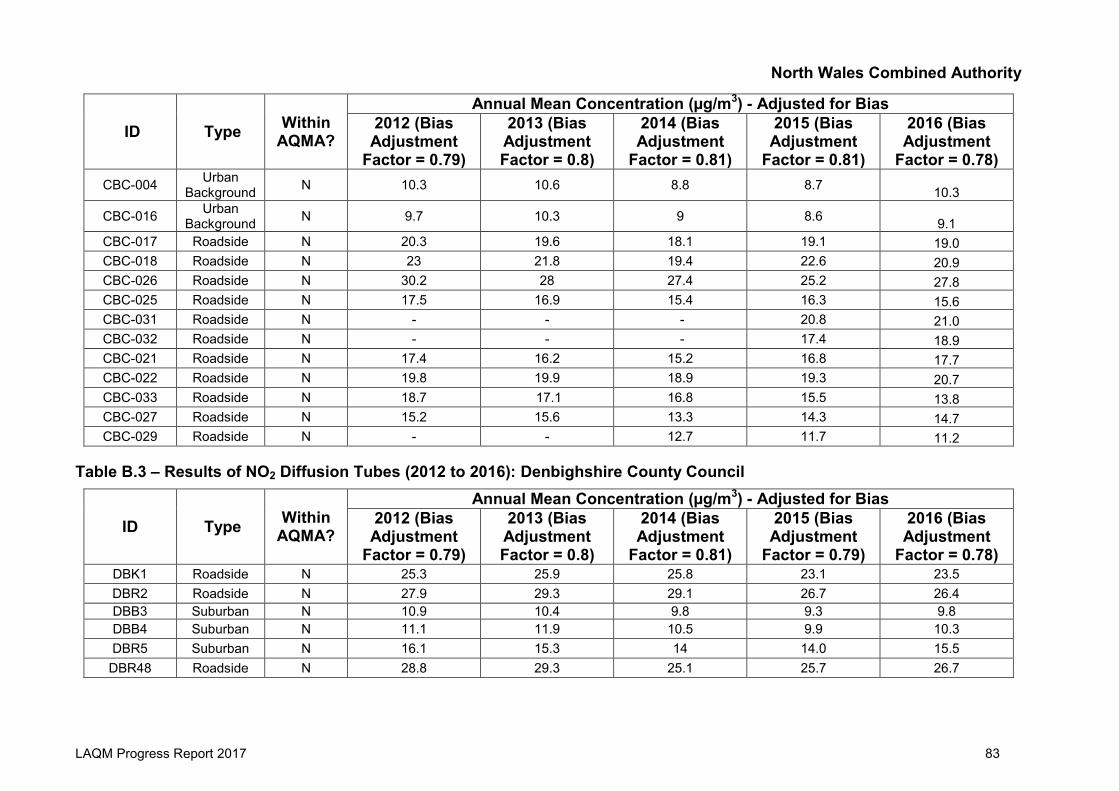
North Wales Combined Authority
LAQM Progress Report 2017 83
ID Type Within AQMA?
Annual Mean Concentration (µg/m3) - Adjusted for Bias 2012 (Bias Adjustment
Factor = 0.79)
2013 (Bias Adjustment Factor = 0.8)
2014 (Bias Adjustment
Factor = 0.81)
2015 (Bias Adjustment
Factor = 0.81)
2016 (Bias Adjustment
Factor = 0.78) CBC-004 Urban
Background N 10.3 10.6 8.8 8.7 10.3
CBC-016 Urban Background N 9.7 10.3 9 8.6 9.1
CBC-017 Roadside N 20.3 19.6 18.1 19.1 19.0 CBC-018 Roadside N 23 21.8 19.4 22.6 20.9 CBC-026 Roadside N 30.2 28 27.4 25.2 27.8 CBC-025 Roadside N 17.5 16.9 15.4 16.3 15.6 CBC-031 Roadside N - - - 20.8 21.0 CBC-032 Roadside N - - - 17.4 18.9 CBC-021 Roadside N 17.4 16.2 15.2 16.8 17.7 CBC-022 Roadside N 19.8 19.9 18.9 19.3 20.7 CBC-033 Roadside N 18.7 17.1 16.8 15.5 13.8 CBC-027 Roadside N 15.2 15.6 13.3 14.3 14.7 CBC-029 Roadside N - - 12.7 11.7 11.2
Table B.3 – Results of NO2 Diffusion Tubes (2012 to 2016): Denbighshire County Council
ID Type Within AQMA?
Annual Mean Concentration (µg/m3) - Adjusted for Bias 2012 (Bias Adjustment
Factor = 0.79)
2013 (Bias Adjustment Factor = 0.8)
2014 (Bias Adjustment
Factor = 0.81)
2015 (Bias Adjustment
Factor = 0.79)
2016 (Bias Adjustment
Factor = 0.78) DBK1 Roadside N 25.3 25.9 25.8 23.1 23.5 DBR2 Roadside N 27.9 29.3 29.1 26.7 26.4 DBB3 Suburban N 10.9 10.4 9.8 9.3 9.8 DBB4 Suburban N 11.1 11.9 10.5 9.9 10.3 DBR5 Suburban N 16.1 15.3 14 14.0 15.5 DBR48 Roadside N 28.8 29.3 25.1 25.7 26.7

North Wales Combined Authority
LAQM Progress Report 2017 84
ID Type Within AQMA?
Annual Mean Concentration (µg/m3) - Adjusted for Bias 2012 (Bias Adjustment
Factor = 0.79)
2013 (Bias Adjustment Factor = 0.8)
2014 (Bias Adjustment
Factor = 0.81)
2015 (Bias Adjustment
Factor = 0.79)
2016 (Bias Adjustment
Factor = 0.78) DBR23 Roadside N 18.9 19.5 17.3 17.2 18.6 DBR8 Suburban N 17.1 16.9 15.1 14.7 15.5 DBR9 Suburban N 23.6 21.3 21.8 21.2 21.1 DBR10 Suburban N 16.8 16.2 16.4 14.5 16.1 DBR24 Roadside N 34.4 34.1 32.6 32.5 33.1 DBR20 Roadside N 24.4 24 21.3 21.2 19.8 DBR43 Roadside N 37.7 36.7 31.9 32.8 29.1 DBR44 Roadside N 28.5 28.8 25.9 24.2 25.0 DBR45 Roadside N 25.7 24.9 23 21.6 23.3 DBR37 Roadside N 29.9 29.4 28.5 28.0 26.6 DBR38 Roadside N 21 19.9 17.9 16.5 16.8 DBR31 Kerbside N 20.1 19.6 18 17.0 18.9 DBR32 Roadside N 20.9 20.9 19.1 18.5 18.9 DBR33 Roadside N 27.3 25.7 22.1 29.0 28.2 DBR34 Kerbside N 16.9 15.8 14.7 13.6 15.2 DBR49 Roadside N - 18.8 16.7 16.0 17.1 DBR50 Roadside N - 18.5 16.5 16.4 16.0 DBR52 Roadside N - 30.5 30.3 21.7 24.1 DBR53 Roadside N - 31.7 30.7 28.2 31.2 DBR54 Roadside N - - 16.1 13.2 13.7
Table B.4 – Results of NO2 Diffusion Tubes (2012 to 2016): Flintshire Council
ID Type Within AQMA?
Annual Mean Concentration (µg/m3) - Adjusted for Bias 2012 (Bias Adjustment
Factor = 1.05)
2013 (Bias Adjustment
Factor = 0.81)
2014 (Bias Adjustment
Factor = 0.76)
2015 (Bias Adjustment Factor = 0.8)
2016 (Bias Adjustment
Factor = 0.78) Site 1 Kerbside N 37.8 30.3 25.4 21.1 25.6

North Wales Combined Authority
LAQM Progress Report 2017 85
ID Type Within AQMA?
Annual Mean Concentration (µg/m3) - Adjusted for Bias 2012 (Bias Adjustment
Factor = 1.05)
2013 (Bias Adjustment
Factor = 0.81)
2014 (Bias Adjustment
Factor = 0.76)
2015 (Bias Adjustment Factor = 0.8)
2016 (Bias Adjustment
Factor = 0.78) Site 2 Urban N 25.7 20.4 20.8 17.4 20.6 Site 3 Kerbside N 48.3 32.9 30.2 26.3 33.7
Site 4 Urban Background N 21.2 16.7 14.1 15.9 18
Site 5/9/10 Kerbside N - 33.7 29.8 31.2 33.2
Site 6 Rural Background N 15.9 11 14.6 9.3 14
Site 7 Kerbside N 21 16.4 14.7 14.9 15
Site 8 Urban background N 20.2 16.4 13.8 12.9 14.5
Site 11/47 Kerbside N 44.9 31.8 31.5 32.9 35.6 Site 12/13 Kerbside N 45.7 35.1 33.4 35.4 34
Site 14 Rural Background N 11.9 10 8.7 8.6 12.7
Site 15 Kerbside N - 28.9a 27.3 27.9 27.9 Site 16 Urban N 37.5 28.9 26.8 26.2 26.7 Site 17 Kerbside N 33.3 27.1 23.9 24.8 29.2
Site 18 Urban Background N 19.6 15.5 12.1 11.5 14.5
Site 19 Kerbside N 31.3 23.2 22.1 20.7 25 Site 20 Kerbside N 31.2 24 21.5 20.7 23.4
Site 21 Urban Background N 19.9 15.3 13.7 13 15.2
Site 22 Rural Background N 32.6 20.8 19.4 18.7 18.6
Site 23 Kerbside N 39.8 28.1 21.8 21.4 24.4 Site 24/51 Kerbside N 45.9 37.4 34.9 34.9 31.4
Site 25 Industrial N 25.2 19 16.9 18.1 21.3 Site 26 Industrial N 20.5 16.5 14.5 15 16.3

North Wales Combined Authority
LAQM Progress Report 2017 86
ID Type Within AQMA?
Annual Mean Concentration (µg/m3) - Adjusted for Bias 2012 (Bias Adjustment
Factor = 1.05)
2013 (Bias Adjustment
Factor = 0.81)
2014 (Bias Adjustment
Factor = 0.76)
2015 (Bias Adjustment Factor = 0.8)
2016 (Bias Adjustment
Factor = 0.78) Site 27 Urban
Background N 30.4 24.3 21.8 21.7 21.3
Site 28 Industrial N 24.6 18.5a 15.7 17.4 15.5 Site 29 Industrial N 23.6 19 17.6 15.8 18 Site 30 Kerbside N 40.1 30.7 25 23.2 24.9 Site 31 Kerbside N 20.5 23.1 22.2 20.3 23.6 Site 32 Kerbside N 27.7 22.6 19.9 24.6 20.2 Site 33 Kerbside N 34.7 27.1 23.1 25.1 26.9 Site 34 Kerbside N 29.9 23 23.5 24.7 25.3 Site 35 Kerbside N 26.4 19 17.5 18.3 21 Site 36 Kerbside N 31.9 23.6 22 21.5 23.2 Site 37 Kerbside N 34.5 27.4 25.3 26.2 26.3 Site 38 Urban N 24.2 18.7 16.6 16.8 19.1 Site 39 Kerbside N 24.6 19.4 16.7 15.9 17.2 Site 40 Kerbside N 21.5 16.9 14.9 15.7 16.8 Site 41 Kerbside N 14.5 11.8 10.6 9.9 12 Site 42 Kerbside N 17 13.4 11.9 10.6 12.3
Site 43 Urban Background N 11.4 9.9 8.6 9.3 9.2
Site 44 Urban Background N 32.5 28.1 24.7 25.6 25.5
Site 45 Kerbside N 23.2 18.3 17.5 16.1 17.8
Site 46 Urban Background N 18.6 15.1 11.6 12.5 12.7
Site 48 Kerbside N 28 22 18.1 23 36.6 Site 49 Kerbside N 25.6 19.4 19.3 17.8 18.8 Site 50 Kerbside N 21 17.6 14.3 15.1 16.9 Site 52 Kerbside N 23.2 18.1 17.2 15.1 16.6

North Wales Combined Authority
LAQM Progress Report 2017 87
ID Type Within AQMA?
Annual Mean Concentration (µg/m3) - Adjusted for Bias 2012 (Bias Adjustment
Factor = 1.05)
2013 (Bias Adjustment
Factor = 0.81)
2014 (Bias Adjustment
Factor = 0.76)
2015 (Bias Adjustment Factor = 0.8)
2016 (Bias Adjustment
Factor = 0.78) Site 53 Kerbside N 34.1 23.6 24.2 25.3 26.7 Site 54 Kerbside N - - - 10.5 13.2 Site 55 Kerbside N - - - 10.5 13 Site 56 Kerbside N - - - 12.7 13.2 Site 57 Kerbside N 50.8 40 34.8 35.9 37.8 Site 58 N - - - - 24.5
Results in bold exceed the annual mean NO2 AQS objective of 40µg/m³
Table B.5 – Results of NO2 Diffusion Tubes (2012 to 2016): Gwynedd Council
ID Type Within AQMA?
Annual Mean Concentration (µg/m3) - Adjusted for Bias 2012 (Bias Adjustment Factor = 0.8)
2013 (Bias Adjustment Factor = 0.8)
2014 (Bias Adjustment
Factor = 0.81)
2015 (Bias Adjustment
Factor = 0.81)
2016 (Bias Adjustment
Factor = 0.78) GCC 002 Kerbside N 40.4 (22.9) 33.9 34.3 31.1 31.4
GCC 003 Urban Background N 12.5 11.6 12.6 11.3 10.5
GCC 005 Kerbside N 34.2 32.0 33.0 29.6 27.6 GCC 008 Kerbside N 30.4 26.6 25.6 23.4 22.8 GCC 011 Kerbside N 25.7 24.4 23.7 21.8 23.8 GCC 012 Kerbside N 36.2 28.1 27.5 25.3 26.9 GCC 013 Kerbside N 22.9 20.7 21.0 19.6 21.9 GCC 015 Roadside N 27.1 24.2 23.9 21.4 24.8 GCC 037 Kerbside N 31.5 31.1 31.5 27.1 25.5 GCC 038 Roadside N 38.0 28.3 29.9 27.5 28.6 GCC 039 Roadside N 36.2 26.5 28.0 27.7 28.4 GCC 040 Kerbside N 25.8 29.1 19.6 18.9 19.1
*Value in brackets is distance corrected for nearest relevant exposure.
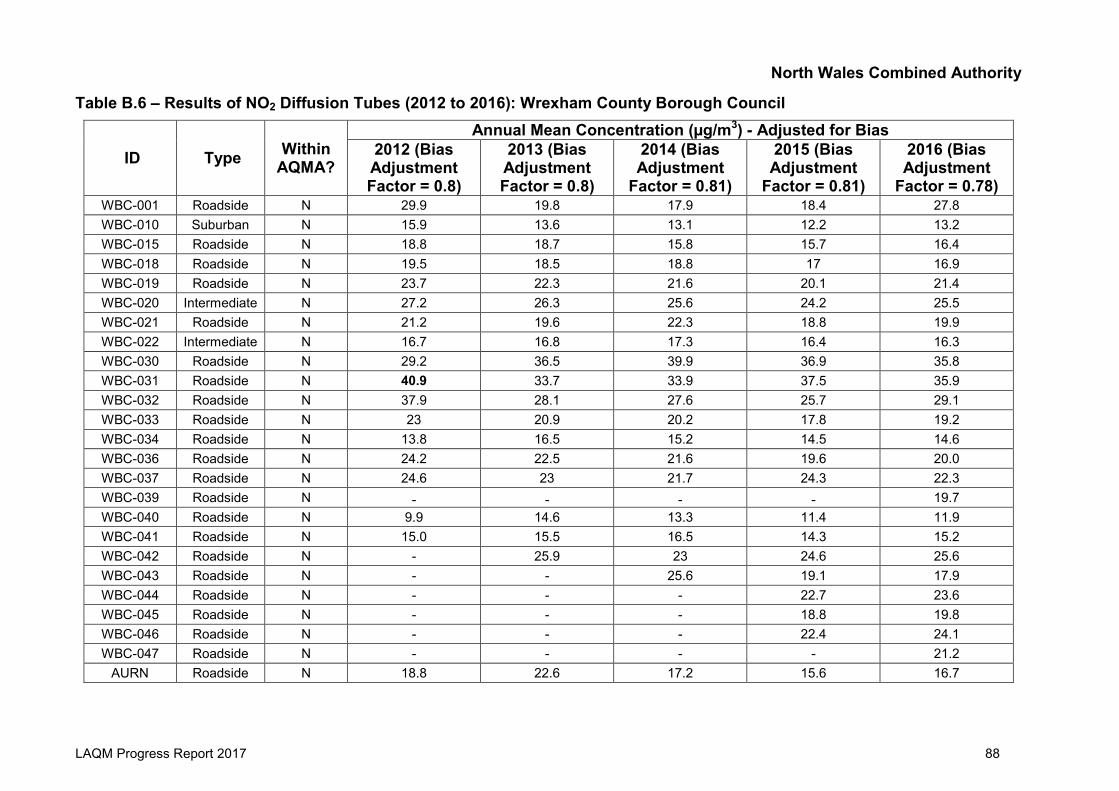
North Wales Combined Authority
LAQM Progress Report 2017 88
Table B.6 – Results of NO2 Diffusion Tubes (2012 to 2016): Wrexham County Borough Council
ID Type Within AQMA?
Annual Mean Concentration (µg/m3) - Adjusted for Bias 2012 (Bias Adjustment Factor = 0.8)
2013 (Bias Adjustment Factor = 0.8)
2014 (Bias Adjustment
Factor = 0.81)
2015 (Bias Adjustment
Factor = 0.81)
2016 (Bias Adjustment
Factor = 0.78) WBC-001 Roadside N 29.9 19.8 17.9 18.4 27.8 WBC-010 Suburban N 15.9 13.6 13.1 12.2 13.2 WBC-015 Roadside N 18.8 18.7 15.8 15.7 16.4 WBC-018 Roadside N 19.5 18.5 18.8 17 16.9 WBC-019 Roadside N 23.7 22.3 21.6 20.1 21.4 WBC-020 Intermediate N 27.2 26.3 25.6 24.2 25.5 WBC-021 Roadside N 21.2 19.6 22.3 18.8 19.9 WBC-022 Intermediate N 16.7 16.8 17.3 16.4 16.3 WBC-030 Roadside N 29.2 36.5 39.9 36.9 35.8 WBC-031 Roadside N 40.9 33.7 33.9 37.5 35.9 WBC-032 Roadside N 37.9 28.1 27.6 25.7 29.1 WBC-033 Roadside N 23 20.9 20.2 17.8 19.2 WBC-034 Roadside N 13.8 16.5 15.2 14.5 14.6 WBC-036 Roadside N 24.2 22.5 21.6 19.6 20.0 WBC-037 Roadside N 24.6 23 21.7 24.3 22.3 WBC-039 Roadside N - - - - 19.7 WBC-040 Roadside N 9.9 14.6 13.3 11.4 11.9 WBC-041 Roadside N 15.0 15.5 16.5 14.3 15.2 WBC-042 Roadside N - 25.9 23 24.6 25.6 WBC-043 Roadside N - - 25.6 19.1 17.9 WBC-044 Roadside N - - - 22.7 23.6 WBC-045 Roadside N - - - 18.8 19.8 WBC-046 Roadside N - - - 22.4 24.1 WBC-047 Roadside N - - - - 21.2
AURN Roadside N 18.8 22.6 17.2 15.6 16.7

North Wales Combined Authority
LAQM Progress Report 2017 89
Appendix C: Full Monthly Diffusion Tube Results for 2016
Table C.1- Full Monthly Diffusion Tube Results for 2016: Isle of Anglesey County Council
ID
NO2 Mean Concentrations (µg/m3)
Jan Feb Mar Apr May Jun Jul Aug Sep Oct Nov Dec Annual Mean
Raw Data
Bias Adjusted
DT1 53.1 56.9 45.3 54.6 50.1 50 44.7 51.5 41.2 56.8 54.7 52 50.9 39.7 DT2 29.2 36.7 27.6 31.2 31.8 24.1 - - - - - - 30.1 23.5 DT3 - - - - - - 8.6 7.6 9.6 18.8 17.8 10.7 12.2 9.5 DT4 - 62.9 54.8 52.8 49.8 54.5 56.2 65.5 58.1 56.5 60.6 65.1 57.9 45.2 DT5 - 13.3 12.8 13.3 12.0 8.1 - 11.1 12.8 13.3 14.6 13.8 12.5 9.8 DT6 - 15.3 17.4 14.1 12.9 11.6 11.9 13.9 14.2 17.6 14.2 15.7 14.4 11.3 DT7 - 18.2 24.4 22.2 21.9 22.5 17.8 21.7 19.2 19.5 9.3 19.1 19.6 15.3 DT8 - 13.4 15.8 13.5 13.5 11.6 8.0 10.7 10.9 14.7 15.7 11.7 12.7 9.9 DT9 - 10.0 16.4 12.8 11.2 12.0 11.1 12.8 11.2 12.4 13.1 10.5 12.1 9.5
DT10 - 7.4 12.6 9.6 8.6 6.7 7.0 7.4 8.9 11.8 10.7 8.6 9.0 7.0 DT11 - 13.1 16.4 12.7 15.5 12.3 10.0 12.3 12.7 11.00 13.5 14.4 13.1 10.2 DT12 - 11.7 15.6 12.2 11.8 9.7 8.5 9.5 10.2 15.4 12.6 9.4 11.5 9.0 DT13 - 6.0 12.5 8.8 10.1 5.3 5.0 7.3 8.3 13.2 10.4 7.9 8.6 6.7 DT14 - 17.0 18.3 17.3 18.6 13.3 9.6 12.8 14.4 22.1 18.2 17.2 16.3 12.7 DT15 - 15.3 17.5 16.8 15.8 - 8.9 11.7 12.8 16.0 16.0 12.2 14.3 11.2
Results in bold exceed the annual mean NO2 AQS objective of 40µg/m³

North Wales Combined Authority
LAQM Progress Report 2017 90
Table C.2- Full Monthly Diffusion Tube Results for 2016: Conwy County Borough Council
ID
NO2 Mean Concentrations (µg/m3)
Jan Feb Mar Apr May Jun Jul Aug Sep Oct Nov Dec Annual Mean
Raw Data
Bias Adjusted
CBC-001 22.2 21.7 28.7 25.2 31.1 24.7 11.8 17.2 21.5 30.8 34.3 28.2 24.8 19.3 CBC-034 - - 27.5 22.3 23.9 26.9 19.4 24.5 29.3 27.3 36.4 32.9 27.0 21.1 CBC-004 11.7 12.3 16 10.9 17.6 10.4 5.8 8.1 9 18.5 20.6 16.8 13.1 10.3 CBC-016 8.4 12.2 14 11.8 11.1 9.4 7.7 7.2 9.2 14 18.2 16.4 11.6 9.1 CBC-017 16.8 21 23.7 23.8 26.7 27.7 12.7 18.5 21.9 35.1 35.1 30 24.4 19.0 CBC-018 23.6 27.7 23.5 26.8 26.2 23 25.1 26.4 30.4 25.5 34.1 29.8 26.8 20.9 CBC-026 29.8 33.9 36.8 36.4 42.4 32.6 24.1 25.4 35.9 46.7 42.4 41.1 35.6 27.8 CBC-025 23.2 19.9 20.3 20.9 20.6 16.5 17 17.6 19.7 21.5 20.9 22.6 20.1 15.6 CBC-031 24.3 19.5 30.8 27.9 27.9 22.7 21.6 21.9 28.3 29.5 35.4 33.5 26.9 21.0 CBC-032 19.4 22.8 28.7 24.4 26.5 24.2 16.3 19 22.1 27.5 32.1 28.5 24.3 18.9 CBC-021 18.5 18.2 24.8 22.7 28.5 25.8 18.1 22.5 22.6 21.9 26.6 22.1 22.7 17.7 CBC-022 22.3 22.4 30.9 25.4 27.6 26.2 20.8 21.3 26.6 25.8 36.6 31.9 26.5 20.7 CBC-033 14.3 14.8 22.1 16.1 21.7 16.1 8.6 11.1 14.1 25.5 26.3 22.2 17.7 13.8 CBC-027 17.7 19.3 21.8 16.2 19.3 16.3 14.9 14.4 17.6 27.6 13.3 28.3 18.9 14.7 CBC-029 11.6 16.8 16.6 11.1 20.5 12.8 10.9 12.4 16.5 - - - 14.4 11.2
Table C.3- Full Monthly Diffusion Tube Results for 2016: Denbighshire County Council
ID
NO2 Mean Concentrations (µg/m3)
Jan Feb Mar Apr May Jun Jul Aug Sep Oct Nov Dec Annual Mean
Raw Data
Bias Adjusted
DBK1 21.5 29.5 33.4 28.1 24 30.4 21.7 26.8 27.5 41.5 37.2 40 30.1 23.5 DBR2 30.4 35.7 38.2 31.1 32.5 29.2 27.7 29.2 30.7 39.9 41.9 39.3 33.8 26.4 DBB3 12.2 15.1 14.6 12.5 10.5 7.6 6.6 8.1 9.4 16.4 19.4 18.1 12.5 9.8 DBB4 14.4 15.2 14.6 14.8 10.7 8 7.1 8.4 9 19.6 20.9 15.9 13.2 10.3

North Wales Combined Authority
LAQM Progress Report 2017 91
ID
NO2 Mean Concentrations (µg/m3)
Jan Feb Mar Apr May Jun Jul Aug Sep Oct Nov Dec Annual Mean
Raw Data
Bias Adjusted
DBR5 15.2 23.3 25 23.2 21.1 20.9 14.1 16.9 14.1 20.7 26.3 18.4 19.9 15.5 DBR48 31.2 42 40.8 44.8 37.3 30.2 19.9 24.2 27.5 - 44.3 34.9 34.3 26.7 DBR23 21 29 25.4 25.9 20.7 19.8 16.2 16.7 18.8 24.7 35 32.7 23.8 18.6 DBR8 19.2 24.2 23.6 21.6 18.9 15.8 14.3 13.5 17 20.7 27.6 21.7 19.8 15.5 DBR9 29.3 32.2 31.9 29.4 25.9 19.5 18.8 19.9 26.1 29.5 34.6 28 27.1 21.1 DBR10 20.3 23.6 23.5 20 18.2 13.6 11.8 15.9 17.4 25.8 27.8 29.9 20.7 16.1 DBR24 42.5 47.2 51.3 46.3 44 39.4 33.6 33 33.3 41 55 - 42.4 33.1 DBR54 17.5 20.4 22.2 19.9 16.2 12.9 16.7 12.2 13.8 18.3 - 23.7 17.6 13.7 DBR20 15.7 27.6 27.5 30.4 30.2 24.4 20.8 20.7 23.7 31.8 18.9 33 25.4 19.8 DBR43 - 11.4 51.2 46.4 42.5 37.9 35.1 33.3 36 37.8 29.9 48.2 37.2 29.1 DBR44 - 39.2 34.5 37.9 35.8 27.3 25.6 24.3 27.6 34.5 24.5 41.2 32.0 25.0 DBR45 27.7 33 34.3 32.5 32 27.7 21.4 23 28.7 36.4 22 39.8 29.9 23.3 DBR37 32.4 42.5 43.4 42.5 37.7 39.8 26.2 28.2 28.6 36 23.1 29.3 34.1 26.6 DBR38 23.6 24.4 24.6 22.2 22.4 18.8 17.7 19.2 20.3 26.3 14.8 23.7 21.5 16.8 DBR52 30.7 31.7 32.8 36 32.3 27.3 21 22.4 26 33.3 38.8 39.2 31.0 24.1 DBR53 41.6 49 46.7 - 35.1 37.2 30.2 29.4 34.9 37.1 51.4 47 40.0 31.2 DBR31 25.1 28.4 28.4 23.3 23.5 17.9 15.2 14.3 18.9 28.6 35.4 32.5 24.3 18.9 DBR32 24.3 30 28 28.7 23.9 21.4 16.6 17.6 19.5 22.9 32.3 25.9 24.3 18.9 DBR33 39.2 40.1 36.5 39 32.4 25.8 24.8 - 32.6 39.4 38.5 49 36.1 28.2 DBR34 20.4 20.6 19.7 20.1 18.9 14.5 10.7 12.5 16.7 22 29 28.3 19.5 15.2 DBR49 19.5 21.9 26.3 24.3 22.6 19.9 14.5 16.2 19.2 27.2 26.4 25.7 22.0 17.1 DBR50 18.6 25 28 6.1 21.8 19.5 12.8 16.5 16.4 25.8 31 25.3 20.6 16.0
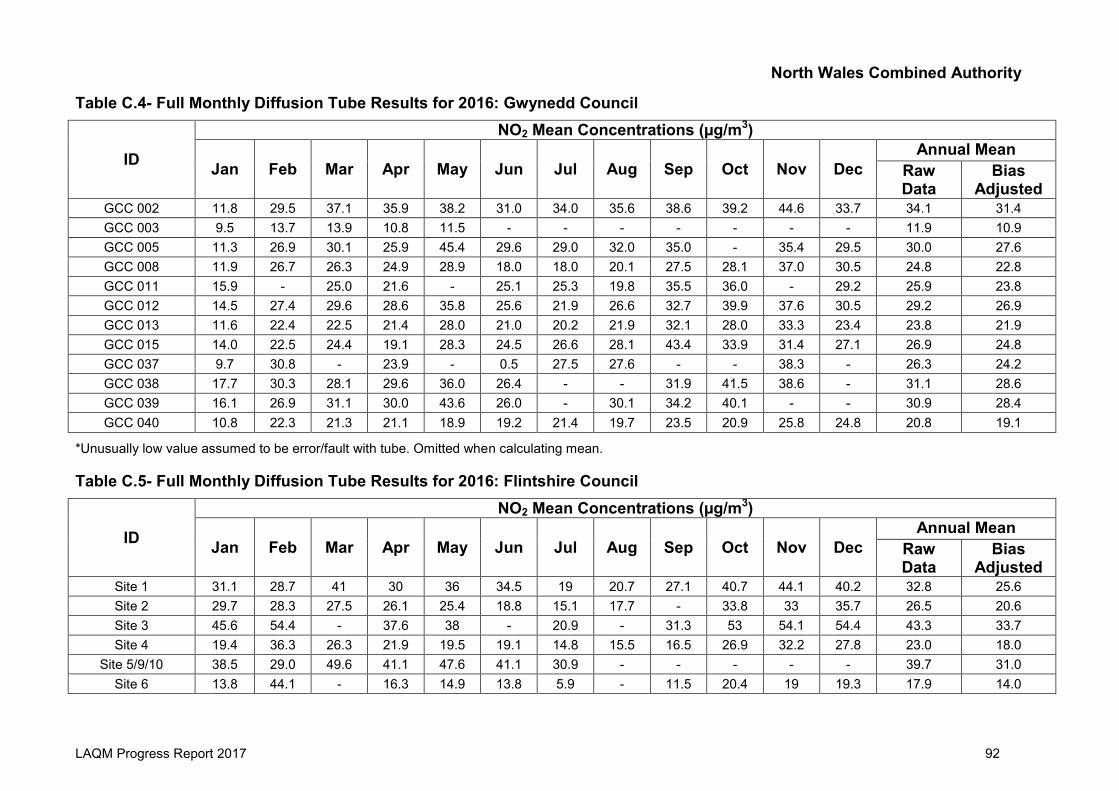
North Wales Combined Authority
LAQM Progress Report 2017 92
Table C.4- Full Monthly Diffusion Tube Results for 2016: Gwynedd Council
ID
NO2 Mean Concentrations (µg/m3)
Jan Feb Mar Apr May Jun Jul Aug Sep Oct Nov Dec Annual Mean
Raw Data
Bias Adjusted
GCC 002 11.8 29.5 37.1 35.9 38.2 31.0 34.0 35.6 38.6 39.2 44.6 33.7 34.1 31.4 GCC 003 9.5 13.7 13.9 10.8 11.5 - - - - - - - 11.9 10.9 GCC 005 11.3 26.9 30.1 25.9 45.4 29.6 29.0 32.0 35.0 - 35.4 29.5 30.0 27.6 GCC 008 11.9 26.7 26.3 24.9 28.9 18.0 18.0 20.1 27.5 28.1 37.0 30.5 24.8 22.8 GCC 011 15.9 - 25.0 21.6 - 25.1 25.3 19.8 35.5 36.0 - 29.2 25.9 23.8 GCC 012 14.5 27.4 29.6 28.6 35.8 25.6 21.9 26.6 32.7 39.9 37.6 30.5 29.2 26.9 GCC 013 11.6 22.4 22.5 21.4 28.0 21.0 20.2 21.9 32.1 28.0 33.3 23.4 23.8 21.9 GCC 015 14.0 22.5 24.4 19.1 28.3 24.5 26.6 28.1 43.4 33.9 31.4 27.1 26.9 24.8 GCC 037 9.7 30.8 - 23.9 - 0.5 27.5 27.6 - - 38.3 - 26.3 24.2 GCC 038 17.7 30.3 28.1 29.6 36.0 26.4 - - 31.9 41.5 38.6 - 31.1 28.6 GCC 039 16.1 26.9 31.1 30.0 43.6 26.0 - 30.1 34.2 40.1 - - 30.9 28.4 GCC 040 10.8 22.3 21.3 21.1 18.9 19.2 21.4 19.7 23.5 20.9 25.8 24.8 20.8 19.1
*Unusually low value assumed to be error/fault with tube. Omitted when calculating mean.
Table C.5- Full Monthly Diffusion Tube Results for 2016: Flintshire Council
ID
NO2 Mean Concentrations (µg/m3)
Jan Feb Mar Apr May Jun Jul Aug Sep Oct Nov Dec Annual Mean
Raw Data
Bias Adjusted
Site 1 31.1 28.7 41 30 36 34.5 19 20.7 27.1 40.7 44.1 40.2 32.8 25.6 Site 2 29.7 28.3 27.5 26.1 25.4 18.8 15.1 17.7 - 33.8 33 35.7 26.5 20.6 Site 3 45.6 54.4 - 37.6 38 - 20.9 - 31.3 53 54.1 54.4 43.3 33.7 Site 4 19.4 36.3 26.3 21.9 19.5 19.1 14.8 15.5 16.5 26.9 32.2 27.8 23.0 18.0
Site 5/9/10 38.5 29.0 49.6 41.1 47.6 41.1 30.9 - - - - - 39.7 31.0 Site 6 13.8 44.1 - 16.3 14.9 13.8 5.9 - 11.5 20.4 19 19.3 17.9 14.0

North Wales Combined Authority
LAQM Progress Report 2017 93
ID
NO2 Mean Concentrations (µg/m3)
Jan Feb Mar Apr May Jun Jul Aug Sep Oct Nov Dec Annual Mean
Raw Data
Bias Adjusted
Site 7 19.5 12.8 21.9 18.4 20.6 16.6 11.6 13.3 17.5 26.7 27.8 24.7 19.3 15.0 Site 8 18.6 20.4 21.6 20.1 18.9 14.7 9.1 10.9 13.7 24.8 25.7 23.9 18.5 14.5
Site 11/47 40.3 50.9 55.9 53.7 47.4 45.4 37.2 38.1 36.7 50.7 44.3 47.1 45.6 35.6 Site 12/13 44.7 39.6 50.6 40.2 43.2 35.3 39.4 34.6 38.7 48.3 55.6 53.9 43.7 34.0
Site 14 12.5 48.8 15.8 12 13.3 10.7 - 6.5 6.9 18.4 18 16.8 16.3 12.7 Site 15 33.6 13.4 41.5 38.7 39.4 - - - 28.2 36.1 46 44.6 35.7 27.9 Site 16 36.4 44.5 39.6 35.4 32.2 29.7 24.8 24.1 29.2 36 39.9 39.4 34.3 26.7 Site 17 31.7 40.7 33.1 38 38.8 33.9 - - - 41.2 44.1 35.5 37.4 29.2 Site 18 19.5 33 20.9 16.5 18.2 10.7 4.9 9.6 - 25.3 20.6 25.2 18.6 14.5 Site 19 25 21.7 81.4 28.8 29.9 27 18.8 17.7 26.1 36.6 38 33.1 32.0 25.0 Site 20 30.8 32.4 37.5 32 31.7 27.9 18.7 23.4 22.9 33.9 36.9 31.6 30.0 23.4 Site 21 18.4 37.2 20.5 16.4 15.8 13.6 9.4 10.3 14.8 23.4 25.1 28.7 19.5 15.2 Site 22 30.7 18.7 26.6 24 24.7 11.8 14.3 17.4 18.6 32.3 33.8 32.9 23.8 18.6 Site 23 - 26.8 35 30.6 33.7 25.4 24 20.8 - 36.4 40.3 39.8 31.3 24.4
Site 24/51 48.9 39.7 45.8 37.4 41.5 38.6 32.3 33.4 39.6 41.3 - 51.1 40.3 31.4 Site 25 26.8 51.6 28.6 24.5 26.3 18.6 13.7 16.1 20.2 29.9 38.3 32.7 27.3 21.3 Site 26 26 30.5 22.4 18.7 18.3 13 8.3 12.1 14 28.7 29.6 29.1 20.9 16.3 Site 27 30.5 24.7 - 23 26.7 24.6 18.4 21.1 26.1 38.9 39.2 27.7 27.4 21.3 Site 28 25.1 19.4 20 17 16.2 12.1 10.6 11.7 18.9 23.2 26.7 37.7 19.9 15.5 Site 29 25.1 22.7 25.3 23.3 21.6 16.6 11.6 15.1 19 27.9 35.3 33.4 23.1 18.0 Site 30 26.3 25.2 37.8 34.7 34.2 29.6 23.7 22.9 27.8 40 43.7 37.3 31.9 24.9 Site 31 29.9 38.7 30 27.3 27 23.7 19.1 22.8 25.8 39.2 42.1 37.2 30.2 23.6 Site 32 19.4 34.2 27.3 25.1 23.9 24.2 18.3 19.6 22.2 31 35 30.7 25.9 20.2 Site 33 38 26.7 39.4 33.7 35.6 28.9 24.5 24.9 29.9 42.2 47.4 42.8 34.5 26.9 Site 34 29.4 43.8 34.2 28.1 36.7 27.8 24.7 23.4 28.4 35.7 39.6 37.1 32.4 25.3 Site 35 25.2 36.7 31.5 27.5 27 22.7 16.6 16.6 23.4 24 38 33.6 26.9 21.0

North Wales Combined Authority
LAQM Progress Report 2017 94
ID
NO2 Mean Concentrations (µg/m3)
Jan Feb Mar Apr May Jun Jul Aug Sep Oct Nov Dec Annual Mean
Raw Data
Bias Adjusted
Site 36 29.8 32.7 35.1 32.1 25.3 24.5 19.1 21.4 24.8 38.8 34.8 38.8 29.8 23.2 Site 37 56.3 33.1 37.7 35.3 31.7 29.5 20.2 21.4 26.3 36.9 40.8 35.9 33.8 26.3 Site 38 35.1 37.7 22.2 20.6 22.4 17.3 11.5 13.9 19.8 28.8 32.1 32.3 24.5 19.1 Site 39 25.7 28.2 25 24.9 25.4 21.5 12.2 12.5 15 24.2 28.1 22.2 22.1 17.2 Site 40 19.6 28.8 25.9 23.6 23.1 16.5 11.2 12.5 17.8 - 31.7 26.7 21.6 16.8 Site 41 14.3 26.6 17.3 14.5 15.7 12.1 7.2 8.2 10.9 19.2 23.3 15.2 15.4 12.0 Site 42 14.9 16.5 18.2 20.2 12.6 15.5 6.7 8.3 12.2 20.6 23.9 20.2 15.8 12.3 Site 43 12.5 19 11.9 11.2 9.7 7.9 4.1 6.5 8.3 16.7 17.4 17.1 11.9 9.2 Site 44 - 13.5 34.5 39.1 35.2 33.1 25.5 27.5 28.8 42.2 47.6 32.7 25.5 Site 45 26.1 27.4 24.9 21 23.9 16.9 12.8 15.1 19.1 26.4 31 29.6 22.9 17.8 Site 46 14.7 20.3 23.5 23 2.5 - 0.9 9.8 12.7 24.3 2 45.1 16.3 12.7 Site 48 24.9 33.6 32.6 7.8 - 8.4 - 17.6 19.4 31.4 35.6 29.2 24.1 18.8 Site 49 26 29.1 28.1 18.8 22.2 18 13.9 15.1 17.5 28.3 - - 21.7 16.9 Site 50 - 22.4 22.9 24.5 25.2 22.3 8.4 12.6 17.2 29.6 29.3 24 21.7 16.9 Site 52 45 51.9 48.1 39.4 36.1 36.6 33.4 33.4 41.4 45.1 - 51.1 42.0 32.7 Site 53 23.1 25 22.5 20.2 20 16.9 14 14.5 15.8 26.4 30.2 26.9 21.3 16.6 Site 54 37 40.6 36.1 34.7 34.5 30.7 25.3 25.9 26.3 33.7 47.2 38 34.2 26.7 Site 55 16.6 19.1 15.1 15.5 13.7 12.1 - - 11 23 22.5 21.1 17.0 13.2 Site 56 15.4 20.1 18.9 15.3 12.4 - - 8.1 10.7 19 22.4 24.2 16.7 13.0 Site 57 17.1 23.7 18.5 - 17 17.3 9.2 9.7 16.1 23.3 - - 16.9 13.2 Site 58 - - - - - - 30.9 20.2 25.2 40.0 34.2 38.3 31.5 24.5
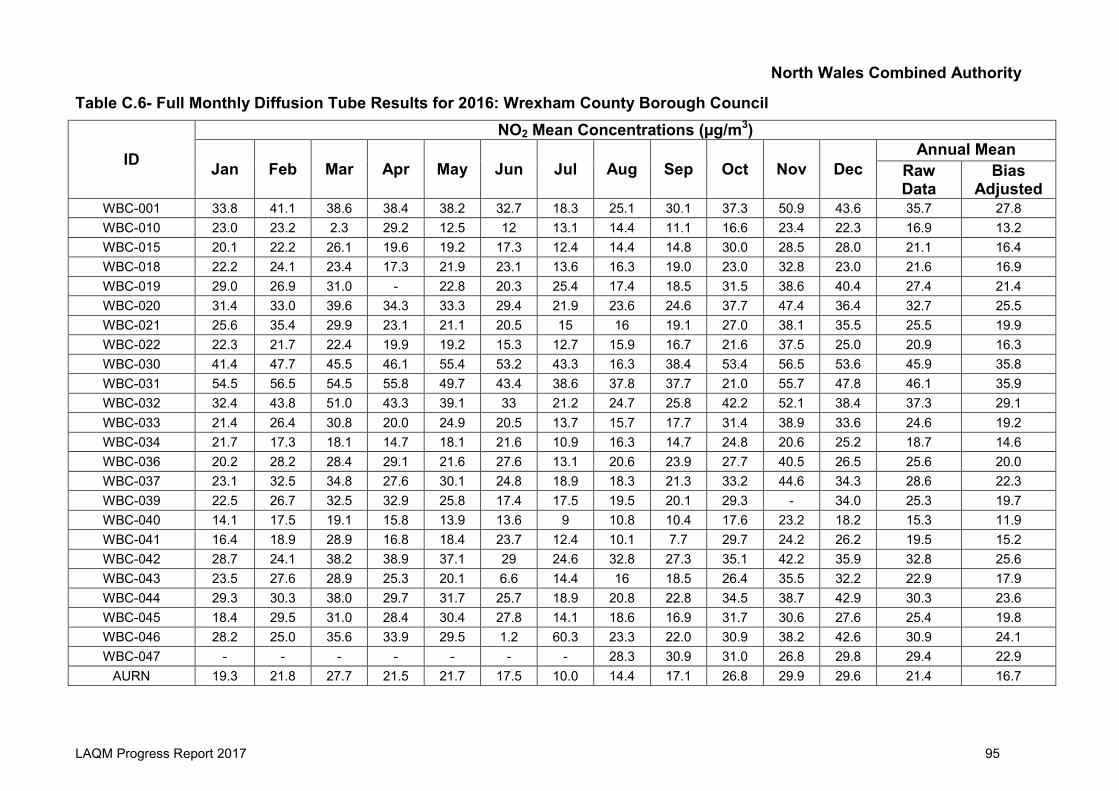
North Wales Combined Authority
LAQM Progress Report 2017 95
Table C.6- Full Monthly Diffusion Tube Results for 2016: Wrexham County Borough Council
ID
NO2 Mean Concentrations (µg/m3)
Jan Feb Mar Apr May Jun Jul Aug Sep Oct Nov Dec Annual Mean
Raw Data
Bias Adjusted
WBC-001 33.8 41.1 38.6 38.4 38.2 32.7 18.3 25.1 30.1 37.3 50.9 43.6 35.7 27.8 WBC-010 23.0 23.2 2.3 29.2 12.5 12 13.1 14.4 11.1 16.6 23.4 22.3 16.9 13.2 WBC-015 20.1 22.2 26.1 19.6 19.2 17.3 12.4 14.4 14.8 30.0 28.5 28.0 21.1 16.4 WBC-018 22.2 24.1 23.4 17.3 21.9 23.1 13.6 16.3 19.0 23.0 32.8 23.0 21.6 16.9 WBC-019 29.0 26.9 31.0 - 22.8 20.3 25.4 17.4 18.5 31.5 38.6 40.4 27.4 21.4 WBC-020 31.4 33.0 39.6 34.3 33.3 29.4 21.9 23.6 24.6 37.7 47.4 36.4 32.7 25.5 WBC-021 25.6 35.4 29.9 23.1 21.1 20.5 15 16 19.1 27.0 38.1 35.5 25.5 19.9 WBC-022 22.3 21.7 22.4 19.9 19.2 15.3 12.7 15.9 16.7 21.6 37.5 25.0 20.9 16.3 WBC-030 41.4 47.7 45.5 46.1 55.4 53.2 43.3 16.3 38.4 53.4 56.5 53.6 45.9 35.8 WBC-031 54.5 56.5 54.5 55.8 49.7 43.4 38.6 37.8 37.7 21.0 55.7 47.8 46.1 35.9 WBC-032 32.4 43.8 51.0 43.3 39.1 33 21.2 24.7 25.8 42.2 52.1 38.4 37.3 29.1 WBC-033 21.4 26.4 30.8 20.0 24.9 20.5 13.7 15.7 17.7 31.4 38.9 33.6 24.6 19.2 WBC-034 21.7 17.3 18.1 14.7 18.1 21.6 10.9 16.3 14.7 24.8 20.6 25.2 18.7 14.6 WBC-036 20.2 28.2 28.4 29.1 21.6 27.6 13.1 20.6 23.9 27.7 40.5 26.5 25.6 20.0 WBC-037 23.1 32.5 34.8 27.6 30.1 24.8 18.9 18.3 21.3 33.2 44.6 34.3 28.6 22.3 WBC-039 22.5 26.7 32.5 32.9 25.8 17.4 17.5 19.5 20.1 29.3 - 34.0 25.3 19.7 WBC-040 14.1 17.5 19.1 15.8 13.9 13.6 9 10.8 10.4 17.6 23.2 18.2 15.3 11.9 WBC-041 16.4 18.9 28.9 16.8 18.4 23.7 12.4 10.1 7.7 29.7 24.2 26.2 19.5 15.2 WBC-042 28.7 24.1 38.2 38.9 37.1 29 24.6 32.8 27.3 35.1 42.2 35.9 32.8 25.6 WBC-043 23.5 27.6 28.9 25.3 20.1 6.6 14.4 16 18.5 26.4 35.5 32.2 22.9 17.9 WBC-044 29.3 30.3 38.0 29.7 31.7 25.7 18.9 20.8 22.8 34.5 38.7 42.9 30.3 23.6 WBC-045 18.4 29.5 31.0 28.4 30.4 27.8 14.1 18.6 16.9 31.7 30.6 27.6 25.4 19.8 WBC-046 28.2 25.0 35.6 33.9 29.5 1.2 60.3 23.3 22.0 30.9 38.2 42.6 30.9 24.1 WBC-047 - - - - - - - 28.3 30.9 31.0 26.8 29.8 29.4 22.9
AURN 19.3 21.8 27.7 21.5 21.7 17.5 10.0 14.4 17.1 26.8 29.9 29.6 21.4 16.7