north perry airport (hwo)
TRANSCRIPT


North Perry Airport (HWO) – Airfield Safety Enhancement and Geometry Study
Table of Contents Final Report April 2017 i
Contents 5. Aviation Activity Forecasts ............................................................................................ 41
5.1 Historical and Current Aviation Activity ....................................................................... 41
Based Aircraft .................................................................................................................. 42
Aircraft Operations .......................................................................................................... 44
5.2 Socioeconomic Factors ................................................................................................. 44
Socioeconomic Trends - Summary ..................................................................................... 47
5.3 Local and Regional Aviation Trends .............................................................................. 47
5.4 National Aviation Trends .............................................................................................. 49
FAA Forecasts .................................................................................................................. 54
5.5 Based Aircraft Forecasts ............................................................................................... 60
Based Aircraft Forecast Methodologies ............................................................................ 60
Socioeconomic Methodology – Population Variable .......................................................... 61
Socioeconomic Methodology – Employment Variable ....................................................... 61
Socioeconomic Methodology – Per Capita Personal Income Variable ................................. 62
Socioeconomic Methodology – Summary of Results .......................................................... 63
Based Aircraft Forecast - Market Share Methodology ....................................................... 63
Based Aircraft Forecast – FAA Comparison Methodology .................................................. 64
Based Aircraft Forecast – Preferred Methodology ............................................................. 65
Based Aircraft Fleet Mix Forecast ..................................................................................... 66
5.6 Aircraft Operations Forecasts ....................................................................................... 67
FAA TAF and Other Forecasts ........................................................................................... 68
Aircraft Operations Forecast Methodologies ..................................................................... 68
Socioeconomic Methodology – Population Variable .......................................................... 68
Socioeconomic Methodology – Employment Variable ....................................................... 69
Socioeconomic Methodology – Per Capita Personal Income Variable ................................. 70
Socioeconomic Methodology – Summary of Results .......................................................... 71
Aircraft Operations Forecast – Market Share Methodology ............................................... 72
Aircraft Operations Forecast – OPBA ................................................................................ 73
Aircraft Operations Forecast – Local/Itinerant Operations ................................................. 75
Aircraft Operations Forecast – Daytime/Evening Operations ............................................. 76
Aircraft Operations Forecast – Commuter/Air Taxi Operations .......................................... 77

North Perry Airport (HWO) – Airfield Safety Enhancement and Geometry Study
Table of Contents Final Report April 2017 ii
Aircraft Operations Forecast – Military Operations ........................................................... 78
Aircraft Operations Forecast – Operational Fleet Mix ........................................................ 79
5.7 Peaking Characteristics and Peak Operations Projections ........................................... 80
5.8 Forecast Summary ........................................................................................................ 81
5.9 FAA Forecast Review and Approval .............................................................................. 82
List of Tables
Table 5-1: Historical HWO Based Aircraft .................................................................................... 43
Table 5-2: Historical HWO Aircraft Operations ............................................................................ 44
Table 5-3: Comparison of Historical Population Growth (U.S., FL, and Miami MSA) .................. 45
Table 5-4: Historical Miami and State of Florida Employment and Earnings .............................. 46
Table 5-5: Historical Miami MSA and State of Florida per Capita Personal Income ................... 47
Table 5-6: Florida State Aviation Funding .................................................................................... 49
Table 5-7: U.S. General Aviation Activity Data............................................................................. 50
Table 5-8: General Aviation Operations at FAA and Contract Tower Facilities ........................... 51
Table 5-9: Historical and Projected U.S. Active Pilots .................................................................. 57
Table 5-10: Active General Aviation and Air Taxi Hours Flown (in thousands) ........................... 58
Table 5-11: Historical and Projected U.S. Active General Aviation Fleet .................................... 59
Table 5-12: HWO Based Aircraft Comparison .............................................................................. 60
Table 5-13: HWO Socioeconomic – Population Variable Based Aircraft Forecast ..................... 61
Table 5-14: HWO Socioeconomic – Employment Variable Based Aircraft Forecast ................... 62
Table 5-15: HWO Socioeconomic – Per Capita Personal Income Variable ($2005) Based Aircraft
Forecast ......................................................................................................................................... 63
Table 5-16: Socioeconomic Forecasts of HWO Based Aircraft .................................................... 63
Table 5-17: HWO Market Share Methodology Based Aircraft Forecast ...................................... 64
Table 5-18: HWO Based Aircraft Forecast – FAA Comparison Methodology .............................. 65
Table 5-19: HWO Based Aircraft Fleet Mix Forecast ................................................................... 67
Table 5-20: HWO Operations Forecast Comparison .................................................................... 68
Table 5-21: HWO Socioeconomic – Population Variable Aircraft Operations Forecast ............. 69
Table 5-22: HWO Socioeconomic – Employment Variable Aircraft Operations Forecast ........... 70
Table 5-23: HWO Socioeconomic – Per Capita Personal Income Variable ($2005) Based Aircraft
Forecast ......................................................................................................................................... 71
Table 5-24: Socioeconomic Forecasts of HWO Aircraft Operations ............................................ 72
Table 5-25: HWO Operations – Market Share Methodology ...................................................... 73
Table 5-26: HWO Operations per Based Aircraft Forecast Methodology ................................... 74
Table 5-27: HWO Operations Forecast – Local/Itinerant Operations ......................................... 76
Table 5-28: HWO Operations Forecast – Daytime/Evening Operations ..................................... 77

North Perry Airport (HWO) – Airfield Safety Enhancement and Geometry Study
Table of Contents Final Report April 2017 iii
Table 5-29: HWO Commuter/Air Taxi Operations Forecast ........................................................ 78
Table 5-30: HWO Military Operations Forecast ........................................................................... 79
Table 5-31: HWO Total Operational Fleet Mix Forecast .............................................................. 79
Table 5-32: HWO Operations Forecast – Peak Month and Peak Day Forecasts ......................... 80
Table 5-33: HWO Peak Operations Forecast ............................................................................... 81
Table 5-34: Summary of HWO Forecasts ..................................................................................... 81
Table 5-35: North Perry Airport FAA TAF Comparison ................................................................ 83
List of Figures Figure 5-1: AvGas Fuel Prices vs. HWO Aircraft Operations ......................................................... 52
Figure 5-2: HWO Based Aircraft Forecast – Summary .................................................................. 66
Figure 5-3: HWO Aircraft Operations Forecast – Summary ......................................................... 75
Appendices B. Based Aircraft Determination (October 2016)

North Perry Airport (HWO) – Airfield Safety Enhancement and Geometry Study
Section 5 – Forecasts Final Report April 2017 41
5. AVIATION ACTIVITY FORECASTS
This chapter discusses the background, assumptions, and methodologies used to project future aviation demand at North Perry Airport (HWO). It is important to recognize that there can be short-term fluctuations in an airport’s activity due to a variety of factors that are, at best, difficult to be anticipated. The aviation industry is, as of the time of this analysis (Spring 2016), presently experiencing the influence of just such an event in the form of the precipitous drop in the price of oil and the corresponding drop in aviation fuel costs. The forecasts developed in this document are intended to consider the routine ebb and flow in activity levels while projecting what the long-term trend of activity is most likely to be. In so doing these projections provide a meaningful framework to guide analysis for future Airport development needs and alternatives.
The projections of aviation demand developed for HWO are documented in the following sections:
• Historical and Current Aviation Activity
• Socioeconomic Factors
• Local and Regional Aviation Trends
• National Aviation Trends
• Based Aircraft Forecasts
• Aircraft Operations Forecasts
• Peaking Characteristics and Peak Operations Projections
• Critical Aircraft
• Forecast Summary
• FAA Forecast Review and Approval
This forecast analysis includes methodologies that consider historical aviation trends at the Airport and throughout the nation. Local historical data were collected from FAA Terminal Area Forecast (TAF) records, Air Traffic Activity System (ATADS), Traffic Flow Management System Counts (TFMSC), Airport tower records, 5010 Airport Master Records, and the Florida Department of Transportation (FDOT) Florida Aviation Database (FAD) and FDOT planning analyses. In addition, socioeconomic data for the Miami-Fort Lauderdale Metropolitan Statistical Area (MSA) have been examined to track local trends and conditions that can impact general aviation demand levels. Projections of aviation activity for the Airport were prepared for near-term (2020), mid-term (2025), and long-term (2035) timeframes.
It is important to note that the forecasts developed for this document incorporate the existing conditions at HWO and its surrounding area. This includes not only local socioeconomic factors, but physical ones as well. These factors include potential limitations on the ability to significantly expand airfield facilities, interrelationship with other nearby airports, airspace considerations, and other factors including the existing limitation of operational activity to aircraft of 12,500 lbs. or less certificated maximum takeoff weight (MTOW). This limitation is particularly pertinent in the definition of based aircraft and fleet mix projections.
5.1 Historical and Current Aviation Activity
At general aviation airports such as HWO, there are two primary indicators of activity; based aircraft and aircraft operations. A based aircraft is generally defined as an aircraft that is permanently stored at an airport. In the case of Florida airports, consideration is often given to counting aircraft as based that spend the majority of the year at an airport given the high number of seasonal residents that reside in

North Perry Airport (HWO) – Airfield Safety Enhancement and Geometry Study
Section 5 – Forecasts Final Report April 2017 42
Florida for 6 or more months a year. An aircraft operation represents either a take-off or landing conducted by an aircraft and as a result a takeoff and a landing such as those that occur with flight training “touch and go” practice counts as two operations.
Historical based aircraft and operations data for HWO provides the baseline for the consideration of projections of future activity at the Airport. While historical trends are not always reflective of future periods, historical data does provide insight into how local, regional, and national demographic and past events has contributed to aviation-related trends nationally and at a specific airport. It is also important to point out that historical data typically reflects the available facilities at the Airport. For example, HWO is configured with four runways, all of similar dimensions, and have takeoff weight restrictions of 12,500 lbs. Despite being a busy general aviation facility, the airfield configuration and weight limitations restrict the size and type of aircraft that can operate at the Airport. As these conditions are anticipated to remain constant throughout the 20-year planning horizon, these factors will continue to drive the types of aircraft that will be able to operate at HWO as well as limiting the potential for significant business jet operations into and out of HWO as the vast majority of these exceed the weight limitation.
The following sections summarize overall historical aviation-related activity at HWO in terms of aircraft operations and the number of based aircraft at the Airport. In general, within the aircraft sectors served by HWO, the airport has experienced similar historical trends in activity as has been seen nationwide. Specifically, this has equated to a gradual decline in the number of based aircraft at the Airport since 2000 and significant fluctuation in aircraft operations stemming from fallout from the events of September 11, 2001, gradual recovery in the mid-2000’s, economic recession of 2008-2010 and subsequent effects through 2012, and a recovery between 2012 and 2015. Recently, this recovery has been accelerated by the reduction in fuel prices which has contributed to a strong up-tick in aircraft operations and will continue to exert a positive influence on operations as long as the price of oil is artificially depressed by world market and political events. It is not assumed, however, that the current trend of low oil prices will remain in play over the longer term considered in this analysis.
These and other conditions were considered in the process of developing forecasts for HWO’s future activity. In order to establish the historical perspective, previous activity data were compiled from several sources including ATADS, control tower counts, TFMSC, 5010 Airport Master Records, and FAA TAF records. Information from the Florida Department of Transportation (FDOT) was also utilized where applicable.
Based Aircraft
Several sources of information related to existing and historical based aircraft information were consulted. This data is provided by the FAA, FDOT, and by the Airport itself. The FAA TAF is the official FAA forecast of aviation activity for U.S. airports. It contains historic data and projections for active airports in the National Plan of Integrated Airport Systems (NPIAS) including FAA towered airports, Federal contract towered airports, non-federal towered airports, and non-towered airports. According to the January 2016 TAF, there were 255 based aircraft at HWO. FDOT maintains an inventory of based aircraft and operations for general aviation airports throughout the State. The most recent inventory, updated in 2014, identified 349 based aircraft in 2014 and estimated 353 based aircraft in 2015.
Senior management staff from HWO conducted a count of based aircraft, inventorying occupants of all T-hangars and leased tie-down positions using a listing of aircraft N-numbers to validate occupancy, FBO aircraft, aircraft operated by commercial operators notable among these being two banner tow operators having multiple aircraft, along with aircraft owned and operated by other airport tenants. Based on this recent inventory, a total of 398 aircraft were identified as being based aircraft at HWO in

North Perry Airport (HWO) – Airfield Safety Enhancement and Geometry Study
Section 5 – Forecasts Final Report April 2017 43
2015/2016 (complete listing provided in Appendix B. The National Based Aircraft Inventory Program reports based aircraft directly from an airport. For HWO, the last update to this database was in 2010, when the Airport reported 245 based aircraft.
In recent years as other nearby GA airports and their Fixed Base Operators have focused their efforts on serving the growing corporate aviation market and the array of medium and larger business jets that are typical of that market, light GA operators and specifically those in the under 12,500 lb. class began relocating. Opa Locka (OPF) for example is one such nearby facility where the focus on the upper end GA market has led to operators of light aircraft moving, and HWO has been the beneficiary of this trend. This shifting is likely not to have been picked up in the FAA database.
Table 5-1 presents historical based aircraft at HWO referencing FAA TAF, FDOT, and Airport-reported totals. For Airport-reported based aircraft, years 2011 through 2014 are extrapolated since data were available in 2010 and 2015. Also shown is the annual compounded annual growth rate (CAGR). It should be noted that CAGR calculates a constant rate of change over a given time period. It dampens the effect of volatility during periods that experience significant change, and is essentially a “smoothed” annual growth rate.
Table 5-1: Historical HWO Based Aircraft
2005 325 325
2006 328 302
2007 325 302
2008 257 302
2009 228 325
2010 247 325 245
2011 247 351 276
2012 252 322 306
2013 253 345 337
2014 258 349 367
2015 258 353 398
CAGR
2005-2015 -2.28% 0.83% N/A
Sources: FAA TAF January 2016. FDOT Dept. of Aviation Forecasts. Prepared: March 2016
Based on discussion with the FAA in May of 2016, it appears that the based aircraft database which is an online data site, had not been being consistently updated with annual changes in the number of based aircraft at HWO. As such, a significant component of the disparity between the TAF based aircraft values and the counts performed by BCAD appear to be a result of having not updated that database over the past several years. Because of the significant difference in the number of based aircraft reported by the TAF compared with data from FDOT airport inspections and databases and actual Airport survey data, the TAF estimates were not deemed as a reliable base from which to project future based aircraft at the Airport. Although FDOT regularly updates its inventory of based aircraft at the
Year FAA TAF FDOT
Airport Reported
Based Aircraft

North Perry Airport (HWO) – Airfield Safety Enhancement and Geometry Study
Section 5 – Forecasts Final Report April 2017 44
State’s general aviation airports, the database was last updated in 2014 or approximately two years old. As such, it is estimated that based aircraft figures reported by the Airport reflect the most accurate inventory: this data will be utilized in the development of forecasts throughout the remainder of this document.
Aircraft Operations
Annual aircraft operations represent the number of takeoffs and landings occurring at the Airport during a calendar year. Historical operations data include operations conducted by both based aircraft as well as operations conducted by itinerant aircraft stored at other airports arriving at the Airport for a variety of reasons including business, recreation, or flight training purposes.
Historical aircraft operations data for HWO are summarized in Table 5-2. Data have been obtained from the ATADS database. Although historical data are also available from the FAA TAF and FDOT, the ATADS database reports annual calendar year operations data from control towers. It is interesting to note, that similar to the FAA’s based aircraft numbers the ATADS data for 2015 is, in this case slightly lower than actual counts from the HWO ATCT. Based on year end 2015 ATCT counts the total count for 2015 was 172,387 operations. As shown, the ebb and flow of operational activity is clearly evident of the past 10-year period listed in the table. Total aircraft operations have fluctuated significantly between 2005 and 2015 with the variance between the 2007 10 year high and 2010 10-year low being just under 61,900 annual operations. If one goes back even farther this same pattern of fluctuation remains evident. It is due to this pattern that aviation forecasts look to longer term patterns and not short term demand spurts or retrenchment. Despite the fluctuating patter there has been an overall increase of approximately 2.2 percent annually during that timeframe noted in Table 5-2.
Table 5-2: Historical HWO Aircraft Operations
Air Carrier Air Taxi GA Military Civil Military
Sources: ATADS Database, January 2016. Prepared: March 2016
5.2 Socioeconomic Factors
Depending on the role of an airport and the population base that it serves, the socioeconomic profile of the local community can often influence existing and future aviation-related activity. In general terms, the North Perry Airport is situated in Broward County in the west-central portion of the Miami-Fort Lauderdale metropolitan area, which is the largest and fastest growing region in Florida. Because of its
Year Itinerant Operations Local Operations Total
2005 1 6 51,261 19 86,358 22 137,667
2006 0 4 57,580 24 106,549 221 164,378
2007 0 0 61,442 66 120,608 74 182,190
2008 1 5 59,931 56 109,946 138 170,077
2009 0 50 57,173 336 104,536 790 162,885
2010 4 92 47,880 49 72,029 268 120,322
2011 7 457 50,170 51 85,037 382 136,104
2012 0 93 47,711 10 79,801 33 127,648
2013 1 224 50,126 33 91,949 66 142,399
2014 0 230 52,503 33 102,944 66 155,776
2015 0 210 58,653 23 112,600 64 171,550
CAGR 2005-2015
-100.00% 42.7% 1.4% 1.9% 2.7% 11.3% 2.2%

North Perry Airport (HWO) – Airfield Safety Enhancement and Geometry Study
Section 5 – Forecasts Final Report April 2017 45
hospitable weather, numerous beaches, and multi-modal regional and international transportation hubs, the Miami-Fort Lauderdale area receives significant business and tourist related commercial and general aviation activity. Although it is difficult to determine the socioeconomic profile of visitors, there is a significant amount of data available to identify the demographics of the local populace. Where applicable, these data can be used in the planning process to relate future aviation activity levels at the Airport to local and regional socioeconomic trends.
For the purposes of this document, local socioeconomic data that will be analyzed have been obtained from Woods and Poole, an independent firm that specializes in long-term county and metropolitan area economic and demographic projections. The geographical area that is examined is defined as the Miami-Fort Lauderdale Metropolitan Statistical Area (MSA), which includes cities in the Miami Metropolitan area in Miami-Dade County, Broward County, and Palm Beach County. This analysis examines historical trends and future projections of the MSA’s population, employment, and per capita income. Several sources of data were used for this section. Data provided in this section were provided by Woods and Poole Economics, Inc., and the U.S. Census Bureau’s American FactFinder.
Table 5-3: summarizes the population trends of the Miami MSA, the State of Florida, and the United States, with the compound annual growth rates (CAGR) indicated for each of the areas.
Table 5-3: Comparison of Historical Population Growth (U.S., FL, and Miami MSA)
2000 5,026,000 15,982,378 282,162,000
2008 5,455,000 18,251,243 304,094,000
2009 5,505,000 18,423,878 306,772,000
2010 5,582,000 18,852,220 309,326,000
2011 5,688,000 19,107,900 311,583,000
2012 5,763,000 19,355,257 313,874,000
2013 5,828,000 19,600,311 316,129,000
2014 5,895,000 19,893,297 318,699,000
2015 5,965,000 20,271,272 321,449,000
CAGR 2000-2015 1.15% 1.60% 0.87%
Sources: Woods and Poole, and U.S. Census, American FactFinder. Prepared: March 2016
As shown in Table 5-3: , both the Miami-Fort Lauderdale MSA and the State of Florida have increased in population at a higher rate than the U.S. as a whole between 2000 and 2015.
In addition to population, there are other demographic factors that impact demand for general aviation in a particular region. The regional economy can also significantly impact aviation demand. Regional economic trends are summarized in this analysis through an examination of employment and earnings data. Table 5-4 presents historical employment and total earnings data for the Miami-Fort Lauderdale MSA, and the State of Florida as a whole. It should be noted that total earnings data obtained from Woods and Poole is reported in constant dollars (year 2009) to adjust for inflation over time.
Year Miami MSA Florida United States

North Perry Airport (HWO) – Airfield Safety Enhancement and Geometry Study
Section 5 – Forecasts Final Report April 2017 46
Table 5-4: Historical Miami and State of Florida Employment and Earnings
Year
Miami-Fort Lauderdale MSA Florida
Employment (in thousands)
Total Earnings (in millions)
Employment (in thousands)
Total Earnings (in millions)
2000 2,771 127,788 8,841,600 381,937
2008 3,259 152,844 10,304,800 461,271
2009 3,134 145,021 9,840,250 440,520
2010 3,142 144,185 9,780,200 440,948
2011 3,255 145,433 9,927,836 451,764
2012 3,341 150,774 10,075,472 462,580
2013 3,419 155,370 10,223,108 473,396
2014 3,483 159,277 10,370,744 484,212
2015 3,547 163,403 10,518,380 495,027
CAGR 2000-2015 1.66% 1.65% 1.16% 1.74%
Source: Woods and Poole Economics, Inc. Note: Data available for years 200, 2008-2010, 2015, intermediate years are extrapolated. Prepared: March 2016
As shown in Table 5-4, employment growth and total earnings for the Miami-Fort Lauderdale MSA and the State of Florida have increased significantly since 2000. The 1.66 percent employment growth from 2000 to 2015 for the Miami-Fort Lauderdale area and 1.16 percent growth for the State as a whole during that timeframe outpaces the population growth rate identified in Table 5-3. Total earnings, which is defined as the sum of wages and salaries, proprietors’ income, and other labor income has also increased between 2000 and 2015.
Per capita personal income (PCPI) is another way to measure the economic growth of an area. PCPI is a composite measure of market potential and indicates the general ability of persons to purchase products and services. Table 5-5 provides a summary of historical PCPI figures for the Miami-Fort Lauderdale MSA, the State of Florida, and the U.S. It should be noted that PCPI data obtained from Woods and Poole is reported in constant dollars (year 2009) to adjust for inflation over time.

North Perry Airport (HWO) – Airfield Safety Enhancement and Geometry Study
Section 5 – Forecasts Final Report April 2017 47
Table 5-5: Historical Miami MSA and State of Florida per Capita Personal Income
Year
Miami MSA Florida U.S.
Per Capita Personal Income ($ 2009)
Per Capita Personal Income ($ 2009)
Per Capita Personal Income ($ 2009)
2000 $38,583 $35,580 $36,794
2008 $44,505 $40,241 $40,921
2009 $40,482 $38,967 $38,637
2010 $40,874 $39,129 $39,492
2011 $41,676 $39,363 $40,646
2012 $42,253 $39,596 $41,674
2013 $42,277 $39,830 $41,707
2014 $42,897 $40,063 $42,365
2015 $43,542 $40,297 $43,021
CAGR 2000-2015 0.81% 0.83% 1.05%
Source: Woods and Poole Economics, Inc. Note: Data available for years 200, 2008-2010, 2015, intermediate years are extrapolated. Prepared: March 2016
As shown in Table 5-5, the per capita income of the U.S. as a whole increased at a higher rate between 2000 and 2015 than both the Miami-Fort Lauderdale MSA and the State of Florida, however, in 2015 the Miami-Fort Lauderdale region had higher average incomes than Florida and the U.S. as a whole.
Socioeconomic Trends - Summary
Based on the data presented in this section, the following assumptions can be made regarding the socioeconomic profile of the area that surrounds HWO:
• The Miami-Fort Lauderdale MSA has increased by nearly 1 million residents since 2000, and in the last 5 years, the area is growing by nearly 70,000 new residents annually. Based on data provided by Woods and Poole, this trend is anticipated to continue.
• Employment in the Miami-Fort Lauderdale MSA is increasing faster than the State of Florida, and is outpacing population growth indicating that the economy is strong and able to accommodate future population growth.
• Total earnings for the Miami-Fort Lauderdale MSA is increasing at an annual rate of 1.65 percent and per capita income is higher than the State of Florida and the U.S. as a whole. These trends are anticipated to continue and serve as another indication that the local economy of the Miami MSA is anticipated to be strong throughout the projection period.
5.3 Local and Regional Aviation Trends
The State of Florida has 110 public-use airports that are designated for general aviation use. All airports, even busy commercial service airports, accommodate general aviation activity. The State is unique in that it experiences a proportionately higher level of general aviation activity due to its hospitable climate and terrain, significant tourism industry, and availability of flight training facilities. This section

North Perry Airport (HWO) – Airfield Safety Enhancement and Geometry Study
Section 5 – Forecasts Final Report April 2017 48
identifies trends in aviation specific to Florida, the Miami-Fort Lauderdale Metropolitan areas, and the areas proximate to North Perry Airport itself.
The Florida Aviation System Plan (FASP) was updated in 2012 and identifies trends in aviation and socioeconomic factors that impact Florida’s airports. The FASP notes that population and employment are anticipated to increase in all regions of the State. The three largest regions are the East Central, West Central, and Southeast Metropolitan, the last of which includes Miami and the North Perry Airport. These three regions account for roughly one-third of Florida’s total population, and are also the regions projected to gain the largest number of additional residents in future years. According to the FASP, the Southeast Metropolitan Region more than doubled in population during the last three decades, exceeding 5 million residents in the 2010 census, and is expected to grow to 7.3 million residents by 2035.
As it pertains to trends in aviation for Florida’s airports, the FASP identifies the following sectors as specific areas of focus:
• Changing Industry/Technology
o NextGen, new TSA security objectives at general aviation airports
• Flight Restrictions
o TSA Temporary Flight Restrictions, particularly in busy metropolitan areas
o National Air Tour Safety Standards/Restricted Military and North-South airspace corridors
• Changing Demand/User Needs
o Fractional Ownership, specifically for business jets (of very limited importance to HWO)
o Fluctuation of fuel costs
o Fixed Base Operator insurance increases
• Funding
o Airport Improvement Program (AIP) Funding and FAA Reauthorization and Reform Act
o Shortfall in federal benefits for general aviation airports
In order to address these and other areas of focus, FDOT (through its Joint Automated Capital Improvement Plan) process has incorporated a system that matches airport service categories to future development needs. Historical and short-term future State funding for Florida airports is identified in Table 5-6.

North Perry Airport (HWO) – Airfield Safety Enhancement and Geometry Study
Section 5 – Forecasts Final Report April 2017 49
Table 5-6: Florida State Aviation Funding
Category Historical Projected
2013 2014 2015 2016 2017 5-YR Total
Aviation Safety $9,239,138 $13,957,267 $10,632,267 $15,026,042 $14,842,446 $63,697,628
Aviation Security $5,110,107 $7,137,475 $3,823,139 $5,270,096 $8,465,791 $29,806,608
Aviation Capacity $95,972,454 $64,304,293 $75,968,933 $72,756,032 $58,757,344 $367,759,056
Aviation Preservation $23,580,645 $31,161,576 $30,077,737 $31,947,158 $35,863,205 $152,630,321
Aviation Environmental Project
$1,108,140 $1,023,020 $640,000 $1,260,000 $4,031,160
Aviation Revenue/ Operational
Improvement $29,951,339 $20,019,288 $21,024,098 $18,873,221 $23,965,340 $63,697,628
Total $164,961,823 136,580,367 $142,549,194 $144,512,549 $143,154,126 $731,758,059
Source: Florida Aviation System Plan Updated 2012. Prepared: March 2016
In 2014, FDOT conducted a Statewide Aviation Economic Impact Study Update that identified direct and indirect economic impacts of individual airports in Florida. Although the Study did not identify specific trends in aviation, it is beneficial to understand the economic importance of an Airport. According to the Study, it was estimated that the North Perry Airport accounted for over 900 jobs with a total payroll of $33.5 million and a total economic output (direct and indirect impacts) of over $83 million. This places HWO as the 20th ranked airport in terms of employment and 21st in terms of total economic output in the State of Florida.
5.4 National Aviation Trends
The preparation of forecasts of aviation-related demand requires a general understanding of recent and anticipated national trends in the aviation industry. National trends provide insight for the development of aviation activity projections for the Airport. Some trends in the aviation industry will undoubtedly have a greater impact on HWO than others.
There are 19,360 public and private airport facilities located throughout the United States, as reported by the FAA; 3,331 of these airports are included in the FAA’s National Plan of Integrated Airport Systems (NPIAS), indicating that they are eligible for federal funding assistance. HWO is identified as a Regional general aviation airport in the NPIAS, which is defined by the FAA as an airport that, “Supports regional economies by connecting communities to regional and national markets. These airports have high levels of activity with some jets and multiengine propeller aircraft. These airports average about 90 total based aircraft, including 3 jets.” General aviation airports comprise 85 percent of the airports listed in the NPIAS.
Since all of the activity at the Airport is associated with general aviation, this section focuses on historical and anticipated trends in the U.S. general aviation industry. General aviation aircraft are defined as all aircraft not flown by commercial airlines or the military.

North Perry Airport (HWO) – Airfield Safety Enhancement and Geometry Study
Section 5 – Forecasts Final Report April 2017 50
General Aviation Activity Trends
The aircraft production and general aviation industries have experienced significant changes in recent years. At the national level, fluctuating levels of general aviation usage caused by economic upturns/downturns resulting from the nation’s business cycle have all impacted general aviation demand.
Each year, the General Aviation Manufacturers Association publishes its General Aviation Statistical Databook and Industry Outlook. The 2015 publication identifies trends in the general aviation industry through 2015, historical aviation-related activity data through 2014, and forecasts of aviation activity through 2035. According to GAMA, the number of active aircraft in the U.S. general aviation fleet, the number of annual general aviation hours flown, general aviation AvGAS consumption, and total general aviation fuel consumption have all declined in recent years (see Table 5-7). Following the events of September 11, 2001, general aviation activity nationwide was negatively impacted. Rising fuel costs and economic volatility further accelerated this decline from 2008 through 2014. It should be noted however, that 2015 estimates for all of these categories except for the number of aircraft in the U.S. fleet show slight increases, indicating that that activity has stabilized and currently appears to be returning to a slow, steady growth in the future. This stabilization has been aided by the inordinate drop in the prices of fuel over the past year.
Table 5-7 also shows forecasts of future aviation activity. As shown, with the exception of AvGas consumption, general aviation activity is projected to see moderate annual growth through 2035. The primary reason for the lag in AvGas consumption is that the majority of growth in the general aviation industry is projected to be experienced by jet and corporate type aircraft. GAMA projects an annual decline of -0.6 percent in the number of piston aircraft between 2014 and 2035 (139,182 to 120,945) compared to an increase of 2.9 percent in the number of business jets (12,362 to 20,815).
Table 5-7: U.S. General Aviation Activity Data
Certificate Type
Historical Projected
2000 2010 2012 2013 2014 2015 2020 2030 2035
Average Growth 2014-2035
*Note: Year 2015 data are estimated, no data for 2011 are available. Source: 2015 General Aviation Statistical Databook & 2016 Industry Outlook Prepared: March 2016
Active U.S. GA Aircraft
217,534 223,370 209,034 199,927 204,408 198,780 199,410 206,680 214,260 0.4%
U.S. GA Hours Flown (in
Thousands) 29,960 24,802 24,403 22,876 23,271 23,566 24,355 27,869 30,626 1.4%
U.S. AvGAS Consumption
Gal. (in Millions) 322.8 220.7 212.3 197.3 196.6 198.3 189.9 188.4 193.8 -0.1%
Total U.S. Aviation Fuel Consumption
Gal. (in Millions)
1,304.8 1,655.6 1,754.7 1,456.9 1,566.6 1,605.8 1,811.1 2,288.0 2,500.2 2.3%

North Perry Airport (HWO) – Airfield Safety Enhancement and Geometry Study
Section 5 – Forecasts Final Report April 2017 51
Another resource that was consulted to identify national general aviation trends was the FAA’s Aerospace Forecast 2016-2036. This publication identifies historical economic and aviation-related trends and data, as well as forecasts of U.S. aviation activity. The Forecast notes that despite slow economic growth in the U.S. and globally, 2015 showed signs of recovery in the aviation industry. “The general aviation market showed continuing improvements in single engine piston and business jet segments, while declines in turboprop and multi-engine piston segments translated into a downturn in shipments. Overall deliveries were down by 3.1 percent in calendar year 2015; even though U.S. billings increased 2.4 percent to $12.0 billion. General aviation activity at FAA and contract tower airports recorded a 0.3 percent decline in 2015 as itinerant activity fell 0.7 percent, more than offsetting a 0.1 percent increase in local operations.”
The FAA also projects a slight long-term decrease in AvGAS consumption, but moderate increases in total aircraft fuel consumption, general aviation hours flown, and the number of aircraft in the general aviation fleet. Overall, the FAA identifies moderate, long-term growth in general aviation operations through 2013 (see Table 5-8). As shown, the number of general aviation operations at FAA and contract towers is anticipated to increase from 25,578,000 in 2015 to 27,416,000 in 2035, which reflects 0.36 percent annual growth.
According to the FAA, “The long-term outlook for general aviation is favorable, led primarily by gains in turbine aircraft activity”. The active general aviation fleet is forecast to increase 0.2 percent a year between 2015 and 2036, equating to an absolute increase in the fleet of about 7,000 units. While steady growth in both GDP and corporate profits results in continued growth of the turbine and rotorcraft fleets, the largest segment of the fleet – fixed wing piston aircraft continues to shrink over the forecast. Although fleet growth is minimal, the number of general aviation hours flown is projected to increase an average of 1.2 percent per year through 2036, as growth in turbine, rotorcraft, and experimental hours more than offset a decline in fixed wing piston hours.
Table 5-8: General Aviation Operations at FAA and Contract Tower Facilities
Source: FAA Aerospace Forecasts 2016-2036. Prepared March 2016
Historical Total U.S. ATCT GA Operations
2001 37,626,000
2008 31,574,000
2009 28,019,000
2010 26,580,000
2011 25,965,000
2012 26,130,000
2013 25,806,000
2014 25,654,000
2015 (est.) 25,578,000
Projected
2020 26,026,000
2025 26,473,000
2035 27,416,000
Average Annual Growth
2015-2035 0.36%
North Perry Airport (HWO) – Airfield Safety Enhancement and Geometry Study
Section 5 – Forecasts Final Report April 2017 52
Pilot Certificates
Another national trend in aviation that is anticipated to impact activity is the regulatory change that affects the number of student pilot certificates. In 2010, the FAA increased the duration of validity for pilot certificates under the age of 40 from 36 months to 60 months. Since this change, the number of student pilot licenses has increased from 119,119 in 2010 to an estimated 122,729 in 2015. According to the FAA Terminal Aerospace Forecasts 2016-2036, the number of student pilot certificates is anticipated to reach 131,800 by 2036.
Fuel Costs
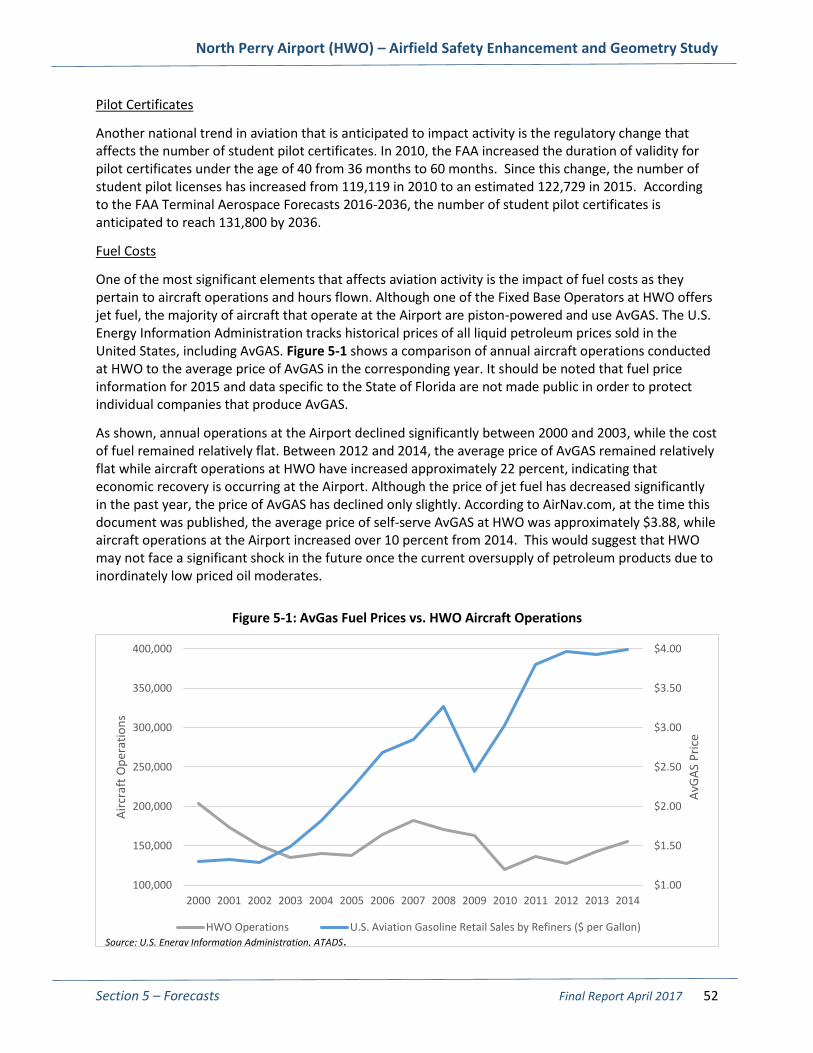
One of the most significant elements that affects aviation activity is the impact of fuel costs as they pertain to aircraft operations and hours flown. Although one of the Fixed Base Operators at HWO offers jet fuel, the majority of aircraft that operate at the Airport are piston-powered and use AvGAS. The U.S. Energy Information Administration tracks historical prices of all liquid petroleum prices sold in the United States, including AvGAS. Figure 5-1 shows a comparison of annual aircraft operations conducted at HWO to the average price of AvGAS in the corresponding year. It should be noted that fuel price information for 2015 and data specific to the State of Florida are not made public in order to protect individual companies that produce AvGAS.
As shown, annual operations at the Airport declined significantly between 2000 and 2003, while the cost of fuel remained relatively flat. Between 2012 and 2014, the average price of AvGAS remained relatively flat while aircraft operations at HWO have increased approximately 22 percent, indicating that economic recovery is occurring at the Airport. Although the price of jet fuel has decreased significantly in the past year, the price of AvGAS has declined only slightly. According to AirNav.com, at the time this document was published, the average price of self-serve AvGAS at HWO was approximately $3.88, while aircraft operations at the Airport increased over 10 percent from 2014. This would suggest that HWO may not face a significant shock in the future once the current oversupply of petroleum products due to inordinately low priced oil moderates.
Figure 5-1: AvGas Fuel Prices vs. HWO Aircraft Operations
$1.00
$1.50
$2.00
$2.50
$3.00
$3.50
$4.00
100,000
150,000
200,000
250,000
300,000
350,000
400,000
2000 2001 2002 2003 2004 2005 2006 2007 2008 2009 2010 2011 2012 2013 2014
AvG
AS
Pri
ce
Air
craf
t O
per
atio
ns
HWO Operations U.S. Aviation Gasoline Retail Sales by Refiners ($ per Gallon)Source: U.S. Energy Information Administration, ATADS.
North Perry Airport (HWO) – Airfield Safety Enhancement and Geometry Study
Section 5 – Forecasts Final Report April 2017 53
Business Use of Aviation
One other aspect of general aviation that could be considered a “trend” is business use of aviation. Business-related aviation is often thought to pertain specifically to corporate jets or turbo props. However, multi-engine piston and even single engine piston aircraft are often used for regional business travel, particularly in areas with high populations and limited or congested transportation connectivity outlets.
Business use of aviation is very important at HWO and in the nation as a whole. For the purposes of this document, the terms business and corporate aircraft are used interchangeably, as they both refer to aircraft used to support a business enterprise; though, as defined by the FAA, they each have their own distinct definition. The FAA defines business use as:
“Any use of an aircraft (not for compensation or hire) by an individual for transportation required by the business in which the individual is engaged.”
The FAA defines corporate transportation as:
“Any use of an aircraft by a corporation, company or other organization (not for compensation or hire) for the purposes of transporting its employees and/or property, and employing professional pilots for the operation of the aircraft.”
The FAA estimated in their 2015-2019 Report to Congress that business aircraft usage comprises 8.7 percent of all aviation activity. An additional 9.7 percent of the nation’s general aviation activity is considered corporate. These figures represent a general decline nationally in the use of business/corporate aviation between 2008 and 2012 when they totaled 9.6 percent and 11.9 percent, respectively.
Increased personnel productivity is one of the most important benefits of using business aircraft. Companies flying general aviation aircraft for business control scheduling capabilities. Itineraries can be changed as needed, and aircraft can fly to destinations not served by scheduled airlines.
Business aircraft usage provides the following:
• Employee time savings
• Increased enroute productivity
• Minimized time away from home
• Enhanced industrial security
• Enhanced personal safety
• Management control over scheduling
Many of the nation's employers that use general aviation aircraft are members of the National Business Aircraft Association (NBAA). The NBAA’s Business Aviation Fact Book 2014 shows that nationwide business aviation contributes $150 billion to the U.S. economic output. The NBAA Fact Book also indicates that only three percent of business aircraft are flown by Fortune 500 companies; the remaining 97 percent are operated by a large spectrum of companies and organizations of various sizes. This indicates that the use of business aviation is not exclusive to large companies, and has practicable applications for many different types of businesses.
Business use of general aviation aircraft ranges from small, single-engine aircraft rentals to multiple aircraft corporate fleets supported by dedicated flight crews and mechanics. General aviation aircraft

North Perry Airport (HWO) – Airfield Safety Enhancement and Geometry Study
Section 5 – Forecasts Final Report April 2017 54
use allows employers to transport personnel and air cargo efficiently. Businesses often use general aviation aircraft to link multiple office locations and reach existing and potential customers. Business aircraft use by smaller companies has escalated as various chartering, leasing, time-sharing, interchange agreements, partnerships, and management contracts have emerged. As it pertains to HWO, business use of aviation is primarily relegated to single-engine and multi-engine piston aircraft.
FAA Forecasts
The FAA publishes forecasts on an annual basis that summarize anticipated trends in most components of general aviation activity. Each published forecast revisits previous activity forecasts and updates them after examining the previous year’s trends in aviation and economic activity. Many factors are considered in the FAA’s development of forecasts, including U.S. and international economic trends and projected fuel costs. FAA forecasts provide detailed analyses of historical and forecasted aviation trends and provide a general framework for anticipated future levels of regional and national aviation activity.
Examples of measures of national general aviation activity that are monitored and forecast by the FAA on an annual basis in the FAA Aerospace Forecasts include active pilots, active hours flown, and active aircraft fleet. Historical and projected activity in each of these categories is examined in the following sections. The data presented is based on the most recent available information, contained in FAA Aerospace Forecasts, Fiscal Years 2016- 2036.
Active Pilots
Active pilots are defined by the FAA as those persons with a pilot certificate and a valid medical certificate. Table 5-9 summarizes historical and projected U.S. active pilots by certificate type. As shown, the FAA projects a slight increase in the total number of pilots through the projection period from 590,039 in 2015 to 597,575 in 2035. Pilot certificate categories that are forecast to experience the most significant increases include Students, Sport Pilot, Airline Transport, and Rotorcraft, while Recreational and Private certificates are projected to decrease through 2035.
Active Hours Flown
Aircraft hours flown is another statistic used by the FAA to measure and project general aviation activity. Hours flown is a valuable measure because it captures a number of activity-related data including aircraft utilization, frequency of use, and duration of use. Total hours flown in general aviation aircraft have declined from 2001 to 2015 by an annual rate of approximately 1.1 percent, as shown in Table 5-10.
Table 5-10 also shows that the FAA projects total active hours flown in the U.S. to increase from approximately 23.2 million in 2015 to 29.1 million in 2035, which reflects an annual growth rate of approximately 1.2 percent. Piston-powered aircraft hours flown are anticipated to decrease slightly through 2035 while increases in hours flown are projected in turbo prop, jet, rotorcraft, experimental, and sport aircraft categories.
Active Aircraft Fleet
The FAA tracks the number of active general aviation aircraft in the U.S. fleet annually. Active aircraft are those aircraft currently registered and flying at least one hour during the year. Table 5-11 summarizes the historical active U.S. general aviation fleet as well as FAA projections of future active aircraft, by aircraft type.

North Perry Airport (HWO) – Airfield Safety Enhancement and Geometry Study
Section 5 – Forecasts Final Report April 2017 55
Active general aviation aircraft decreased slightly between 2001 and 2015 although there was significant growth in the number of turboprop, jet, rotorcraft, and experimental aircraft. The FAA anticipates that these trends will continue throughout the planning period. Fueled by significant increases in jet and turboprop aircraft, the overall active fleet is projected to increase from 203,880 aircraft in 2015 to 210,695 in 2035, which represents an annual growth rate of approximately 0.2 percent. It should also be noted that the piston fleet, both single-engine and multi-engine is anticipated to decrease in size throughout the projection period.
FAA Forecast Summary
The cyclical nature of general aviation activity is illustrated in the historical national data presented in this analysis. While national general aviation activity experienced rebounded growth during the mid and late-1990s, the terrorist attacks of 2001 and the economic downturn of 2008 dampened this nationwide activity. FAA projections of U.S. general aviation activity, including active pilots, active aircraft, and hours flown, all show varied levels of growth and decline through the FAA’s forecast horizon of 2036 (the data presented in this chapter include years through 2035).
Implications for HWO
The implications of the preceding discussion on metropolitan trends and both FDOT statewide aviation projections and the FAA’s national forecasts present a mix of both positive factors and challenges to an airport such as HWO whose expansion opportunities are limited by adjacent development and by the impact of the weight restriction on the mix of aircraft that can operate at the airport. The robust nature of growth in south Florida points to factors that are proven to influence growth in aviation activity as new residents arrive, some of these new residents bring aircraft with them or have the financial means to enter the aviation market. While the forecast for the light GA sector would present a less desirable perspective, much of the growth at HWO is not anticipated to be the result of new aircraft manufacturing, but rather from the relocation of light aircraft out of other airports, such as FXE, FLL and OPF, to HWO as these facilities become more crowded and as they focus on accommodating the activities of the growing fleet of mid to heavy business jets.
Robust growth in the rotorcraft fleet is another positive for HWO given the fact that the airport already operates as the base for media helicopter operations and has a helicopter flight school on site. Finally, the continued stability in the number of student pilots nationally is also a positive sign as Florida is a major center of flight school activity and HWO already sees strong flight training operational activity. Thus, while nationally the growth in the fixed-wing general aviation industry is being driven by Turbo-prop and turbine powered aircraft which are unlikely to see significant activity at HWO, this growth will result in operators of light GA being potentially priced out of airports in the immediate region that are focusing on serving the upper end turbine market segments, not to mention the desire by light GA pilots to look for a location having a more similar/compatible mix of aircraft operations.
Thus, it is anticipated that HWO will experience growth in both based aircraft and operational activity as a result of the following factors:
• Influx of new residents to the area some of whom will be relocating aircraft from their previous home to the Broward County Area.
• Relocation of aircraft within the southeast Florida area from commercial service airports (FLL primarily) and airports focusing on Corporate Jet users such as OPF, FXE and BCT. This shift results from cost issues and from redevelopment/development on the airports

North Perry Airport (HWO) – Airfield Safety Enhancement and Geometry Study
Section 5 – Forecasts Final Report April 2017 56
• Given the homogenous nature of the HWO fleet, HWO remains a good location for flight school and flight training activity while retaining and growing other existing general aviation related commercial activities that presently operate from the airport.
• Competitive facility costs versus other regional airports

North Perry Airport (HWO) – Airfield Safety Enhancement and Geometry Study
Section 5 – Forecasts Final Report April 2017 57
Table 5-9: Historical and Projected U.S. Active Pilots
Certificate Type Historical Projected Annual
Growth 2001-2015
Annual Growth 2015-2035 2001 2011 2012 2013 2014 2015 2020 2025 2030 2035
Students 94,920 118,657 119,946 120,285 120,546 122,729 126,150 128,150 130,000 131,550 2.1% 0.3%
Recreational 316 227 218 238 220 190 190 185 180 180 -2.8% -0.3%
Sport N/A 4,066 4,493 4,824 5,157 5,482 7,600 9,750 12,000 14,150 N/A 4.8%
Private 243,823 194,441 188,001 180,214 174,883 170,718 164,350 156,000 152,850 150,600 -2.1% -0.6%
Commercial 120,502 120,865 116,400 180,206 104,322 101,164 93,000 90,350 89,400 89,000 -1.3% -0.6%
Transport 144,702 142,511 145,590 149,824 152,933 154,730 156,200 158,600 162,800 167,600 0.1% 0.4%
Rotorcraft 7,727 15,220 15,126 15,114 15,511 15,566 16,630 18,440 21,015 23,820 7.2% 2.2%
Glider 8,473 21,141 20,802 20,381 19,927 19,460 19,075 18,915 18,835 18,835 9.3% -0.2%
Total: 619,963 617,128 610,576 599,086 593,499 590,039 582,895 580,390 587,080 595,735 -0.4% 0.1%
Instrument Rated¹ 315,276 314,122 311,952 307,120 306,066 304,329 303,950 304,100 307,000 310,550 -0.3% 0.1%
¹Instrument rated pilots should not be added to other categories in deriving total. Source: FAA Aerospace Forecasts, Fiscal Years 2016-2036. Prepared: March 2016

North Perry Airport (HWO) – Airfield Safety Enhancement and Geometry Study
Section 5 – Forecasts Final Report April 2017 58
Table 5-10: Active General Aviation and Air Taxi Hours Flown (in thousands)
Certificate Type
Historical Projected Annual Growth
2001-2015
Annual Growth
2015-2035 2001 2011(E) 2012 2013 2014 2015(E) 2020 2025 2030 2035
Single-engine Piston
16,549 11,844 11,442 10,706 10,395 10,312 9,946 9,596 9,321 9,146 -3.3% -0.6%
Multi-engine Piston
2,644 1,782 1,766 1,646 1,573 1,555 1,505 1,489 1,496 1,503 -3.7% -0.2%
Turboprop 1,773 2,463 2,733 2,587 2,613 2,582 2,570 2,710 3,032 3,478 2.7% 1.6%
Jet 2,654 3,407 3,418 3,488 3,881 3,913 4,619 5,389 6,236 7,216 2.8% 3.1%
Rotorcraft 1,952 3,411 3,454 2,949 3,242 3,240 3,766 4,313 4,807 5,321 3.7% 2.5%
Experimental 1,157 1,203 1,243 1,191 1,244 1,260 1,391 1,533 1,691 1,849 0.6% 1.9%
Sport N/A 278 169 173 165 180 253 331 410 489 N/A 5.0%
Other 287 181 180 135 158 154 152 151 151 150 -4.4% -0.1%
Total: 27,016 24,570 24,404 22,876 23,271 23,196 24,201 25,513 27,143 29,152 -1.1% 1.2%
Sources: FAA Aerospace Forecasts, Fiscal Years 2016-2036 Note: E=Estimate Prepared: March 2016

North Perry Airport (HWO) – Airfield Safety Enhancement and Geometry Study
Section 5 – Forecasts Final Report April 2017 59
Table 5-11: Historical and Projected U.S. Active General Aviation Fleet
*Experimental Light-sport category that was previously shown under Sport Aircraft is moved under Experimental Aircraft category, starting in 2012. Note: An active aircraft is one that has a current registration and was flown at least one hour during the calendar year. Source: FAA Aerospace Forecasts, Fiscal Years 2016-2036 Prepared: March 2016
Certificate Type Historical Projected Annual
Growth 2001-2015
Annual Growth 2015-2035 2001 2011(E) 2012 2013 2014 2015(E) 2020 2025 2030 2035
Single-engine Piston
145,034 136,895 128,847 124,398 126,036 125,050 120,485 115,960 111,495 107,780 -1.1% -0.7%
Multi-engine Piston
18,192 15,702 14,313 13,257 13,146 13,085 12,810 12,545 12,175 11,765 -2.3% -0.5%
Turboprop 6,596 9,523 10,304 9,619 9,777 9,570 9,190 9,600 10,705 12,280 2.7% 1.3%
Jet 7,787 11,650 11,793 11,637 12,362 12,475 13,680 15,340 17520 20,175 3.4% 2.5%
Rotorcraft 6,783 10,082 10,055 9,765 9,966 10,240 11,710 13,080 14,450 15,935 3.0% 2.2%
Experimental 20,421 24,275 26,715 24,918 26,191 26,435 27,485 28,500 29,850 31,365 1.9% 0.9%
Sport N/A 6,645 2,001 2,056 2,231 2,410 3,310 4,230 5,110 5,940 N/A 4.5%
Other 6,633 5,681 5,006 4,277 4,699 4,615 4,525 4,490 4,470 4,445 -2.6% -0.2%
Total: 211,446 220,453 209,034 199,927 204,408 203,880 203,195 203,745 205,775 210,695 -0.3% 0.2%

North Perry Airport (HWO) – Airfield Safety Enhancement and Geometry Study
Section 5 – Forecasts Final Report April 2017 60
5.5 Based Aircraft Forecasts
Several sources have been analyzed in the preparation of forecasts of based aircraft at HWO. These include the FAA TAF, the 2009 Master Plan, and FDOT forecasts. Year 2014 and 2015 data and projected forecasts for these sources are identified in Table 5-12. As shown, the FAA TAF shows a total of 258 based aircraft in 2015, and 294 in 2035, resulting in a CAGR of 0.66 percent. The 2009 Master Plan projected a total of 344 based aircraft in 2015, and 402 by 2035, a CAGR of 0.78 percent. And the most recent FDOT forecasts identified 353 based aircraft in 2015 and 439 in 2035, a CAGR of 1.10 percent. It should be noted that trend line in the 2009 Master Plan and FDOT projections have been extrapolated out to the 20-year horizon for this analysis.
Table 5-12: HWO Based Aircraft Comparison
2015 258 353 344
Source: FAA TAF, Accessed January 2016. FDOT website 2014 forecasts. 2009 Airport Master Plan Update Prepared: March 2016
Neither of the noted projections reflect the level of existing based aircraft that was fully documented at HWO in late 2015/early 2016. Because these forecasts do not incorporate the actual Airport-reported total of 398 based aircraft, adjustment to the baseline point of beginning for the projection of Based aircraft is necessary and additional approaches to projecting future based aircraft have been developed for planning purposes.
Based Aircraft Forecast Methodologies
As noted previously, the Airport identified a total of 245 based aircraft to the National Based Aircraft Inventory Program in 2010 and recently completed a detailed airport-wide count of based aircraft in late 2015/early 2016 that identified a total of 398 based aircraft. Other sources such as the FAA TAF and FDOT have historical inventories of based aircraft at HWO, but given the level of detail of the actual Airport count it is clear that this recent count represents the most accurate figure of based aircraft at the Airport. The drawback to having only year 2010 and 2015 actual airport count data for based aircraft (inter years are extrapolated) is that certain types of projection methodologies typically employed for forecasting typically require a more complete data set to be useful for projection presented in this document. Methodologies such as regression or trend analysis utilize historical data to project future activity. Regression based forecasts for general aviation activity have been problematic for years and this fact was noted several years ago by the FAA when they noted the inability to obtain an acceptable level of correlation between trends in GA and typical variables used in forecasting. Since these methodologies will not provide an accurate portrayal of aviation-related activity for based aircraft at HWO, based aircraft forecasts are derived from three alternative approaches to forecasting: socioeconomic, market share, and FAA Comparison.
Historical FAA TAF FDOT Forecast 2009 Master Plan
Forecast
2014 258 349 342
Projected
2020 267 373 357
2025 274 394 372
2035 294 439 402
CAGR 2015-2035 0.66% 1.10% 0.78%

North Perry Airport (HWO) – Airfield Safety Enhancement and Geometry Study
Section 5 – Forecasts Final Report April 2017 61
Socioeconomic Methodology – Population Variable
Socioeconomic characteristics of a community do not always correlate well or reflect aviation-related activity at a nearby airport; however, they can often provide anecdotal evidence of the overall health of the local economy and the level of aircraft activity that might occur at that airport. According to data obtained from Woods and Poole, the population of the Miami-Fort Lauderdale MSA is anticipated to increase from approximately 5.9 million in 2015 to 7.6 million in 2035, which reflects a CAGR of 1.2 percent. The general basis of this approach is that experience has shown that typically the larger the community the greater the range and extent of aviation related activity typically found in that community.
The Socioeconomic-Population Variable Methodology for based aircraft forecasts assumes that between 2016 and 2035, the number of based aircraft at the Airport will increase at the same rate as the rate of population growth in the Miami-Fort Lauderdale MSA (see Table 5-13). As shown, based on the assumed relationship between population and based aircraft the number of based aircraft at HWO would increase from 398 in 2015 to 505 in 2035.
Table 5-13: HWO Socioeconomic – Population Variable Based Aircraft Forecast
Sources: Woods and Poole Economics, Inc., Kimley-Horn Prepared: March 2016
Socioeconomic Methodology – Employment Variable
The number of employed individuals in the Miami-Fort Lauderdale MSA is anticipated to increase from approximately 3.1 million in 2015 to 4.8 million in 2035, a CAGR of 1.56 percent. Similar to the Socioeconomic-Population Variable Methodology, the Socioeconomic-Employment Variable Methodology assumes that between 2016 and 2035, the number of based aircraft at HWO would increase at the same rate as the growth in employment and the number of employed individuals in the Miami-Fort Lauderdale MSA (see Table 5-14). As shown, the number of based aircraft at HWO is projected to increase from 398 in 2015 to 542 in 2035, which reflects a 1.56 percent CAGR.
Historical Miami MSA Population
HWO Based Aircraft
2010 5,582,000 245
2011 5,688,000 276
2012 5,763,000 306
2013 5,828,000 337
2014 5,895,000 367
2015 5,965,000 398
CAGR 2010-2015 1.34% 10.19%
Projected
2020 6,344,000 423
2025 6,744,000 450
2035 7,570,000 505
CAGR 2015-2035 1.20% 1.20%

North Perry Airport (HWO) – Airfield Safety Enhancement and Geometry Study
Section 5 – Forecasts Final Report April 2017 62
Table 5-14: HWO Socioeconomic – Employment Variable Based Aircraft Forecast
Sources: Woods and Poole Economics, Inc., Kimley-Horn Prepared: March 2016
Socioeconomic Methodology – Per Capita Personal Income Variable
Per capita personal income (PCPI) can also be an indicator of a local population’s propensity to travel or own an aircraft. Commercial service is not provided at North Perry Airport; however, the Airport receives significant transient and charter activity. Per capita personal income is examined to project based aircraft at the Airport and the result is depicted in Table 5-15. As shown, per capita income in the Miami-Fort Lauderdale MSA is anticipated to increase from $43,542 in 2015 to $55,766 in 2035, a CAGR of 1.24 percent. This methodology is premised upon the assumption that as income increases there is a propensity for a portion of that income to be used for aviation related pursuits. This methodology projects that the number of based aircraft at the Airport will increase at the same rate as growth in the per capita income in the Miami-Fort Lauderdale MSA. According to the Socioeconomic-Per Capita Personal Income Variable Methodology, the number of based aircraft at HWO is projected to increase from 398 in 2015 to 510 in 2035. It should be noted that per capita data obtained from Woods and Poole is reported in constant dollars (year 2009) to adjust for inflation over time.
Historical Miami MSA
Employment HWO Based
Aircraft
2010 3,142,000 245
2011 3,255,000 276
2012 3,341,000 306
2013 3,419,000 337
2014 3,483,000 367
2015 3,547,000 398
CAGR 2010-2015 2.46% 10.19%
Projected
2020 3,865,000 434
2025 4,189,000 470
2035 4,830,000 542
CAGR 2015-2035 1.56% 1.56%

North Perry Airport (HWO) – Airfield Safety Enhancement and Geometry Study
Section 5 – Forecasts Final Report April 2017 63
Table 5-15: HWO Socioeconomic – Per Capita Personal Income Variable ($2005) Based Aircraft Forecast
Sources: Woods and Poole Economics, Inc., Kimley-Horn Prepared: March 2016
Socioeconomic Methodology – Summary of Results
A summary of the results of the socioeconomic methodologies used to project based aircraft at the Airport is shown in Table 5-16, including the CAGR for each methodology from 2015 through 2035.
Table 5-16: Socioeconomic Forecasts of HWO Based Aircraft
Sources: Woods and Poole Economics, Inc., Kimley-Horn Prepared: March 2016
Based Aircraft Forecast - Market Share Methodology
The second methodology used to project based aircraft at HWO involves the application of a market share projection technique. Aviation market share techniques the portion of a specified market that is captured by a specific airport. In HWO’s case this approach looks at what share of aircraft at towered airports within the State of Florida and the U.S. as a whole are captured, or in this case, based at HWO.
Based on the recent airport inventory, there were 398 based aircraft at the Airport in 2015. According to the FAA TAF, there were 8,069 based aircraft at FAA and Contract Towers in the State of Florida, and 76,040 based aircraft at FAA and Contract Towers in the U.S. HWO accounted for a 4.9 percent market
Historical Miami MSA Per Capita
Personal Income ($2009) HWO Based Aircraft
2010 $40,874 245
2011 $41,676 276
2012 $42,253 306
2013 $42,277 337
2014 $42,897 367
2015 $43,542 398
CAGR 2010-2015 1.27% 10.19%
Projected
2020 $46,725 427
2025 $50,056 458
2035 $55,766 510
CAGR 2015-2035 1.24% 1.24%
Historical Population
Variable Employment
Variable Per Capita Personal
Income Variable
2010 245 245 245
2011 276 276 276
2012 306 306 306
2013 337 337 337
2014 367 367 367
2015 398 398 398
CAGR 2010-2015 10.19% 10.19% 10.19%
Projected
2020 423 434 427
2025 450 470 458
2035 505 542 510
CAGR 2015-2035 1.20% 1.56% 1.24%

North Perry Airport (HWO) – Airfield Safety Enhancement and Geometry Study
Section 5 – Forecasts Final Report April 2017 64
share of based aircraft in Florida in 2015, and 0.5 percent market share in the U.S. These figures are held constant throughout the projection period and compared with FAA TAF projections of based aircraft in Florida and the U.S. (see Table 5-17). As shown, the Florida Market Share Methodology projects an increase from 398 based aircraft at HWO in 2015 to 542 in 2035, a CAGR of 1.55 percent, while the U.S. Market Share Methodology projects an increase from 398 based aircraft in 2015 to 515 based aircraft in 2035, a CAGR of 1.3 percent.
Table 5-17: HWO Market Share Methodology Based Aircraft Forecast
Historical Florida Based
Aircraft
HWO Market Share
FL – Projected Aircraft
U.S. Based
Aircraft
HWO Market Share
U.S. -Projected Aircraft
2010 7,493 3.27% 245 75,348 0.32% 245
2011 7,367 3.74% 276 72,937 0.37% 276
2012 7,504 4.08% 306 73,497 0.41% 306
2013 7,659 4.40% 337 73,918 0.45% 337
2014 7,959 4.62% 367 75,059 0.48% 367
2015 8,069 4.93% 398 76,040 0.52% 398
CAGR 2010-2015 1.49% 10.19% 0.18% 10.19%
Projected
2020 8,715 4.93% 430 81,185 0.52% 425
2025 9,433 4.93% 465 86,704 0.52% 454
2035 10,984 4.93% 542 98,379 0.52% 515
CAGR 2015-2035 1.55% 1.55% 1.30% 1.30%
Sources: FAA TAF, Accessed January 2015, Kimley-Horn Prepared: March 2016
Based Aircraft Forecast – FAA Comparison Methodology
The final approach that was employed to project future based aircraft at HWO involved a review of the rate of based aircraft growth set forth in the FAA TAF for HWO. While it is firmly believed that the number of currently based aircraft listed in the TAF for HWO does not accurately represent actual level of based aircraft at HWO, this does not mean that the growth rates identified for future levels of based aircraft is inherently incorrect. This methodology assumes that the growth rate in based aircraft at the Airport forecasted by the FAA TAF between 2015 and 2035 will occur, but that the number of based aircraft reported in 2015 by the TAF is not reflective of the actual number that exists. As such, the CAGR from the FAA TAF between 2015 and 2035 for HWO is applied to the 398 based aircraft reported by the Airport in 2015 (see Table 5-18). As shown, this methodology projects an increase from 398 based aircraft in 2015 to 454 in 2035.

North Perry Airport (HWO) – Airfield Safety Enhancement and Geometry Study
Section 5 – Forecasts Final Report April 2017 65
Table 5-18: HWO Based Aircraft Forecast – FAA Comparison Methodology
Sources: Woods and Poole Economics, Inc., Kimley-Horn Prepared: March 2016
Based Aircraft Forecast – Preferred Methodology
In total, six approaches were used to develop forecasts of based aircraft at HWO (see Figure 5-2). Additionally, forecasts developed in the previous Master Plan, as well as those reported by the FAA and FDOT have been examined for validity. In recent years, HWO has seen a significant increase in the number of based aircraft, due in part to growth in the fleet of banner tow operators along with relocation of aircraft from other nearby airports.
While the projections of based aircraft using local socioeconomic activity and market share display a continuation of this trend, they do not factor in the constraints in play at HWO and how these may influence future basing of aircraft. These include airspace challenges that adversely impact the ability to make improvements to the existing approach capabilities, proximity to the approach and departure routes to FLL that further impact instrument operations, the 12,500 lb. aircraft weight limit and available runway length. These factors all come into play in the decision process on the part of pilots looking to base an aircraft. For example, the number of instrument rated pilots has consistently risen, particular since the deployment of GPS instrument procedures and this increase has not just been limited to operators of corporate jets, but has been throughout the ranks of the light general aviation aircraft operators as well. These operators look for facilities that have either non-precision capabilities that go down to as low a visibility minimum as allowed or full precision instrument capabilities such as those provided at FXE or OPF. It is anticipated that the limiting factors noted above will have a dampening effect on the rate of growth in aircraft being based at HWO in the future.
As such, and in consideration of the above, the FAA Comparison Methodology produces the preferred forecast for based aircraft at HWO and will be referenced for the remainder of this document and should be used for planning purposes at the Airport.
Historical FAA TAF Forecast
HWO Based Aircraft
2010 247 245
2011 247 276
2012 252 306
2013 253 337
2014 258 367
2015 258 398
CAGR 2010-2015 0.88% 10.19%
Projected
2020 267 412
2025 274 423
2035 294 454
CAGR 2015-2035 0.66% 0.66%

North Perry Airport (HWO) – Airfield Safety Enhancement and Geometry Study
Section 5 – Forecasts Final Report April 2017 66
Figure 5-2: HWO Based Aircraft Forecast – Summary
Sources: Woods and Poole Economics, Inc., FAA TAF, Accessed January 2015, Kimley-Horn Prepared: March 2016
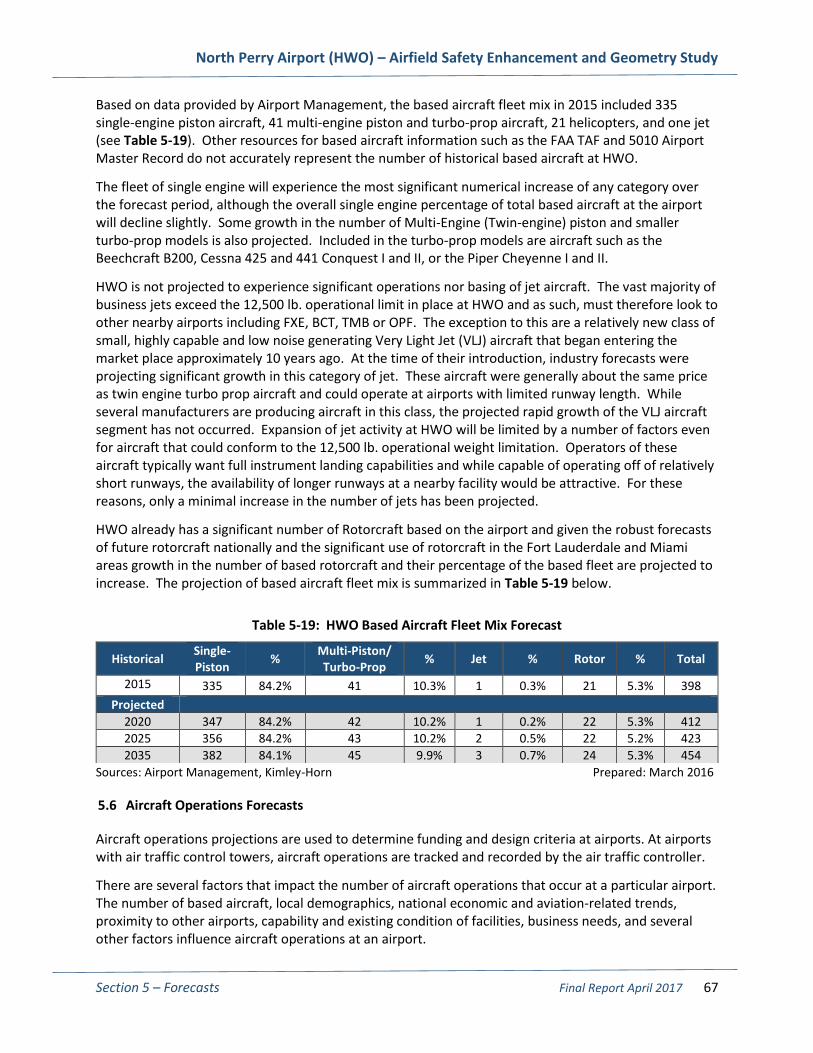
Based Aircraft Fleet Mix Forecast
As with most general aviation airports, the majority of the based aircraft fleet at HWO is composed of single-engine piston aircraft. According to the FAA, the national based aircraft fleet mix in 2015 is anticipated to remain fairly stable with little change through 2035 with one exception. National trends and FAA TAF forecasts indicate strong growth in the number of general aviation jet aircraft in operation in the U.S. through 2035.
In 2015, there was one based jet at HWO, and despite a projected increase in the number of based aircraft at the Airport through 2035, it is anticipated that the composition of the fleet mix will remain generally consistent mix that is evident today. This is primarily due to the fact that the area surrounding HWO is completely developed, which makes any sort of expansion of the Airport’s existing boundaries unlikely. As such, any extensions to existing runways or significant upgrades to instrument approaches are equally unlikely, thus narrowing the types of aircraft that can operate at HWO. Furthermore, the Airport is closed to aircraft over 12,500 lbs. which limits the vast majority of the business jet fleet from operating at HWO. It should be noted that the Airport does experience occasional jet operations, typically by smaller jet type aircraft such as versions of very light jet category such as the HondaJet, and a very limited set of more traditional models such as the Cessna Citation V and Cessna Citation CJ1.
The Dade/Broward County area is currently served by several airports that accommodate larger jets including Fort Lauderdale Executive Airport (FXE), Fort Lauderdale/Hollywood International Airport (FLL), Opa-Locka Executive Airport (OPF), Miami Executive Airport (TMB), Boca Raton Airport (BCT), while Pompano Beach Airpark (PMP) is more similar to HWO, but does accommodate small to mid-size jet models.
North Perry Airport (HWO) – Airfield Safety Enhancement and Geometry Study
Section 5 – Forecasts Final Report April 2017 67
Based on data provided by Airport Management, the based aircraft fleet mix in 2015 included 335 single-engine piston aircraft, 41 multi-engine piston and turbo-prop aircraft, 21 helicopters, and one jet (see Table 5-19). Other resources for based aircraft information such as the FAA TAF and 5010 Airport Master Record do not accurately represent the number of historical based aircraft at HWO.
The fleet of single engine will experience the most significant numerical increase of any category over the forecast period, although the overall single engine percentage of total based aircraft at the airport will decline slightly. Some growth in the number of Multi-Engine (Twin-engine) piston and smaller turbo-prop models is also projected. Included in the turbo-prop models are aircraft such as the Beechcraft B200, Cessna 425 and 441 Conquest I and II, or the Piper Cheyenne I and II.
HWO is not projected to experience significant operations nor basing of jet aircraft. The vast majority of business jets exceed the 12,500 lb. operational limit in place at HWO and as such, must therefore look to other nearby airports including FXE, BCT, TMB or OPF. The exception to this are a relatively new class of small, highly capable and low noise generating Very Light Jet (VLJ) aircraft that began entering the market place approximately 10 years ago. At the time of their introduction, industry forecasts were projecting significant growth in this category of jet. These aircraft were generally about the same price as twin engine turbo prop aircraft and could operate at airports with limited runway length. While several manufacturers are producing aircraft in this class, the projected rapid growth of the VLJ aircraft segment has not occurred. Expansion of jet activity at HWO will be limited by a number of factors even for aircraft that could conform to the 12,500 lb. operational weight limitation. Operators of these aircraft typically want full instrument landing capabilities and while capable of operating off of relatively short runways, the availability of longer runways at a nearby facility would be attractive. For these reasons, only a minimal increase in the number of jets has been projected.
HWO already has a significant number of Rotorcraft based on the airport and given the robust forecasts of future rotorcraft nationally and the significant use of rotorcraft in the Fort Lauderdale and Miami areas growth in the number of based rotorcraft and their percentage of the based fleet are projected to increase. The projection of based aircraft fleet mix is summarized in Table 5-19 below.
Table 5-19: HWO Based Aircraft Fleet Mix Forecast
Sources: Airport Management, Kimley-Horn Prepared: March 2016
5.6 Aircraft Operations Forecasts
Aircraft operations projections are used to determine funding and design criteria at airports. At airports with air traffic control towers, aircraft operations are tracked and recorded by the air traffic controller.
There are several factors that impact the number of aircraft operations that occur at a particular airport. The number of based aircraft, local demographics, national economic and aviation-related trends, proximity to other airports, capability and existing condition of facilities, business needs, and several other factors influence aircraft operations at an airport.
Historical Single-Piston
% Multi-Piston/ Turbo-Prop
% Jet % Rotor % Total
2015 335 84.2% 41 10.3% 1 0.3% 21 5.3% 398
Projected
2020 347 84.2% 42 10.2% 1 0.2% 22 5.3% 412
2025 356 84.2% 43 10.2% 2 0.5% 22 5.2% 423
2035 382 84.1% 45 9.9% 3 0.7% 24 5.3% 454
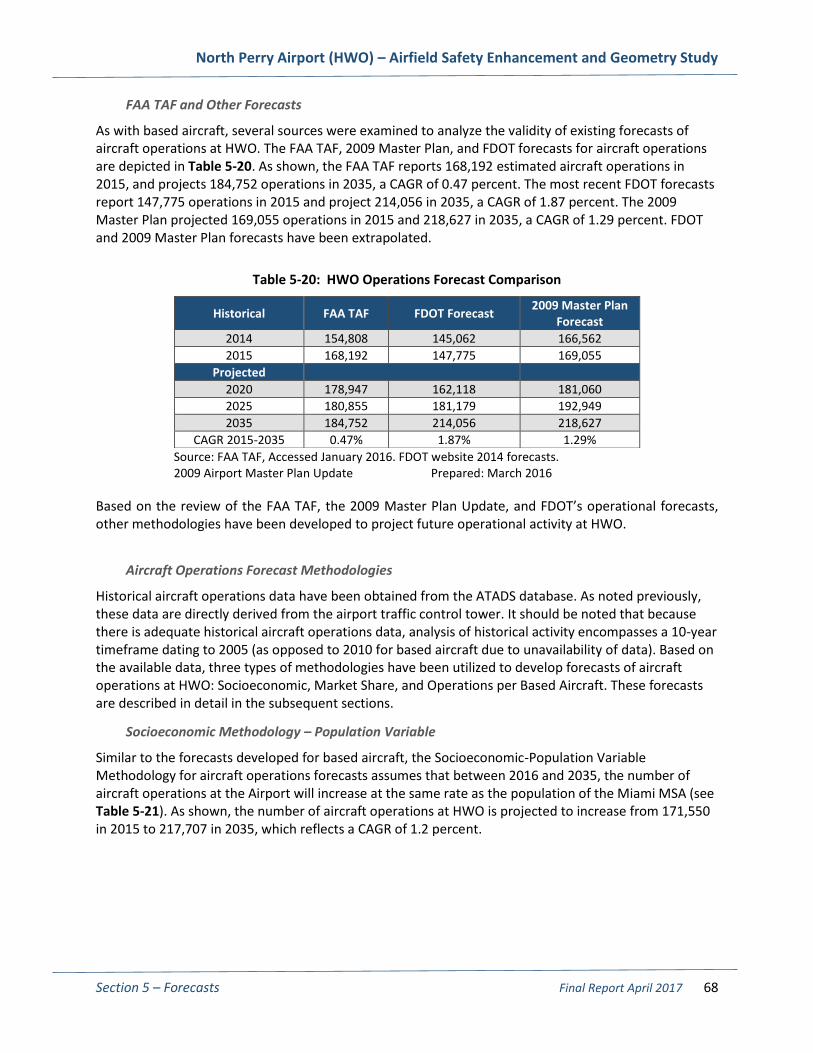
North Perry Airport (HWO) – Airfield Safety Enhancement and Geometry Study
Section 5 – Forecasts Final Report April 2017 68
FAA TAF and Other Forecasts
As with based aircraft, several sources were examined to analyze the validity of existing forecasts of aircraft operations at HWO. The FAA TAF, 2009 Master Plan, and FDOT forecasts for aircraft operations are depicted in Table 5-20. As shown, the FAA TAF reports 168,192 estimated aircraft operations in 2015, and projects 184,752 operations in 2035, a CAGR of 0.47 percent. The most recent FDOT forecasts report 147,775 operations in 2015 and project 214,056 in 2035, a CAGR of 1.87 percent. The 2009 Master Plan projected 169,055 operations in 2015 and 218,627 in 2035, a CAGR of 1.29 percent. FDOT and 2009 Master Plan forecasts have been extrapolated.
Table 5-20: HWO Operations Forecast Comparison
Source: FAA TAF, Accessed January 2016. FDOT website 2014 forecasts. 2009 Airport Master Plan Update Prepared: March 2016
Based on the review of the FAA TAF, the 2009 Master Plan Update, and FDOT’s operational forecasts, other methodologies have been developed to project future operational activity at HWO.
Aircraft Operations Forecast Methodologies
Historical aircraft operations data have been obtained from the ATADS database. As noted previously, these data are directly derived from the airport traffic control tower. It should be noted that because there is adequate historical aircraft operations data, analysis of historical activity encompasses a 10-year timeframe dating to 2005 (as opposed to 2010 for based aircraft due to unavailability of data). Based on the available data, three types of methodologies have been utilized to develop forecasts of aircraft operations at HWO: Socioeconomic, Market Share, and Operations per Based Aircraft. These forecasts are described in detail in the subsequent sections.
Socioeconomic Methodology – Population Variable
Similar to the forecasts developed for based aircraft, the Socioeconomic-Population Variable Methodology for aircraft operations forecasts assumes that between 2016 and 2035, the number of aircraft operations at the Airport will increase at the same rate as the population of the Miami MSA (see Table 5-21). As shown, the number of aircraft operations at HWO is projected to increase from 171,550 in 2015 to 217,707 in 2035, which reflects a CAGR of 1.2 percent.
Historical FAA TAF FDOT Forecast 2009 Master Plan
Forecast
2014 154,808 145,062 166,562
2015 168,192 147,775 169,055
Projected
2020 178,947 162,118 181,060
2025 180,855 181,179 192,949
2035 184,752 214,056 218,627
CAGR 2015-2035 0.47% 1.87% 1.29%

North Perry Airport (HWO) – Airfield Safety Enhancement and Geometry Study
Section 5 – Forecasts Final Report April 2017 69
Table 5-21: HWO Socioeconomic – Population Variable Aircraft Operations Forecast
Sources: Woods and Poole Economics, Inc., Kimley-Horn Prepared: March 2016
Socioeconomic Methodology – Employment Variable
The number of employed individuals in the Miami MSA is anticipated to increase from approximately 3.1 million in 2015 to 4.8 million in 2035, a CAGR of 1.56 percent. The Socioeconomic-Employment Variable Methodology assumes that between 2016 and 2035, the number of based aircraft at HWO will increase at the same rate as the number of employed individuals in the Miami MSA (see Table 5-22). As shown, the number of aircraft operations at HWO is projected to increase from 171,550 in 2015 to 233,595 in 2035, which reflects a 1.56 percent CAGR.
Historical Miami MSA Population
HWO Operations
2005 5,411,000 137,667
2006 5,430,000 164,378
2007 5,423,000 182,190
2008 5,455,000 170,077
2009 5,505,000 162,885
2010 5,582,000 120,322
2011 5,688,000 136,104
2012 5,763,000 127,648
2013 5,828,000 142,399
2014 5,895,000 155,776
2015 5,965,000 171,550
CAGR 2005-2015 0.98% 2.22%
Projected
2020 6,344,000 182,453
2025 6,744,000 193,950
2035 7,570,000 217,707
CAGR 2015-2035 1.20% 1.20%

North Perry Airport (HWO) – Airfield Safety Enhancement and Geometry Study
Section 5 – Forecasts Final Report April 2017 70
Table 5-22: HWO Socioeconomic – Employment Variable Aircraft Operations Forecast
Sources: Woods and Poole Economics, Inc., Kimley-Horn Prepared: March 2016
Socioeconomic Methodology – Per Capita Personal Income Variable
Per capita personal income is examined to project Aircraft operations at the Airport and is shown in Table 5-23. As shown, per capita income in the Miami MSA is anticipated to increase from $43,542 in 2015 to $55,766 in 2035, a CAGR of 1.24 percent. This methodology projects that the number of based aircraft at the Airport will increase at the same rate as per capita income in the Miami MSA. According to the Socioeconomic-Per Capita Personal Income Variable Methodology, the number of aircraft operations at HWO is projected to increase from 171,550 in 2015 to 219,711 in 2035. Per capita data obtained from Woods and Poole is reported in constant dollars (year 2009) to adjust for inflation over time.
Historical Miami MSA
Employment HWO
Operations
2005 3,169 137,667
2006 3,236 164,378
2007 3,306 182,190
2008 3,259 170,077
2009 3,134 162,885
2010 3,142 120,322
2011 3,255 136,104
2012 3,341 127,648
2013 3,419 142,399
2014 3,483 155,776
2015 3,547 171,550
CAGR 2005-2015 1.13% 2.22%
Projected
2020 3,865,000 186,921
2025 4,189,000 202,570
2035 4,830,000 233,595
CAGR 2015-2035 1.56% 1.56%

North Perry Airport (HWO) – Airfield Safety Enhancement and Geometry Study
Section 5 – Forecasts Final Report April 2017 71
Table 5-23: HWO Socioeconomic – Per Capita Personal Income Variable ($2005) Based Aircraft Forecast
Sources: Woods and Poole Economics, Inc., Kimley-Horn Prepared: March 2016
Socioeconomic Methodology – Summary of Results
A summary of the results of the socioeconomic methodologies used to project aircraft operations at the HWO is shown in Table 5-24, including the CAGR for each methodology from 2015 through 2035.
Historical Miami MSA Per Capita Personal Income ($2009)
HWO Operations
2005 42,890 137,667
2006 44,494 164,378
2007 45,252 182,190
2008 44,505 170,077
2009 40,482 162,885
2010 40,874 120,322
2011 41,676 136,104
2012 42,253 127,648
2013 42,277 142,399
2014 42,897 155,776
2015 43,542 171,550
CAGR 2005-2015 0.15% 2.22%
Projected
2020 $46,725 184,091
2025 $50,056 197,214
2035 $55,766 219,711
CAGR 2015-2035 1.24% 1.24%
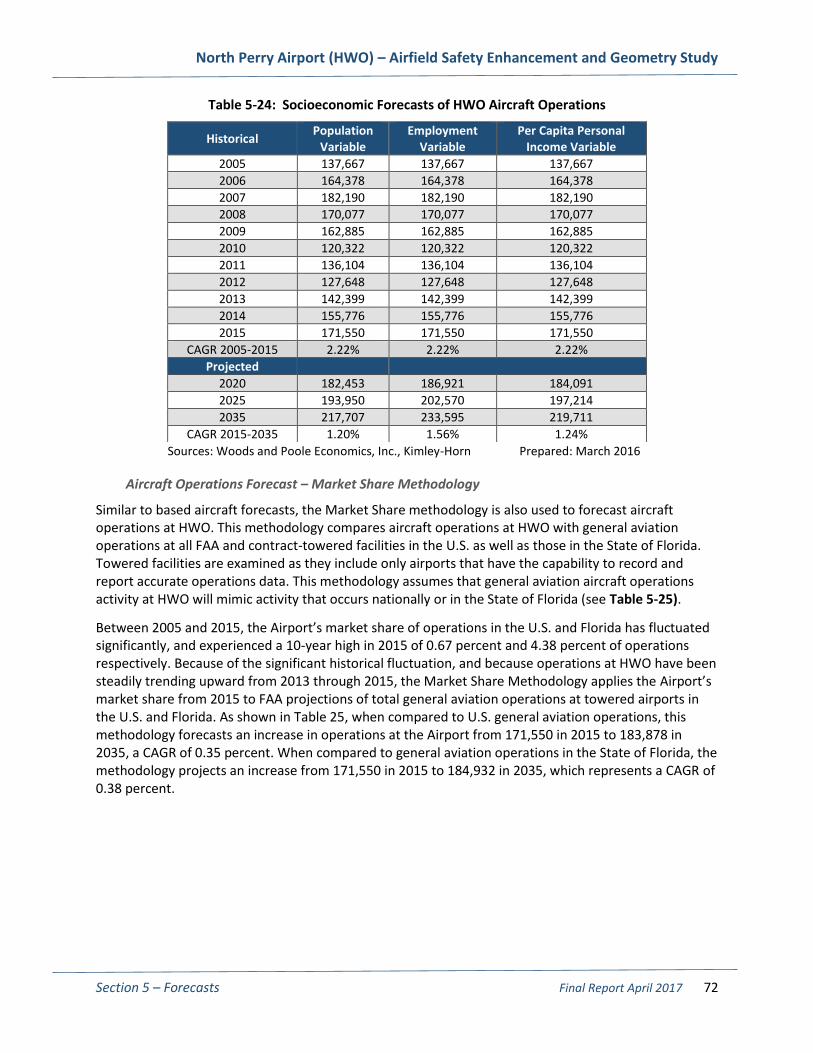
North Perry Airport (HWO) – Airfield Safety Enhancement and Geometry Study
Section 5 – Forecasts Final Report April 2017 72
Table 5-24: Socioeconomic Forecasts of HWO Aircraft Operations
Sources: Woods and Poole Economics, Inc., Kimley-Horn Prepared: March 2016
Aircraft Operations Forecast – Market Share Methodology
Similar to based aircraft forecasts, the Market Share methodology is also used to forecast aircraft operations at HWO. This methodology compares aircraft operations at HWO with general aviation operations at all FAA and contract-towered facilities in the U.S. as well as those in the State of Florida. Towered facilities are examined as they include only airports that have the capability to record and report accurate operations data. This methodology assumes that general aviation aircraft operations activity at HWO will mimic activity that occurs nationally or in the State of Florida (see Table 5-25).
Between 2005 and 2015, the Airport’s market share of operations in the U.S. and Florida has fluctuated significantly, and experienced a 10-year high in 2015 of 0.67 percent and 4.38 percent of operations respectively. Because of the significant historical fluctuation, and because operations at HWO have been steadily trending upward from 2013 through 2015, the Market Share Methodology applies the Airport’s market share from 2015 to FAA projections of total general aviation operations at towered airports in the U.S. and Florida. As shown in Table 25, when compared to U.S. general aviation operations, this methodology forecasts an increase in operations at the Airport from 171,550 in 2015 to 183,878 in 2035, a CAGR of 0.35 percent. When compared to general aviation operations in the State of Florida, the methodology projects an increase from 171,550 in 2015 to 184,932 in 2035, which represents a CAGR of 0.38 percent.
Historical Population
Variable Employment
Variable Per Capita Personal
Income Variable
2005 137,667 137,667 137,667
2006 164,378 164,378 164,378
2007 182,190 182,190 182,190
2008 170,077 170,077 170,077
2009 162,885 162,885 162,885
2010 120,322 120,322 120,322
2011 136,104 136,104 136,104
2012 127,648 127,648 127,648
2013 142,399 142,399 142,399
2014 155,776 155,776 155,776
2015 171,550 171,550 171,550
CAGR 2005-2015 2.22% 2.22% 2.22%
Projected
2020 182,453 186,921 184,091
2025 193,950 202,570 197,214
2035 217,707 233,595 219,711
CAGR 2015-2035 1.20% 1.56% 1.24%

North Perry Airport (HWO) – Airfield Safety Enhancement and Geometry Study
Section 5 – Forecasts Final Report April 2017 73
Table 5-25: HWO Operations – Market Share Methodology
Sources: FAA TAF, Accessed January 2016, Kimley-Horn Prepared: March 2016
Aircraft Operations Forecast – OPBA
The final methodology employed to forecast aircraft operations at HWO is the application of operations per based aircraft (OPBA). This is a commonly used methodology that determines a historical number of aircraft operations at a facility compared with based aircraft and applies that figure to forecasts of based aircraft. Historical and projected based aircraft, operations, and OPBA are shown in Table 5-26.
As shown, aircraft operations, based aircraft, and OPBA all changed significantly between 2010 and 2015. As noted previously, the number of based aircraft has increased in recent years, primarily due to relocation of aircraft from nearby airports. Because of the changing nature of historical activity at HWO, this methodology applies and holds constant the 2015 figure of 431 operations per based aircraft that occurred in 2015 to the preferred methodology based aircraft forecasts. The 431 operations per based aircraft level is in the mid-range of the operational levels experience over the past six years at HWO and reflects both the conditions associated with the slow recovery from the most recent and very deep recession as well as more recent up-tick in economic conditions nationally and locally. The OPBA methodology projects an increase in aircraft operations from 171,550 in 2015 to 195,487 in 2035, which reflects a CAGR of 0.66 percent. In reviewing the projection of future operations it is important to consider the operational fluctuations that routinely occurred over the past 10-years and, frankly, fluctuations in operational activity that go back more than two decades where activity approached the forecast level and then retrenched due to any of a number of external influences.
To illustrate these fluctuations, in 1993 as the nation emerged from an earlier recession, HWO experience a total of 174,992 aircraft operations, however by 1997, even while economic activity had sharply improved, total annual operations had dropped to 114,225. By 2001 activity had exceeded the 1993 level reaching 183,284 annual landings and takeoffs only to drop back to 134,581 operations two years later. This will likely be the pattern in the future as recessions will occur, recoveries will follow and unforeseeable other factors will come into play. Taking into considerations these past trends and
Historical U.S. GA
ATCT Operations
HWO Market Share
HWO Operations
FL GA ATCT Operations
HWO Market Share
HWO Operations
2005 36,210,946 0.38% 137,667 4,913,642 2.80% 137,667
2006 35,130,806 0.47% 164,378 4,703,108 3.50% 164,378
2007 34,925,153 0.52% 182,190 4,797,479 3.80% 182,190
2008 32,690,844 0.52% 170,077 4,607,077 3.69% 170,077
2009 28,861,853 0.56% 162,885 4,133,835 3.94% 162,885
2010 27,129,042 0.44% 120,322 3,639,767 3.31% 120,322
2011 26,333,702 0.52% 136,104 3,754,589 3.63% 136,104
2012 26,302,962 0.49% 127,648 3,849,048 3.32% 127,648
2013 25,925,725 0.55% 142,399 3,921,724 3.63% 142,399
2014 25,654,036 0.61% 155,776 3,906,328 3.99% 155,776
2015 25,578,216 0.67% 171,550 3,918,297 4.38% 171,550
Projected
2020 26,025,752 0.67% 174,552 4,000,278 4.38% 175,139
2025 26,472,894 0.67% 177,550 4,072,617 4.38% 178,306
2035 27,416,314 0.67% 183,878 4,223,957 4.38% 184,932
CAGR 2015-2035 0.35% 0.35% 0.38% 0.38%

North Perry Airport (HWO) – Airfield Safety Enhancement and Geometry Study
Section 5 – Forecasts Final Report April 2017 74
factoring in characteristics of HWO and competing airports the use of the FAA growth rate was determined to represent a realistic basis for projecting future operational activity.
Table 5-26: HWO Operations per Based Aircraft Forecast Methodology
Sources: FAA TAF Accessed January 2016, Kimley-Horn Prepared: March 2016
Aircraft Operations Forecast – Preferred Methodology
Six different methodologies have been developed for forecasts of aircraft operations at HWO (see Figure 5-3. Similar to historical based aircraft activity, the number of aircraft operations at HWO have fluctuated significantly in recent years. Volatility in the U.S. economy, increasing costs of aircraft fuel and maintenance, a recent upswing in based aircraft at the Airport and other factors have all impacted aircraft operations locally. Some of these factors can be accounted for when cross examined with local socioeconomic data and the Airport’s market share of operations compared with the State of Florida and the U.S., but a strong correlation cannot be made. The Operations per Based Aircraft methodology incorporates activity levels that are current and pairs them with a projected growth rate that is equal to the FAA’s forecasts of based aircraft. As such, it is estimated that this is the most accurate portrayal of future activity and is selected as the preferred methodology for aircraft operations at HWO. These data will be used in subsequent sections of this chapter and are recommended for planning purposes.
Historical Aircraft
Operations Based Aircraft
Operations per Based Aircraft
2010 120,322 245 491
2011 136,104 276 494
2012 127,648 306 417
2013 142,399 337 423
2014 155,776 367 424
2015 171,550 398 431
CAGR 2010-2015 7.35% 10.19% -2.58%
Projected
2020 177,534 412 431
2025 182,189 423 431
2035 195,487 454 431
CAGR 2015-2035 0.66% 0.66% 0.00%

North Perry Airport (HWO) – Airfield Safety Enhancement and Geometry Study
Section 5 – Forecasts Final Report April 2017 75
Figure 5-3: HWO Aircraft Operations Forecast – Summary
Sources: Woods and Poole Economics, Inc., FAA TAF, Accessed January 2015, Kimley-Horn Prepared: March 2016
Aircraft Operations Forecast – Local/Itinerant Operations
According to the FAA, local operations are defined as those conducted by aircraft that operate in the local traffic pattern or within sight of the Airport; are known to be departing for, or arriving from, flight in local practice areas located within a 20-mile radius of the Airport; or execute simulated instrument approaches or low passes at the Airport. Itinerant operations are all aircraft operations other than local operations. As noted previously, HWO experiences regular business and leisure itinerant aircraft operations as well as operations to international destinations, particularly in the Caribbean.
According to the ATADS database, between 2005 and 2015, the percentage of annual itinerant operations fluctuated between 33.8 percent and 39.9 percent, and the average percentage of annual itinerant operations during that time was 35.9 percent. Because of this historical fluctuation, the 10-year average from 2005-2015 is applied to projected levels of future operations and held constant through 2013 (see Table 5-27).

North Perry Airport (HWO) – Airfield Safety Enhancement and Geometry Study
Section 5 – Forecasts Final Report April 2017 76
Table 5-27: HWO Operations Forecast – Local/Itinerant Operations
Sources: ATADS database Accessed January 2016, Kimley-Horn. Prepared: March 2016
As shown, this methodology projects an increase in local aircraft operations from 112,664 in 2015 to 125,314 in 2035, which reflects a CAGR of 0.53 percent. Itinerant aircraft operations are projected to increase from 58,886 in 2015 to 70,174 in 2035, a CAGR of 0.88 percent.
Aircraft Operations Forecast – Daytime/Evening Operations
Another component of this document is development of forecasts of daytime/evening operations. This is an important element to include as noise impacts created by aircraft arriving or departing at night are greater than during the day.
Flight-specific operations data were obtained from the airport traffic control tower and the FAA Traffic Flow Management System (TFMSC) from the Aircraft Situation Display to Industry (or ASDI) data. The ASDI data feed includes messages entered into the TFMS from the National Airspace System (NAS). These messages include aircraft departures, arrivals, tracking information, and flight management information.
According to data obtained by TFMSC, the percentage of nighttime operations (defined by the FAA as 10:00PM to 7:00AM) has fluctuated between 2005 and 2015. As such, the 10-year historical average of 5.5 percent nighttime operations is applied to total projected aircraft operations and held constant throughout the projection period (see Table 5-28).
Historical Total
Operations Local
Operations % Local
Ops Itinerant
Operations % Itinerant
Ops
2005 137,667 86,380 62.7% 51,287 37.3%
2006 164,378 106,770 65.0% 57,608 35.0%
2007 182,190 120,682 66.2% 61,508 33.8%
2008 170,077 110,084 64.7% 59,993 35.3%
2009 162,885 105,326 64.7% 57,559 35.3%
2010 120,322 72,297 60.1% 48,025 39.9%
2011 136,104 85,419 62.8% 50,685 37.2%
2012 127,648 79,834 62.5% 47,814 37.5%
2013 142,399 92,015 64.6% 50,384 35.4%
2014 155,776 103,010 66.1% 52,766 33.9%
2015 171,550 112,664 65.7% 58,886 34.3%
Average 2005-2015 64.1% 35.9%
Projected
2020 177,534 113,805 64.1% 63,729 35.9%
2025 182,189 116,789 64.1% 65,400 35.9%
2035 195,487 125,314 64.1% 70,174 35.9%
CAGR 2015-2035 0.66% 0.53% 0.88%

North Perry Airport (HWO) – Airfield Safety Enhancement and Geometry Study
Section 5 – Forecasts Final Report April 2017 77
Table 5-28: HWO Operations Forecast – Daytime/Evening Operations
Sources: ATADS database Accessed January 2016, Kimley-Horn. Prepared: March 2016
As shown, this methodology projects an increase in daytime operations from 165,803 in 2015 to 184,709 in 2035, which reflects a CAGR of 0.54 percent. Nighttime operations are projected to increase from 5,747 in 2015 to 10,778 in 2035, a CAGR of 3.19 percent.
Aircraft Operations Forecast – Commuter/Air Taxi Operations
An air taxi operator conducts operations in an aircraft with 30 or fewer passenger for hire or compensation. An air taxi operator operates on-demand and does not have the flight scheduled qualifications of a commuter. A commuter air carrier is designated as any air taxi operator which performs at least five roundtrips per week between two or more points and publishes flight schedules which specify the times, days of the week.
Historical commuter/air taxi data have been obtained from the ATADS database. Historically, HWO has not received a significant proportion of Commuter/Air Taxi Operations. As such, the FAA TAF is used to project future Commuter/Air Taxi operations (see Table 5-29). As shown, the TAF projects 220 commuter/air taxi operations annually throughout the projection period.
Historical Total
Operations Daytime
Operations %
Daytime Evening
Operations % Evening
2005 137,667 129,132 93.8% 8,535 6.2%
2006 164,378 156,981 95.5% 7,397 4.5%
2007 182,190 173,991 95.5% 8,199 4.5%
2008 170,077 159,702 93.9% 10,375 6.1%
2009 162,885 152,460 93.6% 10,425 6.4%
2010 120,322 114,547 95.2% 5,775 4.8%
2011 136,104 123,446 90.7% 12,658 9.3%
2012 127,648 120,755 94.6% 6,893 5.4%
2013 142,399 133,428 93.7% 8,971 6.3%
2014 155,776 149,857 96.2% 5,919 3.8%
2015 171,550 165,803 96.7% 5,747 3.4%
Average 2005-2015 94.5% 5.5%
Projected
2020 177,534 167,746 94.5% 9,789 5.5%
2025 182,189 172,144 94.5% 10,045 5.5%
2035 195,487 184,709 94.5% 10,778 5.5%
CAGR 2015-2035 0.66% 0.54% 3.19%

North Perry Airport (HWO) – Airfield Safety Enhancement and Geometry Study
Section 5 – Forecasts Final Report April 2017 78
Table 5-29: HWO Commuter/Air Taxi Operations Forecast
Sources: FAA TAF Accessed January 2016, ATADS database Accessed January 2016. Kimley-Horn Prepared: March 2016
Aircraft Operations Forecast – Military Operations
Military operations at general aviation airports tend to fluctuate based on escalation or de-escalation of military engagement activity and training requirements. Unless an airport has a joint agreement with a specific military branch or outfit, operations tend to be intermittent. Historical military operations data have been obtained from the ATADS database. HWO experiences relatively minimal military activity (see Table 5-30). As such, the FAA TAF is used to project future military operations. As shown, the TAF projects 89 annual military operations throughout the projection period.
Historical Total
Operations Commuter/Air
Taxi Operations % Commuter/Air Taxi
Operations
2005 137,667 6 0.0%
2006 164,378 4 0.0%
2007 182,190 0 0.0%
2008 170,077 5 0.0%
2009 162,885 50 0.0%
2010 120,322 92 0.1%
2011 136,104 457 0.3%
2012 127,648 93 0.1%
2013 142,399 224 0.2%
2014 155,776 230 0.1%
2015 171,550 210 0.1%
CAGR 2005-2015 2.22% 42.69%
Projected
2020 177,534 220 0.1%
2025 182,189 220 0.1%
2035 195,487 220 0.1%
CAGR 2015-2035 0.66% 0.23%

North Perry Airport (HWO) – Airfield Safety Enhancement and Geometry Study
Section 5 – Forecasts Final Report April 2017 79
Table 5-30: HWO Military Operations Forecast
Sources: FAA TAF Accessed January 2016, ATADS database Accessed January 2016. Kimley-Horn Prepared: March 2016
Aircraft Operations Forecast – Operational Fleet Mix
Operational fleet mix projections identify the type of aircraft that currently operate and are anticipated to operate at HWO. These forecasts are calculated based on data obtained from the airport traffic control tower and TFMSC data. 2015 Data include total operations by aircraft type (excluding overflights). Professional judgement was applied to the historic split of operations to account for the moving of Socata Aircraft service from HWO (manufacturer of the TBM 750 & 800 single-engine turbo-prop aircraft) and the recent growth in helicopter training and sightseeing flights. Similar to the based aircraft fleet mix, the operational fleet mix is not anticipated to change significantly in the future. As such, the proportions of aircraft operations by aircraft type are held constant throughout the projection period (see Table 5-31).
Table 5-31: HWO Total Operational Fleet Mix Forecast
Sources: TFMSC Database Accessed January 2015, Kimley-Horn Prepared: March 2016
Historical Total
Operations Military
Operations % Military Operations
2005 137,667 41 0.1%
2006 164,378 245 0.1%
2007 182,190 140 0.1%
2008 170,077 194 0.1%
2009 162,885 1,126 0.7%
2010 120,322 317 0.3%
2011 136,104 433 0.3%
2012 127,648 43 0.1%
2013 142,399 99 0.1%
2014 155,776 99 0.1%
2015 171,550 87 0.1%
CAGR 2005-2015 2.22% 7.81%
Projected
2020 177,534 89 0.1%
2025 182,189 89 0.1%
2035 195,487 89 0.1%
CAGR 2015-2035 0.66% 0.11%
Year Total
Operations
Single-Engine Piston
Multi-Engine Piston
Jet Helicop,70ter Single Turbo Multi-Turbo
Ops % Ops % Ops % Ops % Ops % Ops %
2015 171,550 142524 83.1% 17,327 10.1% 446 0.3% 2,505 1.5% 6,313 3.7% 2,436 1.4%
Projected
2020 177,534 147,495 83.1% 17,931 10.1% 462 0.3% 2,592 1.5% 6,533 3.7% 2,521 1.4%
2025 182,189 151,362 83.1% 18,401 10.1% 474 0.3% 2,660 1.5% 6,705 3.7% 2,681 1.4%
2035 195,487 162,411 83.1% 19,744 10.1% 508 0.3% 2,854 1.5% 7,194 3.7% 2,776 1.4%
CAGR 2015-2035
0.66% 0.66% 0.66% 0.66% 0.66% 0.66% 0.66%
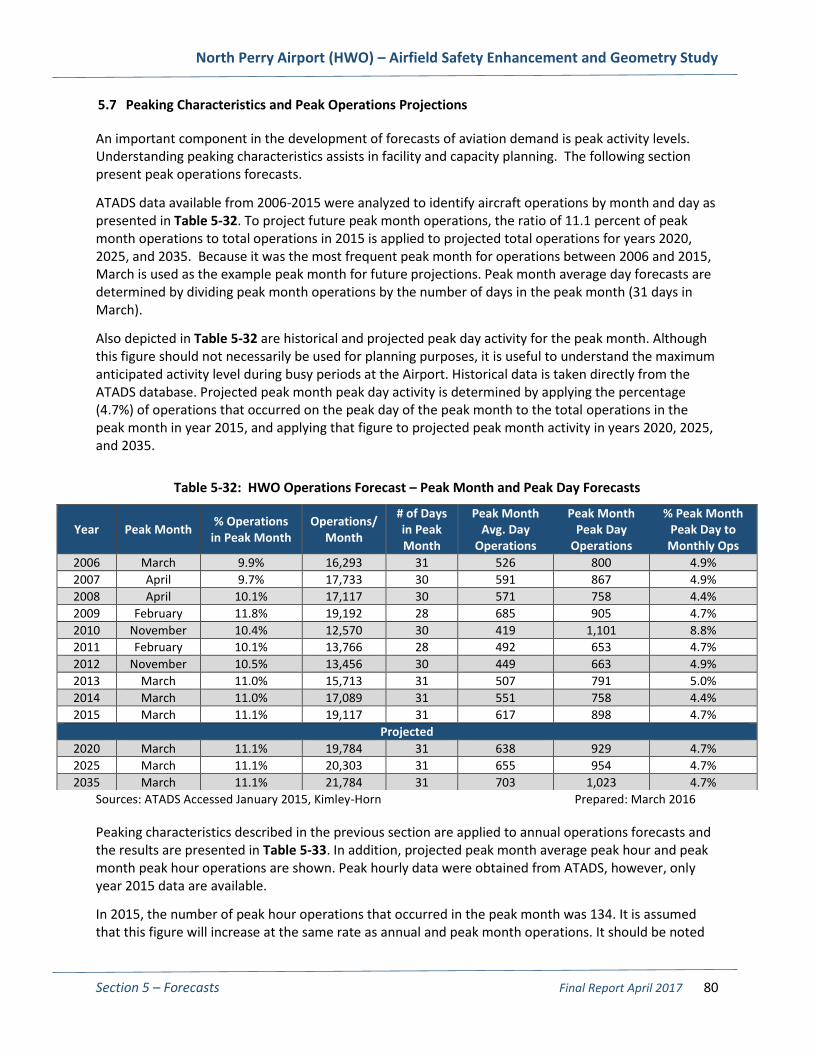
North Perry Airport (HWO) – Airfield Safety Enhancement and Geometry Study
Section 5 – Forecasts Final Report April 2017 80
5.7 Peaking Characteristics and Peak Operations Projections
An important component in the development of forecasts of aviation demand is peak activity levels. Understanding peaking characteristics assists in facility and capacity planning. The following section present peak operations forecasts.
ATADS data available from 2006-2015 were analyzed to identify aircraft operations by month and day as presented in Table 5-32. To project future peak month operations, the ratio of 11.1 percent of peak month operations to total operations in 2015 is applied to projected total operations for years 2020, 2025, and 2035. Because it was the most frequent peak month for operations between 2006 and 2015, March is used as the example peak month for future projections. Peak month average day forecasts are determined by dividing peak month operations by the number of days in the peak month (31 days in March).
Also depicted in Table 5-32 are historical and projected peak day activity for the peak month. Although this figure should not necessarily be used for planning purposes, it is useful to understand the maximum anticipated activity level during busy periods at the Airport. Historical data is taken directly from the ATADS database. Projected peak month peak day activity is determined by applying the percentage (4.7%) of operations that occurred on the peak day of the peak month to the total operations in the peak month in year 2015, and applying that figure to projected peak month activity in years 2020, 2025, and 2035.
Table 5-32: HWO Operations Forecast – Peak Month and Peak Day Forecasts
Sources: ATADS Accessed January 2015, Kimley-Horn Prepared: March 2016
Peaking characteristics described in the previous section are applied to annual operations forecasts and the results are presented in Table 5-33. In addition, projected peak month average peak hour and peak month peak hour operations are shown. Peak hourly data were obtained from ATADS, however, only year 2015 data are available.
In 2015, the number of peak hour operations that occurred in the peak month was 134. It is assumed that this figure will increase at the same rate as annual and peak month operations. It should be noted
Year Peak Month % Operations
in Peak Month Operations/
Month
# of Days in Peak Month
Peak Month Avg. Day
Operations
Peak Month Peak Day
Operations
% Peak Month Peak Day to
Monthly Ops
2006 March 9.9% 16,293 31 526 800 4.9%
2007 April 9.7% 17,733 30 591 867 4.9%
2008 April 10.1% 17,117 30 571 758 4.4%
2009 February 11.8% 19,192 28 685 905 4.7%
2010 November 10.4% 12,570 30 419 1,101 8.8%
2011 February 10.1% 13,766 28 492 653 4.7%
2012 November 10.5% 13,456 30 449 663 4.9%
2013 March 11.0% 15,713 31 507 791 5.0%
2014 March 11.0% 17,089 31 551 758 4.4%
2015 March 11.1% 19,117 31 617 898 4.7%
Projected
2020 March 11.1% 19,784 31 638 929 4.7%
2025 March 11.1% 20,303 31 655 954 4.7%
2035 March 11.1% 21,784 31 703 1,023 4.7%

North Perry Airport (HWO) – Airfield Safety Enhancement and Geometry Study
Section 5 – Forecasts Final Report April 2017 81
that this figure should not necessarily be used as a planning benchmark, but rather, a general indication of the maximum amount of activity the HWO may experience in an hourly timeframe.
Peak month average peak hour operations projections provide a more reasonable figure of regular heightened activity that occurs at the Airport and this figure is more appropriate for planning purposes. Peak month average peak hour projections for 2015 were determined averaging peak hour operations for each day during the peak month (March). It is estimated that peak month average peak hour operations will continue to grow at the same rate as annual and peak month operations.
Table 5-33: HWO Peak Operations Forecast
Sources: ATADS, Kimley-Horn Prepared: March 2016
5.8 Forecast Summary
It is anticipated that HWO will see steady growth in based aircraft and annual aircraft operations throughout the 20-year projection period. This growth is propelled by an improving local economy, growing population base, strong tourism market, and the fact that HWO has ample facilities and available land to accommodate growth in general aviation traffic. While the general aviation industry has struggled in recent years faced with fluctuating fuel prices and a volatile national economy, the Miami area is home to large local employment centers and has significant transient aircraft activity. Summaries of projections of aviation demand are presented in Table 5-34.
Table 5-34: Summary of HWO Forecasts
Sources: Kimley-Horn Prepared: March 2016
Historical 2015
Projected
2020 2025 2035
Annual Operations 171,550 177,534 182,189 195,487
Peak Month Operations 19,117 19,784 20,303 21,784
Peak Month Avg. Day Operations 617 638 655 703
Peak Month Avg. Peak Hour Operations
99 102 105 113
Peak Month Peak Hour Operations 134 139 142 153
Category 2015
Projected
2020 2025 2035
Total Aircraft Operations 171,550 177,534 182,189 195,487
Itinerant 58,886 63,729 65,400 70,174
Local 112,664 113,805 116,789 125,314
Total Based Aircraft 398 412 423 454
Single-Engine Piston 335 347 356 382
Multi-Engine Piston 41 42 43 45
Jet 1 1 2 3
Helicopter 21 22 22 24

North Perry Airport (HWO) – Airfield Safety Enhancement and Geometry Study
Section 5 – Forecasts Final Report April 2017 82
5.9 FAA Forecast Review and Approval
FAA Airport District Offices (ADOs) or Regional Airports Divisions are responsible for forecast approvals. When reviewing a sponsor’s forecast, FAA must ensure that the forecast is based on reasonable planning assumptions, uses current data, and is developed using appropriate forecast methods. Additional discussion on assumptions, data and methodologies can be found in the APO report “Forecasting Aviation Activity by Airport.” After a thorough review of the forecast, FAA then determines if the forecast is consistent with the TAF.
For all classes of airports, forecasts for total enplanements, based aircraft, and total operations are considered consistent with the TAF if they meet the following criterion: Forecasts differ by less than 10 percent in the 5-year forecast period, and 15 percent in the 10-year forecast period.
If the forecast is not consistent with the TAF, differences must be resolved if the forecast is to be used in FAA decision-making. This may involve revisions to the airport sponsor’s submitted forecasts, adjustments to the TAF, or both. A comparison of forecasts of aviation compared with TAF forecasts are presented in Table 5-35. As shown, and as noted previously, there is a significant difference between the number of based aircraft reported in the FAA TAF for 2015 and what was reported by the Airport.

North Perry Airport (HWO) – Airfield Safety Enhancement and Geometry Study
Section 5 – Forecasts Final Report April 2017 83
Table 5-35: North Perry Airport FAA TAF Comparison
Sources: FAA TAF, Issued January 2016, Kimley-Horn Prepared: March 2016
Based Aircraft Year HWO
Forecast TAF
Forecast HWO/TAF % Difference
Base yr. 2015 398 258 54.3%
Projected
Base yr. + 5 2020 412 267 54.3%
Base yr. + 10 2025 423 274 54.3%
Base yr. + 20 2035 454 294 54.3%
Itinerant Operations Year HWO
Forecast TAF
Forecast HWO/TAF % Difference
Base yr. 2015 58,886 57,642 2.2%
Projected
Base yr. + 5 2020 63,729 60,472 5.4%
Base yr. + 10 2025 65,400 60,592 7.9%
Base yr. + 20 2035 70,174 60,832 15.4%
Local Operations Year HWO
Forecast TAF
Forecast HWO/TAF % Difference
Base yr. 2015 112,664 110,550 1.9%
Projected
Base yr. + 5 2020 113,805 118,419 -3.9%
Base yr. + 10 2025 116,789 120,207 -2.8%
Base yr. + 20 2035 125,314 123,864 1.2%
Total Operations Year HWO
Forecast TAF
Forecast HWO/TAF % Difference
Base yr. 2015 171,550 168,192 2.0%
Projected
Base yr. + 5 2020 177,534 178,947 -0.8%
Base yr. + 10 2025 182,189 180,855 0.7%
Base yr. + 20 2035 195,487 184,752 5.8%

Appendix B Based Aircraft Determination
(Derived from physical inventory performed March 2016)

North Perry Airport (HWO) – Airfield Safety Enhancement and Geometry Study
Appendix B – Based Aircraft Determination October 2016 1
APPENDIX B: BASED AIRCRAFT DETERMINATION
The Broward County Aviation Department (BCAD) is the owner and operator of two airports consistingof Fort Lauderdale Hollywood International Airport (FLL) and North Perry Airport (HWO). North PerryAirport is managed by an on-airport professional Airport Manager with supporting professional andoperations personnel who are responsible for the operation of the airport. The management staff atHWO maintain records of all hangar leases on the airport and also develop an updated count of basedtenants on a scheduled basis in conjunction with facility inspections conducted by the Broward CountyFire Department to ensure conformity with County fire codes. The process used in the based aircraftcount involves the following activities.
1. HWO senior staff coordinate with Broward County Fire Department inspectors and with eachairport tenant to access each conventional hangar and T-hangar unit on the airport for required fireinspections. During these inspections, senior BCAD staff verify occupancy of each hangar or hangar unitand collects the aircraft registration number for comparison against tenant lease information to confirmthe basing status of the aircraft in the hangar. These inspections occur for all T-hangars and basedbusiness tenants including accounting for the aircraft fleets associated with Aerial Banners, Inc., VanWagner Aerial Media, the Florida Aero Club, three separate air tour operators, multiple flight schools,and other tenants. Aircraft are identified by N-number and are them compared against airport recordsand those of the major FBO and commercial tenants to establish that they meet based aircraft criteria.
2. BCAD management staff coordinated with Fixed Base Operators (FBOs) to derive aircraft thatare based in FBO conventional hangars also by N-number along with those aircraft based on leasedtiedown spaces and other aircraft parking positions within FBO leaseholds with the exception of thoseusing spaces for short or seasonal durations. Information was derived from FBO records and as notedwas defined by aircraft type and by aircraft registration.
3. BCAD management coordinated with the Broward Community College and obtained a listing oftheir operational aircraft based at HWO as a part of their flight training activities and that are routinelyoperated at HWO.
Given the steps noted above, HWO senior management identified the following aircraft by registrationnumber and by aircraft type as being based at North Perry Airport.
RegistrationNumber
Aircraft Type RegistrationNumber
Aircraft Type
N477MM RW162F N2307L BE-23N247LP R-44 N3685R PA-28-180N674RG R-22 N277SM PA-28-236N468AB Mosquito N32490 PA-28-151N83U Bell 206 N2434T C-172RC-GGLM Bell 206 N25476 C-152Chopper 7 Bell 206 N6132P C-152Chopper 10 Bell 206 N32171 PA-28-180
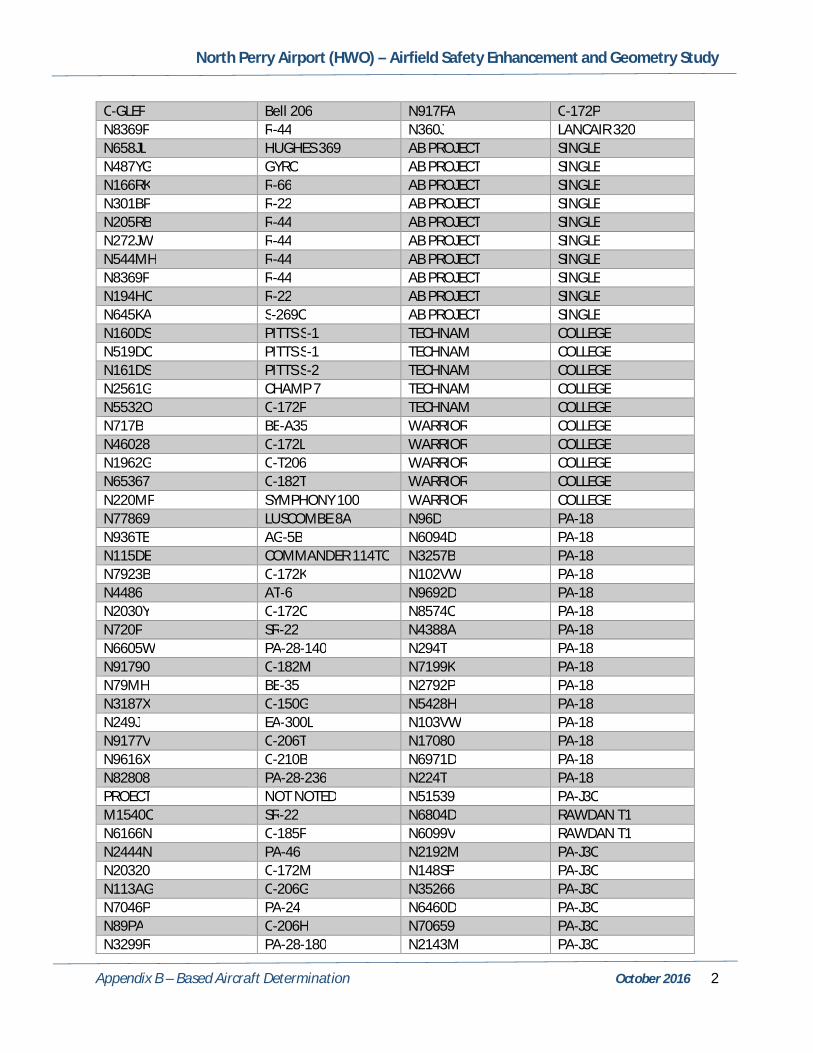
North Perry Airport (HWO) – Airfield Safety Enhancement and Geometry Study
Appendix B – Based Aircraft Determination October 2016 2
C-GLEF Bell 206 N917FA C-172PN8369F R-44 N360J LANCAIR 320N658JL HUGHES 369 AB PROJECT SINGLEN487YG GYRO AB PROJECT SINGLEN166RK R-66 AB PROJECT SINGLEN301BP R-22 AB PROJECT SINGLEN205RB R-44 AB PROJECT SINGLEN272JW R-44 AB PROJECT SINGLEN544MH R-44 AB PROJECT SINGLEN8369F R-44 AB PROJECT SINGLEN194HC R-22 AB PROJECT SINGLEN645KA S-269C AB PROJECT SINGLEN160DS PITTS S-1 TECHNAM COLLEGEN519DC PITTS S-1 TECHNAM COLLEGEN161DS PITTS S-2 TECHNAM COLLEGEN2561G CHAMP 7 TECHNAM COLLEGEN5532O C-172P TECHNAM COLLEGEN717B BE-A35 WARRIOR COLLEGEN46028 C-172L WARRIOR COLLEGEN1962G C-T206 WARRIOR COLLEGEN65367 C-182T WARRIOR COLLEGEN220MF SYMPHONY 100 WARRIOR COLLEGEN77869 LUSCOMBE 8A N96D PA-18N936TE AG-5B N6094D PA-18N115DE COMMANDER 114TC N3257B PA-18N7923B C-172K N102VW PA-18N4486 AT-6 N9692D PA-18N2030Y C-172C N8574C PA-18N720P SR-22 N4388A PA-18N6605W PA-28-140 N294T PA-18N91790 C-182M N7199K PA-18N79MH BE-35 N2792P PA-18N3187X C-150G N5428H PA-18N249J EA-300L N103VW PA-18N9177V C-206T N17080 PA-18N9616X C-210B N6971D PA-18N82808 PA-28-236 N224T PA-18PROECT NOT NOTED N51539 PA-J3CM1540C SR-22 N6804D RAWDAN T1N6166N C-185F N6099V RAWDAN T1N2444N PA-46 N2192M PA-J3CN20320 C-172M N148SP PA-J3CN113AG C-206G N35266 PA-J3CN7046P PA-24 N6460D PA-J3CN89PA C-206H N70659 PA-J3CN3299R PA-28-180 N2143M PA-J3C

North Perry Airport (HWO) – Airfield Safety Enhancement and Geometry Study
Appendix B – Based Aircraft Determination October 2016 3
N79089 C-172K N3666K PA-J3CN2926 HARMON ROCKET N42183 PA-J3CN353W C-150M N7510H P-12N18XP RV-6A N3793M P-12N234CZ SR-22 N35288 PA-J5AN2PE LANCAIR 360 N41236 PA-J5AN67PN PITTS S-2 N33180 PA-J5AN293DM RV-7 N40718 PA-28-140N382WM LANCEAIR 320 N409FP DA-40FN463C SR-22 N53095 C-172SN5810Q M-20K N8752C PA-28-140N707DP C-206H N4830G C-172NN53095 C-172S N804ND PA-28R-201N789PB GLASSAIR 3 N7830V M-20EN72972 C-140 N1801E BE-C23N3999Z PA-18-150 N9915B C-172RGN6727V BE-36TC C-FRNN PA-28-151N1506P PA-22 N2027G C-182AN100NT RV-6A N20PG PA-28-140N2214V PA-28-201 N67MS C-172SLONG EZ PROJECT NOT NOTED N211PP C-O1AN4989L PA-28-180 N169AB PA-25-260N387DS DA-40 N6319Z PA-25N91714 NAVION N1154W C-172SN162CS C-182S N7172V M-20CN1602P PA-22 N1302Y CH601XL SLSAN1779M C-182P N40793 C-172CN972Q BE-P35 N28786 C-172MN965TB TB-20 N4534J AA-5BN388ES C-172R N5237T PA-28R-180N692HM RV-6 N2911G PA-28-140N132HM C-R182 N75820 PA-28-161N9166J PA-28-180 N6344R C-172NN5186Z PA-22 N96729 PA-28-140N17JF COMMANDER-114 N953B C-172PN31605 PA-18 N2639O C-152N480562 LUSCOMBE N149T AA-5AN9280K PA-46 N56617 C-182RN432EM KITFOX N3493W PA-28-140C-GOZO SR-22 C-GPHT NOT NOTEDN313AB LANCEAIR 300 N4918L PA-28-180N408LW PA-28-161 N719LC C-182N260SJ PITTS S-2 N728JG BE-B33N9092R CULKEY COUGAR N2107D PA-28-161N7ER VARI-EZ N7585G C-172LN735Q C-182Q N36445 PA-32RT-300

North Perry Airport (HWO) – Airfield Safety Enhancement and Geometry Study
Appendix B – Based Aircraft Determination October 2016 4
N5212X C-172S N7117T C-172N9461V M-20C N9482C PA-28-161N57673 DECATHALON N5736V BE-V35N8173H PA-28-236 N6804C RAWDON T1N4762J BE A-23-19 N1393U C-172MN998JG B-36TC N3999V C-R172KN373SC SPORTCRUISER N3822W PA-32-260C-GGKM TB-20 N3636Y C-210CN179TW BELANCA 17 N723G C-172NN8206P PA-24-250 N152WP FK 9 MARK IVN5736V BE V35 N3551Z PA-22-160PROJECT NOT NOTED N9659L AA-5N8680U C-172F N7551G C-172LN22BY BE-S35 N627FL PA-28-140N72884 C-172M N193WT SR 20N5453L AA-5 N5630R C-172FN81AV TB-20 N12936 C-172MN7036D PA—22-150 N9741U AA-5AN32337 PA-28-150 N3211L BE-23N26103 AA-5A C-GCEE NOT NOTEDN2537C C170B N5566U PA-28-140N3025G AIRCOUPE C-GNOY NOT NOTEDN5894L AA-5 N3086S C-172LN9840W PA-28-140 N5990E C-172NN273F PA-32-300 N5106W PA-28-160N28805 AA-5B N75293 PA-28R-200N8331U PA-32R-301T N4327E PA-28-112N7061Q C-172L N44302 PA-28-151N21774 C-172M N5974U PA-28-140N4011U C-150E N1208X M-20CN80213 C-172M N201HM M-20JN15684 PA-28R-200 N4477U C-150DN9721J PA-28-180 N6840N M-20CN35122 C-177B N316AP PA-32R-300N9285J PA-28-180 N99344 C-172PN177PH C-177RG N64238 C-172MN9466J PA-28-180 N66213 C-172PN34289 C-177B N63263 C-150MN5787L AA-1 N4248T PA-28-180N4208G C-172N N47929 PA-28-161N423FL PA-28-140 N5763E C-172NN6000R C-172G N209MM C-172PN737VT C-TR182 N131FR C-172PN5675B C-182 N8199X C-172BN66WM PA-32-300 N8PS PA-24N39TF BE-F33A N29021 PA-28RT-201
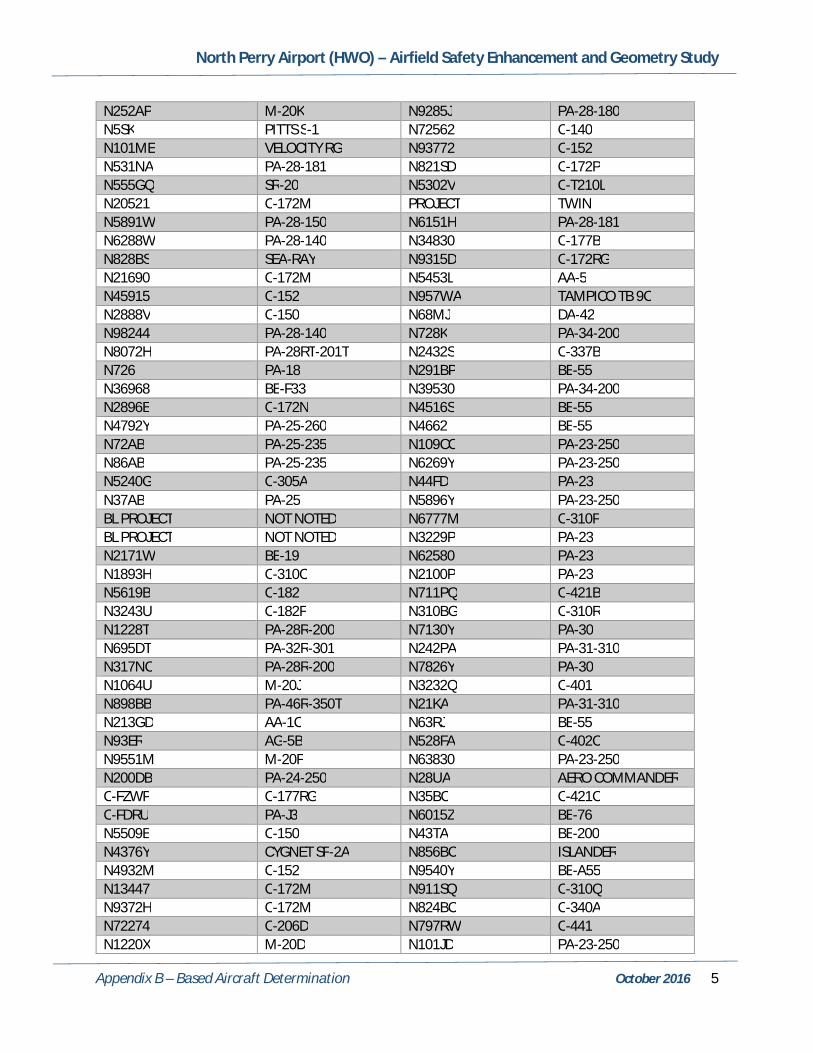
North Perry Airport (HWO) – Airfield Safety Enhancement and Geometry Study
Appendix B – Based Aircraft Determination October 2016 5
N252AP M-20K N9285J PA-28-180N5SK PITTS S-1 N72562 C-140N101ME VELOCITY RG N93772 C-152N531NA PA-28-181 N821SD C-172PN555GQ SR-20 N5302V C-T210LN20521 C-172M PROJECT TWINN5891W PA-28-150 N6151H PA-28-181N6288W PA-28-140 N34830 C-177BN828BS SEA-RAY N9315D C-172RGN21690 C-172M N5453L AA-5N45915 C-152 N957WA TAMPICO TB 9CN2888V C-150 N68MJ DA-42N98244 PA-28-140 N728K PA-34-200N8072H PA-28RT-201T N2432S C-337BN726 PA-18 N291BP BE-55N36968 BE-F33 N39530 PA-34-200N2896E C-172N N4516S BE-55N4792Y PA-25-260 N4662 BE-55N72AB PA-25-235 N109CC PA-23-250N86AB PA-25-235 N6269Y PA-23-250N5240G C-305A N44FD PA-23N37AB PA-25 N5896Y PA-23-250BL PROJECT NOT NOTED N6777M C-310FBL PROJECT NOT NOTED N3229P PA-23N2171W BE-19 N62580 PA-23N1893H C-310C N2100P PA-23N5619B C-182 N711PQ C-421BN3243U C-182F N310BG C-310RN1228T PA-28R-200 N7130Y PA-30N695DT PA-32R-301 N242PA PA-31-310N317NC PA-28R-200 N7826Y PA-30N1064U M-20J N3232Q C-401N898BB PA-46R-350T N21KA PA-31-310N213GD AA-1C N63RJ BE-55N93ER AG-5B N528FA C-402CN9551M M-20F N63830 PA-23-250N200DB PA-24-250 N28UA AERO COMMANDERC-FZWP C-177RG N35BC C-421CC-FDRU PA-J3 N6015Z BE-76N5509E C-150 N43TA BE-200N4376Y CYGNET SF-2A N856BC ISLANDERN4932M C-152 N9540Y BE-A55N13447 C-172M N911SQ C-310QN9372H C-172M N824BC C-340AN72274 C-206D N797RW C-441N1220X M-20D N101JD PA-23-250

North Perry Airport (HWO) – Airfield Safety Enhancement and Geometry Study
Appendix B – Based Aircraft Determination October 2016 6
N4385Y PA-25-235 N6750T C-310DN4845F PA-32R-3000 N5467S C-337BN2335J BE-23 N2196V PA-44-180N7824W PA-28-180 N34LM PA-34-200TN19597 C-150L TECHNAM COLLEGE TWINN34LM PA-34-200T N711P PA-23-160