north dakota traffic safety facts oil counties billings, bottineau, bowman, burke, divide, dunn,...
TRANSCRIPT
North Dakota Traffic Safety Facts
Oil CountiesBillings, Bottineau, Bowman, Burke, Divide, Dunn,
Golden Valley, McHenry, McKenzie, McLean, Mercer, Mountrail, Renville, Slope, Stark, Ward,
Williams

Tota l Crashes 15063
Injuries 3330
Fata l ities 182
Est. $ Loss* $543.9 Mi l l ion
Overview
THE FOLLOWING CRASH EVENTS OCCURRED ON THE OIL COUNTIES ROADS
FROM 2006 TO 2010:

Year Total Crashes Injuries Fatalities Total Est $ Loss*
2010 3909 847 33 $121.8 Mi l l ion2009 3203 725 46 $126.0 Mi l l ion2008 2962 652 38 $109.6 Mi l l ion2007 2669 602 31 $95.4 Mi l l ion
2006 2320 504 34 $90.9 Mi l l ion*Total Est $ Loss includes PDO crashes. Values for Est $ Loss as reported in NDDOT 2009 Crash Summary
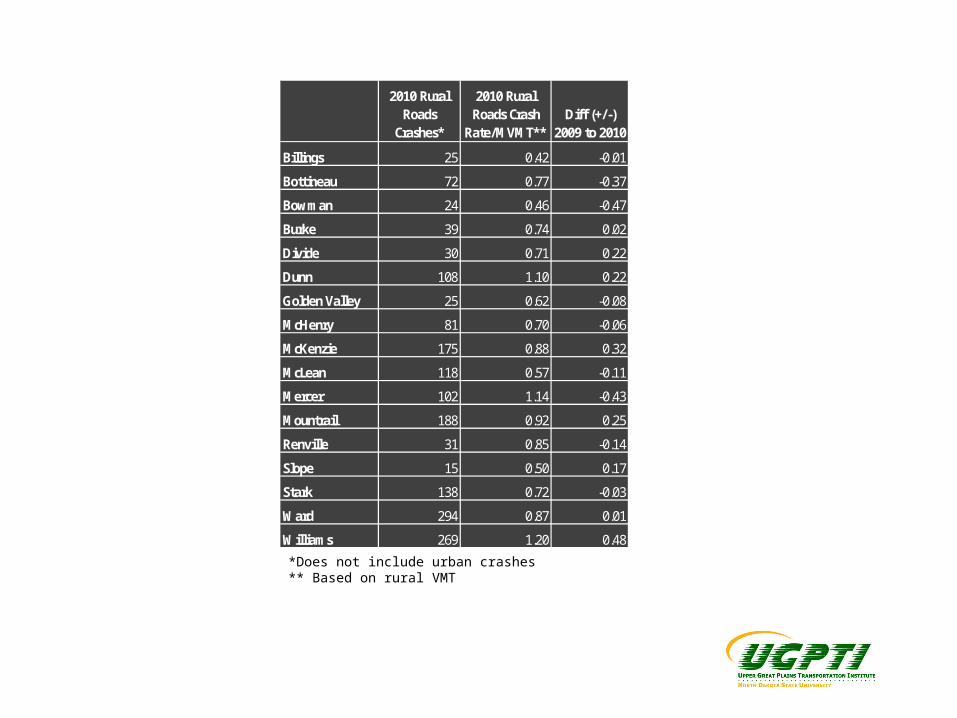
2010 Rural Roads
Crashes*
2010 Rural Roads Crash
Rate/MVMT**Diff (+/-)
2009 to 2010
Billings 25 0.42 -0.01
Bottineau 72 0.77 -0.37
Bowman 24 0.46 -0.47
Burke 39 0.74 0.02
Divide 30 0.71 0.22
Dunn 108 1.10 0.22
Golden Valley 25 0.62 -0.08
McHenry 81 0.70 -0.06
McKenzie 175 0.88 0.32
McLean 118 0.57 -0.11
Mercer 102 1.14 -0.43
Mountrail 188 0.92 0.25
Renville 31 0.85 -0.14
Slope 15 0.50 0.17
Stark 138 0.72 -0.03
Ward 294 0.87 0.01
Williams 269 1.20 0.48
*Does not include urban crashes ** Based on rural VMT

Billings
Bowman
Slope
McLean
Golden Valley
McHenry
Statewide
Divide
Stark
Burke
Bottineau
Renville
Ward
McKenzie
Mountrail
Dunn
Mercer
Williams
0.00 0.20 0.40 0.60 0.80 1.00 1.20 1.40
2010 Rural Roads Crash Rate/MVMT

Concrete Asphalt Gravel/Scoria0%
20%
40%
60%
80%
7%
64%
28%
3%
69%
27%
Rural Crashes by Road Surface Type: 2006-2010
ND Oil Counties
RURAL ROAD TYPES AND HARMFUL EVENTS

Motor Vehicle in Transport
Ran off Roadway Overturn/ Rollover Ditch Other0%
10%
20%
30%
40%
35%
7%
22%
15% 15%
First Harmful Event, 2010

Oil Counties ND Oil Counties ND Oil Counties ND Oil Counties ND2006 39.7% 38.8% 28.2% 28.3% 17.1% 14.9% 12.0% 14.0%2007 36.0% 36.4% 28.9% 29.4% 14.2% 14.1% 17.0% 15.7%2008 34.6% 36.7% 33.6% 31.0% 16.4% 16.5% 11.5% 11.9%2009 39.7% 37.2% 27.1% 28.1% 16.2% 15.9% 9.6% 11.0%2010 32.6% 33.2% 30.5% 31.2% 16.3% 14.6% 13.2% 12.2%
5 Yr Avg 36.5% 36.4% 29.7% 29.6% 16.0% 15.2% 12.7% 13.0%
Angle Rear-End Head-On SideswipeManner of Collision, Multivehicle

2006 2007 2008 2009 201030%
35%
40%
45%
50%
55%
60%
No Evasive Action in Crashes
NDOil Counties

Spee
ding
Too Fa
st
Drowsy
Distrac
ted
*Visu
al Obstr
uction
*Wea
ther
Impro
per Ove
rtakin
g
Faile
d to Yi
eld0%
5%
10%
15%
20%
25%
30%
Crash Factors in Oil Counties
2006 2007 2008 2009 2010*based on reported environment
RURAL ROAD CRASH FACTORS

2006
2007
2008
2009
2010
-5% 0% 5% 10% 15% 20% 25%
Truck Crashes as Percent of All Crashes
Oil Counties ND

2006 2007 2008 2009 201060%
62%
64%
66%
68%
70%
72%
74%
Single Vehicle Crashes
ND Oil Counties
Annu
al S
hare

58%
6%1%
20%
3%1%
2%10%
Citations: Rural Crashes 2006 to 2010
None DUI (Alcohol) Failure to Stop
Care Required Failure to Yield Improper Turning
Left Accident Scene Other
CITATIONS AND ALCOHOL-RELATED CRASHES

2006 2007 2008 2009 20100%
2%
4%
6%
8%
10%
12%
14%
16%
18%
Alcohol Use Involved: All Crashes
NDOil Counties

No Yes0%
20%
40%
60%
80%
77%
23%
78%
22%
Alcohol Use Involved: Fatal & Disabling Crashes, 2006 - 2010
NDOil Counties
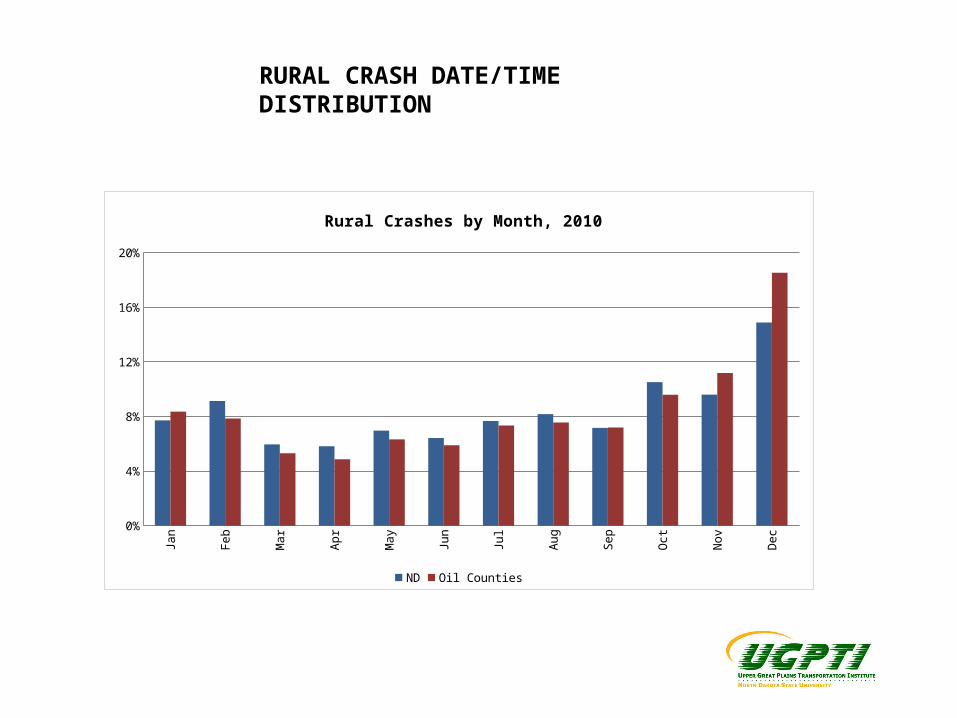
Jan
Feb
Mar Ap
r
May Jun Jul
Aug
Sep
Oct
Nov De
c0%
4%
8%
12%
16%
20%
Rural Crashes by Month, 2010
ND Oil Counties
RURAL CRASH DATE/TIME DISTRIBUTION

Sun Mon Tues Wed Thurs Fri Sat0%
2%
4%
6%
8%
10%
12%
14%
16%
18%
Rural Crashes by Day of Week, 2010
ND Oil Counties
12 a
.m.
1 a.
m.
2 a.
m.
3 a.
m.
4 a.
m.
5 a.
m.
6 a.
m.
7 a.
m.
8 a.
m.
9 a.
m.
10 a
.m.
11 a
.m.
12 p
.m.
1 p.
m.
2 p.
m.
3 p.
m.
4 p.
m.
5 p.
m.
6 p.
m.
7 p.
m.
8 p.
m.
9 p.
m.
10 p
.m.
11 p
.m.
0%
2%
4%
6%
8%
10%
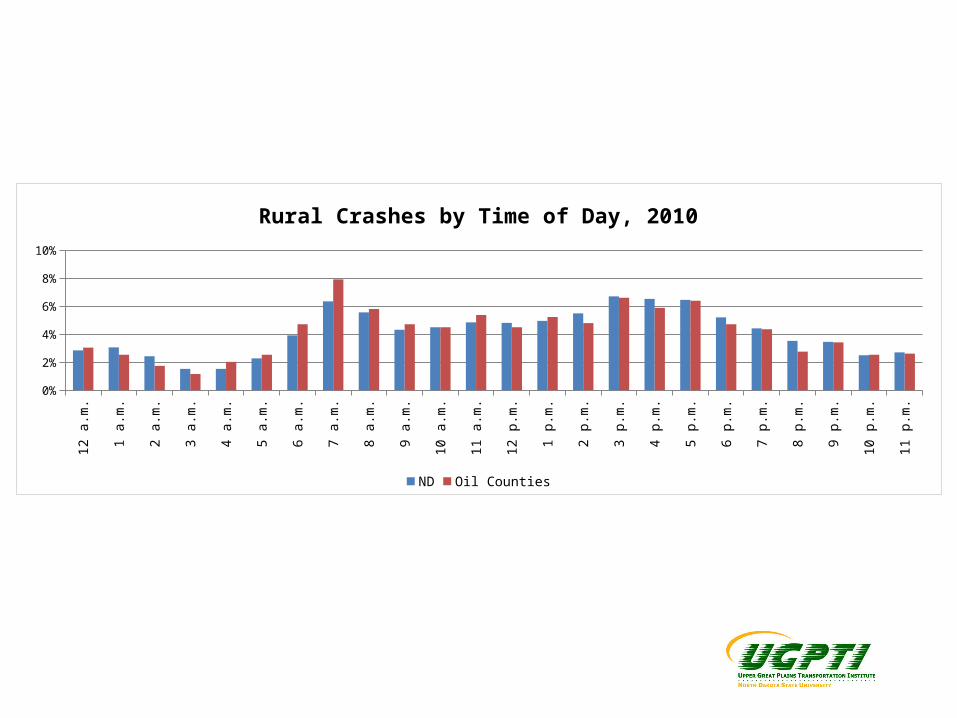
Rural Crashes by Time of Day, 2010
ND Oil Counties

14 to
24
25 to
34
35 to
44
45 to
54
55 to
64
65 to
74
75 o
r Old
er
0%
10%
20%
30%
Driver Age in Crashes, 2006 - 2010
ND Oil Counties
DRIVERS AND OCCUPANTS

No Yes0%
20%
40%
60%
80%
67%
33%
64%
36%
Seat Belt Use: Fatal and Serious Occupant Injury: 2006-2010
NDOil Counties

2006 2007 2008 2009 201060%
70%
80%
90%
100%
71%
72% 72% 73% 72%
Rural Road Crashes Occupant Belt Use
ND Oil Counties

2006
2007
2008
2009
2010
0%
20%
40%
60%
80%
100%
Driver Gender in Oil Counties Crashes
Female Male

RURAL ROAD CRASH TYPES/FEATURES
2006 2007 2008 2009 20100%
10%
20%
30%
40%
50%
60%
70%
80%
90%
100%
38.1% 37.7% 34.3% 30.8% 28.2%
46.5% 48.0%49.5%
52.2%49.9%
10.2% 8.3% 11.0% 12.2%17.1%
Oil Counties Crashes by Vehicle Type
TruckPickup/VanCar
Units

2006 2007 2008 2009 20100%
5%
10%
15%
20%
25%
30%
35%
Percentage of Crashes Occurring on Hills
ND Oil Counties

2006 2007 2008 2009 20100%
10%
20%
30%
40%
50%
60%
70%
Percentage of Crashes Involving "Lane Departure" Incident
ND Oil Counties

2006 2007 2008 2009 201014%
16%
18%
20%
22%
Percentage of Crashes Occurring at Intersections
ND Oil Counties

2006 2007 2008 2009 20100%
10%
20%
30%
40%
50%
60%
70%
Percentage of Crashes Involving "Run off Road" Incident
ND Oil Counties

2006 2007 2008 2009 20100%
5%
10%
15%
20%
25%Percentage of Crashes Occurring on Curves
ND Oil Counties

Source: Data Summaries based on North Dakota Crash Data, 2006 to 2010, Traffic Safety Office, ND Department of Transportation