north carolina ecosystem enhancement program (nceep)
TRANSCRIPT
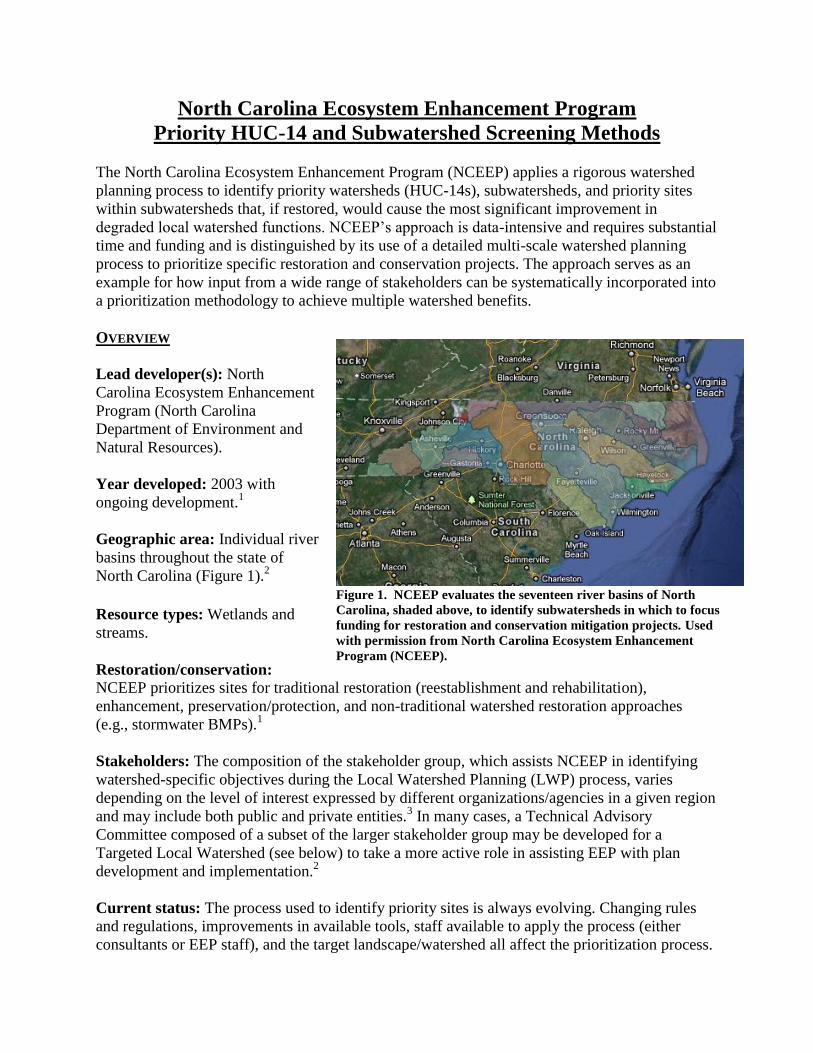
Figure 1. NCEEP evaluates the seventeen river basins of North
Carolina, shaded above, to identify subwatersheds in which to focus
funding for restoration and conservation mitigation projects. Used
with permission from North Carolina Ecosystem Enhancement
Program (NCEEP).
North Carolina Ecosystem Enhancement Program
Priority HUC-14 and Subwatershed Screening Methods
The North Carolina Ecosystem Enhancement Program (NCEEP) applies a rigorous watershed
planning process to identify priority watersheds (HUC-14s), subwatersheds, and priority sites
within subwatersheds that, if restored, would cause the most significant improvement in
degraded local watershed functions. NCEEP’s approach is data-intensive and requires substantial
time and funding and is distinguished by its use of a detailed multi-scale watershed planning
process to prioritize specific restoration and conservation projects. The approach serves as an
example for how input from a wide range of stakeholders can be systematically incorporated into
a prioritization methodology to achieve multiple watershed benefits.
OVERVIEW
Lead developer(s): North
Carolina Ecosystem Enhancement
Program (North Carolina
Department of Environment and
Natural Resources).
Year developed: 2003 with
ongoing development.1
Geographic area: Individual river
basins throughout the state of
North Carolina (Figure 1).2
Resource types: Wetlands and
streams.
Restoration/conservation: NCEEP prioritizes sites for traditional restoration (reestablishment and rehabilitation),
enhancement, preservation/protection, and non-traditional watershed restoration approaches
(e.g., stormwater BMPs).1
Stakeholders: The composition of the stakeholder group, which assists NCEEP in identifying
watershed-specific objectives during the Local Watershed Planning (LWP) process, varies
depending on the level of interest expressed by different organizations/agencies in a given region
and may include both public and private entities.3 In many cases, a Technical Advisory
Committee composed of a subset of the larger stakeholder group may be developed for a
Targeted Local Watershed (see below) to take a more active role in assisting EEP with plan
development and implementation.2
Current status: The process used to identify priority sites is always evolving. Changing rules
and regulations, improvements in available tools, staff available to apply the process (either
consultants or EEP staff), and the target landscape/watershed all affect the prioritization process.

In addition, the NCEEP Science and Analysis group analyzes the results of EEP site monitoring
efforts to evaluate the restoration/conservation approaches work best with given watershed and
site characteristics.1
PRIORITIZATION ANALYSIS
Determination of prioritization objectives: In 2003, NCEEP’s multi-agency Watershed Needs
Assessment Team (WNAT) identified three major functions to serve as the basis of site
prioritization efforts: water quality, hydrology, and habitat. As part of the River Basin
Restoration Priorities screening method, these major functions are applied together with a set of
identified needs related to watershed problems, assets, and opportunities to identify priority
HUC-14s for further analysis (see below). Later in NCEEP’s process, during LWP stage,
NCEEP engages with stakeholders to identify watershed-specific objectives.15
Input data QA/QC: NCEEP ensures that important datasets, particularly aerial photography and
land use data, are up-to-date prior to its LWP prioritization analyses.14
Landscape prioritization tool(s):
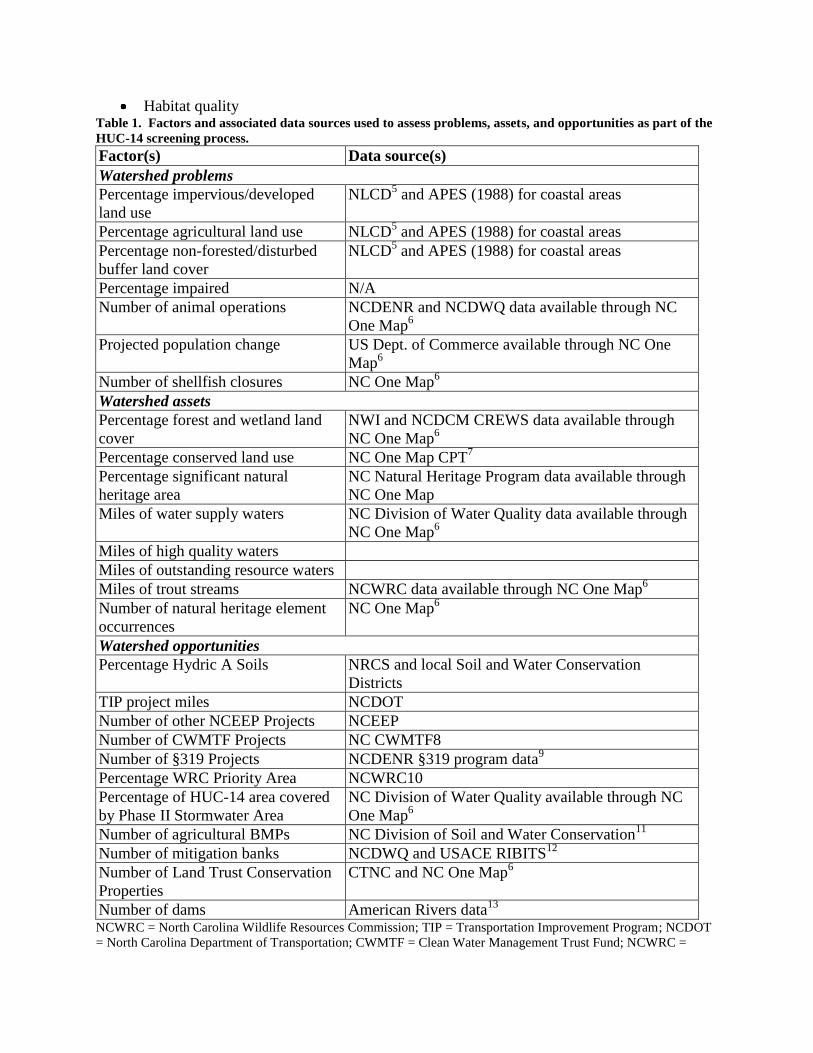
River Basin Restoration Priorities (RBRP) HUC-14 screening method: As part of its RBRP
analysis, NCEEP applies a screening method to identify Targeted Local Watersheds (TLWs)
within HUC-8 watersheds (Fig. 2) that serve as the basis for further prioritization. Using desktop
GIS analysis, NCEEP ranks potential TLWs (HUC-14) within each cataloguing unit (HUC-8)
based on various measures of watershed problems (i.e., restoration objectives), assets (i.e.,
preservation objectives), and opportunities (Table 1). Problem and asset measures are weighted
by water quality, flood retention, and aquatic and riparian habitat functions/values (Figure 2),
while opportunity measures receive no such weighting. Those measures that directly support
these functions/values (e.g., percentage impervious land use for ―water quality improvement
potential‖) receive a weight of two and those measures that indirectly support the
functions/values (e.g., projected population change for ―water quality improvement potential‖)
receive a weight of one. Based on these measures and weightings, final scores are obtained for
each HUC-14 watershed for each category (problems, assets, and opportunities). The categories
are then weighted and added to obtain final ranks for each HUC-14 within its containing HUC-
8.4
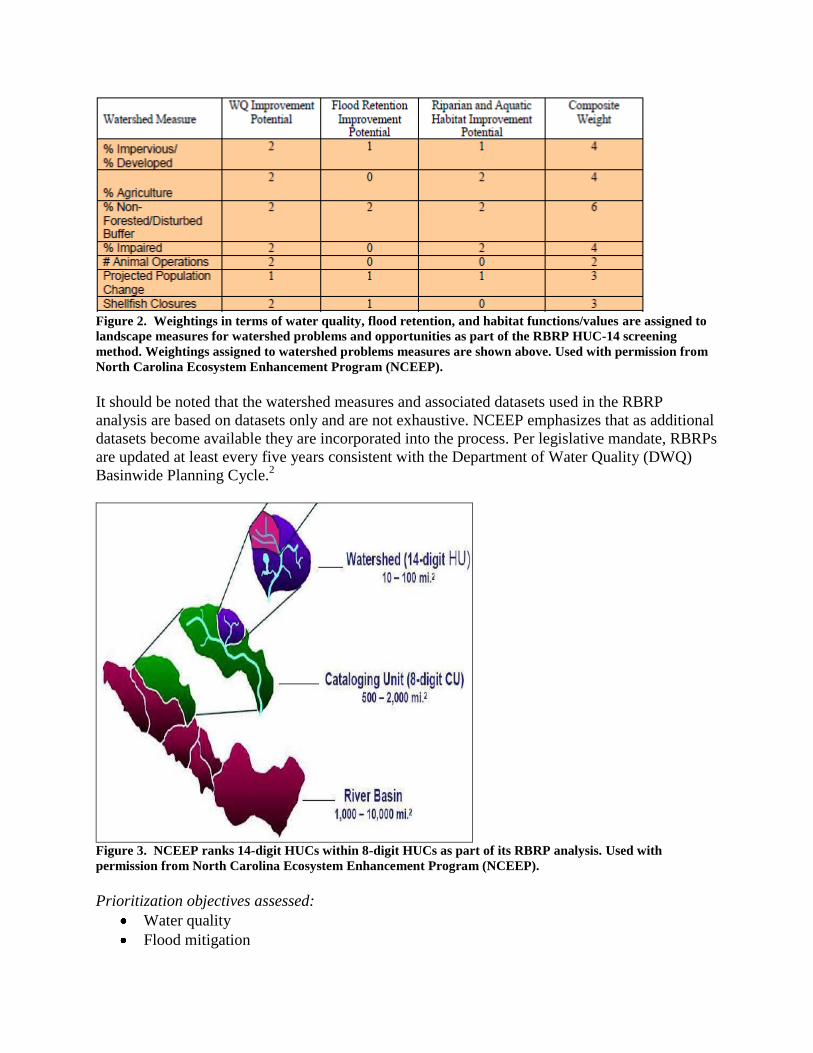
Figure 2. Weightings in terms of water quality, flood retention, and habitat functions/values are assigned to
landscape measures for watershed problems and opportunities as part of the RBRP HUC-14 screening
method. Weightings assigned to watershed problems measures are shown above. Used with permission from
North Carolina Ecosystem Enhancement Program (NCEEP).
It should be noted that the watershed measures and associated datasets used in the RBRP
analysis are based on datasets only and are not exhaustive. NCEEP emphasizes that as additional
datasets become available they are incorporated into the process. Per legislative mandate, RBRPs
are updated at least every five years consistent with the Department of Water Quality (DWQ)
Basinwide Planning Cycle.2
Figure 3. NCEEP ranks 14-digit HUCs within 8-digit HUCs as part of its RBRP analysis. Used with
permission from North Carolina Ecosystem Enhancement Program (NCEEP).
Prioritization objectives assessed:
Water quality
Flood mitigation
Habitat quality Table 1. Factors and associated data sources used to assess problems, assets, and opportunities as part of the
HUC-14 screening process.
Factor(s) Data source(s)
Watershed problems
Percentage impervious/developed
land use
NLCD5 and APES (1988) for coastal areas
Percentage agricultural land use NLCD5 and APES (1988) for coastal areas
Percentage non-forested/disturbed
buffer land cover
NLCD5 and APES (1988) for coastal areas
Percentage impaired N/A
Number of animal operations NCDENR and NCDWQ data available through NC
One Map6
Projected population change US Dept. of Commerce available through NC One
Map6
Number of shellfish closures NC One Map6
Watershed assets
Percentage forest and wetland land
cover
NWI and NCDCM CREWS data available through
NC One Map6
Percentage conserved land use NC One Map CPT7
Percentage significant natural
heritage area
NC Natural Heritage Program data available through
NC One Map
Miles of water supply waters NC Division of Water Quality data available through
NC One Map6
Miles of high quality waters
Miles of outstanding resource waters
Miles of trout streams NCWRC data available through NC One Map6
Number of natural heritage element
occurrences
NC One Map6
Watershed opportunities
Percentage Hydric A Soils NRCS and local Soil and Water Conservation
Districts
TIP project miles NCDOT
Number of other NCEEP Projects NCEEP
Number of CWMTF Projects NC CWMTF8
Number of §319 Projects NCDENR §319 program data9
Percentage WRC Priority Area NCWRC10
Percentage of HUC-14 area covered
by Phase II Stormwater Area
NC Division of Water Quality available through NC
One Map6
Number of agricultural BMPs NC Division of Soil and Water Conservation11
Number of mitigation banks NCDWQ and USACE RIBITS12
Number of Land Trust Conservation
Properties
CTNC and NC One Map6
Number of dams American Rivers data13
NCWRC = North Carolina Wildlife Resources Commission; TIP = Transportation Improvement Program; NCDOT
= North Carolina Department of Transportation; CWMTF = Clean Water Management Trust Fund; NCWRC =
North Carolina Wildlife Resources Commission; NCDENR = North Carolina Department of Environment and
Natural Resources; NCDWQ = North Carolina Division of Water Quality; USACE = U.S. Army Corps of
Engineers; RIBITS = Regulatory In-lieu fee and Banking Information Tracking System; CTNC = Conservation
Trust of North Carolina; NC CPT = North Carolina One Map Conservation Planning Tool; NCWRC CREWS =
North Carolina Wildlife Resources Commission Coastal Region Evaluation of Wetland Significance; NLCD =
National Land Cover Dataset; NWI = National Wetlands Inventory; NCDCM = North Carolina Division of Coastal
Management; APES = Albemarle-Pamlico Estuarine Study (database)
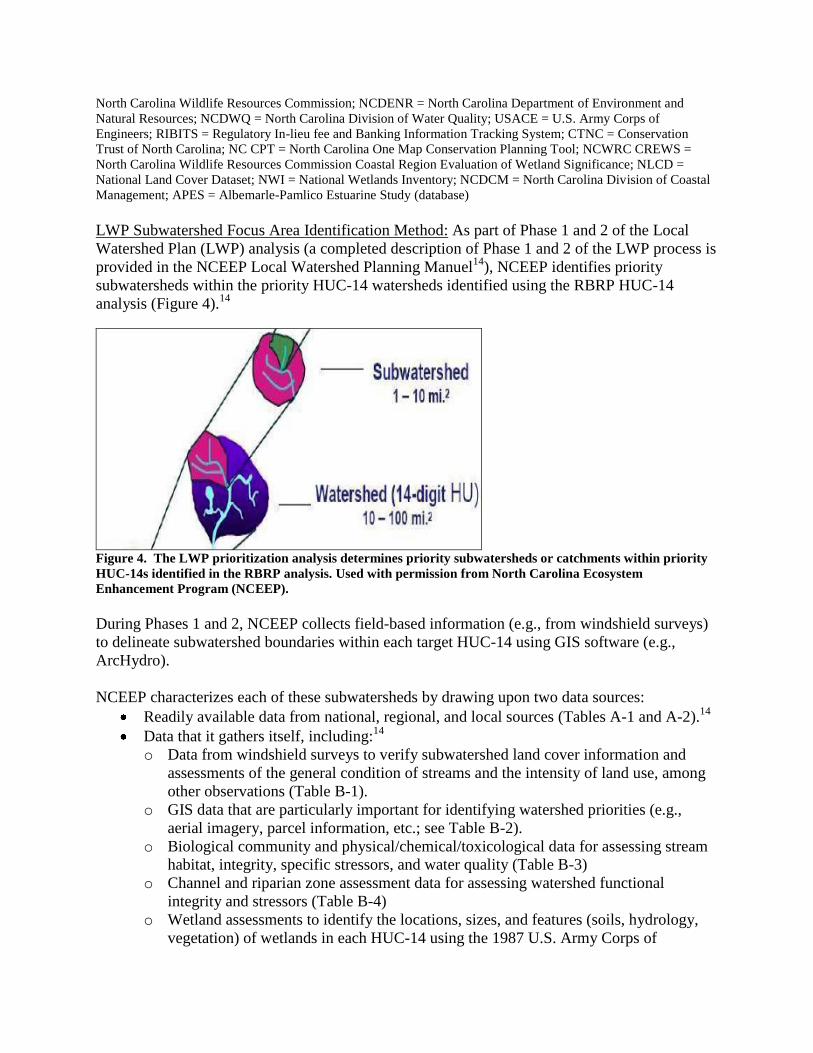
LWP Subwatershed Focus Area Identification Method: As part of Phase 1 and 2 of the Local
Watershed Plan (LWP) analysis (a completed description of Phase 1 and 2 of the LWP process is
provided in the NCEEP Local Watershed Planning Manuel14
), NCEEP identifies priority
subwatersheds within the priority HUC-14 watersheds identified using the RBRP HUC-14
analysis (Figure 4).14
Figure 4. The LWP prioritization analysis determines priority subwatersheds or catchments within priority
HUC-14s identified in the RBRP analysis. Used with permission from North Carolina Ecosystem
Enhancement Program (NCEEP).
During Phases 1 and 2, NCEEP collects field-based information (e.g., from windshield surveys)
to delineate subwatershed boundaries within each target HUC-14 using GIS software (e.g.,
ArcHydro).
NCEEP characterizes each of these subwatersheds by drawing upon two data sources:
Readily available data from national, regional, and local sources (Tables A-1 and A-2).14
Data that it gathers itself, including:14
o Data from windshield surveys to verify subwatershed land cover information and
assessments of the general condition of streams and the intensity of land use, among
other observations (Table B-1).
o GIS data that are particularly important for identifying watershed priorities (e.g.,
aerial imagery, parcel information, etc.; see Table B-2).
o Biological community and physical/chemical/toxicological data for assessing stream
habitat, integrity, specific stressors, and water quality (Table B-3)
o Channel and riparian zone assessment data for assessing watershed functional
integrity and stressors (Table B-4)
o Wetland assessments to identify the locations, sizes, and features (soils, hydrology,
vegetation) of wetlands in each HUC-14 using the 1987 U.S. Army Corps of

Engineers Routine Wetland Determination method and the North Carolina Wetland
Assessment Method (NC WAM).
o Nutrient loading model data (e.g., Soil and Water Assessment Tool (SWAT)) to
understand the impact of particular stressor(s). Watershed modeling tools and the
LWPs to which each has been applied are provided in Table B-5.
Based on this information, NCEEP reapplies its RBRP analysis method to rank subwatersheds in
target HUC-14s in terms of water quality, hydrological, and habitat functions based on sets of
indicators associated with each function (Table 2). For example, in its Bald Creek LWP, NCEEP
identified quantitative indicators associated with a series of functions, including bank erosion
potential, channel incision, forest area extent, and extent of stream channelization (Table 7).
Other examples of such indicators – derived from NCEEP’s Watershed Needs Assessment Team
(WNAT) report (2003)15
– are provided in Tables A-3, A-4, and A-5.14
NCEEP then assigns points to each indicator based on the indicator’s overall range of values
across subwatersheds. These point values are weighted based on stakeholder input and EEP
priorities and summed to obtain a total score for each subwatershed indicator. NCEEP assigns a
rank of high, moderate, or low to each indicator rank before combining these rankings to
calculate each subwatershed’s overall ecological condition (also using a scale of high, moderate,
and low). The resulting rankings, which are presented in each LWP as a table (Figure 5) and map
(Figure 6), are used to identify ―focus areas.‖ Focus areas are defined by NCEEP as
―subwatersheds identified as priority areas for the development and implementation of
management strategies to address concentrated areas…of key problems or assets.‖ NCEEP may
assign descriptors to each subwatershed ranking such as ―high preservation potential‖ or ―highest
probable need for restoration.‖14

Figure 5. NCEEP rates the overall ecological condition of each subwatershed based on ratings for individual
function measures. All ratings are given as high (“H”), moderate (“M”), or low (“L”). Used with permission
from North Carolina Ecosystem Enhancement Program (NCEEP).
Figure 6. NCEEP uses color-coded maps, such as this one for the Franklin to Fontana LWP, to illustrate
where ecological conditions are high, moderate, and low among individual subwatersheds. Used with
permission from North Carolina Ecosystem Enhancement Program (NCEEP).
Prioritization objectives (and associated data sources) assessed:
Water quality
Flood mitigation
Habitat quality
Table 2. Factors and data sources used to assess habitat function, water quality, and hydrologic function as
part of NCEEP’s process for identifying subwatershed focus areas.
Factor(s) Data source(s)
Habitat function
Overall Aquatic Habitat Quality Mean total habitat score, NCDWQ stream
habitat protocol (Equinox field survey)
Pool Frequency and Variety Mean pool score, NCDWQ stream habitat
protocol (Equinox field survey)
Microhabitat Diversity and Abundance Mean microhabitat score, NCDWQ stream
habitat protocol (Equinox field survey)
Riparian Forest Area Extent % of stream length with forested riparian
zone 100 ft* wide (GIS analysis)
Water quality function
Specific Conductance Mean specific conductance (Equinox field
measurement)
Bacterial Contamination Geometric mean fecal coliform
concentration (NCDWQ sampling)
Riparian Forest Area Extent % of stream length with forested riparian
zone 30 ft* wide (GIS analysis)
Housing Density Homes per square mile (Equinox
windshield survey)
Hydrologic function
Stream Bank Erosion Potential Mean BEHI score (Equinox field survey)
Channel Incision Mean bank height ratio (Equinox field
survey)
Forest Area Extent % total sub-watershed area forested (GIS
analysis)
Extent of Stream Channelization % of low gradient streams channelized
(GIS analysis)
NCDWQ = North Carolina Department of Water Quality; BEHI = Bank Erosion Hazard Index
*Width of forested riparian zone used should vary depending on data available, ecoregion, and stream and
watershed characteristics.
Refinement of landscape priorities:
Candidate watersheds that are identified through the HUC-14 screening method are evaluated
more thoroughly using windshield surveys and input from local resource professionals. After
gauging local interest and verifying that appropriate restoration opportunities are likely to exist,
NCEEP produces a refined short list of candidate watersheds. NCEEP then obtains further
feedback from local interests, before making a final selection of HUC-14 watersheds in which to
target conservation actions in order to produce the largest functional benefit.14
In addition, based on the priority subwatershed ―focus areas‖ identified using its landscape
prioritization methods, NCEEP draws upon the following sources of information it has collected
throughout the LWP process to identify specific project sites for mitigation activities:14
GIS assessments: Desktop GIS analyses, such as the LWP subwatershed prioritization
method described above, help NCEEP identify subwatershed-scale focus areas in which it
can target wetland/stream restoration and conservation to improve watershed functions.
Field assessments: In Phases 1 and 2 of the LWP, NCEEP evaluates the target HUC-14(s)
for assets (e.g. taxonomically-rich benthic communities), problems (e.g., 303(d) listed
impaired streams), and stressors (e.g., unbuffered streams). NCEEP uses this information
to identify potential project sites.
Stakeholder input: Local stakeholders may contribute projects that they believe to be
important to the final set of potential project sites.
With a set of potential project sites identified, NCEEP proceeds to develop a final Project Atlas
that ranks projects based the criteria listed below:14
Ecological criteria: NCEEP uses ecological criteria to rank projects or project
combinations based on the amount of functional uplift that they could potentially
generate within their subwatershed. The highest ranked projects generally have the
highest potential to produce functional uplift and are located within focus areas in
optimal landscape positions (e.g., headwaters areas) in the subwatershed.
NCEEP often evaluates ecological criteria by using watershed modeling to determine the
functional benefits (e.g., pollutant load reductions) that might result from specific
projects. The models rank projects according to how much each will improve watershed
functions, with the most functionally impaired areas receiving the highest ranks for
restoration and enhancement projects and the most asset-rich or functionally unimpacted
areas ranking highest for preservation projects. NCEEP recognizes, however, that
implementing a set of top ranked projects does not always maximize function uplift and
that sometimes implementing a strategic combination of projects produces the best
results. For this reason, it sometimes uses simulation modeling to determine which
combinations of projects are together capable of maximizing functional uplift.14
Feasibility criteria: Feasibility criteria considered in project ranking include number of
landowners (obtained from County parcel data layers), site constraints (e.g., utility lines,
road/bridge crossings), and landowner willingness.14
Stakeholder criteria: Local stakeholders may develop criteria for ranking sites that are
unrelated to ecological and feasibility criteria (e.g., proximity of project to schools/parks
for educational purposes).14
Final site-specific projects generally include traditional mitigation projects (stream and water
restoration, enhancement, or preservation) and best management practices (BMPs) in agricultural
and urban areas.14
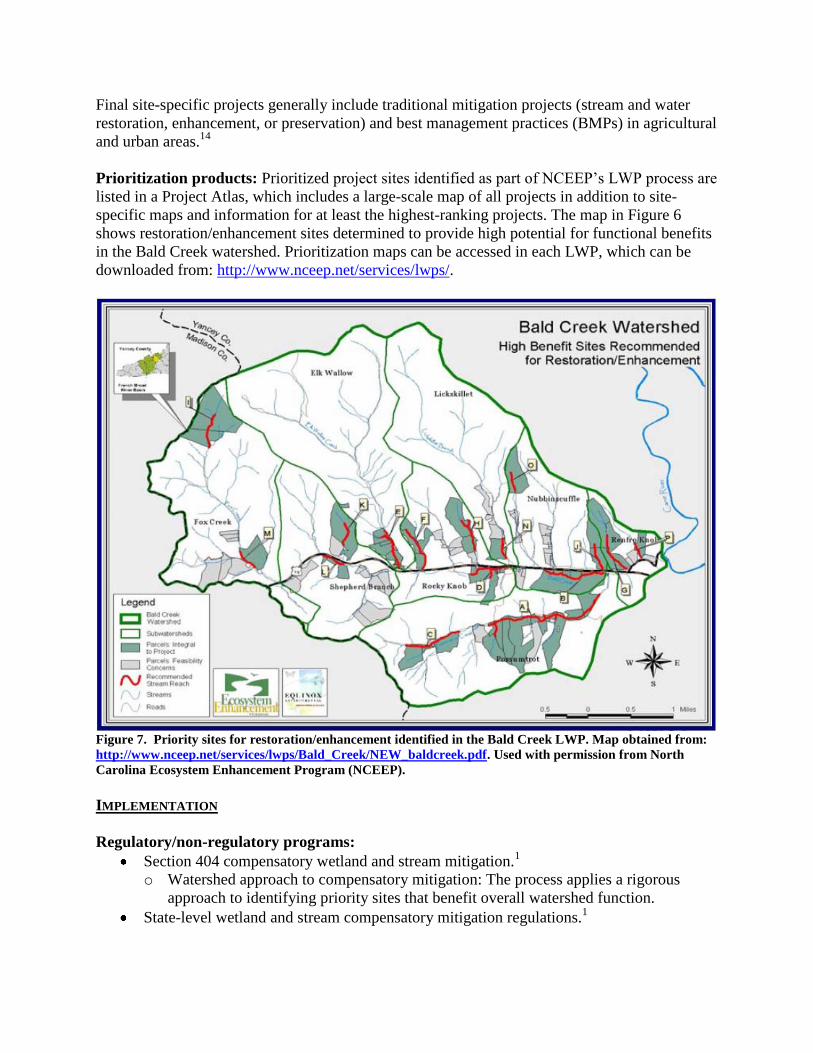
Prioritization products: Prioritized project sites identified as part of NCEEP’s LWP process are
listed in a Project Atlas, which includes a large-scale map of all projects in addition to site-
specific maps and information for at least the highest-ranking projects. The map in Figure 6
shows restoration/enhancement sites determined to provide high potential for functional benefits
in the Bald Creek watershed. Prioritization maps can be accessed in each LWP, which can be
downloaded from: http://www.nceep.net/services/lwps/.
Figure 7. Priority sites for restoration/enhancement identified in the Bald Creek LWP. Map obtained from:
http://www.nceep.net/services/lwps/Bald_Creek/NEW_baldcreek.pdf. Used with permission from North
Carolina Ecosystem Enhancement Program (NCEEP).
IMPLEMENTATION
Regulatory/non-regulatory programs:
Section 404 compensatory wetland and stream mitigation.1
o Watershed approach to compensatory mitigation: The process applies a rigorous
approach to identifying priority sites that benefit overall watershed function.
State-level wetland and stream compensatory mitigation regulations.1
State water quality regulatory programs – NCEEP applies its process to satisfy state
regulations for riparian buffers and nutrient offsets in applicable river basins.1
CWA §319 restoration or conservation projects conducted by the North Carolina
Department of Environment and Natural Resources (NCDENR) and the state’s Clean
Water Management Trust Fund (CWMTF).1 North Carolina’s CWMTF evaluates
potential aquatic resource restoration and conservation projects for funding based on a
point system. In scoring projects, CWMTF awards additional points if projects are
located in NCEEP priority areas.1
Achieving multiple functional goals: Because state agencies (particularly those
conducting restoration or conservation under §319) often have different objectives (e.g.,
addressing water quality, habitat conservation, etc.), the ability of NCEEP’s approach to
address multiple agency needs could serve as an incentive for its application.1
An important area where additional incentives could be created would involve the use of
NCEEP priority areas to inform the §319 program.1
Transferability:
After applying this approach to the many different types of ecoregions found in North
Carolina (ranging from coastal to mountainous) NCEEP has gained substantial
experience integrating data across a variety of environments. This approach could be a
good model for other states to follow due to its multi-scale process that begins with
prioritization at the river basin level and proceeds to identify finer-scale priority areas.1
The approach serves as an example of how fine-scale input from a broad range of
stakeholders can be incorporated into a process for prioritizing restoration/conservation
sites in a way that produces multiple benefits. The NCEEP representative noted that they
would encourage this kind of stakeholder input in other states.1
Limiting NCEEP’s Planning approach is the fact that the fine-scale analysis (local
watershed planning or LWP) is time-consuming to complete, requires substantial
dedicated staff time, and can be data intensive.1
Transferability may also be limited because the River Basin Restoration Priority
assessment part of the process requires comprehensive high-quality data on a state-wide
scale. Such data may be limited for states with few existing high-quality statewide
datasets.1
Transferability of the RBRP assessment process may also be limited for particularly
small/fragmented states (e.g., Hawaii), in which very small drainages could complicate
the application of NCEEP’s tiered watershed-based approach. A direct application of the
LWP process might be more appropriate for small states or regions.1
Data gaps:
Aerial photography data errors: A common data gap involving aerial photography occurs
when aerial data are rectified and the resulting map is patchy or the tiles comprising an
area are from different years. Since LWPs are conducted in HUC-14s, which tend to
cover small land areas (10-100 mi2), these errors can be problematic for conducting
LWPs by requiring that more data gaps be filled as a result.1
A lack of fine-scale imperviousness data: Although imperviousness data can be derived
simply from land use and aerial photography, these data sources produce only coarse-
scale data. Fine-scale data is generally only available at high cost.1

Difficulty obtaining accurate population data on a watershed basis: Because census data
are organized by county, dividing population data at a watershed scale requires
substantial time.1
U.S. Department of Agriculture (USDA) agricultural land use data: The USDA has GIS
layers for the aerial extent and number of animals on larger farms that are required to
have USDA permits, such as Contained Animal Feeding Operations (CAFOs). For
LWPs, these would be helpful for analyses that include the land use for farms. The
USDA data are currently unavailable, however, for privacy protection reasons. Because
intermediate-scale data, such as those collected by USDA, will be important for
NCEEP’s recently-initiated effort to produce Regional Watershed Plans (RWPs), NCEEP
plans to continue working to obtain them.1
Coastal habitat data: In the past, data on fish habitat distributions (e.g., submerged
aquatic vegetation) were included as part of Coastal Habitat Protection Plans, but due to
recent funding cuts the availability of this information has become less certain.1
Barriers:
A lack of staff trained in advanced GIS analysis. Currently EEP must contract additional
staff to obtain these skills. Having an advanced GIS analyst on staff who is dedicated to
their mission could greatly improve the state’s technical capacity and efficiency.2
Data management: Better data management could increase the state’s capacity for
capturing, organizing, and storing data. NCEEP is currently developing a database to
improve data management.2
LWP funding and timing tied to impacts. NCDOT and EEP ILF programs fund all EEP
activities. These programs have traditionally tied funding approval to volume and timing
of impacts and the window for using the funds under these programs is compressed due
to compliance requirements. Beginning the LWP planning process further in advance of
impacts would allow for better-focused resource expenditures. EEP is working on these
issues.2
NCEEP believes that data created by agencies should be freely available and notes that
cooperation among agencies with regard to data management is now being discussed at
high levels of the state government. To this end, the program reported that the state has
recently begun moving all state-specific data – including GIS data – to a single
clearinghouse, which should make datasets created by other agencies more readily
accessible. NCEEP believes, however, that the availability of some data should
nevertheless be screened for quality assurance.1
NCEEP reports that because aerial photography and land use data are so critical to their
process, maintaining up-to-date land use and aerial data is always an issue. Although
NCEEP is capable of updating this information in house, the program often cannot afford
to do so and must use older data.1
Future goals:
Improve data management by developing a well-organized and functional database.1
Determine whether NCEEP projects have produced measureable benefits for watersheds
by completing more follow-up monitoring in LWP watersheds. Such data could provide
valuable information that would improve the planning process.1

NCEEP cited a lack of sufficient technical staff and funding as primary obstacles to
achieving these goals, adding that additional training and staff time would be helpful as
well.1
1 Interviews on 8/16/11 and 9/28/11 with Nancy Daly, Marc Recktenwald, and Rob Breeding, North Carolina
Ecosystem Enhancement Program. 2 Feedback received on 3/14/12 from Nancy Daly, Marc Recktenwald, and Rob Breeding, North Carolina
Ecosystem Enhancement Program. 3 At a minimum, the stakeholders from the following agencies/organizations are notified of the planning process at
initiation of Phase I and following completion of the Watershed Assessment Report and Watershed Management
Plan and Project Atlas: DWQ Regional Office; DWQ Basinwide planner; Local Natural Resource Conservation
Service (NRCS), Soil & Water Conservation District (SWCD), and Resource Conservation and Development
Program (RC&D) representatives; County Cooperative Extension Office; NC Department of Transportation (DOT)
Project Development & Environmental Analysis Assistant Manager; NC DOT Division Office; NC Wildlife
Resource Commission Regional Office; NC Division of Forest Resources; CWMTF field representative; Local
Governments (including Planning Director and Utilities Director); Regional Councils of Government; Metropolitan
Planning Organizations (MPOs)/Rural Planning Organizations (RPOs); Representatives from universities and/or
colleges in study area; US Fish and Wildlife Service Regional Office; United States Army Corps of Engineers
Regional Office; Local land trusts; The Nature Conservancy; Environmental Defense Fund; Private
landowners/community representatives 4 RBRP Weighting Methodology. Accessible from:
http://www.nceep.net/pages/Methodology%20for%20Weighting_Attachment%20B_20101122.pdf. 5 http://www.mrlc.gov/mrlc2k_nlcd.asp
6 http://data.nconemap.com/geoportal/catalog/search/browse/browse.page
7 http://www.onencnaturally.org/pages/ConservationPlanningTool.html
8 http://www.cwmtf.net/
9 http://portal.ncdenr.org/web/wq/ps/nps/319program
10 http://www.ncwildlife.org/Conserving.aspx
11 http://www.ncagr.gov/sw/about-the-division.html
12 http://geo.usace.army.mil/ribits/index.html
13 http://www.americanrivers.org/your-region/southeast/north-carolina-trp.html
14 North Carolina Ecosystem Enhancement Program. 2011. NC Ecosystem Enhancement Program Local Watershed
Planning Manual (draft). 15
NCEEP. October 2005. Report from the Watershed Needs Assessment Team to the Mitigation Coordination
Group. Accessible from: http://www.nceep.net/news/reports/WNAT%20Mit%20Group%20Final.pdf.

Appendix A: Existing data NCEEP obtains for LWP assessments
Table A-1. Datasets gathered in phase 1 of the LWP analysis for the preliminary evaluation of watershed
conditions. Table modified from NCEEP’s LWP Planning Manual.14
Factors used in analysis Data source(s)
Basics
1:24,000 scale topographic maps NCDOT
(http://www.ncdot.org/it/gis/DataDistribution/U
SGSTopoMaps/default.html)
Aerial photography—most recent digital: CGIA; local; NAIP; Bing; County aerials; recent
historic aerials--National Archive, SWCDs,
NRCS, FSA; Google Earth; TerraServer
(http://www.terraserver.com/); Image Trader
(http://www.landsat.com/)
Land use/cover EEP; 2001 NLCD (http://www.mrlc.gov/).
Coastal areas: APES (1988), C-CAP
(http://www.csc.noaa.gov/crs/lca/southeast.html)
, OR more recent dataset
Impervious cover Local; EEP; MRLC has national lu/lc from 2001
satellite imagery; see
http://www.mrlc.gov/mrlc2k_nlcd.asp, NC
OneMap
(http://www.cgia.state.nc.us/Default.aspx?tabid=
55)
DEMs FMP; LIDAR through Division of Floodplain
Management
Parcel data Local
County boundaries CGIA
Municipal boundaries NCDOT; local;
http://www.ncdot.org/it/gis/DataDistribution/DO
TData/default.html
Hydrography
1:24,000 scale, complete with use support
designation, DWQ classification.
CGIA
1:100,000 scale CGIA
Wetlands DCM; Division of Costal Management wetland
dataset for coastal areas
Detailed hydrography dataset if available CGIA; DWQ
National Hydrography Dataset EEP; NHD; NHD+
National Wetland Inventory CGIA
Flood zones: floodway, 100 yr floodplain,
etc.
FMP, local;
http://floodmaps.nc.gov/fmis/Download.aspx
8, 14, 12 digit hydrological units EEP
Natural Resources
Soils—including hydric classification Local
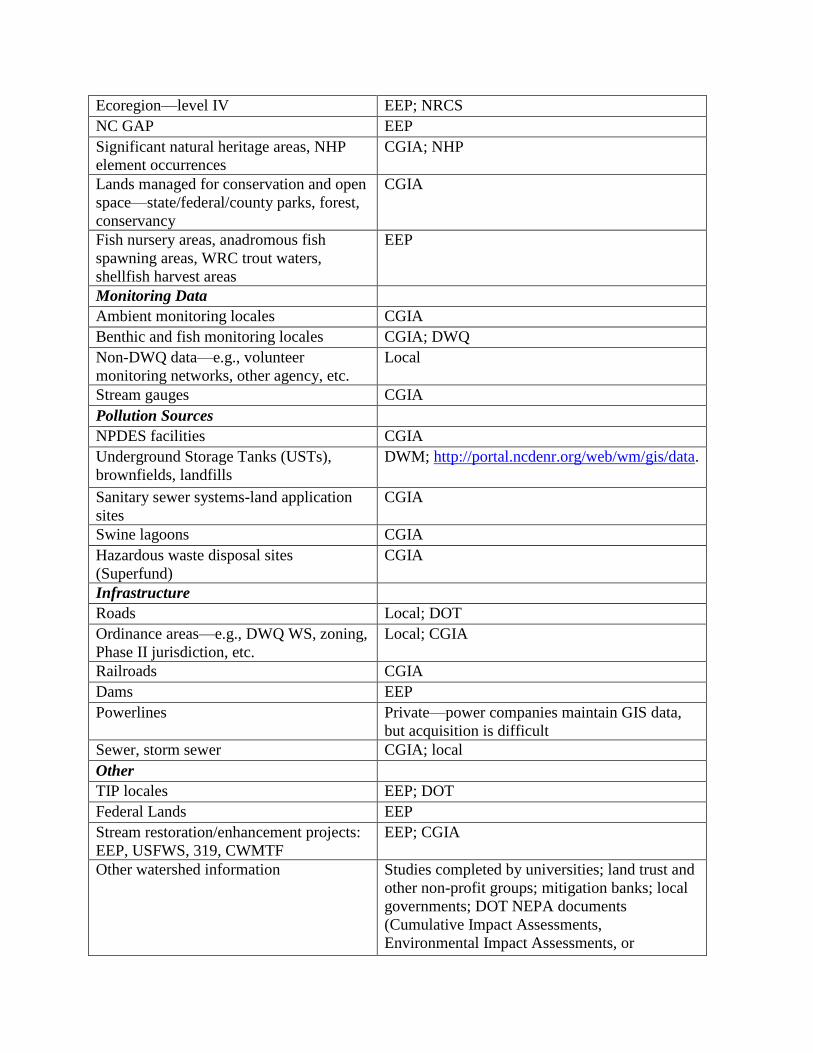
Ecoregion—level IV EEP; NRCS
NC GAP EEP
Significant natural heritage areas, NHP
element occurrences
CGIA; NHP
Lands managed for conservation and open
space—state/federal/county parks, forest,
conservancy
CGIA
Fish nursery areas, anadromous fish
spawning areas, WRC trout waters,
shellfish harvest areas
EEP
Monitoring Data
Ambient monitoring locales CGIA
Benthic and fish monitoring locales CGIA; DWQ
Non-DWQ data—e.g., volunteer
monitoring networks, other agency, etc.
Local
Stream gauges CGIA
Pollution Sources
NPDES facilities CGIA
Underground Storage Tanks (USTs),
brownfields, landfills
DWM; http://portal.ncdenr.org/web/wm/gis/data.
Sanitary sewer systems-land application
sites
CGIA
Swine lagoons CGIA
Hazardous waste disposal sites
(Superfund)
CGIA
Infrastructure
Roads Local; DOT
Ordinance areas—e.g., DWQ WS, zoning,
Phase II jurisdiction, etc.
Local; CGIA
Railroads CGIA
Dams EEP
Powerlines Private—power companies maintain GIS data,
but acquisition is difficult
Sewer, storm sewer CGIA; local
Other
TIP locales EEP; DOT
Federal Lands EEP
Stream restoration/enhancement projects:
EEP, USFWS, 319, CWMTF
EEP; CGIA
Other watershed information Studies completed by universities; land trust and
other non-profit groups; mitigation banks; local
governments; DOT NEPA documents
(Cumulative Impact Assessments,
Environmental Impact Assessments, or

Environmental Assessments); NC Wildlife
Resources Commission (e.g., NC Wildlife
Action Plan)
Existing projects within the LWP
watershed
NCEEP; mitigation banks; Clean Water
Management Trust Fund; 319 grant funds;
Conservation Reserve Enhancement Program;
local land trusts CGIA= NC Center for Geographic Information and Analysis (http://www.nconemap.com/default.aspx?tabid=286); MRLC=Multi
Resolution Land Characteristics Consortium; EEP=available through EEP; DOT = Available through NC Department of
Transportation GIS website; DCM=NC Division of Coastal Management; FMP=NC Floodplain Mapping Program; DWM=NC
Division of Waste Management; NAIP = National Agriculture Imagery Program; TIP = Transportation Improvement Program.
Table A-3. Factors suggested in WNAT (2003) for evaluating habitat function2,14
Factor used in analysis Data source
Indicators of terrestrial vegetation and physical habitat
Percentage forested Land cover information or other existing
information Percentage agricultural
Percentage developed (including amount
of impervious surface)
Percentage natural composition Extent of vegetation types described in The
Natural Communities of North Carolina
(Schafale and Weakley, 1990)
Sensitive plant species Natural Heritage Program data, including
Threatened and Endangered species and other
species identified by the stakeholder group as
conservation targets
Percentage Significant Natural Heritage
Area
NC Natural Heritage Program GIS data
Floodplain condition FEMA maps combined with land cover
information and incorporating riparian buffer
considerations
Percentage conserved land (including
state and federally owned land)
NC One Map; NC Conservation Planning Tool
Landscape functions (connectivity,
contiguousness, spatial distribution, and
patch size)
NC Conservation Planning Tool; NC Natural
Heritage ProgramLandscape Habitat Indicator
Guilds
Invasive species information Regional lists and resource professionals, with
presence and degree of infestation confirmed
through limited data collection.
Indicators of Terrestrial Animals and Semi-aquatic Animals (upland and riparian)
Habitat types and associated animal
species and guilds
Land cover and existing data; NC Natural
Heritage ProgramLandscape Habitat Indicator
Guilds
Invasive species information Regional lists and resource professionals, with
presence and degree of infestation confirmed

through limited data collection.
Aquatic vegetation and physical components
Vegetation Limited information available for invasive
aquatic species from the Division of Marine
Fisheries and the Division of Water Resources
Rare, Threatened, and Endangered
species habitat
Methods to evaluate substrate composition and
complexity developed by the Steam Functional
Assessment Team
General aquatic habitat DWQ habitat assessment that is conducted when
benthic macroinvertebrates or fish communities
samples are collected; field collection of
additional data for where limited data are
available using EPA’s Rapid Bioassessment
Protocol or DWQ’s habitat protocol.
Aquatic life
RTE species Existing data
Community indicators DWQ benthic macroinvertebrate and fish
community data
DENR = Department of Environment and Natural Resources
Table A-4. Factors suggested in WNAT (2003) for evaluating water quality functions.
15
Table A-5. Factors suggested in WNAT (2003) for evaluating hydrologic functions.
15
Factor used in analysis Data source
Presence of drainage districts Local Soil and Water Conservation Districts
Flood prevention projects N/A
Channel and stream bank modification Aerial imagery; field evaluations
Land use Land cover data sets
Impervious surface extent Land cover data sets
Storm sewer mileage Local government
Floodplain encroachment FEMA mapping
Repetitively flooded structures Local stakeholder input
Impoundments
Land cover data sets; American Rivers dam data
set
Withdrawals
NC Division of Water Resources; local
goverment
Floodplain disconnected from the creek
Landcover data sets; FEMA mapping, field
evaluation
Instream habitat surveys
NCDWQ data; field evaluation using NCDWQ
habitat forms
Growth and development trends (zoning, Census data; local government
Factor used in analysis Data source
Biologic community indicators DWQ benthic macroinvertebrate and fish data
Water and sediment chemistry data DWQ
Land use Impervious cover; forested area
population)
Wetland extent and location NWI; NC CREWS data
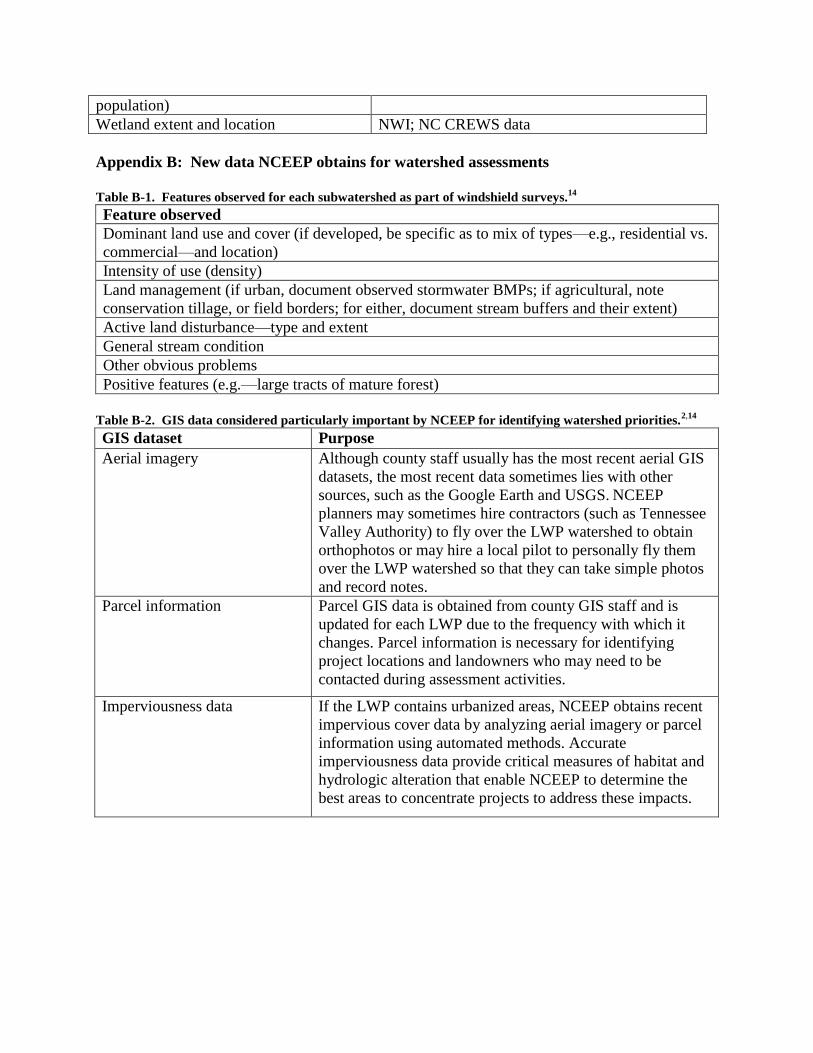
Appendix B: New data NCEEP obtains for watershed assessments
Table B-1. Features observed for each subwatershed as part of windshield surveys.
14
Feature observed
Dominant land use and cover (if developed, be specific as to mix of types—e.g., residential vs.
commercial—and location)
Intensity of use (density)
Land management (if urban, document observed stormwater BMPs; if agricultural, note
conservation tillage, or field borders; for either, document stream buffers and their extent)
Active land disturbance—type and extent
General stream condition
Other obvious problems
Positive features (e.g.—large tracts of mature forest)
Table B-2. GIS data considered particularly important by NCEEP for identifying watershed priorities.
2,14
GIS dataset Purpose
Aerial imagery Although county staff usually has the most recent aerial GIS
datasets, the most recent data sometimes lies with other
sources, such as the Google Earth and USGS. NCEEP
planners may sometimes hire contractors (such as Tennessee
Valley Authority) to fly over the LWP watershed to obtain
orthophotos or may hire a local pilot to personally fly them
over the LWP watershed so that they can take simple photos
and record notes.
Parcel information Parcel GIS data is obtained from county GIS staff and is
updated for each LWP due to the frequency with which it
changes. Parcel information is necessary for identifying
project locations and landowners who may need to be
contacted during assessment activities.
Imperviousness data If the LWP contains urbanized areas, NCEEP obtains recent
impervious cover data by analyzing aerial imagery or parcel
information using automated methods. Accurate
imperviousness data provide critical measures of habitat and
hydrologic alteration that enable NCEEP to determine the
best areas to concentrate projects to address these impacts.

Riparian buffers data Data on the width of riparian buffers is essential for
watershed assessment and project identification because of
the strong influence intact buffers have on in-stream habitat,
bank stability, water quality, and water temperature. NCEEP
measures buffer widths using aerial photographs to classify
buffers as 0 ft, 0-30 ft, 30-100 ft, and >100 ft and avoids
using land use data which can result in imprecise measures
due to large pixel size.
Wetland assessment data,
including Hydric soils, USDA
soil survey wet areas, LiDAR
data, NWI wetlands, NC
floodplain maps, USGS
topographic mapping and
stream layers, NC Coastal
Region Evaluation of Wetland
Significance (NC-CREWS)
data.
To find wetlands in a watershed, NCEEP examines the above
datasets in association with historic and current land use data
and aerial photography. A common indicator it uses for
wetland restoration opportunities is the overlap of hydric
soils with agricultural lands in an area.
Table B-3. Biological community and physical/chemical/toxicological field data collected by NCEEP.
14
Parameter Watershed type Flow Justification
Benthic
Macroinvertebrates
All Baseflow To diagnose overall
watershed functionality at a
point or reach (or of a
tributary)
Fish Community
Assessment
All Baseflow To diagnose overall
watershed functionality at a
point or reach (or of a
tributary)
Field Measures
(dissolved oxygen,
water temperature,
pH, and specific
conductance)
All Both Measured at all sites each
visit for baseline
Turbidity All Stormflow Measured primarily at sites
where sediment and erosion
are issues
Total Residual
Chlorine
Urban Baseflow Measured above and below
known sources such as waste
water treatment plants
Salinity All Both Taken with other field
measurements only at coastal
and estuarine sites as baseline
data
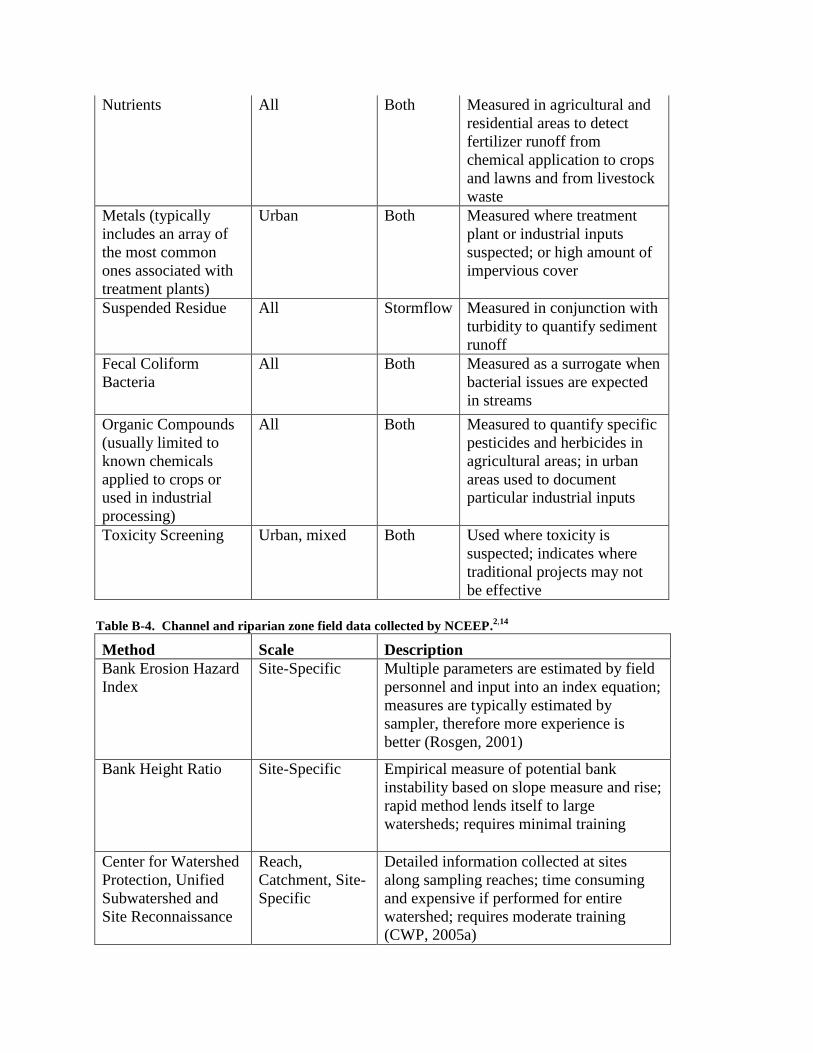
Nutrients All Both Measured in agricultural and
residential areas to detect
fertilizer runoff from
chemical application to crops
and lawns and from livestock
waste
Metals (typically
includes an array of
the most common
ones associated with
treatment plants)
Urban Both Measured where treatment
plant or industrial inputs
suspected; or high amount of
impervious cover
Suspended Residue All Stormflow Measured in conjunction with
turbidity to quantify sediment
runoff
Fecal Coliform
Bacteria
All Both Measured as a surrogate when
bacterial issues are expected
in streams
Organic Compounds
(usually limited to
known chemicals
applied to crops or
used in industrial
processing)
All Both Measured to quantify specific
pesticides and herbicides in
agricultural areas; in urban
areas used to document
particular industrial inputs
Toxicity Screening Urban, mixed Both Used where toxicity is
suspected; indicates where
traditional projects may not
be effective
Table B-4. Channel and riparian zone field data collected by NCEEP.
2,14
Method Scale Description
Bank Erosion Hazard
Index
Site-Specific Multiple parameters are estimated by field
personnel and input into an index equation;
measures are typically estimated by
sampler, therefore more experience is
better (Rosgen, 2001)
Bank Height Ratio Site-Specific Empirical measure of potential bank
instability based on slope measure and rise;
rapid method lends itself to large
watersheds; requires minimal training
Center for Watershed
Protection, Unified
Subwatershed and
Site Reconnaissance
Reach,
Catchment, Site-
Specific
Detailed information collected at sites
along sampling reaches; time consuming
and expensive if performed for entire
watershed; requires moderate training
(CWP, 2005a)

Center for Watershed
Protection, Unified
Stream Assessment
Subwatershed
Detailed information collected at sites
along sampling reaches; time consuming
and expensive if performed for entire
watershed; requires moderate training
(CWP, 2005a)
Natural Resources
Conservation Service,
Stream Visual
Assessment Protocol
Reach,
Catchment
Multiple parameters are each rated
according to a uniform numerical scale
with detailed descriptions; method requires
moderate training but more experience is
better (USDA, 1998)
Eastern Carolina
University, Coastal
Riparian Assessment
Methodology
Reach,
Subwatershed
A reference-based method developed for
the inner coastal plain. Assesses 100 yd
reaches, observing 9 indicators that are
aggregated logically into scores reflective
of the current understanding between
indicators and ecosystem function for the
riparian zone (Rheinhardt et al., 2005)
NC Division of Water
Quality, Habitat
Assessment
Reach Data collected by DWQ during biological
assessments; estimates measures related to
instream and riparian habitat within the
sampling reach; requires minimal training
(NCDWQ, 2001)
Table B-5. Watershed models used by NCEEP to understand hydrologic and water quality functions for
various LWP analyses where available data on the impacts of a stressor is sparse.14
Model Purpose Example LWP
Model for
Stormwater
Improvement
Conceptualization
(MUSIC)
Evaluate pollutant removal effectiveness
of stormwater BMPs
Fishing Creek
LWP; Middle Tar
Pam LWP; Little
River & Bledsoe
Creek LWP
Various pollutant
loading models
Estimates of TSS, BOD, total N, total P
from specific land uses
Pasquotank LWP;
Upper Swift Creek
LWP; White Oak
LWP
Spreadsheet Tool for
Estimating Pollutant
Load (STEP-L)
Evaluate pollutant removal performance
of stream projects and BMPs
Indian and
Howards Creek
LWP
GIS Pollutant Load
(PLOAD)
Predict annual runoff and pollutant
concentrations under various scenarios
Lockwoods Folly
LWP
SWAT (Soil &
Water Assessment
Tool)
Sediment and nutrient loading estimates
determined to assess landuse impacts to
water quality and provide baseline
estimate of watershed conditions
Middle Cape Fear
LWP

Loading Simulation
Program in C+
(LSPC)
Address urban and rural watershed
hydrology, surface water quality analysis
and pollutant decay and transformation
Swift Creek LWP
Modeling System
Unified Stormwater
Treatment Model
(USTM)
Evaluate pollutant removal effectiveness
of stormwater BMPs
Little River &
Bledsoe Creek
LWP
Watershed
Management Model
(WMM)
Estimate event mean concentrations
based on land use/cover; existing and
future land use scenarios
Upper Rocky River
& Clarke Creek
LWP
HEC-HMS Conduct stream stability assessments Troublesome &
Little Troublesome
Creek LWP
HEC-RAS Conduct stream stability assessments Troublesome &
Little Troublesome
Creek LWP
EUTROMOD Predicted sediment trapping and nutrient
loadings in local lakes
Troublesome &
Little Troublesome
Creek LWP
USGS Sparrow Estimate the portion of nutrient load
delivered from subwatersheds for
existing and buildout conditions
Morgan & Little
Creek LWP
Generalized
Watershed Loading
Function (GWLF)
Assess contribution of upland sediment
and nutrient loads under existing and
buildout scenarios
Morgan & Little
Creek LWP; Rocky
River LWP
USLE combined
with spreadsheet
model
Determine sediment and nutrient loading
sources
Peachtree-Martins
Creek LWP