normalising automobile trade between india and pakistanindiapakistantrade.org/events/21_22_1_2014/b...
TRANSCRIPT
Normalising Automobile Trade between
India and Pakistan: Concerns and Way Forward
Paper presented at
Annual Conference
Normalizing India-Pakistan Trade
21-22 January, 2014
Organised by ICRIER, New Delhi
BISWAJIT NAG Indian Institute of Foreign Trade,
New Delhi

Background • India Pakistan trade has a chequered history
• Both the countries joined WTO in 1995 and India offered MFN status
to Pakistan in 1996. On the contrary, Pakistan allows import from
India on the basis of a ‘Positive List’.
• Until 2011, Pakistan allowed through ‘Positive List’ only 1,946 items
to be imported from India.
• In November 2011, Pakistan decided to accord MFN status to India
and in March 2012, it shifted to a ‘Negative List’ .
• Currently, Pakistan’s Negative List comprises of 1,209 items which
are not allowed to import from India.
• This is also important to note that only 137 items are declared as
importable from India through the Wagah land border crossing.
• Since last couple of years, the total trade between these two
countries have crossed US$2 billion mark and in 2012-13, it has
touched US$2.4 billion. Pakistan’s exports increased by 28% and for
India the increase was of 19%.
0
50
100
150
200
250
Import
Export
0
200
400
600
800
1000
1200
1400
1600
1800
2000
Import
Export
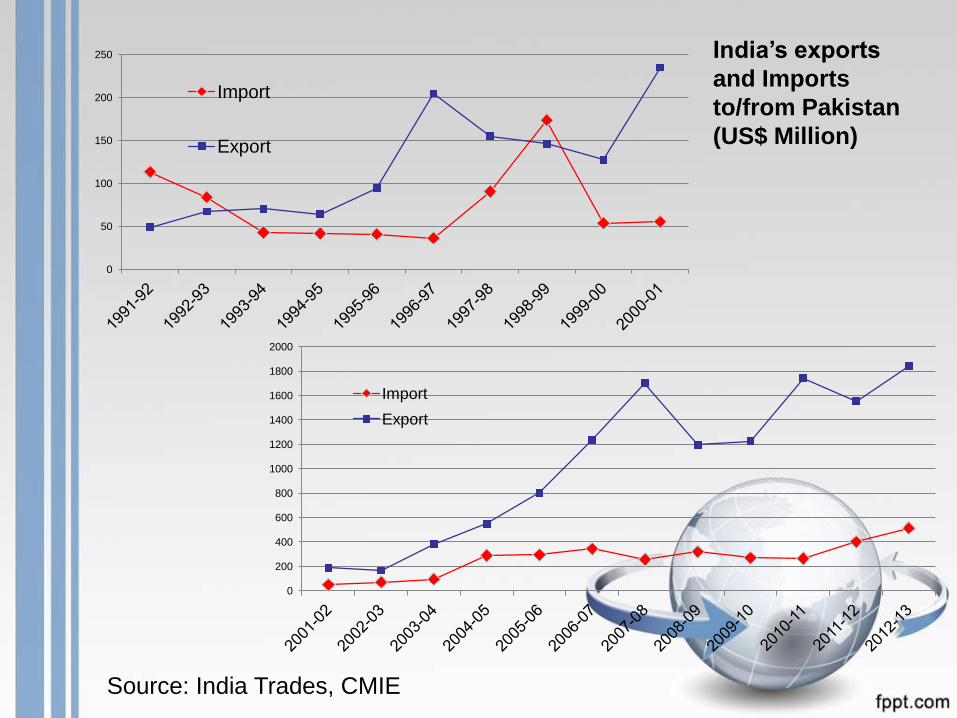
India’s exports
and Imports
to/from Pakistan
(US$ Million)
Source: India Trades, CMIE
Negative List and Automobile Industry
• It is important to note that India’s automotive industry is unable to
export because most automotive components (385 under HS8 or
167 under HS6) are still under negative list of Pakistan.
• There is a significant growth in Pakistani automotive market in
recent time. With the normalisation of trade there is a scope of
increasing exports from India to Pakistan.
• Also, Pakistan has gained comparative advantage in some
components too and they are interested to export to India.
• There is large scale misconception about the prospect due to lack of
past data.
• Communication gap among the manufacturers both side has also
added fuel in this. As a result, automobile sector has remained as
one of the main stumbling blocks for normalising the trade relation
between India and Pakistan.
Automobile industry in Pakistan
• Car industry saw a major boom during 2006-07 when sales figure
touched 180,834.
• However, since then industry is struggling to reach the same level.
During 2012-13, total car sales have been around 120,332.
• The total contribution of Auto industry to GDP in 2007 was 2.8% and
it was expected the it would rise to 5.6% by 2012.
• There are 32 assemblers including multinationals with their equity
participation engaged in progressive manufacturing / assembling of
different automobiles under the approved deletion program of the
Ministry of Industries and Production, Government of Pakistan. There
are also more than 50 assemblers/manufacturers of motorcycles and
three wheelers.
• There are also 500 auto-parts manufacturers in the country that supply
parts to original equipment manufacturers.
• During 2007, auto sector contributed 16% to the manufacturing sector
which was expected to increase 25% by 2014. The figure was mere
6.7% during 2001-02. Vehicles’ manufacturers directly employ over
192,000 people with a total investment of over $ 1.5 billion
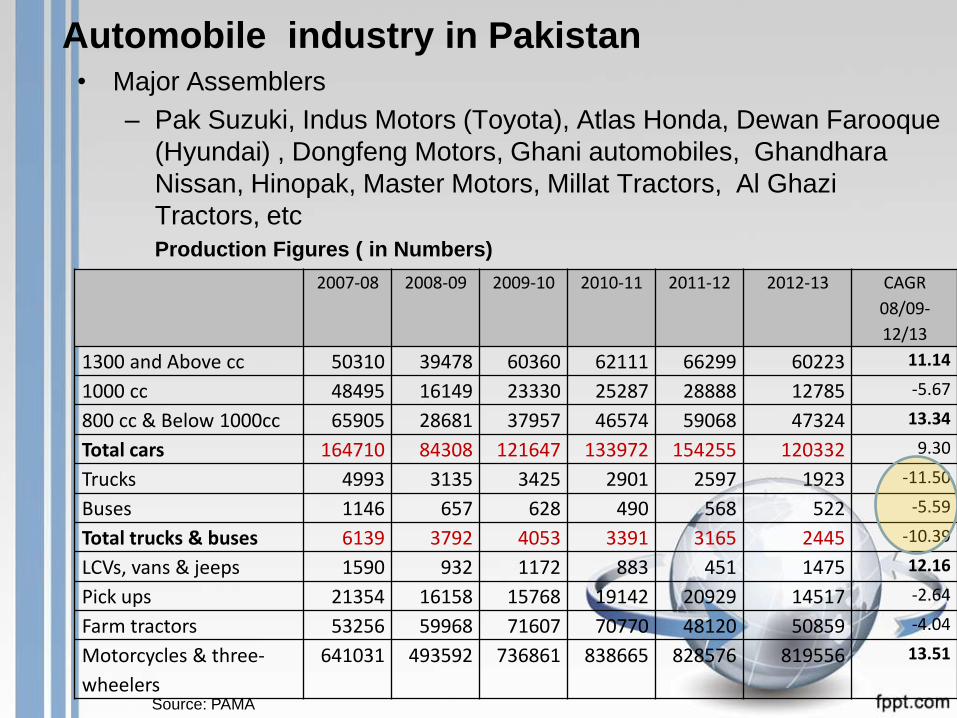
Automobile industry in Pakistan • Major Assemblers
– Pak Suzuki, Indus Motors (Toyota), Atlas Honda, Dewan Farooque
(Hyundai) , Dongfeng Motors, Ghani automobiles, Ghandhara
Nissan, Hinopak, Master Motors, Millat Tractors, Al Ghazi
Tractors, etc
Production Figures ( in Numbers)
2007-08 2008-09 2009-10 2010-11 2011-12 2012-13 CAGR
08/09-
12/13
1300 and Above cc 50310 39478 60360 62111 66299 60223 11.14
1000 cc 48495 16149 23330 25287 28888 12785 -5.67
800 cc & Below 1000cc 65905 28681 37957 46574 59068 47324 13.34
Total cars 164710 84308 121647 133972 154255 120332 9.30
Trucks 4993 3135 3425 2901 2597 1923 -11.50
Buses 1146 657 628 490 568 522 -5.59
Total trucks & buses 6139 3792 4053 3391 3165 2445 -10.39
LCVs, vans & jeeps 1590 932 1172 883 451 1475 12.16
Pick ups 21354 16158 15768 19142 20929 14517 -2.64
Farm tractors 53256 59968 71607 70770 48120 50859 -4.04
Motorcycles & three-
wheelers
641031 493592 736861 838665 828576 819556 13.51
Source: PAMA
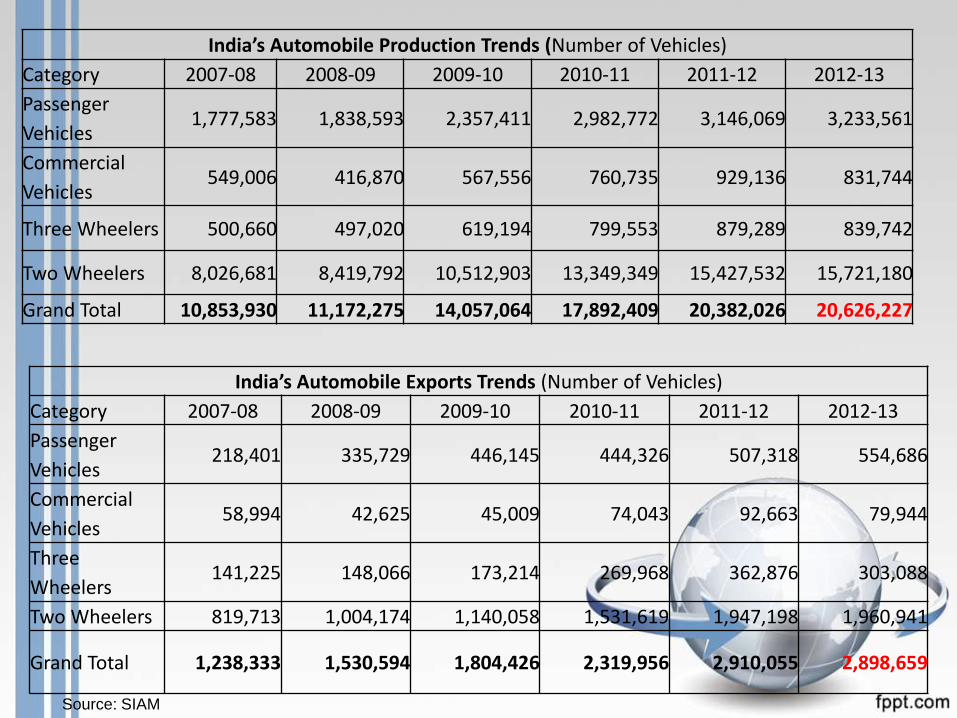
India’s Automobile Exports Trends (Number of Vehicles)
Category 2007-08 2008-09 2009-10 2010-11 2011-12 2012-13
Passenger
Vehicles 218,401 335,729 446,145 444,326 507,318 554,686
Commercial
Vehicles 58,994 42,625 45,009 74,043 92,663 79,944
Three
Wheelers 141,225 148,066 173,214 269,968 362,876 303,088
Two Wheelers 819,713 1,004,174 1,140,058 1,531,619 1,947,198 1,960,941
Grand Total 1,238,333 1,530,594 1,804,426 2,319,956 2,910,055 2,898,659
India’s Automobile Production Trends (Number of Vehicles)
Category 2007-08 2008-09 2009-10 2010-11 2011-12 2012-13
Passenger
Vehicles 1,777,583 1,838,593 2,357,411 2,982,772 3,146,069 3,233,561
Commercial
Vehicles 549,006 416,870 567,556 760,735 929,136 831,744
Three Wheelers 500,660 497,020 619,194 799,553 879,289 839,742
Two Wheelers 8,026,681 8,419,792 10,512,903 13,349,349 15,427,532 15,721,180
Grand Total 10,853,930 11,172,275 14,057,064 17,892,409 20,382,026 20,626,227
Source: SIAM
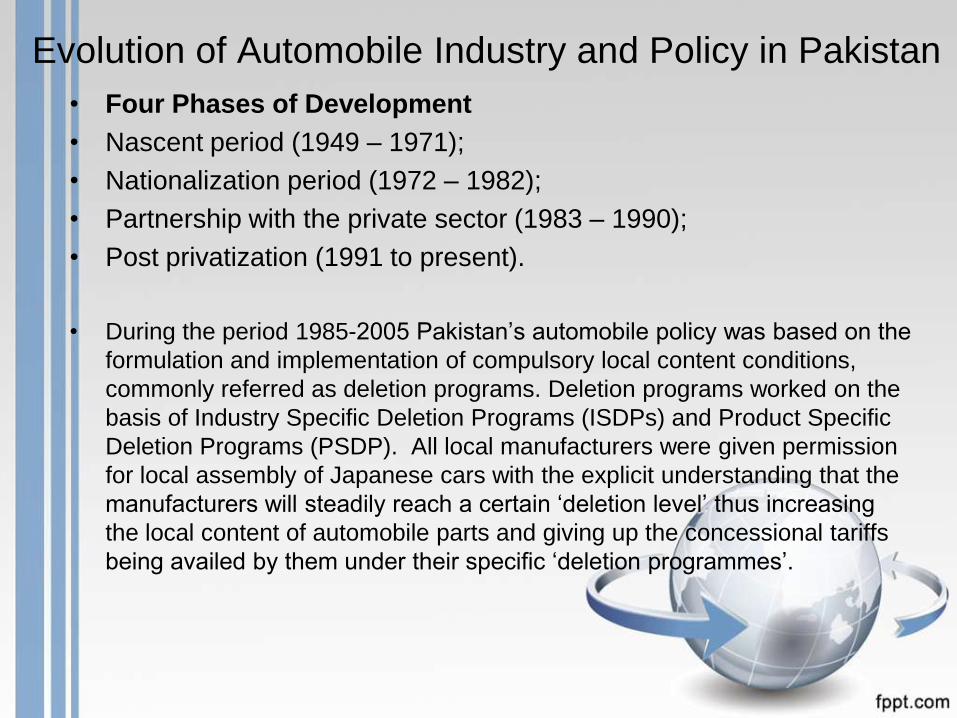
Evolution of Automobile Industry and Policy in Pakistan
• Four Phases of Development
• Nascent period (1949 – 1971);
• Nationalization period (1972 – 1982);
• Partnership with the private sector (1983 – 1990);
• Post privatization (1991 to present).
• During the period 1985-2005 Pakistan’s automobile policy was based on the
formulation and implementation of compulsory local content conditions,
commonly referred as deletion programs. Deletion programs worked on the
basis of Industry Specific Deletion Programs (ISDPs) and Product Specific
Deletion Programs (PSDP). All local manufacturers were given permission
for local assembly of Japanese cars with the explicit understanding that the
manufacturers will steadily reach a certain ‘deletion level’ thus increasing
the local content of automobile parts and giving up the concessional tariffs
being availed by them under their specific ‘deletion programmes’.
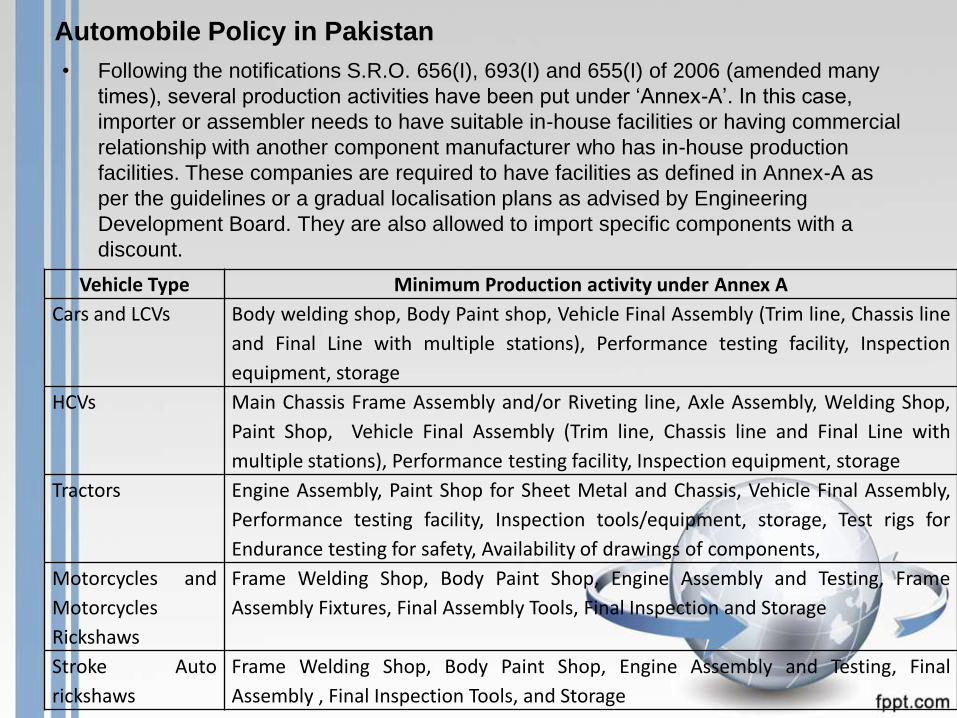
Automobile Policy in Pakistan
• Following the notifications S.R.O. 656(I), 693(I) and 655(I) of 2006 (amended many
times), several production activities have been put under ‘Annex-A’. In this case,
importer or assembler needs to have suitable in-house facilities or having commercial
relationship with another component manufacturer who has in-house production
facilities. These companies are required to have facilities as defined in Annex-A as
per the guidelines or a gradual localisation plans as advised by Engineering
Development Board. They are also allowed to import specific components with a
discount.
Vehicle Type Minimum Production activity under Annex A
Cars and LCVs Body welding shop, Body Paint shop, Vehicle Final Assembly (Trim line, Chassis line
and Final Line with multiple stations), Performance testing facility, Inspection
equipment, storage
HCVs Main Chassis Frame Assembly and/or Riveting line, Axle Assembly, Welding Shop,
Paint Shop, Vehicle Final Assembly (Trim line, Chassis line and Final Line with
multiple stations), Performance testing facility, Inspection equipment, storage
Tractors Engine Assembly, Paint Shop for Sheet Metal and Chassis, Vehicle Final Assembly,
Performance testing facility, Inspection tools/equipment, storage, Test rigs for
Endurance testing for safety, Availability of drawings of components,
Motorcycles and
Motorcycles
Rickshaws
Frame Welding Shop, Body Paint Shop, Engine Assembly and Testing, Frame
Assembly Fixtures, Final Assembly Tools, Final Inspection and Storage
Stroke Auto
rickshaws
Frame Welding Shop, Body Paint Shop, Engine Assembly and Testing, Final
Assembly , Final Inspection Tools, and Storage
Evolution of Automobile Industry and Policy in Pakistan
• In 2006, Pakistan shifted to ‘tariff based’ system to protect the nascent
component industry and also uphold localisation strategy. It did not matter
much to the assemblers but has posed many challenges to the vendors who
remained comfortable in the previous system and are now pushed to
improve the quality, supply systems, shop floor efficiencies and better
marketing. This is because; importers can import many components even
paying higher duties.
• However, due to the robust strategy the rate of localisation was significant
especially for tractors and motorcycles. As per current information from
PAAPAM, for tractors localisation has reached almost 95% and in case of
motorcycles it has reached between 90-92%. But in case of cars,
localisation level is still less than 70%.
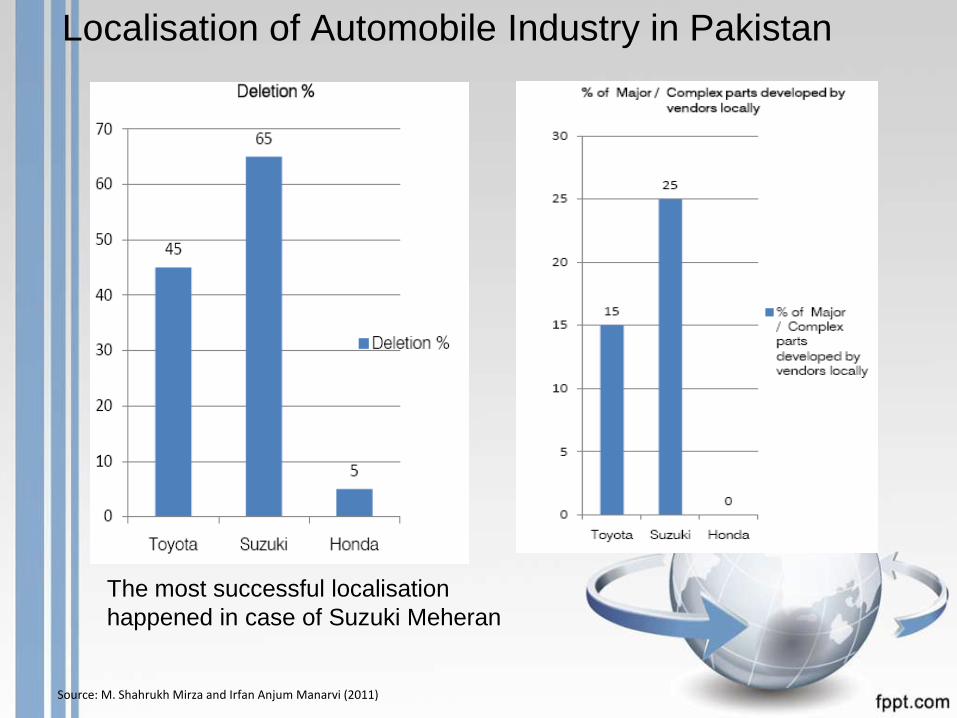
Localisation of Automobile Industry in Pakistan
Source: M. Shahrukh Mirza and Irfan Anjum Manarvi (2011)
The most successful localisation
happened in case of Suzuki Meheran

Localisation of Automobile Industry in Pakistan
Source: M. Shahrukh Mirza and Irfan Anjum Manarvi (2011)
Japanese supports the technology transfer directly to local vendors through parts, drawings and process sheets. However, in absence of good infrastructure and manufacturing facility at the SME level, Japanese companies have not been very successful in providing technological assistance to local companies. Along with this, the absence of adequate Quality Control Standards and lack of competition at the vendor front have resulted in deteriorating quality of final products Due to non availability of expensive quality control equipment, many of the precision safety components are imported. Some companies have the opinion that non availability of R&D facilities in automobile industry, lack of highly skilled manpower and well developed infrastructure are the main hindrance for the indigenous development of the component sector.
Localisation of Automobile Industry in Pakistan
Source: M. Shahrukh Mirza and Irfan Anjum Manarvi (2011)
This indicates that only ‘deletion programme’ is not sufficient for localisation of component industry. Automobile industry is very dynamic. Consumer choice, comfort and safety, design, IT driven accessories, etc are driving the industry. Government requires to encourage the development of R&D centres, schools for advanced learning of auto technology, development of quality control instruments which create an enabling environment for the component industry to grow. Apart from this, competitions among component manufacturers are also important to drive local innovation. It seems Pakistan has achieved some level of localisation but it lacks capability to move to the next level of value addition. As a result, the entire industry is stuck to only few models and consumers are unable to have wider choice.
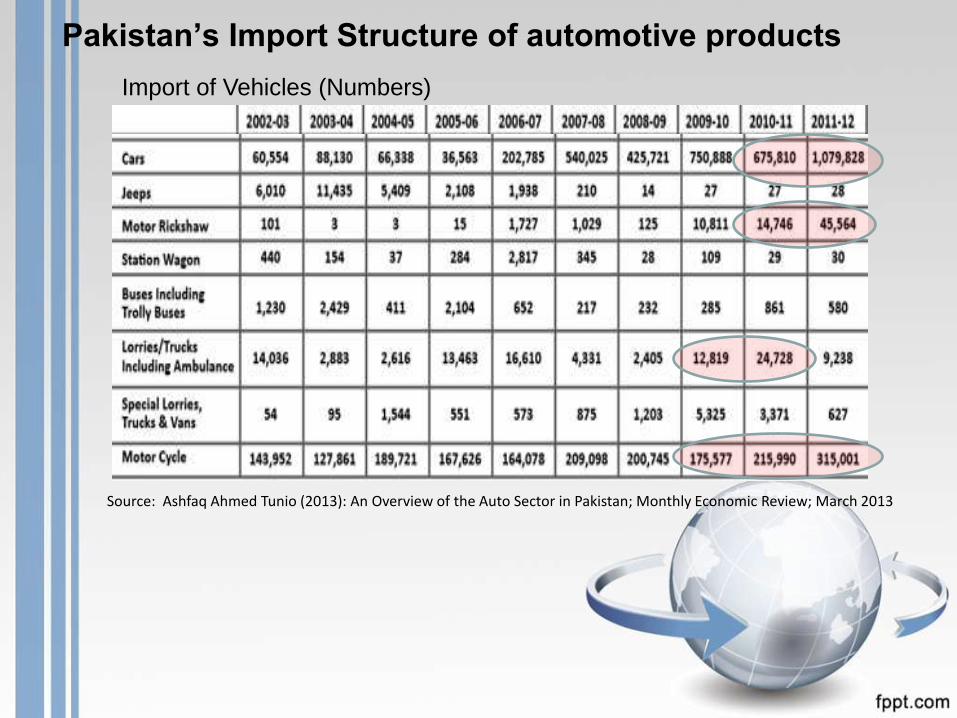
Pakistan’s Import Structure of automotive products
Import of Vehicles (Numbers)
Source: Ashfaq Ahmed Tunio (2013): An Overview of the Auto Sector in Pakistan; Monthly Economic Review; March 2013
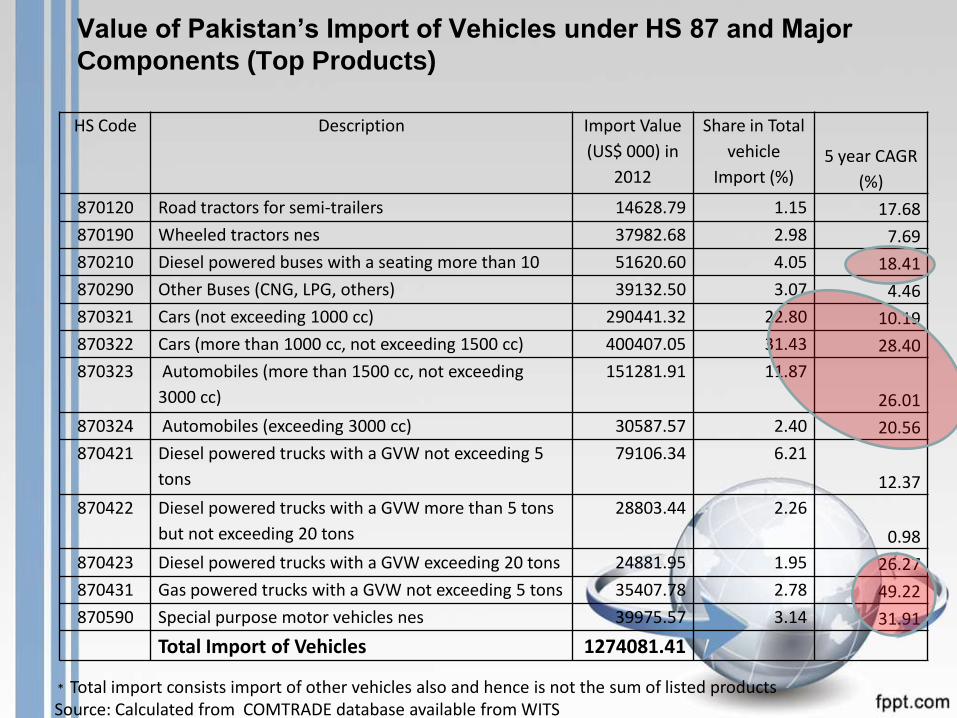
Value of Pakistan’s Import of Vehicles under HS 87 and Major
Components (Top Products)
HS Code Description Import Value
(US$ 000) in
2012
Share in Total
vehicle
Import (%) 5 year CAGR
(%)
870120 Road tractors for semi-trailers 14628.79 1.15 17.68
870190 Wheeled tractors nes 37982.68 2.98 7.69
870210 Diesel powered buses with a seating more than 10 51620.60 4.05 18.41
870290 Other Buses (CNG, LPG, others) 39132.50 3.07 4.46
870321 Cars (not exceeding 1000 cc) 290441.32 22.80 10.19
870322 Cars (more than 1000 cc, not exceeding 1500 cc) 400407.05 31.43 28.40
870323 Automobiles (more than 1500 cc, not exceeding
3000 cc)
151281.91 11.87
26.01
870324 Automobiles (exceeding 3000 cc) 30587.57 2.40 20.56
870421 Diesel powered trucks with a GVW not exceeding 5
tons
79106.34 6.21
12.37
870422 Diesel powered trucks with a GVW more than 5 tons
but not exceeding 20 tons
28803.44 2.26
0.98
870423 Diesel powered trucks with a GVW exceeding 20 tons 24881.95 1.95 26.27
870431 Gas powered trucks with a GVW not exceeding 5 tons 35407.78 2.78 49.22
870590 Special purpose motor vehicles nes 39975.57 3.14 31.91
Total Import of Vehicles 1274081.41
* Total import consists import of other vehicles also and hence is not the sum of listed products Source: Calculated from COMTRADE database available from WITS
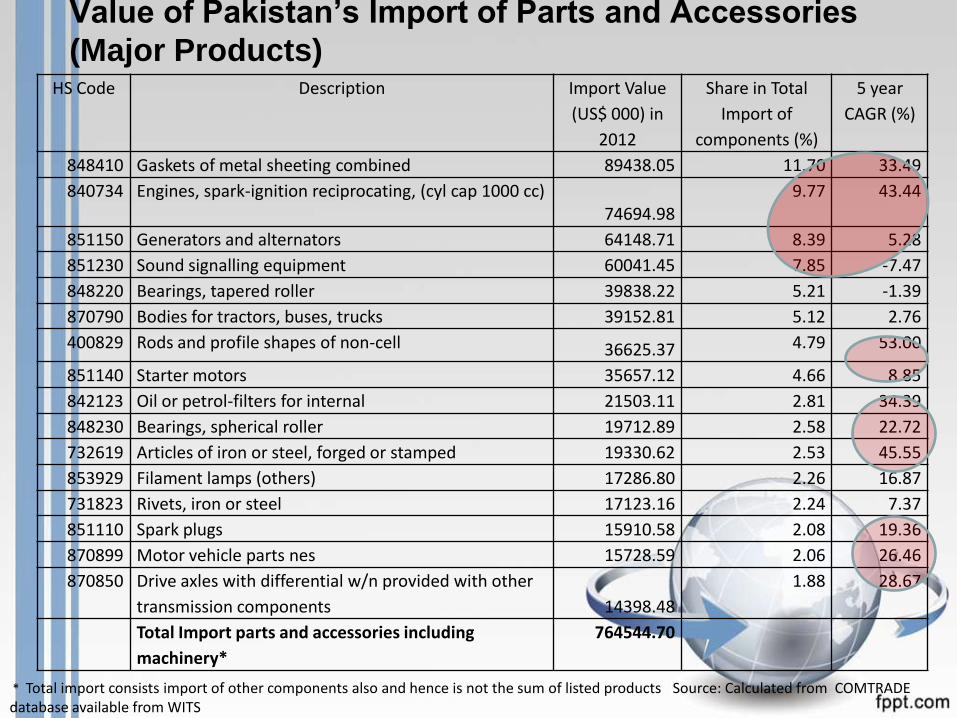
Value of Pakistan’s Import of Parts and Accessories
(Major Products)
HS Code Description Import Value
(US$ 000) in
2012
Share in Total
Import of
components (%)
5 year
CAGR (%)
848410 Gaskets of metal sheeting combined 89438.05 11.70 33.49
840734 Engines, spark-ignition reciprocating, (cyl cap 1000 cc) 74694.98
9.77 43.44
851150 Generators and alternators 64148.71 8.39 5.28
851230 Sound signalling equipment 60041.45 7.85 -7.47
848220 Bearings, tapered roller 39838.22 5.21 -1.39
870790 Bodies for tractors, buses, trucks 39152.81 5.12 2.76
400829 Rods and profile shapes of non-cell 36625.37 4.79 53.00
851140 Starter motors 35657.12 4.66 8.85
842123 Oil or petrol-filters for internal 21503.11 2.81 34.39
848230 Bearings, spherical roller 19712.89 2.58 22.72
732619 Articles of iron or steel, forged or stamped 19330.62 2.53 45.55
853929 Filament lamps (others) 17286.80 2.26 16.87
731823 Rivets, iron or steel 17123.16 2.24 7.37
851110 Spark plugs 15910.58 2.08 19.36
870899 Motor vehicle parts nes 15728.59 2.06 26.46
870850 Drive axles with differential w/n provided with other
transmission components 14398.48
1.88 28.67
Total Import parts and accessories including
machinery*
764544.70
* Total import consists import of other components also and hence is not the sum of listed products Source: Calculated from COMTRADE database available from WITS
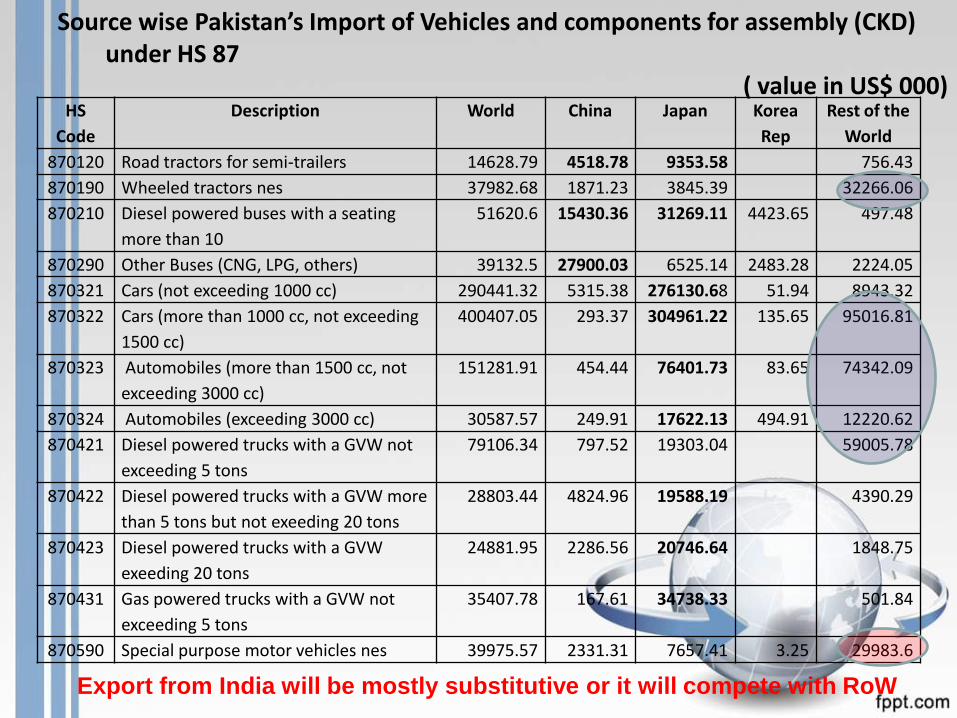
HS
Code
Description World China Japan Korea
Rep
Rest of the
World
870120 Road tractors for semi-trailers 14628.79 4518.78 9353.58 756.43
870190 Wheeled tractors nes 37982.68 1871.23 3845.39 32266.06
870210 Diesel powered buses with a seating
more than 10
51620.6 15430.36 31269.11 4423.65 497.48
870290 Other Buses (CNG, LPG, others) 39132.5 27900.03 6525.14 2483.28 2224.05
870321 Cars (not exceeding 1000 cc) 290441.32 5315.38 276130.68 51.94 8943.32
870322 Cars (more than 1000 cc, not exceeding
1500 cc)
400407.05 293.37 304961.22 135.65 95016.81
870323 Automobiles (more than 1500 cc, not
exceeding 3000 cc)
151281.91 454.44 76401.73 83.65 74342.09
870324 Automobiles (exceeding 3000 cc) 30587.57 249.91 17622.13 494.91 12220.62
870421 Diesel powered trucks with a GVW not
exceeding 5 tons
79106.34 797.52 19303.04 59005.78
870422 Diesel powered trucks with a GVW more
than 5 tons but not exeeding 20 tons
28803.44 4824.96 19588.19 4390.29
870423 Diesel powered trucks with a GVW
exeeding 20 tons
24881.95 2286.56 20746.64 1848.75
870431 Gas powered trucks with a GVW not
exceeding 5 tons
35407.78 167.61 34738.33 501.84
870590 Special purpose motor vehicles nes 39975.57 2331.31 7657.41 3.25 29983.6
Source wise Pakistan’s Import of Vehicles and components for assembly (CKD) under HS 87
( value in US$ 000)
Export from India will be mostly substitutive or it will compete with RoW
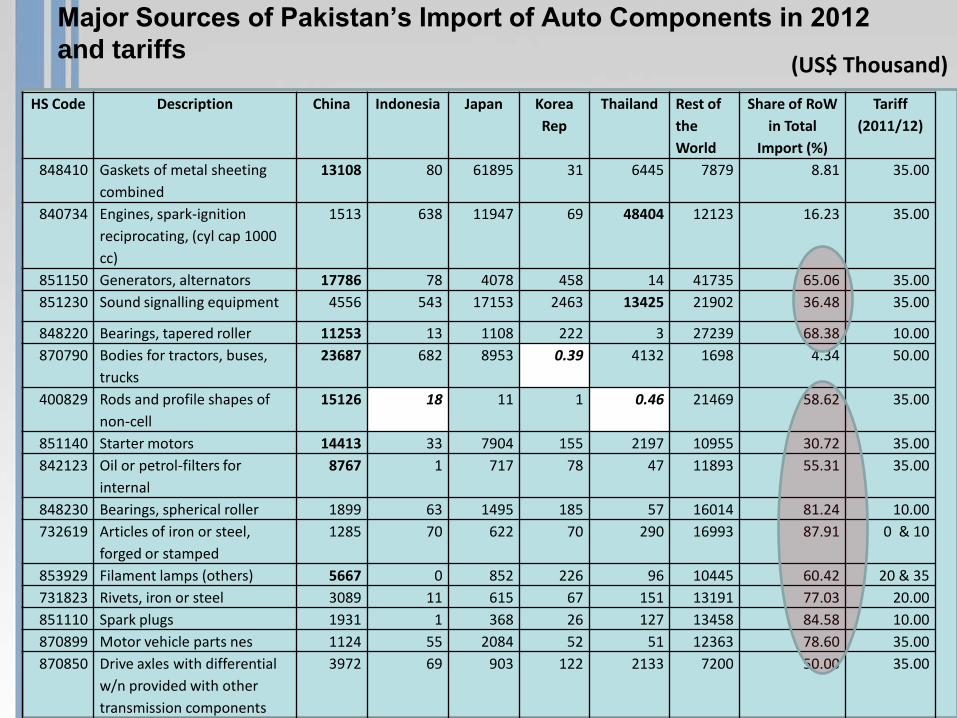
Major Sources of Pakistan’s Import of Auto Components in 2012
and tariffs
HS Code Description China Indonesia Japan Korea
Rep
Thailand Rest of
the
World
Share of RoW
in Total
Import (%)
Tariff
(2011/12)
848410 Gaskets of metal sheeting
combined
13108 80 61895 31 6445 7879 8.81 35.00
840734 Engines, spark-ignition
reciprocating, (cyl cap 1000
cc)
1513 638 11947 69 48404 12123 16.23 35.00
851150 Generators, alternators 17786 78 4078 458 14 41735 65.06 35.00
851230 Sound signalling equipment 4556 543 17153 2463 13425 21902 36.48 35.00
848220 Bearings, tapered roller 11253 13 1108 222 3 27239 68.38 10.00
870790 Bodies for tractors, buses,
trucks
23687 682 8953 0.39 4132 1698 4.34 50.00
400829 Rods and profile shapes of
non-cell
15126 18 11 1 0.46 21469 58.62 35.00
851140 Starter motors 14413 33 7904 155 2197 10955 30.72 35.00
842123 Oil or petrol-filters for
internal
8767 1 717 78 47 11893 55.31 35.00
848230 Bearings, spherical roller 1899 63 1495 185 57 16014 81.24 10.00
732619 Articles of iron or steel,
forged or stamped
1285 70 622 70 290 16993 87.91 0 & 10
853929 Filament lamps (others) 5667 0 852 226 96 10445 60.42 20 & 35
731823 Rivets, iron or steel 3089 11 615 67 151 13191 77.03 20.00
851110 Spark plugs 1931 1 368 26 127 13458 84.58 10.00
870899 Motor vehicle parts nes 1124 55 2084 52 51 12363 78.60 35.00
870850 Drive axles with differential
w/n provided with other
transmission components
3972 69 903 122 2133 7200 50.00 35.00
(US$ Thousand)
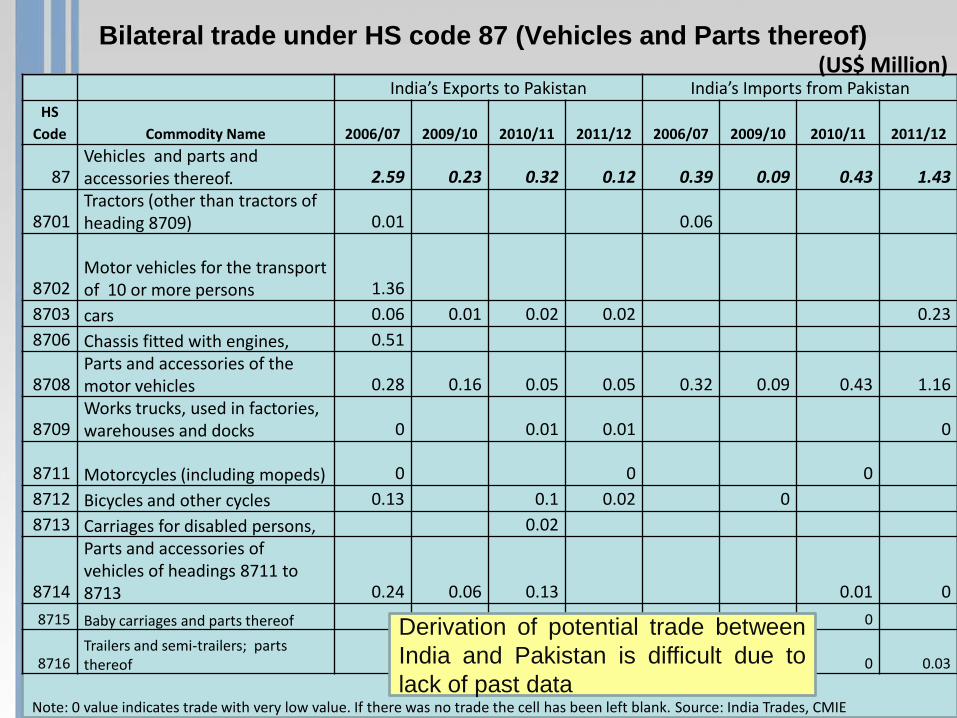
Bilateral trade under HS code 87 (Vehicles and Parts thereof)
(US$ Million) India’s Exports to Pakistan India’s Imports from Pakistan
HS
Code Commodity Name 2006/07 2009/10 2010/11 2011/12 2006/07 2009/10 2010/11 2011/12
87 Vehicles and parts and accessories thereof. 2.59 0.23 0.32 0.12 0.39 0.09 0.43 1.43
8701 Tractors (other than tractors of heading 8709) 0.01 0.06
8702 Motor vehicles for the transport of 10 or more persons 1.36
8703 cars 0.06 0.01 0.02 0.02 0.23
8706 Chassis fitted with engines, 0.51
8708 Parts and accessories of the motor vehicles 0.28 0.16 0.05 0.05 0.32 0.09 0.43 1.16
8709 Works trucks, used in factories, warehouses and docks 0 0.01 0.01 0
8711 Motorcycles (including mopeds) 0 0 0
8712 Bicycles and other cycles 0.13 0.1 0.02 0
8713 Carriages for disabled persons, 0.02
8714
Parts and accessories of vehicles of headings 8711 to 8713 0.24 0.06 0.13 0.01 0
8715 Baby carriages and parts thereof 0
8716 Trailers and semi-trailers; parts thereof 0 0.03
Note: 0 value indicates trade with very low value. If there was no trade the cell has been left blank. Source: India Trades, CMIE
Derivation of potential trade between
India and Pakistan is difficult due to
lack of past data
Critical Issues from Pakistan
• There is a fear that the increased imports from India will have a
major negative impact on Pakistani domestic industry.
• Automobile consists of large number of SMEs which also provide
employment to thousands of people and hence the fear is genuine.
• Pakistani industry is also divided into two groups: in favour or
against of opening to India
• Pak Suzuki is in favour as Suzuki has large set up in India.
• Indus Motors take up a balanced view and favour a both way trade
• Atlas Honda wants to protect domestic motorcycle industry and
wants to export to India
• Why Import cars and components from India: Proximity, advantage of
large economies of scale and thereby low price of components, cultural
similarity thereby reduces the cost of adaptation and R&D, etc.
• By changing source of automobile components from Japan and Thailand to
India, Pakistan can save substantial amount of foreign exchange. This is
important to note that the cost of importing from Japan got almost doubled
in last five years due to depreciation of Pakistani Rupee against Japanese
Yen.
Critical Issues from Pakistan
• It is reported that Indus has requested Toyota Headquarters to equally
support both of its affiliates in India and Pakistan because some car
components of Toyota cars are cheap in Pakistan and some are cheap in
India. So, both of Toyota affiliates will grow if they collaborate with each
other. For example, Toyota is now producing critical components of cars
such as Etios, Innova, Fortuner in India which is expectedly less costly than
those from Japan and Thailand. Importing from India to Pakistan will
definitely reduce the price of the final car. Indus is interested to export to
India few products such as special type of sheet metals, chemicals for
paints, etc.
• One of the major issues is the difference of environmental standards
between India and Pakistan. To export to India, Pakistan has to convert its
vehicles to Euro/Bharat IV standards.
• Atlas has raised concern about the uniqueness of emission standards
related to Indian motorcycles.
• India follows a joint emission level corresponding to HC and NOx. Also, it
follows India Drive Cycle (IDC) following driving norms in India not the
WMTC which is practiced in developed economies. Atlas finds this as a
major NTB from Indian side. This is important to note that India has recently
made testing under WMTC optional and it is informed that it would be
mandatory in couple of year’s time.
Critical Issues from Pakistan
• Pakistan is in favour of FDI in HCV sector and Indian companies such as
Tata, Mahindra may look for opportunities.
• Tractor manufacturers such as Millat are interested to export to India.
However, more studies are required to understand the nature of NTBs
imposed on tractor imports in India as the apprehension of NTBs (emission
and homologation related) affecting tractor export from Pakistan is widely
present.
• Pakistani manufacturers are also concerned about the layers of centre and
state taxes levied in India. This is important to note none of these are
country specific barriers and hence, both countries are required to find out
practical solution to handle these policy issue.
Critical Issues from Pakistan
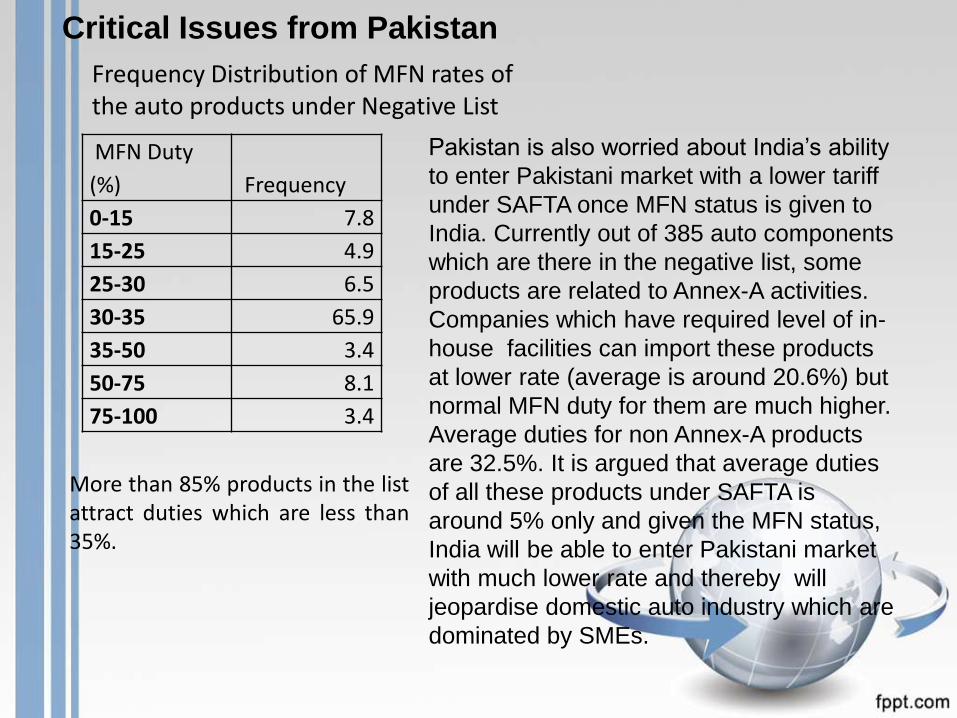
MFN Duty
(%) Frequency
0-15 7.8
15-25 4.9
25-30 6.5
30-35 65.9
35-50 3.4
50-75 8.1
75-100 3.4
Frequency Distribution of MFN rates of the auto products under Negative List
More than 85% products in the list attract duties which are less than 35%.
Pakistan is also worried about India’s ability
to enter Pakistani market with a lower tariff
under SAFTA once MFN status is given to
India. Currently out of 385 auto components
which are there in the negative list, some
products are related to Annex-A activities.
Companies which have required level of in-
house facilities can import these products
at lower rate (average is around 20.6%) but
normal MFN duty for them are much higher.
Average duties for non Annex-A products
are 32.5%. It is argued that average duties
of all these products under SAFTA is
around 5% only and given the MFN status,
India will be able to enter Pakistani market
with much lower rate and thereby will
jeopardise domestic auto industry which are
dominated by SMEs.
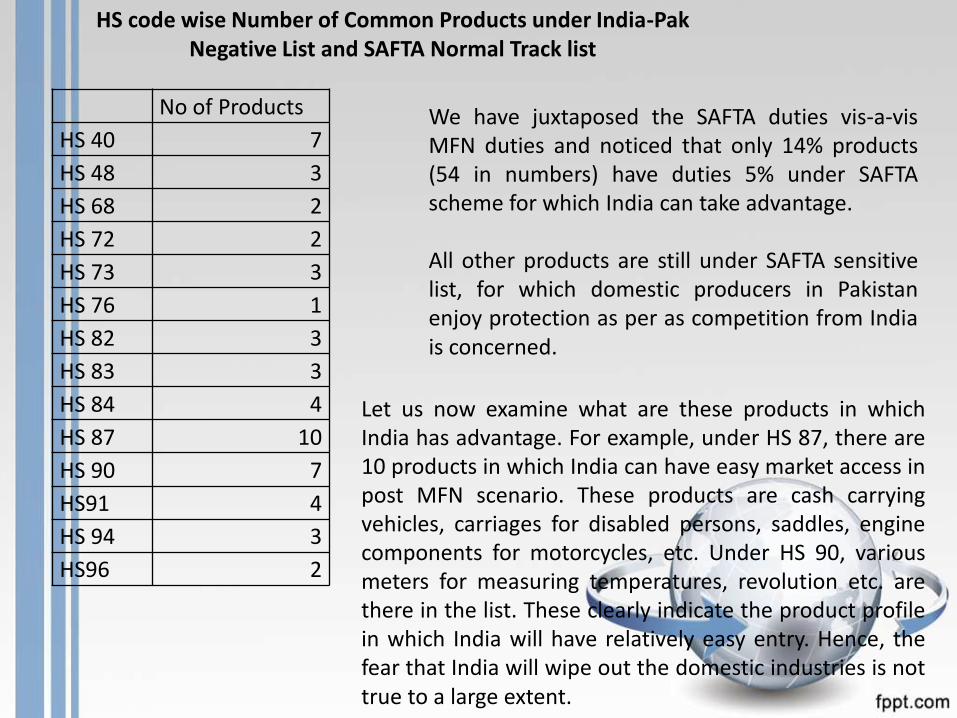
No of Products
HS 40 7
HS 48 3
HS 68 2
HS 72 2
HS 73 3
HS 76 1
HS 82 3
HS 83 3
HS 84 4
HS 87 10
HS 90 7
HS91 4
HS 94 3
HS96 2
HS code wise Number of Common Products under India-Pak Negative List and SAFTA Normal Track list
We have juxtaposed the SAFTA duties vis-a-vis MFN duties and noticed that only 14% products (54 in numbers) have duties 5% under SAFTA scheme for which India can take advantage. All other products are still under SAFTA sensitive list, for which domestic producers in Pakistan enjoy protection as per as competition from India is concerned.
Let us now examine what are these products in which India has advantage. For example, under HS 87, there are 10 products in which India can have easy market access in post MFN scenario. These products are cash carrying vehicles, carriages for disabled persons, saddles, engine components for motorcycles, etc. Under HS 90, various meters for measuring temperatures, revolution etc. are there in the list. These clearly indicate the product profile in which India will have relatively easy entry. Hence, the fear that India will wipe out the domestic industries is not true to a large extent.
Conclusion
• Pakistani manufacturers are apprehensive about import of auto
components from India. We cannot do any simulation or trend
analysis as there was minimal trade in the past. This has added the
fear as we are unable to establish the scientific basis.
• However, from the trade data it is clear that India will mostly compete
with China and Thailand in Pakistan.
• It is possible that major Japanese players will partly divert their import
from India. This will clearly reduces cost of production and consumers
may be offered with variety of models.
• Apprehension that India will enter through SAFTA route is also largely
not correct as most of the negative list products are also present in
SAFTA Sensitive List.
• India and Pakistan being two major players in South Asia can reap
the benefit through collaboration. This can increase their exports to
Middle East, Central Asia and Africa.
• Hence, joint ventures among the players should be encouraged.
• Dedicated JV auto park may be developed near the border for
smooth functioning of production network.