nonlinear models for the seismic analysis of …rbento/tmp/3disp/coran_final... · modelling...
TRANSCRIPT

International Conference on Recent Advances in Nonlinear Models – Structural Concrete Applications
CoRAN 2011
H. Barros, R. Faria, C. Pina and C. Ferreira (Eds)
NONLINEAR MODELS FOR THE SEISMIC ANALYSIS
OF REINFORCED CONCRETE BUILDINGS –
A PERFORMANCE EVALUATION OF DIFFERENT MODELS
IN NONLINEAR STATIC AND DYNAMIC ANALYSIS
GONÇALO N. CARVALHO *
, RITA P. BENTO †
AND CARLOS BHATT‡
Department of Civil Engineering
Instituto Superior Técnico, Technical University of Lisbon Av. Rovisco Pais 1049-001 Lisboa, Portugal
*E-mail: [email protected];
†E-mail: [email protected];
‡E-mail: [email protected];
Keywords: material nonlinearity; reinforced concrete sections; lumped plasticity models;
distributed plasticity models; nonlinear seismic analysis.
Summary: Being fact that both old and recently designed building structures are well
expected to exhibit a nonlinear seismic response when subjected to medium-high intensity
earthquakes, only simple linear methods have effectively been used in design offices.
Nowadays, however, as a result of the improvement of scientific knowledge, the number of
real experiments and the exponential progress of computational skills, nonlinear modelling
and analysis have gradually been brought to a more promising level. A wide range of
modelling alternatives developed over the years is hence at designers’ disposal for the seismic
assessment of engineering structures. Therefore, it was intended with this study to use some
of these models to an existing structure and evaluate their precision in nonlinear static and
dynamic analyses, with the use of two advanced computer programs: SAP2000 and
SeismoStruct. The different models focus on the flexural mechanism with both lumped and
distributed plasticity element models. In order to appraise the reliability and feasibility of each
alternative, the programs capabilities and the amount of labour and time requirement for
modelling and analyses were also discussed.
1. INTRODUCTION
The response of an engineering structure to a seismic action is carried out by a number of
mechanisms characterized by stiffness, resistance and ductility. With a balanced proportion
between these characteristics, the structure should be able to: (1) control displacements; (2)
avoid damage under low seismic intensities and withstand the remaining design actions; and
(3) accommodate large displacements without early collapse, dissipate energy and control
damage spread.

Gonçalo N. Carvalho, Rita P. Bento and Carlos Bhatt
2
The structural designers have mostly relied the seismic design and assessment of structures
on linear methods, which have recently been proved not to describe in a correct fashion the
actual behaviour of irregular structures. In fact, the structural response is characterized by a
complex nonlinear behaviour where the internal forces are continuously redistributed as the
structure goes through the inelastic stage. This complex behaviour has been studied for the
last few decades in order to grant engineers with trusted means to predict the seismic response
of building structures. A wide number of nonlinear modelling alternatives, analyses and
computer programs have been developed and included in several research studies. The better
understanding of material behaviour, the growing performance of the existing element models
and the increasing development of computational skills may turn nonlinear analysis into a
generalized tool. The current challenge lies on the development of simple modelling software
and fast-and-easy nonlinear methods compatible with the designing activity and the possible
lack of knowledge of design engineers on the nonlinear field.
It was intended with this work (Carvalho [1]) to initially conduct a survey of the existing
nonlinear models and later to use some of these in two different computer programs for a
specific case study. In this paper, a brief description of nonlinear models and analysis is made,
with main focus on those that are featured in SAP2000 [2] and SeismoStruct [3].
Six different three-dimensional models were built with these software applications, and the
accuracy evaluation was performed using nonlinear static and dynamic analyses. This work
aims to model only the flexural behaviour of structural frames, meaning that no shear failures
affect the nonlinear response of the case study.
In fact, shear models are currently under development and its straightforward applicability
to complex systems is still far from being recommended. Both the amount of work required to
build each model in the aforementioned software and the time consumed by each analysis and
procedure were taken into account to conclude about the efficiency of each alternative.
With the accomplished study, for the seismic assessment of reinforced concrete buildings,
final conclusions were given to support the future users on the choice among the selected
possibilities.
2. NONLINEAR MODELS
In the recent capacity design standards, for the structure to absorb great deformation,
maximum ductility is required. A number of ductile mechanisms are thus considered to
accommodate these deformations, while brittle elements are carefully designed not to harm
ductility, i.e., to remain linear.
One of the most ductile mechanisms is the flexural behaviour of the structural elements,
which is generally made to prevail over shear fractures. These structural elements are
consequently expected to form plastic hinges at their most critical sections, when deformed by
severe earthquakes. The element sections are subjected to multiple excursions into the
inelastic range, often followed by their gradual degradation caused by the cyclic motion.
Numerical models for this type of frame structures have basically fallen into two
categories: (1) the distributed plasticity models, where the inelastic behaviour of the whole
element is modelled to automatically compute the spread of plasticity along its length; and (2)

Gonçalo N. Carvalho, Rita P. Bento and Carlos Bhatt
3
the concentrated plasticity models, where the inelastic behaviour is lumped at the critical
sections, corrected by a fixed parameter that assumes an ideal plasticity distribution.
To model the section flexural behaviour it is often used either a definition of hysteretic
rules or a fibre discretization model, where a uniaxial model of each fibber material is
required.
2.1. SECTIONS
The use of hysteretic relations represents a relatively simple way to model the flexural
behaviour of an element cross section, i.e. a numerical relationship between moment and
curvature M-χ. This kind of formulation is generally based on the definition of a monotonic
envelope and a set of rules for the definition of hysteretic loops (Stojadinovic & Thewalt [4]),
which are calibrated to assess element stiffness, ductility and energy dissipation. Usually
when a moment-curvature envelope is assigned to model the flexural behaviour of a structural
element, the two directions of flexure are considered separately and no axial force interaction
is taken into account during analysis. The idealization of these models is hence performed to
an average axial force, which is generally obtained by a linear analysis to gravity loads.
Another simple model of the flexural behaviour of a cross section is the fibre model (see
Taucer et al. [5]). This model can take into account both directions of flexure and axial force
interaction. It consists of a discretization of the cross section into a finite number of axial
springs acting in parallel, by considering the Euler-Bernoulli beam theory. The section
stiffness is computed with the tangent stiffness of each fibre material, its area of influence and
its coordinates on the cross section.
There have been a number of recent research studies that also include the effect of shear in
the flexural model (see, e.g., Sezen & Chowdhury [6] and Petrangeli et al. [7]). This important
factor has been indicated as the next step to the seismic assessment of existing RC structures,
which are particularly sensitive to shear mechanisms.
2.2. ELEMENTS
The structural elements of a building structure subjected to seismic excitations are mostly
stressed at their connections with other elements. The internal forces distributions may be
assumed as linearly varying, where major forces are located at both ends of the elements.
For this reason, the concentrated plasticity models have emerged by simply lumping
flexural nonlinearity at these sections. The first formulation proposed by Clough et al. [8]
consisted of an association in parallel of an elastic and an elastoplastic element. The most
common formulation of a concentrated plasticity model was initially proposed by Giberson
[9] with an association in series composed by a nonlinear rotational spring at each end of a
linear elastic element. The rotational springs are defined by a moment-rotation relation M-χ
that integrates the inelastic curvature distribution expected along the nearest sections, which
form the plastic hinge, while the element itself behaves elastically with limited forces. A very
common approach is to admit a uniform distribution of the inelastic curvatures along a plastic
hinge length Lp, which is reassigned by empirical expressions, by defining the plastic rotation
as θ = χ Lp, where χ is the curvature.
In a distributed plasticity model, usually a finite number of cross sections are computed
throughout the element to more accurately consider the inelasticity progression along its
Gonçalo N. Carvalho, Rita P. Bento and Carlos Bhatt
4
length. An old example of this formulation was suggested by Takayanagi & Schnobrich [10],
by placing several hinges along the element with specified lengths, also suggested by the
SAP2000 reference manual [11]. However, the most generalized formulation is based on
numerical integration of section quantities at specified sections, e.g. points of a Gauss or
Gauss-Lobato quadrature, to determine the element matrices of stiffness or flexibility. Notes
on these formulations, as well as related issues, can be found in Hellesland & Scordelis [12],
Scott & Fenves [13], Neuenhofer & Filippou [14] and Calabrese et al. [15].
3. CASE STUDY
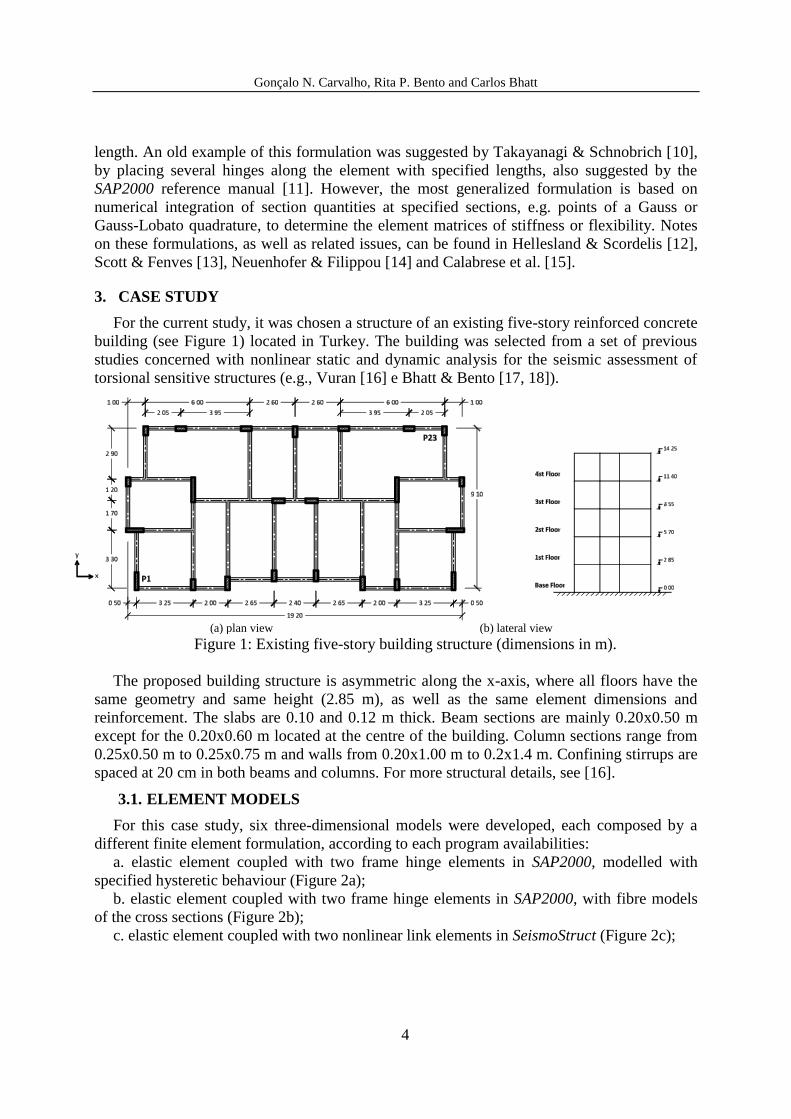
For the current study, it was chosen a structure of an existing five-story reinforced concrete
building (see Figure 1) located in Turkey. The building was selected from a set of previous
studies concerned with nonlinear static and dynamic analysis for the seismic assessment of
torsional sensitive structures (e.g., Vuran [16] e Bhatt & Bento [17, 18]).
(a) plan view (b) lateral view
Figure 1: Existing five-story building structure (dimensions in m).
The proposed building structure is asymmetric along the x-axis, where all floors have the
same geometry and same height (2.85 m), as well as the same element dimensions and
reinforcement. The slabs are 0.10 and 0.12 m thick. Beam sections are mainly 0.20x0.50 m
except for the 0.20x0.60 m located at the centre of the building. Column sections range from
0.25x0.50 m to 0.25x0.75 m and walls from 0.20x1.00 m to 0.2x1.4 m. Confining stirrups are
spaced at 20 cm in both beams and columns. For more structural details, see [16].
3.1. ELEMENT MODELS
For this case study, six three-dimensional models were developed, each composed by a
different finite element formulation, according to each program availabilities:
a. elastic element coupled with two frame hinge elements in SAP2000, modelled with
specified hysteretic behaviour (Figure 2a);
b. elastic element coupled with two frame hinge elements in SAP2000, with fibre models
of the cross sections (Figure 2b);
c. elastic element coupled with two nonlinear link elements in SeismoStruct (Figure 2c);

Gonçalo N. Carvalho, Rita P. Bento and Carlos Bhatt
5
d. plastic hinge elements in SeismoStruct (Figure 2d);
e. elastic element coupled with two distributed plasticity elements in SeismoStruct (Figure
2e);
f. distributed plasticity elements in SeismoStruct (Figure 2f).
For models a., b., c., d., and e., a plastic hinge length dependent on a fixed ratio λ of the
cross sections height Hs is used, i.e. Lp=λ Hs. Parameter λ was considered as 0.25, 0.50, 0.75,
1.00 and 1.25 for parametric study.
(a) (b) (c) (d) (e) (f)
Figure 2: Nonlinear finite element models used.
The rigid diaphragm effect of the slabs was modelled at each floor; mass was linearly
distributed along the beams; and rotations at the base of the vertical elements were fully
restricted.
3.2. MATERIALS AND SECTIONS
For materials definition, a mean concrete compressive strength of 16.7 MPa and a steel
yield strength of 371 MPa were considered. The concrete was modelled using the proposal of
Mander et al. [19], with three confining ratios kc = 1.0, 1.1 and 1.2 (see Figure 3), which
assume a medium-low confinement exploration [3]. The factor kc is defined as the ratio
between the confined and the unconfined concrete compressive strengths, fcc and fc0, where
fcc = k0 fc0.
The strain εc0 corresponding to fc0 was assumed 0.002 and three different ultimate strains
εcu were considered as shown in Table 1. For the concrete modulus of elasticity Ec, a value of
19.2 GPa was assigned.
Table 1: Concrete parameters.
εc0 fc0 [kPa] kc fcc [kPa] εcu
(1) 0.002 16700 1.0 16700 0.0035
(2) 0.002 16700 1.1 18370 0.0050
(3) 0.002 16700 1.2 20040 0.0100
Figure 3: Concrete capacity curves used. Red points represent conventional failure
extensions.

Gonçalo N. Carvalho, Rita P. Bento and Carlos Bhatt
6
Reinforcement steel was modelled with the Menegotto & Pinto [20] equations, with an
elastic modulus Es of 200 GPa, and an ultimate strength εsu of 0.075. Remaining parameters
for the definition of the longitudinal reinforcement bars [20] are listed in Table 2. A cyclic
response to a given strain history is presented in Figure 4.
Table 2: Steel parameters.
fy [MPa] 371.0 R(0) 20.0
Es [MPa] 200.0 b 0.005
εsu 0.075 a1 18.5
a2 0.15
a3 0.025
a4 2.0
Figure 4: Steel capacity curves.
For the frame hinge elements in SAP2000 (model a.), a monotonic envelop of the moment
curvature relationship was determined by a fibre discretization model of each cross section,
with the respective axial forces. This step was done with the development of a Matlab routine,
with posterior idealizations to define yield moments My, and ultimate moments Mu and
curvatures χu to import into SAP2000 to each element direction of flexure (see Figure 5). The
cyclic behaviour of these models is defined by the program with a bilinear hysteretic rule. The
calculated curvatures were converted into spring rotations by multiplying the plastic hinge
length Lp as mentioned before, using the λ-parameter.
Figure 5: SAP2000 hinges for model (a.) (the idealized curve is shown in red)
The model of auto-computed fibre hinge elements in SAP2000 (model b.) is modelled with
user-defined matrices of the fibres, where each one is assigned to a material model. To model
both concrete and steel, the monotonic envelopes were introduced by a number of points. A
bilinear hysteretic model is automatically assigned by the program. A single hinge accounts
automatically for a bidirectional behaviour. The same Lp formulation is applied.

Gonçalo N. Carvalho, Rita P. Bento and Carlos Bhatt
7
The link element models in SeismoStruct (model c.) were defined exactly as the frame
hinge models in SAP2000 (model a.). For the link element definition, a bilinear hysteretic rule
is also available (among others). Models d., e. and f. in SeismoStruct are computed with the
fibre discretization model of the cross sections. The program automatically defines section
fibres, where materials are defined with the uniaxial models of Mander et al. [19] and
Menegotto & Pinto [20], with the calibrated parameters of Tables 1 and 2.
4. PERFORMED ANALYSES
To firstly study the dynamic characteristics and the linear response of the building
structure, linear modal and response spectrum analyses were carried out. To validate each
model, also linear static analyses were run to check equilibrium of vertical gravity loads.
A pushover analysis was performed in each direction in all nonlinear models with a modal
proportional lateral load distribution. With the distributed plasticity model, also a uniform
load was applied to evaluate structural response differences. To evaluate the influences of the
plastic hinge length on the results, pushover analyses were also run to all variants employed.
The N2 method prescribed by the EC8 [21], (see Fajfar [22, 23]) was applied to the
capacity curves obtained with each pushover analysis, to evaluate the global structural
response to 0.4 g. Only the 0.75 value of λ was used to perform this procedure in the
concentrated plasticity models.
Finally, nonlinear dynamic time-history analyses were carried out for all models (again
only with λ = 0.75) to the three intensities considered in this study (0.2, 0.3 and 0.4 g).
Regarding the seismic action definition, three real records from the PEER database [24] were
considered. The records were fitted to the EC8 [21] elastic response spectrum, using the
software RSPMatch2005 [25] for 0.4 g. Each of the three semi-artificial pair of records was
applied twice in the structure changing the direction of the components and thus forming a set
of six analyses: NR1, NR2, TB1, TB2, WN1 and WN2.
Further details on the seismic action considered in this endeavour can be found in [1].
It is important to mention that not all models were able to operate successfully, namely the
two concentrated plasticity models in SeismoStruct (c. and d.) that is why the results are not
shown in this paper. Convergence difficulties were also verified during the analyses on the
models of SAP2000, especially on the fibre models, which are still under development. In
both of the concentrated plasticity models used in SAP2000, convergence failure occurred at a
given time step, which required reduction of the seismic intensity in order to complete the
analysis.
5. RESULTS
The most relevant results obtained in this work are summarized in this section.
5.1. DYNAMIC PROPERTIES
The first three modes of vibration were obtained by a linear model in SeismoStruct. The
first mode (0.615sec) is basically characterized by a global translation motion of the stories
along the x-axis, with a slight rotation about the z-axis, thus implying torsional sensitivity.
The second mode (0.592sec), on the other hand, is described as a pure translational motion,

Gonçalo N. Carvalho, Rita P. Bento and Carlos Bhatt
8
derived from the symmetry along the y-axis, composed by four shear walls oriented in that
direction. In the third mode (0.508sec), almost pure torsional motion of the structure is
verified.
5.2. NONLINEAR STATIC ANALYSIS
The capacity curves obtained with the distributed plasticity model in SeismoStruct (e.) are
shown in Figure 6, for modal and uniform lateral load distributions, and for x and y
directions. The structure presents a slightly greater resistance along the y-axis, characterized
by a hardening phase, whereas along the x-axis an evidenced softening behaviour is
demonstrated. Regarding the two different load distributions, it is shown that the uniform load
is distinguished by higher resisting forces and stiffness. This fact is due to the presence of
stronger forces in superior levels in the modal distribution, which increases the values of the
total shear force of each floor for the same base shear, leading to higher deformations,
affecting resistance itself. Since SeismoStruct does not consider the loss of element strength
when ultimate strains occur in materials, a (red) point is shown on the curves when ten
SeismoStruct strain warnings are registered in the vertical elements, after which the curve
shall not be taken as accurately representing the actual capacity curve.
In terms of the capacity curves obtained with limited distributed plasticity model in
SeismoStruct (f.) for different values of the factor λ, the results were considerably close, even
for very small values of λ. However as the plastic hinge length is decreased, more
convergence difficulties were verified and more computational effort was required, thus
increasing significantly the duration of the analyses. In fact, when inelastic progress is limited
by the length of the distributed plasticity elements, greater values of curvature are
concentrated in the element critical sections, generating higher section forces. An increase of
structural stiffness and a slight decrease of strength are therefore observed.
Regarding the capacity curves obtained with the concentrated plasticity model in SAP2000
using the fibre models of the cross sections (b.), for different values of λ, see Figure 7.
(a) x-direction (b) y-direction
Figure 6: Capacity curves obtained with SeismoStruct distributed plasticity model (e.).

Gonçalo N. Carvalho, Rita P. Bento and Carlos Bhatt
9
(a) x-direction (b) y-direction
Figure 7: Capacity curves obtained with SAP2000 concentrated plasticity model with fibre models (b.).
Firstly, a considerable reduced maximum top displacement is verified, fact that is
consistent with the red dots presented in Figure 6, as ultimate strain values were directly
described in the program materials definition. This formulation leads to great convergence
difficulties as element forces abruptly drop to zero and stresses are constantly redistributed
throughout the structure. The same result in stiffness is observed when λ is modified.
(a) x-direction (b) y-direction
Figure 8: Capacity curves obtain with SAP2000 concentrated plasticity model with hysteretical models (a.).
When a hysteretic rule was imposed in SAP2000 to model the behavior of each section (a.),
different results were obtained with the capacity curves (see Figure 8). In both directions, a
lower value of the maximum shear force is reached, and a considerably higher ductility factor
is demonstrated. As seen with the other models, the greater the plastic hinge length is defined,
more deformation is observed as well as higher resistance is expected. In fact, when the
plastic hinge length is increased, more rotation capacity is given to the hysteretic models and
thus more deformation capacity is acquired by the structure. Occasionally, e.g. the y-axis in

Gonçalo N. Carvalho, Rita P. Bento and Carlos Bhatt
10
this case, as the structural displacements grow higher, resisting forces on the linear elastic
elements are increased, thus experiencing a greater value of Vb. Note that until yielding is
reached, structural response is kept the same due to the rigid behaviour of plastic hinges.
The duration of the pushover analyses are listed in Table 3. It is primarily seen that
concentrated plasticity models in SAP2000 (a.) were considerably faster.
Table 3: Duration of the pushover analyses.
Modal load Uniform load
x-dir y-dir x-dir y-dir
a. 30m 32m -- -- b. 1h24m 1h05m -- -- e. 2h30m 2h44m -- -- f. 1h30m 1h21m 1h01m 1h12m
With the concentrated plasticity model with fibre hinges in SAP2000 (b.) it was not
possible to obtain a target displacement with the N2 method, as the model appears not to have
necessary ductility to resist to the deformation imposed by the seismic action defined. For the
remaining models, the target displacements were very similar, even in both directions.
In Figure 9, the interstory drifts obtained with this procedure show that models a., e. and f.
conducted to considerably consistent results. Compared to the results obtained with the modal
response spectrum analysis, it is seen that nonlinear models led to a greater deformation,
concentrated in the first three stories in the x-direction and uniformly distributed through the
stories in the y-direction.
In fact, prevailing wall systems (y-direction) tend to form plastic hinges at the base of the
walls, homogenizing the spread of story drifting in height, due to the greater stiffness of the
walls compared to beams. On the contrary, in a frame system (x-direction), the exceeding drift
of the base floor caused by plastic excursion does not affect the upper floors.
(a) x-direction (b) y-direction
Figure 9: Interstory drifts obtained with the N2 method and with the response spectrum analysis.
Torsional effects are also compared in Figure 10, where the top displacements of the
corner frames P1 and P23 (Figure 1) are normalized with the roof centre of mass displacement

Gonçalo N. Carvalho, Rita P. Bento and Carlos Bhatt
11
in each direction. While in the y-direction, due to symmetry, no rotation is observed, in the x-
axis normalized top displacements of the corner frames are verified, which are considerably
smaller compared to the ones experienced in the response spectrum analysis. These results are
according to what was expected as the torsional effects are reduced in the structure when
nonlinear behaviour excursions occur.
(a) x-direction (b) y-direction
Figure 10: Normalized roof displacements obtained with the N2 method, and with the response spectrum
analysis.
5.3. NONLINEAR DYNAMIC ANALYSIS
The roof displacements obtained with the distributed plasticity model in SeismoStruct (e.),
for the three values of the peak ground acceleration in the first combination of the Northridge
record, are shown in Figure 11. Above the displacement was placed a chart where each bar
indicates two times the duration between maximums and minimums, i.e., the response
periods. It is seen that increasing the seismic intensity, maximum roof displacements are near-
proportionally increased, as well as the response periods, the later being caused by the greater
nonlinear excursions and consequent loss of stiffness.
Figure 11: Top displacements in the x-direction obtained with the distributed plasticity model (e.) in the first
combination of the Northridge record, for different ground peak accelerations.
Regarding the limited distributed plasticity model built in SeismoStruct (f.), it was
concluded that no major difference was detected [1]. A very small increase in periods of
vibration and amplitudes is verified between the two curves.
Gonçalo N. Carvalho, Rita P. Bento and Carlos Bhatt
12
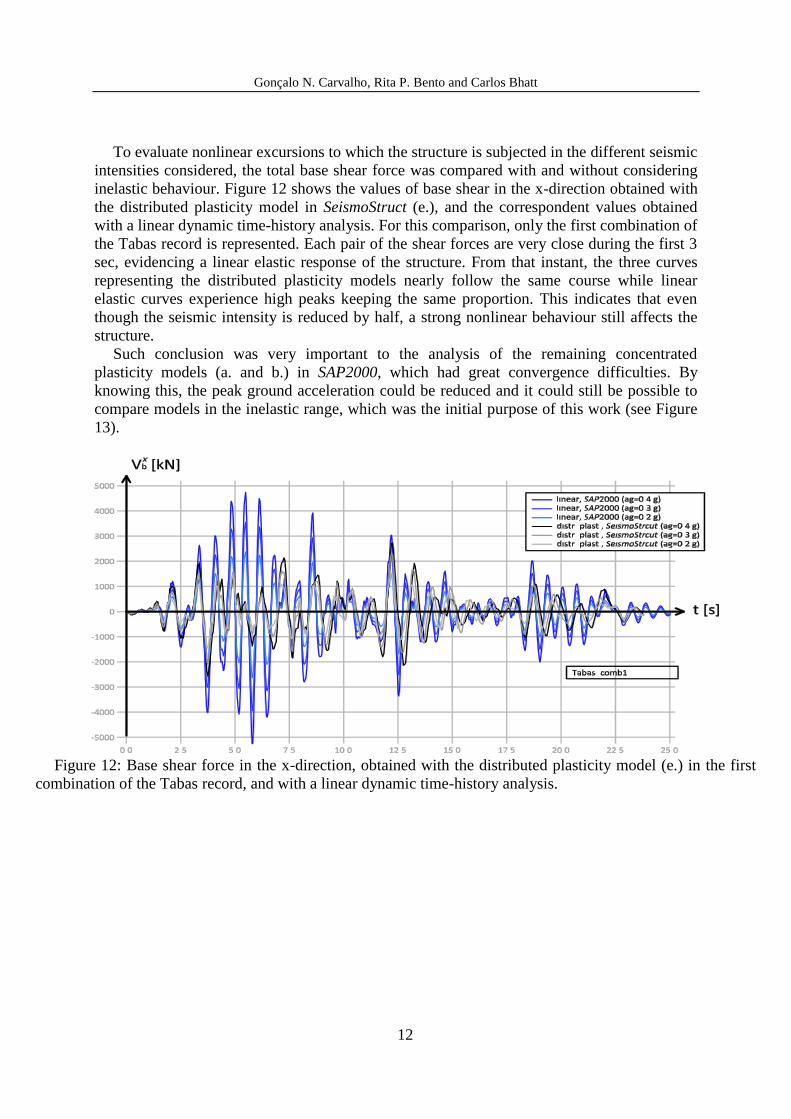
To evaluate nonlinear excursions to which the structure is subjected in the different seismic
intensities considered, the total base shear force was compared with and without considering
inelastic behaviour. Figure 12 shows the values of base shear in the x-direction obtained with
the distributed plasticity model in SeismoStruct (e.), and the correspondent values obtained
with a linear dynamic time-history analysis. For this comparison, only the first combination of
the Tabas record is represented. Each pair of the shear forces are very close during the first 3
sec, evidencing a linear elastic response of the structure. From that instant, the three curves
representing the distributed plasticity models nearly follow the same course while linear
elastic curves experience high peaks keeping the same proportion. This indicates that even
though the seismic intensity is reduced by half, a strong nonlinear behaviour still affects the
structure.
Such conclusion was very important to the analysis of the remaining concentrated
plasticity models (a. and b.) in SAP2000, which had great convergence difficulties. By
knowing this, the peak ground acceleration could be reduced and it could still be possible to
compare models in the inelastic range, which was the initial purpose of this work (see Figure
13).
Figure 12: Base shear force in the x-direction, obtained with the distributed plasticity model (e.) in the first
combination of the Tabas record, and with a linear dynamic time-history analysis.

Gonçalo N. Carvalho, Rita P. Bento and Carlos Bhatt
13
(a) ground peak acceleration of 0.4 g
(b) ground peak acceleration of 0.3 g
(c) ground peak acceleration of 0.2 g
Figure 13: Top displacements in the x-direction obtained with different models (a., b. and e.), in the first
combination of the Tabas record and with a linear dynamic time-history analysis.
It is seen that the results obtained with the concentrated plasticity model with hysteretic
rules (a.) are reasonably accurate in the first 10s of the analysis, when compared to the

Gonçalo N. Carvalho, Rita P. Bento and Carlos Bhatt
14
reference model (e.), however presenting lower vibrating periods. The deformability exhibited
with the fiber concentrated plasticity model in SAP2000 (b.) is considerably higher compared
to the other models, which lead to higher values of deformation. It was not possible to detect a
fair reason for this problem since it is not consistent with the high stiffness presented in the
capacity curves (Figure 17).
In Table 4, a list of the duration of each nonlinear dynamic analysis for the four models a.,
b., e. and f., with the three ground peak accelerations for the six semi-artificial accelerograms
is given.
Table 4: Duration of the nonlinear dynamic analyses.
ag [g] NR1 NR2 TB1 TB2 WN1 WN2
a.
0.2 55m 50m 1h05m 1h10m 09m 1h16m
0.3 36m 36m 2h02m 24m 19m 2h28m
0.4 54m 2h20m 1h29m 26m 14m 50m
b.
0.2 2h26m 1h40m 3h05m 2h58m 3h16m 1h40m
0.3 1h06m 2h03m 33m 30m 1h16m 1h20m
0.4 2h57m 1h34m 40m 33m 1h32m 1h29m
e.
0.2 2h23m 2h25m 2h21m 2h33m 2h55m 2h39m
0.3 2h37m 2h33m 2h35m 2h50m 3h17m 2h25m
0.4 3h03m 2h58m 3h16m 2h43m 1h13m 1h15m
f. 0.4 5h31m 7h38m 6h16m 6h07m 7h10m 6h38m
6. CONCLUSIONS
Throughout the entire work of building each model and performing each analysis, it was
noticed that both programs still have several issues in terms of practical applicability in the
design activity of real structures.
When modelling a building structure, each program has different limitations: In
SeismoStruct, although considering nonlinear behaviour is almost automatic due to the section
fibre models, building the complex model itself becomes heavy. In SAP2000 however, despite
the ease of defining the structure geometry by using its intuitive graphical interface, when it
comes to model nonlinear behaviour, the user has no other way but to resort to external
applications to compute the large amount of hysteretic relations.
As concentrated plasticity models in SeismoStruct (c. and d.) were not able to work in any
type of analysis, its use should be cautious and not advisable for building structures of
equivalent or higher complexity, at the moment. The limited distributed plasticity model (f.) is
also not recommended as its results were so similar to those obtained with the distributed
plasticity models, with the additional convergence difficulties and duration increase both
nonlinear analyses performed. The concentrated plasticity model in SAP2000, with fibre
models (b.), has also proven not to be currently advisable (in this version of SAP2000), as in
the capacity curves it presented a very low ductility behaviour and in the nonlinear dynamic
analysis it showed convergence failure at early time steps, with extreme high displacements.
Only the results obtained with the concentrated plasticity model in SAP2000, with defined
hysteretic models for the plastic hinges (a.), could be compared to the distributed plasticity

Gonçalo N. Carvalho, Rita P. Bento and Carlos Bhatt
15
model in SeismoStruct (e.). However, for high intensities of the seismic action, time-history
analysis convergence failure occurred at early time steps.
Finally, the distributed plasticity model in SeismoStruct (e.), taken in this study as the
reference model, constitutes one of the most trusted nonlinear models and its use is widely
recommended. It has been tested in a significantly great amount of research studies, and some
of them report comparison with experimental results (Bento et al. [26]). In fact, time-
consuming is worth noticing in this model, and even though with the concentrated plasticity
model of SAP2000 (a.) it is reduced by half, nonlinear modelling in the former is
straightforward.
A better knowledge on the seismic action and on the consequent structural response, and
its accurate assessment and manipulation, will not only result in more reliable security
conditions but especially in a better prediction of damage spread, thus reducing the repairing
costs.
ACKNOWLEDGMENTS
The authors would like to acknowledge the financial support of the Portuguese Foundation
for Science and Technology (Ministry of Science and Technology of the Republic of
Portugal) through the research project PTDC/ECM/100299/2008 and through the PhD
scholarship SFRH/BD/28447/2006 granted to Carlos Bhatt.
REFERENCES
[1] Carvalho, G. (2011). Análise Sísmica de Edifícios de Betão Armado – Estudo de
Alternativas de Modelação e Análise Não-Linear. Master's thesis, Instituto Superior
Técnico, Universidade Técnica de Lisboa, Portugal.
[2] SAP2000 (2008). v12.0.0 Advanced. Computers and Structures, Inc.
[3] SeismoStruct (2010). v5.0.5. A computer program for static and dynamic nonlinear
analysis of framed structures. SeismoSoft, Ltd. Available from: www.seismosoft.com.
[4] Stojadinovic, B. & Thewalt, C. R. (1996). Energy Balanced Hysteresis Models.
Eleventh World Conference on Earthquake Engineering, Earthquake Engineering
Research at Berkeley, College of Engineering, University of California at Berkeley.
[5] Taucer, F. F., Spacone, E. & Filippou, F. C. (1991). A Fiber Beam-Column Element for
Seismic Response Analysis of Reinforced Concrete Structures. Earthquake Engineering
Research Center, Colege of Engineering, Uniersity of California, Berkeley.
[6] Sezen, H. & Chowdhury, T. (2009). Hysteretic model for reinforced concrete columns
including the effect of shear and axial load failure. Journal of Structural Engineering,
ASCE 135(2), 139-146.
[7] Petrangeli, M., Pinto, P. E. & Ciampi, V. (1999). Fiber element for cyclic bending and
shear of rc structures. Journal of Engineering Mechanics, ASCE 125(9), 994-1009.
[8] Clough, R., Benuska, K. & Wilson, E. (1965). Inelastic earthquake response of tall
buildings. Proceeding of Third World Conference on Earthquake Engineering, New
Zealand 11.
[9] Giberson, M. (1967). The Response of Nonlinear Multi-Story Structures Subjected to
Earthquake Excitation. Ph.D. thesis, California Institute of Technology.

Gonçalo N. Carvalho, Rita P. Bento and Carlos Bhatt
16
[10] Takayanagi, T. & Schnobrich, W. (1979). Non linear analysis of coupled wall systems.
Earthquake Engineering and Structural Dynamics 7(1), 1-22.
[11] SAP2000 (1995). Analysis Reference Manual. For SAP2000 R, ETABS R and
SAFETM. CSI.
[12] Hellesland, J. & Scordelis, A. (1981). Analysis of RC Bridge Columns Under Imposed
Deformations. IABSE Colloquium, Delft, Netherlands.
[13] Scott, M. H. & Fenves, G. L. (2006). Plastic hinge integration methods for force-based
beam-column elements. Journal of Structural Engineering ASCE 132(2), 244-252.
[14] Neuenhofer, A. & Filippou, F. C. (1997). Evaluation of nonlinear frame finite element
models. Journal of Structural Engineering 123(7), 958-966.
[15] Calabrese, A., Almeida, J. P. & Pinho, R. (2010). Numerical issues in distributed
inelasticity modeling of rc frame elements for seismic analysis. Journal of Structural
Engineering 14(S1), 38-68.
[16] Vuran, E. (2007). Comparison of Nonlinear Static and Dynamic Analysis Results for
3D Dual Structures. Master's thesis, Università degli Studi di Pavia.
[17] Bhatt, C. & Bento, R. (2010). Assessing the seismic response of existing rc buildings
using the extended n2 method. Bulletin of Earthquake Engineering Published online
DOI: 10.1007/s10518-011-9252-8.
[18] Bhatt, C. & Bento, R. (2010). Extension of the csm-fema440 to plan-asymmetric real
building structures. Earthquake Engineering and Structural Dynamics Published online
in Wiley Online Library (wileyonlinelibrary.com). DOI: 10.1002/eqe.1087.
[19] Mander, J., Priestley, M. & Park, R. (1988). Theoretical stress-strain model for confined
concrete. Journal of Structural Engineering 114(8), 1804-1826.
[20] Menegotto, M. & Pinto, P. (1973). Method of analysis for cyclically loaded r.c. plane
frames including changes in geometry and non-elastic behaviour of elements under
combined normal force and bending. Symposium on the Resistance and Ultimate
Deformability of Structures Acted on by Well Defined Repeated Loads, International
Association for Bridge and Structural Engineering, Zurich, Switzerland, 15-22.
[21] CEN, Eurocode 8: Design of structures for earthquake resistance - Part 1: General rules,
seismic actions and rules for buildings, 2010.
[22] Fajfar, P. (2000). A nonlinear analysis method for performance based seismic design.
Earthquake Spectra 16(3), 573-592.
[23] Fajfar, P., Marusic, D. & Perus, I. (2005). The Extension of the N2 Method to
Asymmetric Buildings. Proc. of the 4th European Workshop on the Seismic Behaviour
of Irregular and Complex Structures, Thessaloniki, Greece.
[24] PEER (2010). (Pacfuc Earthquake Engineering Research Center): Strong Ground
Motion Database. http://peer.berkeley.edu.
[25] Hancock, J., Watson-Lamprey, J., Abrahamson, N. A., Bommer, J. J., Markatis, A.,
McCoy, E. & Mendis, R. (2006). An improved method of matching response spectra of
recorded earthquake ground motion using wavelets. Journal of Earthquake Engineering
10(1), 67-89.
[26] Bento, R., Pinho, R. & Bhatt, C. (2008). Nonlinear Static Procedures for the Seismic
Assessment of the 3D Irregular Spear Building.