nonisothermal moisture diffusion in porous building materials
TRANSCRIPT
This article was downloaded by: [The University of Manchester Library]On: 08 December 2014, At: 06:07Publisher: RoutledgeInforma Ltd Registered in England and Wales Registered Number: 1072954 Registeredoffice: Mortimer House, 37-41 Mortimer Street, London W1T 3JH, UK
Building Research & InformationPublication details, including instructions for authors and subscriptioninformation:http://www.tandfonline.com/loi/rbri20
Nonisothermal moisture diffusion inporous building materialsG. H. Galbraith , R. C. Mclean , I. Gillespie , J. Guo & D. KellyPublished online: 18 Oct 2010.
To cite this article: G. H. Galbraith , R. C. Mclean , I. Gillespie , J. Guo & D. Kelly (1998) Nonisothermalmoisture diffusion in porous building materials, Building Research & Information, 26:6, 330-339, DOI:10.1080/096132198369661
To link to this article: http://dx.doi.org/10.1080/096132198369661
PLEASE SCROLL DOWN FOR ARTICLE
Taylor & Francis makes every effort to ensure the accuracy of all the information (the“Content”) contained in the publications on our platform. However, Taylor & Francis, ouragents, and our licensors make no representations or warranties whatsoever as to theaccuracy, completeness, or suitability for any purpose of the Content. Any opinions andviews expressed in this publication are the opinions and views of the authors, and are notthe views of or endorsed by Taylor & Francis. The accuracy of the Content should not berelied upon and should be independently verified with primary sources of information. Taylorand Francis shall not be liable for any losses, actions, claims, proceedings, demands, costs,expenses, damages, and other liabilities whatsoever or howsoever caused arising directly orindirectly in connection with, in relation to or arising out of the use of the Content.
This article may be used for research, teaching, and private study purposes. Any substantialor systematic reproduction, redistribution, reselling, loan, sub-licensing, systematic supply,or distribution in any form to anyone is expressly forbidden. Terms & Conditions of accessand use can be found at http://www.tandfonline.com/page/terms-and-conditions
Nonisothermal moisture diffusion in porous buildingmaterials
G. H. Galbraith1, R. C. McLean2, I. Gillespie3, J. Guo1 and D. Kelly1
1Department of Building & Surveying, Glasgow Caledonian University, Cowcaddens Road, GlasgowG4 0BA, UK
E-mail: [email protected]
2Department of Mechanical Engineering, University of Strathclyde, James Weir Building, MontroseStreet, Glasgow G1 1XJ, UK
E-mail: [email protected]
3Yarrow Shipbuilders, Brunei Project, South Street, Glasgow G14 0XH, UK
The hygrothermal performance of building envelopes has been the subject of intensive research over thepast decade, culminating in the development of a series of advanced computer-based simulation models.However, in spite of the considerable progress that has been made, a question which is not, as yet, fullyresolved is the coupled effect of temperature gradient on moisture diffusion rates. As a result, the materialtransport data used as input for these models is generally determined from isothermal permeabilitymeasurements . This paper describes two investigations in which moisture �ux experiments were carriedout on small-scale material samples subjected to gradients in both temperature and humidity. In each casea different experimental technique was used and different materials were tested. An analysis of the resultswas undertaken in an attempt to identify the signi�cance of any temperature-driven transport compared tothe concentration-driven component.
Le comportement hygrothermique des enveloppes de baà timents a fait l’objet de recherches nombreuses etpousse es au cours de la dernieÁ re de cennie qui ont de bouche sur le de veloppement d’une se rie de modeÁ les desimulation informatise e de pointe. Or, en de pit des progreÁ s conside rables qui ont e te faits, il reste unequestion qui n’a pas trouve une re ponse pleinement satisfaisante, aÁ savoir l’effet couple de gradients detempe ratures sur les vitesses de diffusion de l’humidite . Il en re sulte que les donne es relatives au transport dematieÁ re injecte es dans ces modeÁ les sont ge ne ralement de termine es aÁ partir de mesures de la perme abiliteÂisothermique. Cet article de crit deux e tudes dans le cadre desquelles on a mene des expe riences de �uxd’humidite sur le petits e chantillons de mate riaux soumis aÁ des gradients de tempe rature et d’humidite . Danschaque cas, on a eu recours aÁ une technique expe rimentale diffe rente et les tests ont porte sur plusieursmate riaux. Les re sultats ont e te analysis pour tenter de comprendre la signi�cation de tout transport controà leÂpar la tempe rature par comparison aÁ la composante re gie par la concentration.
Keywords: moisture, diffusion, material transport, permeability
Introduction
The application of moisture transport models tobuildings has become increasingly important inrecent years. These models, which can varywidely in sophistication (Chartered Institution ofBuilding Services Engineers, 1986; Galbraith,
1992), can be used to investigate the moisturetransmission performance of building envelopesand the occurrence of surface and interstitialcondensation.
It is obvious that the successful application ofany predictive model requires accurate data on
0961–3218 # 1998 E & FN Spon
330 Bu i l d i n g Re s e a r c h & In f o r m a t i o n (1998) 26(6), 330–339
Dow
nloa
ded
by [
The
Uni
vers
ity o
f M
anch
este
r L
ibra
ry]
at 0
6:07
08
Dec
embe
r 20
14
the moisture transport properties of buildingmaterials. A considerable amount of informationis, indeed, available and recent publications haveexamined the most convenient presentationalform in terms of the differential permeabilityfunction (Galbraith et al., 1998a, 1998b). However,although building envelopes are, in practice,subjected to temperature gradients, this informa-tion is generally based on standard moisturepermeability tests carried out under isothermalconditions. The use of isothermal data in thisway assumes that temperature-driven moisturediffusion effects are negligible. Unfortunately,because of the complexities involved in combinedheat and mass transfer, little investigative workhas taken place into this phenomenon and thereis, as yet, no clear experimental evidence tojustify this assumption. Indeed, a study carriedout on glass-�bre provided data which suggeststhat thermal (Soret) diffusion might be of somesigni�cance (Kumaren, 1987).
This paper outlines a project which was carriedout in an attempt to separate any temperature-driven moisture diffusion from a total measuredmoisture �ux and to quantify its signi�cancerelative to the concentration-driven transfer. Thisproject was a follow-up to a previous investiga-tion (Galbraith and McLean, 1995) which willalso be described brie�y. Both investigationswere characterized by using small-sample tests.However, different approaches were adopted tothe generation of a temperature gradient acrossthe samples. In addition, whereas the earlierwork considered both hygroscopic and nonhy-groscopic materials over the whole humidityrange, the present investigation centred onessentially nonhygroscopic behaviour in the lowhumidity region. This was done in an attempt tosimplify the experiments and results analysis byrestricting moisture transport to vapour diffusiononly, thus avoiding the complications associatedwith capillary condensation and the consequentseries=parallel transport as vapour and liquid(Galbraith et al., 1993).
The �ux equations
The total moisture �ux through a porous mediumas a result of movement in both the vapour andliquid phases can be expressed in terms of aconcentration-driven component and a tempera-ture-driven component as
j ˆ jc ‡ jT ˆ ¡ l = p ¡ DT = T (1)
where l is the differential permeability kgm=N s,DT is the thermal diffusion coef�cient kg=m2s Kand = p and = T are the gradients in vapourpressure and temperature respectively. The theor-etical basis of this equation is given in Galbraithand McLean (1997), where an approach based onthe application of irreversible thermodynamics isused.
For one-dimensional diffusion, Equation 1 can beintegrated across a thickness L of material withboundary values p 1, T1 and p 2, T2 to give
jL ˆ l (p 1 ¡ p 2) ‡ DT(T1 ¡ T2) (2)
where l and DT are average values pertaining tothe prevailing humidity and temperature condi-tions.
It has been shown in two recent publications(Galbraith et al., 1998a, 1998b) that an appropriatefunctional form for the differential permeabilitycurve is
l ˆ A ‡ B uc (3)
where u is the relative humidity. The curve-�tparameters A, B and C for a particular materialcan be determined from values of l obtained fromstandard isothermal permeability tests carried outover a range of humidity conditions (Galbraith etal., 1998a, 1998b; McLean et al., 1990). The averagepermeability for speci�ed humidity limits is givenby the integrated form of Equation 3
l ˆ A ‡B(u c‡1
2 ¡ u c‡11 )
(c ‡ 1)(u 2 ¡ u 1)ˆ
1(u 2 ¡ u 1)
… u 2
u 1
l d u
(4)
Not only does the form of Equation 3 allowaccurate values of l to be predicted for any givenset of humidity conditions, but the pressure testprocedure described in (Galbraith et al., 1997)showed that it also permits a reasonably accurateseparation of the total moisture �ux into itsvapour and liquid components. Thus for anonhygroscopic material or moisture diffusion inthe low humidity region, it would be expectedthat
l ˆ A ˆ l ; B ˆ O (5)
331
NONISOTHERMAL MOISTURE DIFFUSIOND
ownl
oade
d by
[T
he U
nive
rsity
of
Man
ches
ter
Lib
rary
] at
06:
07 0
8 D
ecem
ber
2014
The initial investigation
Test procedure
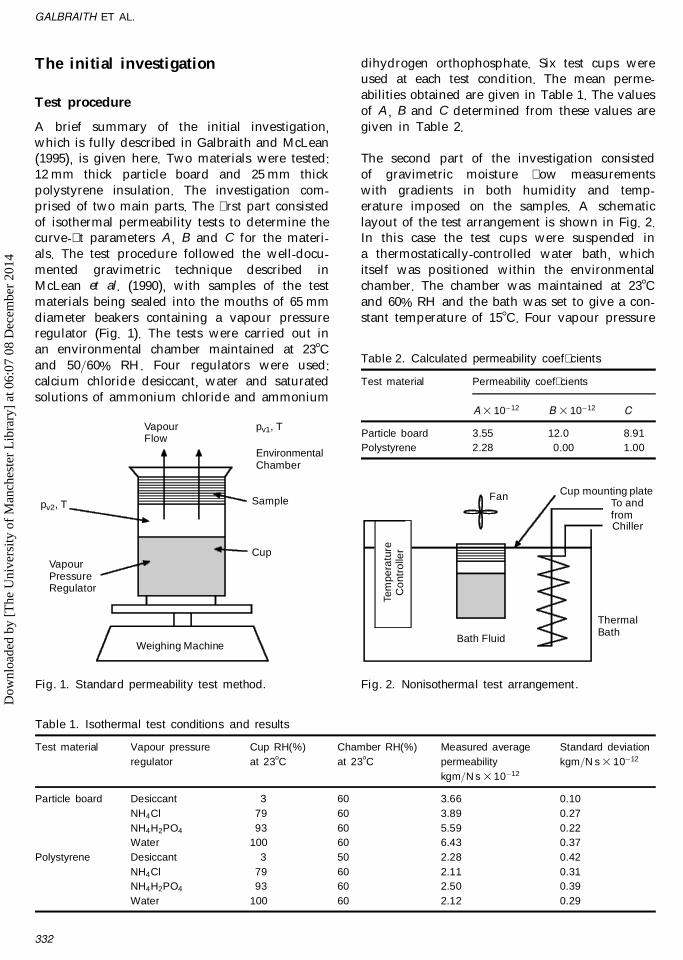
A brief summary of the initial investigation,which is fully described in Galbraith and McLean(1995), is given here. Two materials were tested:12 mm thick particle board and 25 mm thickpolystyrene insulation. The investigation com-prised of two main parts. The �rst part consistedof isothermal permeability tests to determine thecurve-�t parameters A, B and C for the materi-als. The test procedure followed the well-docu-mented gravimetric technique described inMcLean et al. (1990), with samples of the testmaterials being sealed into the mouths of 65 mmdiameter beakers containing a vapour pressureregulator (Fig. 1). The tests were carried out inan environmental chamber maintained at 238 Cand 50=60% RH. Four regulators were used:calcium chloride desiccant, water and saturatedsolutions of ammonium chloride and ammonium
dihydrogen orthophosphate. Six test cups wereused at each test condition. The mean perme-abilities obtained are given in Table 1. The valuesof A, B and C determined from these values aregiven in Table 2.
The second part of the investigation consistedof gravimetric moisture �ow measurementswith gradients in both humidity and temp-erature imposed on the samples. A schematiclayout of the test arrangement is shown in Fig. 2.In this case the test cups were suspended ina thermostatically-controlled water bath, whichitself was positioned within the environmentalchamber. The chamber was maintained at 238 Cand 60% RH and the bath was set to give a con-stant temperature of 158 C. Four vapour pressure
Weighing Machine
VapourPressureRegulator
Cup
Sample
VapourFlow
pv2, T
pv1, T
EnvironmentalChamber
Fig. 1. Standard permeability test method.
Table 1. Isothermal test conditions and results
Test material Vapour pressureregulator
Cup RH(%)at 238 C
Chamber RH(%)at 238 C
Measured averagepermeabilitykgm=N s 3 10¡12
Standard deviationkgm=N s 3 10¡12
Particle board Desiccant 3 60 3.66 0.10NH4Cl 79 60 3.89 0.27NH4H2PO4 93 60 5.59 0.22Water 100 60 6.43 0.37
Polystyrene Desiccant 3 50 2.28 0.42NH4Cl 79 60 2.11 0.31NH4H2PO4 93 60 2.50 0.39Water 100 60 2.12 0.29
Table 2. Calculated permeability coef� cients
Test material Permeability coef� cients
A 3 10¡12 B 3 10¡12 C
Particle board 3.55 12.0 8.91Polystyrene 2.28 0.00 1.00
Cup mounting plate
Tem
pera
ture
Con
trol
ler
FanTo andfromChiller
ThermalBath
Bath Fluid
Fig. 2. Nonisothermal test arrangement.
332
GALBRAITH ET AL.D
ownl
oade
d by
[T
he U
nive
rsity
of
Man
ches
ter
Lib
rary
] at
06:
07 0
8 D
ecem
ber
2014
regulators were used with the particle board(desiccant and saturated solutions of calciumchloride, potassium carbonate and sodium chlor-ide) and three with the insulation, as shown inTable 3. Seven test cups were used at each testcondition. One of these was a cup instrumentedwith thermocouples which enabled the tempera-tures of the sample surfaces and the regulator tobe continuously monitored during the test.
Test results
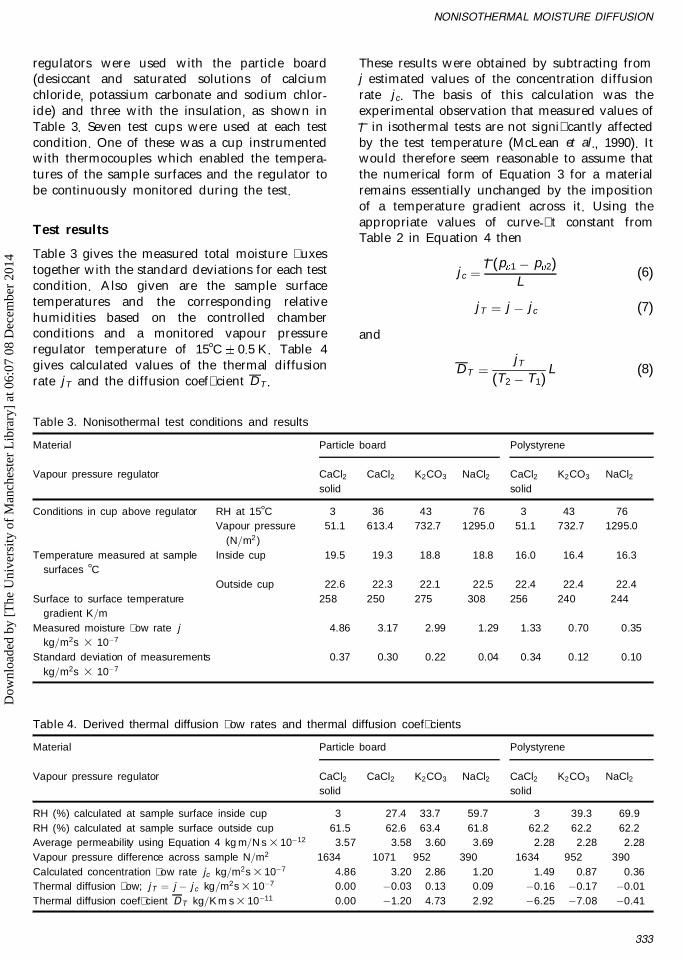
Table 3 gives the measured total moisture �uxestogether with the standard deviations for each testcondition. Also given are the sample surfacetemperatures and the corresponding relativehumidities based on the controlled chamberconditions and a monitored vapour pressureregulator temperature of 158 C 0:5 K. Table 4gives calculated values of the thermal diffusionrate jT and the diffusion coef�cient DT.
These results were obtained by subtracting fromj estimated values of the concentration diffusionrate jc. The basis of this calculation was theexperimental observation that measured values ofl in isothermal tests are not signi�cantly affectedby the test temperature (McLean et al., 1990). Itwould therefore seem reasonable to assume thatthe numerical form of Equation 3 for a materialremains essentially unchanged by the impositionof a temperature gradient across it. Using theappropriate values of curve-�t constant fromTable 2 in Equation 4 then
jc ˆl (p 1 ¡ p 2)
L(6)
jT ˆ j ¡ jc (7)
and
DT ˆjT
(T2 ¡ T1)L (8)
Table 3. Nonisothermal test conditions and results
Material Particle board Polystyrene
Vapour pressure regulator CaCl2solid
CaCl2 K2CO3 NaCl2 CaCl2solid
K2CO3 NaCl2
Conditions in cup above regulator RH at 158 C 3 36 43 76 3 43 76Vapour pressure
(N=m2)51.1 613.4 732.7 1295.0 51.1 732.7 1295.0
Temperature measured at samplesurfaces 8 C
Inside cup 19.5 19.3 18.8 18.8 16.0 16.4 16.3
Outside cup 22.6 22.3 22.1 22.5 22.4 22.4 22.4Surface to surface temperature
gradient K=m258 250 275 308 256 240 244
Measured moisture � ow rate jkg=m2s 3 10¡7
4.86 3.17 2.99 1.29 1.33 0.70 0.35
Standard deviation of measurementskg=m2s 3 10¡7
0.37 0.30 0.22 0.04 0.34 0.12 0.10
Table 4. Derived thermal diffusion � ow rates and thermal diffusion coef� cients
Material Particle board Polystyrene
Vapour pressure regulator CaCl2solid
CaCl2 K2CO3 NaCl2 CaCl2solid
K2CO3 NaCl2
RH (%) calculated at sample surface inside cup 3 27.4 33.7 59.7 3 39.3 69.9RH (%) calculated at sample surface outside cup 61.5 62.6 63.4 61.8 62.2 62.2 62.2Average permeability using Equation 4 kg m=N s 3 10¡12 3.57 3.58 3.60 3.69 2.28 2.28 2.28Vapour pressure difference across sample N=m2 1634 1071 952 390 1634 952 390Calculated concentration �ow rate jc kg=m2s 3 10¡7 4.86 3.20 2.86 1.20 1.49 0.87 0.36Thermal diffusion � ow; jT ˆ j ¡ j c kg=m2s 3 10¡7 0.00 ¡0.03 0.13 0.09 ¡0.16 ¡0.17 ¡0.01Thermal diffusion coef� cient DT kg=K m s 3 10¡11 0.00 ¡1.20 4.73 2.92 ¡6.25 ¡7.08 ¡0.41
333
NONISOTHERMAL MOISTURE DIFFUSIOND
ownl
oade
d by
[T
he U
nive
rsity
of
Man
ches
ter
Lib
rary
] at
06:
07 0
8 D
ecem
ber
2014
Observations
The results of Table 4 show that for the particleboard the estimated thermal diffusion rates are inall cases extremely small. The largest is indicatedas only about 5% of the total moisture �ux whichis considerably less than the standard deviation ofthe measurements of j. In addition, no de�nitetrend is obvious in that the sign of jT is notconstant. Consequently, these results would seemto provide no evidence of any signi�cant thermaldiffusion effect.
For the polystyrene jT has a consistent sign andit constitutes a greater percentage of the totalmoisture �ux. However, only at one of the testconditions does its magnitude exceed the stan-dard deviation of j. Thus, although the experi-mental results appear to be of greater signi�cancein this case, they again cannot be regarded asproviding any substantive evidence of a measur-able thermal diffusion �ux.
A point worth noting here is that, although thetemperature differences across the particle boardand insulation are small, the resulting tempera-ture gradients are of the order of magnitude tobe expected within a typical wall construction.However, it is important to note that in theseexperiments the temperature gradients across thesamples for each measurement condition werealmost the same. This precluded any directanalysis being made of the effect of increasingtemperature gradient on the measured moisture�ux. This particular method of investigationcould not be adapted easily to generate differenttemperature gradients across the samples. It wastherefore concluded that to achieve this analternative approach was required. It was alsodecided that future experiments under varyingtemperature gradients should be carried outusing relatively non-hygroscopic materials withinthe low humidity region. In this way the resultsanalysis could be simpli�ed by assuming a �xedconstant value of isothermal permeability.
The follow-up investigation
Test apparatus
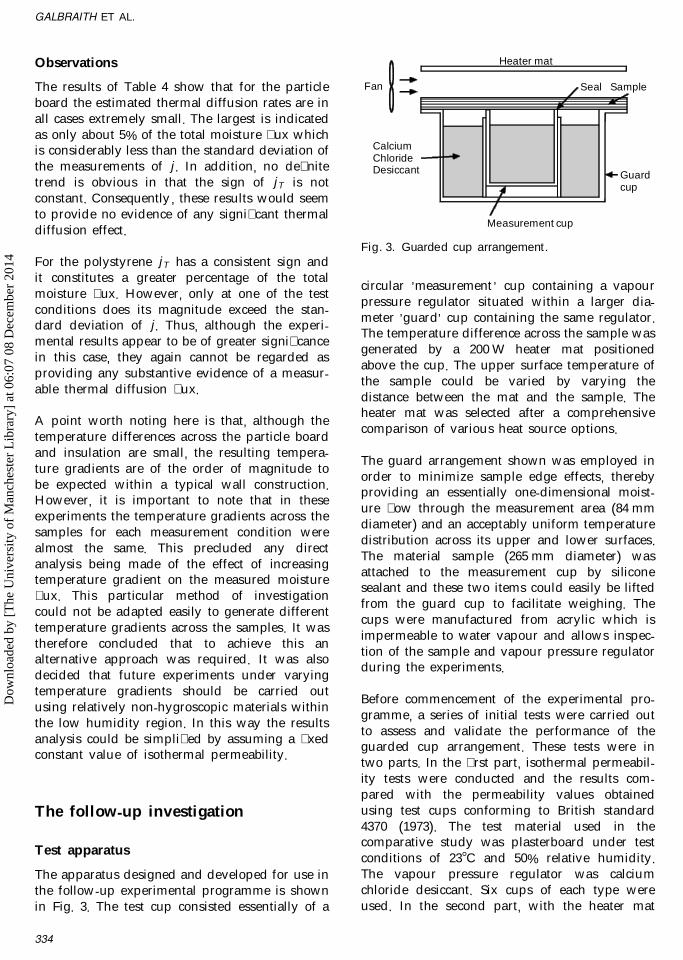
The apparatus designed and developed for use inthe follow-up experimental programme is shownin Fig. 3. The test cup consisted essentially of a
circular ’measurement ’ cup containing a vapourpressure regulator situated within a larger dia-meter ’guard’ cup containing the same regulator.The temperature difference across the sample wasgenerated by a 200 W heater mat positionedabove the cup. The upper surface temperature ofthe sample could be varied by varying thedistance between the mat and the sample. Theheater mat was selected after a comprehensivecomparison of various heat source options.
The guard arrangement shown was employed inorder to minimize sample edge effects, therebyproviding an essentially one-dimensional moist-ure �ow through the measurement area (84 mmdiameter) and an acceptably uniform temperaturedistribution across its upper and lower surfaces.The material sample (265 mm diameter) wasattached to the measurement cup by siliconesealant and these two items could easily be liftedfrom the guard cup to facilitate weighing. Thecups were manufactured from acrylic which isimpermeable to water vapour and allows inspec-tion of the sample and vapour pressure regulatorduring the experiments.
Before commencement of the experimental pro-gramme, a series of initial tests were carried outto assess and validate the performance of theguarded cup arrangement. These tests were intwo parts. In the �rst part, isothermal permeabil-ity tests were conducted and the results com-pared with the permeability values obtainedusing test cups conforming to British standard4370 (1973). The test material used in thecomparative study was plasterboard under testconditions of 23 8 C and 50% relative humidity.The vapour pressure regulator was calciumchloride desiccant. Six cups of each type wereused. In the second part, with the heater mat
Heater mat
Seal Sample
Guardcup
Measurement cup
Fan
CalciumChlorideDesiccant
Fig. 3. Guarded cup arrangement.
334
GALBRAITH ET AL.D
ownl
oade
d by
[T
he U
nive
rsity
of
Man
ches
ter
Lib
rary
] at
06:
07 0
8 D
ecem
ber
2014
operating, the temperature distribution across theupper and lower surfaces of the measurementarea was observed using, in each case, an arrayof thermocouples. Again the test material wasplasterboard.
It was found that the guarded cup arrangementperformed reasonably satisfactorily in both setsof tests. First, in the isothermal tests, thedifference between the average permeabilityobtained and the British Standard cup valuewas only 3%. This is well within the expectedrange of variation for permeability measurements(Galbraith et al., 1992). Second, for a typicaltemperature difference through the sample ofsome 12 K, the temperature variation across thesample measurement area was of the order of2 K. While a more uniform temperature distribu-tion would have been preferred, this result wasconsidered acceptable and probably representsthe optimum obtainable using an external radiat-ing heat source arrangement.
Experimental programme
The experimental programme was in two parts:
(i) Isothermal tests to establish the depen-dence of l on test temperature andhumidity.
(ii) Nonisothermal tests to establish the sig-ni�cance of jT and the correspondingvalues of DT.
Two materials were tested: 19.5 mm thick plaster-board and 25 mm thick extruded polystyreneinsulation. The guarded cup arrangement wasused with calcium chloride desiccant as thevapour pressure regulator, corresponding to arelative humidity within the cup of 3% (Changand Hutcheon, 1953). All the material sampleswere preconditioned at 208 C, 50% RH and theirdensities determined. Sample selection ensuredthat the density of each sample used in the testswas within 2.5% of the mean density of all thesamples.
Isothermal tests
The isothermal tests were conducted within a’walk-in’ environmental chamber where the con-ditions could be controlled to within 0.5 K and
1% RH. The chamber conditions under whichthe various tests were conducted are given inTable 5. In any given test, six test cups were used.
The vapour transfer rate was obtained by weigh-ing each measurement cup (with attached sample)at regular intervals. The average permeability wasthen calculated from Equation 6.
Nonisothermal tests
For these tests the apparatus consisted of sixguarded cups with a heater mat positioned aboveeach cup. The tests were conducted within theenvironmental chamber where the conditionswere maintained at 208 C and 50% RH. Again,the vapour transfer rates were obtained byweighing the measurement cups at regular inter-vals. In each case one of the cups was instru-mented with thermocouples to monitor thetemperature difference across the samples. Va-pour transfer rates were determined for threeseparate temperature differences, correspondingto three different heater mat positions.
Test resultsIsothermal tests
The mean permeability values with the associatedstandard deviations for each chamber conditionare given in Tables 6 and 7. Table 6 presents the
Table 5. Isothermal experimental test conditions
Chamber relative humidity Chamber temperature(% RH) ( 8 C)
36 2050 2050 42
Table 6. Mean permeability results at a temperatureof 20 8 C (kg m=N s 3 10¡11)
Material Chamber relative humidity
36% 50% RH
Plasterboard 3.18 0.111 3.08 0.0719Insulation 0.166 0.0238 0.169 0.0074
Table 7. Mean permeability results at a relativehumidity of 50% RH (kg m=N s 3 10¡11)
Material Chamber temperature
208 C 42 8 C
Plasterboard 3.08 0.0719 2.94 0.0348Insulation 0.169 0.0074 0.169 0.0079
335
NONISOTHERMAL MOISTURE DIFFUSIOND
ownl
oade
d by
[T
he U
nive
rsity
of
Man
ches
ter
Lib
rary
] at
06:
07 0
8 D
ecem
ber
2014

data for a constant temperature of 208 C, whilstTable 7 presents the data for a constant relativehumidity of 50% RH.
For the insulation, the measured average perme-abilities are remarkably consistent over the testrange of temperature and humidity. The resultsfor the plasterboard show a greater dispersion,with a variation of the order of 7%. However,such a variation must be viewed as beingrelatively small when it is known that isothermalpermeability tests on nominally identical materi-als under the same test conditions sometimesdisplay variations considerably greater than this(Galbraith et al., 1992). It would therefore seemreasonable to assume that, for the purposes ofthis investigation, the permeability of both theinsulation and plasterboard are effectively con-stant over the range of test conditions.
Nonisothermal tests
The measured moisture �ow rates for eachmaterial, together with their standard deviations,are given in Table 8 for the three differenttemperature differences generated. It should benoted that the experiments were carried out withthe vapour pressure difference across the samplesmaintained at a constant value of 1098 N=m2. Thismeans that if the differential permeability isassumed to be a constant, as discussed above,the moisture transport as a result of the vapourpressure gradient, jc, will also be constant.Consequently , any observed variations in themeasured moisture �ow rate are likely to berelated to the imposed temperature gradient.
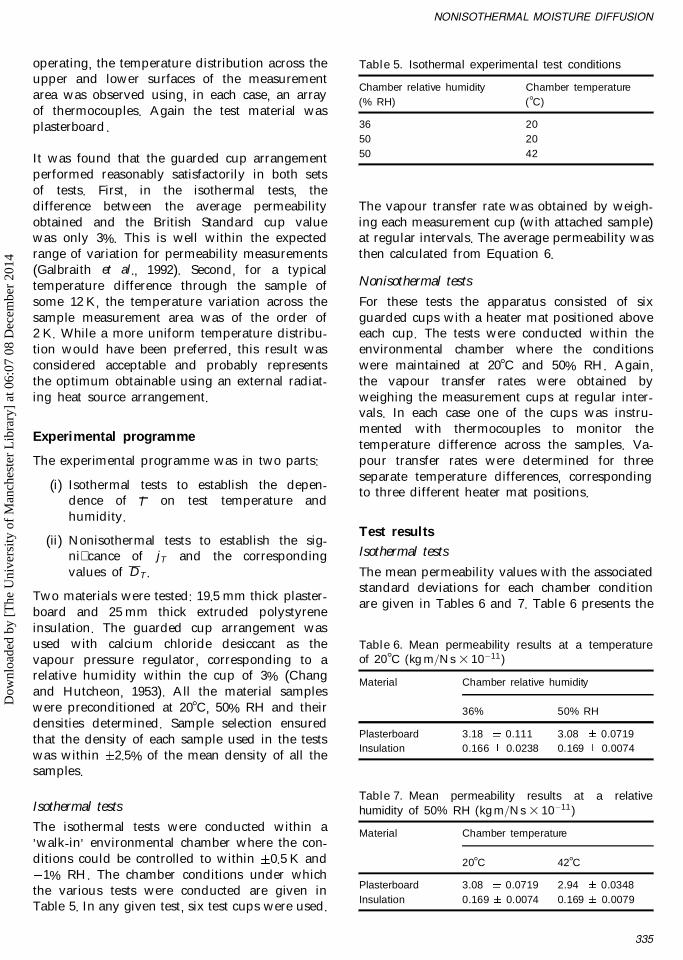
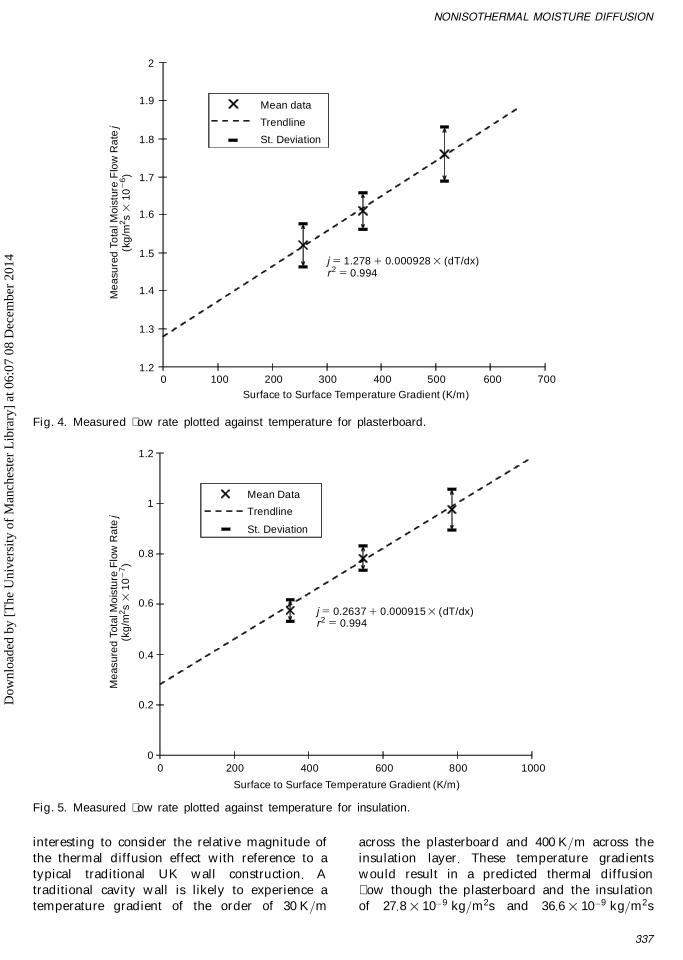
In order to investigate the signi�cance of theseresults, the mean measured moisture �ow ratesand their associated standard deviations havebeen plotted against temperature gradient in Figs4 and 5 for the plasterboard and insulationrespectively. In these �gures the mean measure-ment data have been �tted with a linearregression trendline to identify any possible
correlation which may exist between these twovariables.
Observations
Figures 4 and 5 clearly illustrate a direct relation-ship between the measured total moisture �uxand the imposed temperature gradient for boththe plasterboard and the insulation. This suggeststhat a measurable thermal diffusion effect doesexist for both materials. The gradients of thetrendlines in Figs 4 and 5 give estimated thermaldifffusion coef�cients of 92:8 3 10¡11 kg=K m s forthe plasterboard and 9:15 3 10¡11 kg=K m s for theinsulation. It is important to appreciate, however,that these coef�cients must be considered asapproximate estimates only, as a regression linebased on three temperature differences may notbe reliable, especially considering the uncertaintyassociated with such measurements. Additionalmeasurement data are needed to con�rm theirmagnitude.
It is also important to note the predicted valuesof moisture �ow rate at zero temperaturegradient taken from the �tted trendlines. Thesevalues lead to predicted isothermal permeabilityvalues of 0:0600 3 10¡11 kg m=N s for the insula-tion and 2:27 3 10¡11 kg m=N s for the plaster-board. These can be compared with the averagedmeasured isothermal values of 0:168 3 10¡11 and3:07 3 10¡11 kg m=N s obtained from Tables 6 and7. The results for plasterboard show a reasonableagreement, with the difference being within therange of tolerances which are possible for mea-surements of this nature. For the insulation thedifference is much larger and does cast somedoubt on the reliability of the trendline obtained.This further con�rms the dif�culty of reachingreliable conclusions from a trendline obtainedfrom measurements covering only three differenttemperature gradients.
Notwithstanding the above reservation, it is
Table 8. Nonisothermal test results
Material Plasterboard Insulation
Surface to surface temperature difference (K) 10.06 7.15 5 19.64 13.64 8.75Surface to surface temperature gradient (K=m) 516 366 256 786 546 350Mean measured total moisture � ow rate j (kg=m2s 3 10¡6) 1.76 1.61 1.52 0.0975 0.0782 0.0574Standard deviation of measurements (kg=m2s 3 10¡6) 0.0711 0.048 0.057 0.0081 0.0048 0.0061
336
GALBRAITH ET AL.D
ownl
oade
d by
[T
he U
nive
rsity
of
Man
ches
ter
Lib
rary
] at
06:
07 0
8 D
ecem
ber
2014
interesting to consider the relative magnitude ofthe thermal diffusion effect with reference to atypical traditional UK wall construction. Atraditional cavity wall is likely to experience atemperature gradient of the order of 30 K=m
across the plasterboard and 400 K=m across theinsulation layer. These temperature gradientswould result in a predicted thermal diffusion�ow though the plasterboard and the insulationof 27:8 3 10¡9 kg=m2s and 36:6 3 10¡9 kg=m2s
j 5 1.278 1 0.000928 3 (dT/dx)r2 5 0.994
Surface to Surface Temperature Gradient (K/m)
Mea
sure
d To
tal M
oist
ure
Flo
w R
ate
j(k
g/m
2 s 3
102
6)
2
1.9
1.8
1.7
1.6
1.5
1.4
1.3
1.2
Mean data
Trendline
St. Deviation
100 200 300 400 500 600 7000
Fig. 4. Measured �ow rate plotted against temperature for plasterboard.
1.2
1
0.8
0.6
0.4
0.2
00 200 400 600 800 1000
Surface to Surface Temperature Gradient (K/m)
Mea
sure
d To
tal M
oist
ure
Flo
w R
ate
j(k
g/m
2 s 3
102
7)
Mean Data
Trendline
St. Deviation
j 5 0.2637 1 0.000915 3 (dT/dx)r2 5 0.994
Fig. 5. Measured �ow rate plotted against temperature for insulation.
337
NONISOTHERMAL MOISTURE DIFFUSIOND
ownl
oade
d by
[T
he U
nive
rsity
of
Man
ches
ter
Lib
rary
] at
06:
07 0
8 D
ecem
ber
2014
respectively. These thermal diffusion �ow rates,when compared with a typical concentration-driven moisture �ow rate through such a con-struction of 50 3 10¡9 kg=m2s, indicate that ther-mal diffusion effects could result in a verysigni�cant increase in predicted moisture �ows.
Conclusions
Little reliable experimental information is avail-able on the effect and magnitude of the thermaldiffusion of moisture within building materials.Current computer prediction methods assumethat such effects are negligible without a clearbody of supporting evidence. The lack of suchmeasurement data is to a large extent related tothe dif�cult nature of such experiments and theabsence of any reliable and accepted experimentalapproach.
The results of two separate measurement ap-proaches have been presented in which anattempt was made to quantify the importanceof thermal moisture diffusion.
The �rst method involved measurements usingparticle board and polystyrene within a heatedwater bath arrangement. The results obtained didnot provide any substantive evidence of ameasurable thermal diffusion �ux. The experi-mental arrangement enabled only one tempera-ture difference to be investigated and themeasurement procedure was elaborate and notconducive to a large number of measurements.
The second approach involved the use of aradiant heat source to provide the temperaturedifference and it was possible to obtain data forthree different temperature differences across thesamples. This method was applied using plaster-board and insulation as the test materials andproduced clear evidence of a relationship be-tween moisture �ux and temperature difference.An evaluation of the magnitude of this effectsuggests that it is of the same order as thevapour pressure driven �ux and therefore maybe of signi�cance. The dif�culty of these meas-urements and the limited number of data pointsmeans that the reliability of the calculated valuesfor the thermal diffusion coef�cient was not high.
The two techniques adopted both involved smallsample measurements carried out using a stan-
dard gravimetric cup approach. This method ofmeasurement has a number of limitations whenapplied to non-isothermal investigations:
d measured results from small samples arehighly sensitive to variations in materialstructure;
d obtaining an even temperature distributionacross a small sample area is dif�cult withedge effects having a signi�cant in�uence;
d the physical arrangements for such experi-ments are dif�cult especially when trying toobtain a range of surface to surface tempera-ture differences;
d the possible range of relative humidity andtemperature differences across the samples islimited.
The evidence from the above study suggests thatthe investigation and evaluation of thermalmoisture diffusion is an important area ofresearch, the results of which may have a signi�-cant impact on the currently accepted moistureprediction methods in the UK and Internationally.The investigation of these effects clearly requires apurpose-built experimental facility which over-comes the limitations of the small sample meas-urements carried out to date and which can beused to produce reliable nonisothermal measure-ment data.
Glasgow Caledonian University and StrathclydeUniversity are at present developing such alarge-sample test facility as part of an EPSRCfunded research project. This facility is currentlybeing commissioned and involves the use of aguarded arrangement in which the sample sizewill be 0:8 m 3 0:8 m with a measurement area of0.25 m2. It is anticipated that results from mea-surements using this facility will be availablewithin the next six months and will allow moredetailed and reliable information on thermallydriven moisture transport to be available.
References
British Standard 4370 (1973) Methods of Test for RigidCellular Materials. British Standards Institution,London.
Chang, S.C. and Hutcheon, N.B. (1953) Performance ofdesiccants in the dry pan test for water vapourpermeance of membranes. Canadian Journal Tech-nology, 13(1), 31.
338
GALBRAITH ET AL.D
ownl
oade
d by
[T
he U
nive
rsity
of
Man
ches
ter
Lib
rary
] at
06:
07 0
8 D
ecem
ber
2014
Chartered Institution of Building Services Engineers(1986) Guide Book A10, Moisture Transfer 222Balham High Road, London.
Galbraith, G.H. (1992) Heat and mass transfer withinporous building materials. PhD. Thesis. Universityof Strathclyde.
Galbraith, G.H. and McLean, R.C. (1995) Nonisothermaleffects and their signi�cance for modelling moist-ure transfer through building materials. Interna-tional Symposium on Moisture Problems inBuilding Walls, Porto. 11 13 September, (eds. V.P.de Freitas and V. Abrantes), CIB, pp 435 44.
Galbraith, G.H. and McLean, R.C. (1997) The selectionof appropriate �ow potentials for moisture trans-port models. Fifth International IBPSA Conference,Prague, 8 10 September (eds J. Spitler and J.Henson) IBPSA, 2, 351 4.
Galbraith, G.H., McLean, R.C., Tao, Z. and Kang, N.(1992) The comparability of water vapour per-meability measurements. Building Research & In-formation, 20(6), 364 72.
Galbraith, G.H., Tao, Z. and McLean, R.C. (1993)Separation of moisture �ow through porous ma-
terials into vapour and liquid components. BuildingServices Engineering Research & Technology A, 14(3),107 113.
Galbraith, G.H., McLean, R.C. and Kelly, D. (1997)Moisture permeability measurements under vary-ing barometric pressure. Building Research &Information, 25(6), 348 53.
Galbraith, G.H., McLean, R.C. and Guo, J. (1998a)Moisture permeablilty data: mathematical presenta-tion. Building Services Engineering Research & Tech-nology, 19(1), 31 36.
Galbraith, G.H., McLean, R.C. and Guo, J. (1998b)Moisture permeability data presented as a mathe-matical relationship. Building Research & Informa-tion, 26(1), 1 12.
Kumaren, M.K. (1987) Moisture transport throughglass-�bre insulation in the presence of a ther-mal gradient. Journal of Thermal Insulation, 10(1),243 55.
McLean, R.C., Galbraith, G.H. and Sanders, C.H. (1990).Moisture transmission testing of building materialsand the presentation of vapour permeabilityvalves. Building Research & Practice, 18(2), 82 91.
339
NONISOTHERMAL MOISTURE DIFFUSIOND
ownl
oade
d by
[T
he U
nive
rsity
of
Man
ches
ter
Lib
rary
] at
06:
07 0
8 D
ecem
ber
2014